Embed Size (px)
Citation preview

Investor Presentation June 2015
Cautionary Statement Regarding Forward-Looking Statements
The statements contained in this presentation include certain forward-looking statements that are based largely on our current expectations and reflect various estimates and assumptions by us. Forward-looking statements are subject to certain risks, trends and uncertainties that could cause actual results and achievements to differ materially from those expressed in such forward-looking statements. Such risks, trends and uncertainties, which in some instances are beyond our control, are described under the heading “Risk Factors” in Tribune Publishing Company’s filings with the Securities and Exchange Commission, and include:
competition and other economic conditions including fragmentation of the media landscape and competition from other media alternatives; changes in advertising demand, circulation levels and audience shares; our ability to develop and grow our online businesses; our reliance on revenue from printing and distributing third-party publications; changes in newsprint prices; macroeconomic trends and conditions; our reliance on third party vendors for various services; our ability to adapt to technological changes; adverse results from litigation, governmental investigations or tax-related proceedings or audits; our ability to realize benefits or synergies from acquisitions or divestitures or to operate our businesses effectively following acquisitions or divestitures; our ability to attract and retain employees; our ability to satisfy pension and other postretirement employee benefit obligations; changes in accounting standards; the effect of labor strikes, lock-outs and labor negotiations; regulatory and judicial rulings; our indebtedness and ability to comply with covenants applicable to our debt financing; our adoption of fresh-start reporting which has caused our combined financial statements for periods subsequent to December 31, 2012 to not be comparable
to prior periods; our ability to satisfy future capital and liquidity requirements; and our ability to access the credit and capital markets at the times and in the amounts needed and on acceptable terms.
The words “believe,” “expect,” “anticipate,” “estimate,” “could,” “should,” “intend,” “may,” “plan,” “seek” and similar expressions generally identify forward-looking statements. Whether or not any such forward-looking statements are in fact achieved will depend on future events, some of which are beyond our control. You are cautioned not to place undue reliance on such forward-looking statements, which are being made as of the date of this presentation. We undertake no obligation to update any forward-looking statements, whether as a result of new information, future events or otherwise, except as required by law.
2
Non-GAAP Financial Measures
To provide investors with additional information regarding Tribune Publishing Company‘s (“Tribune Publishing” or “Company”) financial results, this presentation includes references to Adjusted EBITDA and Pro forma Adjusted EBITDA. These measures are not presented in accordance with generally accepted accounting principles in the United States (GAAP), and Tribune Publishing’s use of these terms may vary from that of others in the Company’s industry. These measures should not be considered as an alternative to net income (loss), operating profit, revenues or any other performance measures derived in accordance with GAAP as measures of operating performance or liquidity. Further information regarding the Company’s presentation of these measures, including a reconciliation to net income, the most directly comparable GAAP financial measure, is included in this presentation.
Adjusted EBITDA Adjusted EBITDA is defined as net income before income taxes, interest income, interest expense, depreciation and amortization, income and losses from equity investments, corporate management fee from Tribune Media Company (“Tribune Media”), pension credits, stock-based compensation, certain unusual and non-recurring items (including spin-related costs) and reorganization items. The Company's management uses Adjusted EBITDA (a) as a measure of operating performance; (b) for planning and forecasting in future periods; and (c) in communications with the Company’s Board of Directors concerning the Company’s financial performance. Management believes the presentation of Adjusted EBITDA enhances investors’ overall understanding of the financial performance of the Company’s business as a stand-alone company. In addition, Adjusted EBITDA, or a similarly calculated measure, is used as the basis for certain financial maintenance covenants that the Company is subject to in connection with certain credit facilities. Since not all companies use identical calculations, the Company's presentation of Adjusted EBITDA may not be comparable to other similarly titled measures of other companies and should not be used by investors as a substitute or alternative to net income or any measure of financial performance calculated and presented in accordance with GAAP. Instead, management believes Adjusted EBITDA should be used to supplement the Company’s financial measures derived in accordance with GAAP to provide a more complete understanding of the trends affecting the business.
Although Adjusted EBITDA is frequently used by investors and securities analysts in their evaluations of companies, Adjusted EBITDA has limitations as an analytical tool, and investors should not consider it in isolation or as a substitute for, or more meaningful than, amounts determined in accordance with GAAP. Some of the limitations to using non-GAAP measures as an analytical tool are: they do not reflect the Company’s interest income and expense, or the requirements necessary to service interest or principal payments on the Company’s debt; they do not reflect future requirements for capital expenditures or contractual commitments; and although depreciation and amortization charges are non-cash charges, the assets being depreciated and amortized will often have to be replaced in the future, and non-GAAP measures do not reflect any cash requirements for such replacements.
Pro forma Adjusted EBITDA Pro forma Adjusted EBITDA is defined as Adjusted EBITDA after taking into consideration rental expenses and public company costs expected to be incurred post-spin, and reductions for partial economics on reasonable-case modified affiliate agreements for digital products, including CareerBuilder.com and Cars.com. Management believes the presentation of Pro forma Adjusted EBITDA enhances investors’ overall understanding of the financial performance of the Company’s business as a stand-alone company and includes elements used as the basis for forecasting going forward. Management believes this measure improves the understanding and comparability of future results by providing quantitative estimates for historical periods presented.
3

Company Highlights and Strategy
4
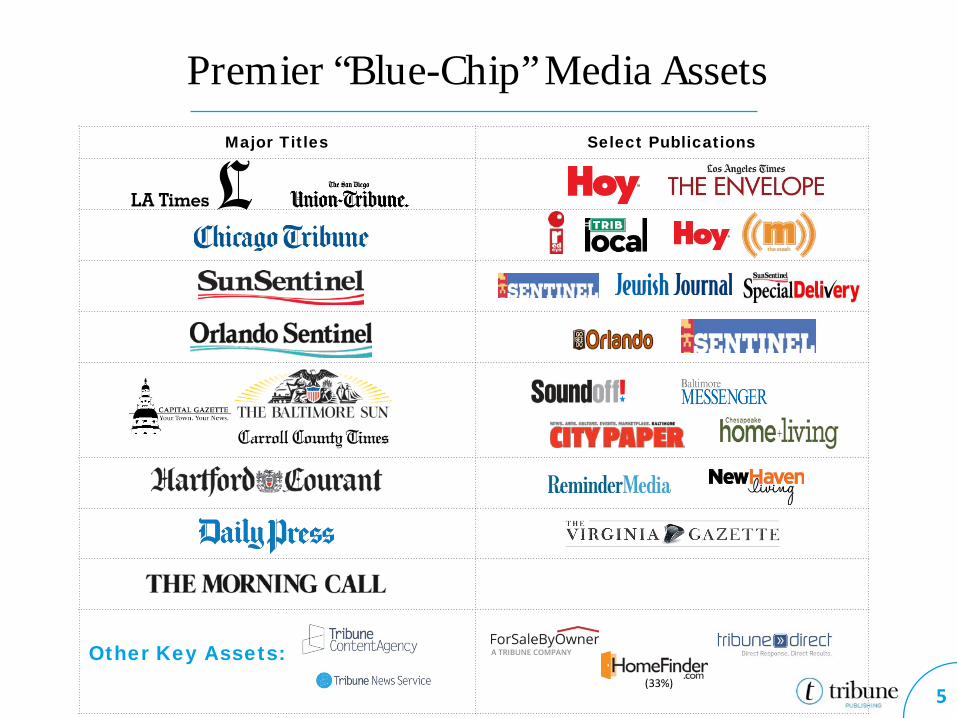
Major Titles Select Publications
Other Key Assets:
Premier “Blue-Chip” Media Assets
(33%) 5
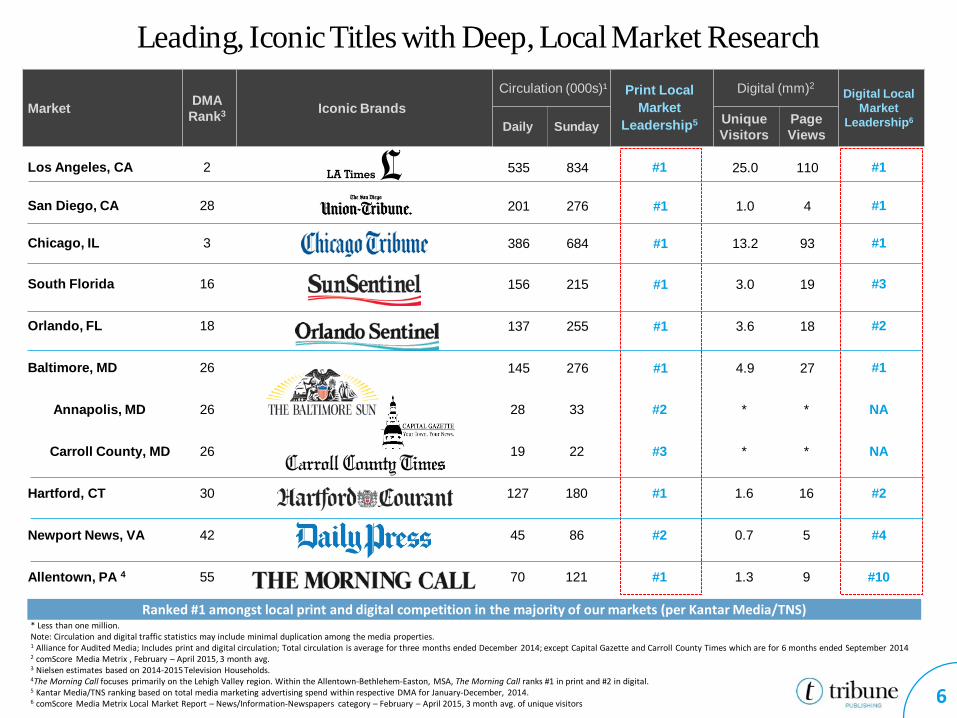
* Less than one million. Note: Circulation and digital traffic statistics may include minimal duplication among the media properties. 1 Alliance for Audited Media; Includes print and digital circulation; Total circulation is average for three months ended December 2014; except Capital Gazette and Carroll County Times which are for 6 months ended September 2014 2 comScore Media Metrix , February – April 2015, 3 month avg. 3 Nielsen estimates based on 2014-2015 Television Households. 4The Morning Call focuses primarily on the Lehigh Valley region. Within the Allentown-Bethlehem-Easton, MSA, The Morning Call ranks #1 in print and #2 in digital. 5 Kantar Media/TNS ranking based on total media marketing advertising spend within respective DMA for January-December, 2014. 6 comScore Media Metrix Local Market Report – News/Information-Newspapers category – February – April 2015, 3 month avg. of unique visitors
Market DMA Rank3 Iconic Brands
Circulation (000s)¹ Print Local Market
Leadership5
Digital (mm)2 Digital Local
Market Leadership6 Daily Sunday Unique
Visitors Page Views
Los Angeles, CA 2 535 834 #1 25.0 110 #1
San Diego, CA 28 201 276 #1 1.0 4 #1
Chicago, IL 3 386 684 #1 13.2 93 #1
South Florida 16 156 215 #1 3.0 19 #3
Orlando, FL 18 137 255 #1 3.6 18 #2
Baltimore, MD 26 145 276 #1 4.9 27 #1
Annapolis, MD 26 28 33 #2 * * NA
Carroll County, MD 26 19 22 #3 * * NA
Hartford, CT 30 127 180 #1 1.6 16 #2
Newport News, VA 42 45 86 #2 0.7 5 #4
Allentown, PA 4 55 70 121 #1 1.3 9 #10
Leading, Iconic Titles with Deep, Local Market Research
Ranked #1 amongst local print and digital competition in the majority of our markets (per Kantar Media/TNS)
6

Trusted, Award-Winning Premium Content
Our content makes us the local print and digital leader in the communities we serve
Local news and information brands that are vital to the communities they serve
Average publishing history of over 150 years A tradition of journalistic excellence: 90 total
Pulitzer Prizes, 29 since 2000
2015 Pulitzer Prize, Feature Writing Los Angeles Times staff writer Diana Marcum won the feature writing prize for her narrative portraits of farmers, fieldworkers and other Californians in drought-stricken towns in the Central Valley.
7
Tribune Publishing’s Leadership
8
Tony Hunter, CEO of Chicago Tribune Media Group – leading Chicago Tribune Media Group along with leveraging core competencies by providing a portfolio of services to other publishers throughout the industry with Tribune Publishing Business Services
Austin Beutner, CEO of California News Group – leading the newly organized California News Group which includes the LA Times and the announced acquisition of San Diego Union-Tribune
Michael Rooney, Chief Revenue Officer – leading the re-build of the national sales organization, integrating the national digital and print teams, and increasing custom content offerings
Denise Warren, President of Digital / CEO of East Coast Publishing (anticipated 6/15/15 start date) – accelerating transition to digital, all digital initiatives including audience development, analytics, advertising operations, digital circulation, marketing services and business development along with overseeing the East Coast publishing
Sandy Martin, Chief Financial Officer – leading the zero-based budget initiatives,
cost reductions from centralized procurement, and strategic sourcing initiatives
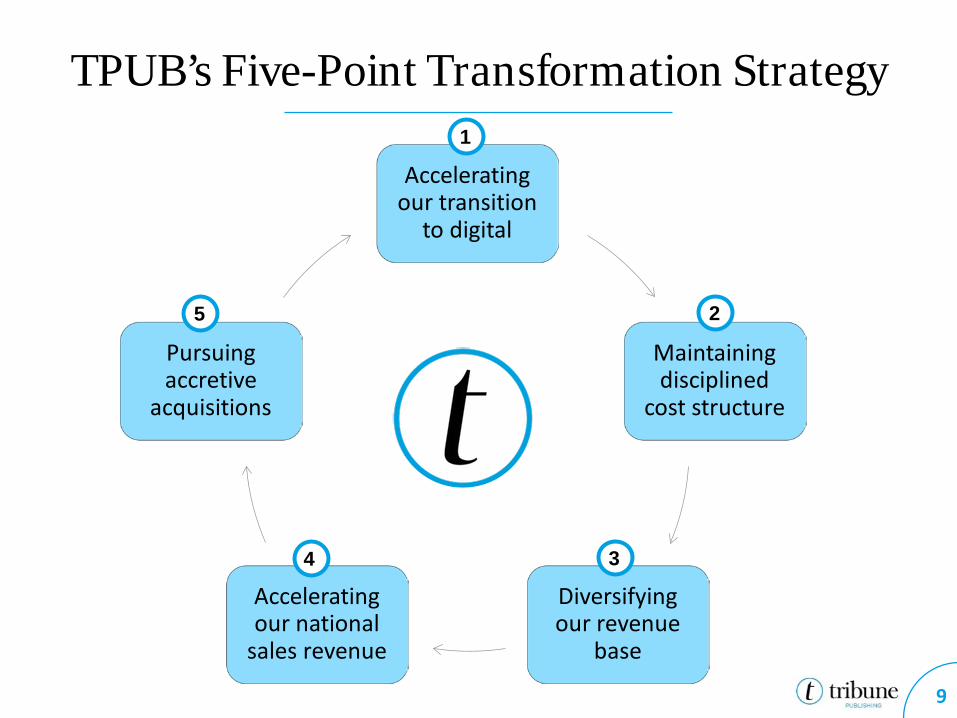
TPUB’s Five-Point Transformation Strategy
Accelerating our transition
to digital
Maintaining disciplined
cost structure
Diversifying our revenue
base
Accelerating our national
sales revenue
Pursuing accretive
acquisitions
9
1
2
3 4
5
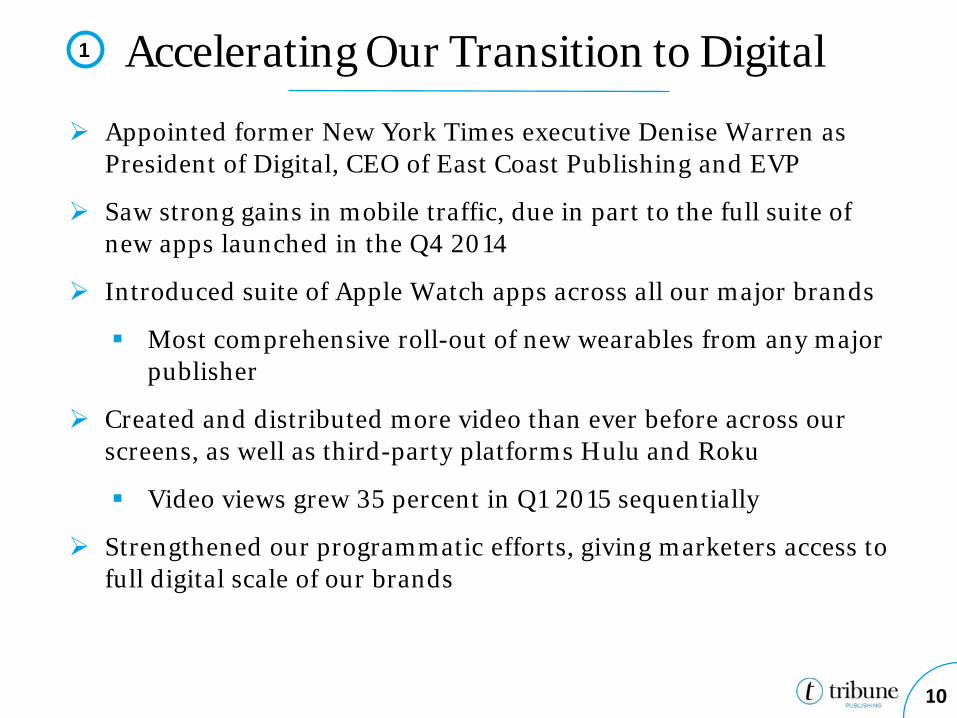
Accelerating Our Transition to Digital
Appointed former New York Times executive Denise Warren as President of Digital, CEO of East Coast Publishing and EVP
Saw strong gains in mobile traffic, due in part to the full suite of new apps launched in the Q4 2014
Introduced suite of Apple Watch apps across all our major brands
Most comprehensive roll-out of new wearables from any major publisher
Created and distributed more video than ever before across our screens, as well as third-party platforms Hulu and Roku
Video views grew 35 percent in Q1 2015 sequentially
Strengthened our programmatic efforts, giving marketers access to full digital scale of our brands
10
1
Maintaining Disciplined Cost Structure
11
2
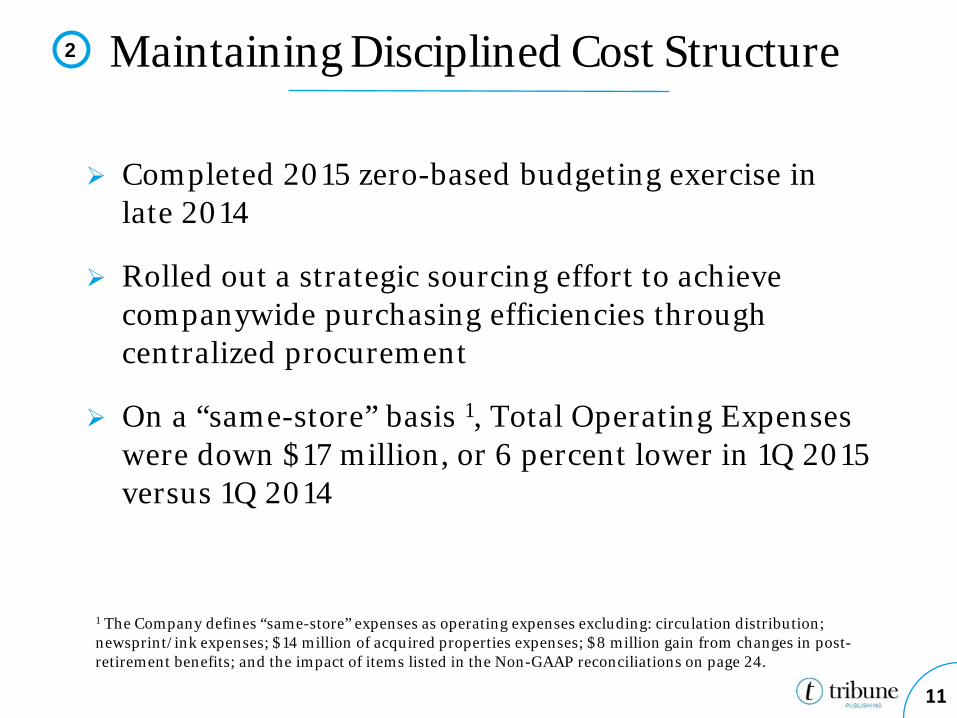
Completed 2015 zero-based budgeting exercise in late 2014
Rolled out a strategic sourcing effort to achieve companywide purchasing efficiencies through centralized procurement
On a “same-store” basis 1, Total Operating Expenses were down $17 million, or 6 percent lower in 1Q 2015 versus 1Q 2014
1 The Company defines “same-store” expenses as operating expenses excluding: circulation distribution; newsprint/ink expenses; $14 million of acquired properties expenses; $8 million gain from changes in post-retirement benefits; and the impact of items listed in the Non-GAAP reconciliations on page 24.
Diversifying Our Revenue Base
12
3
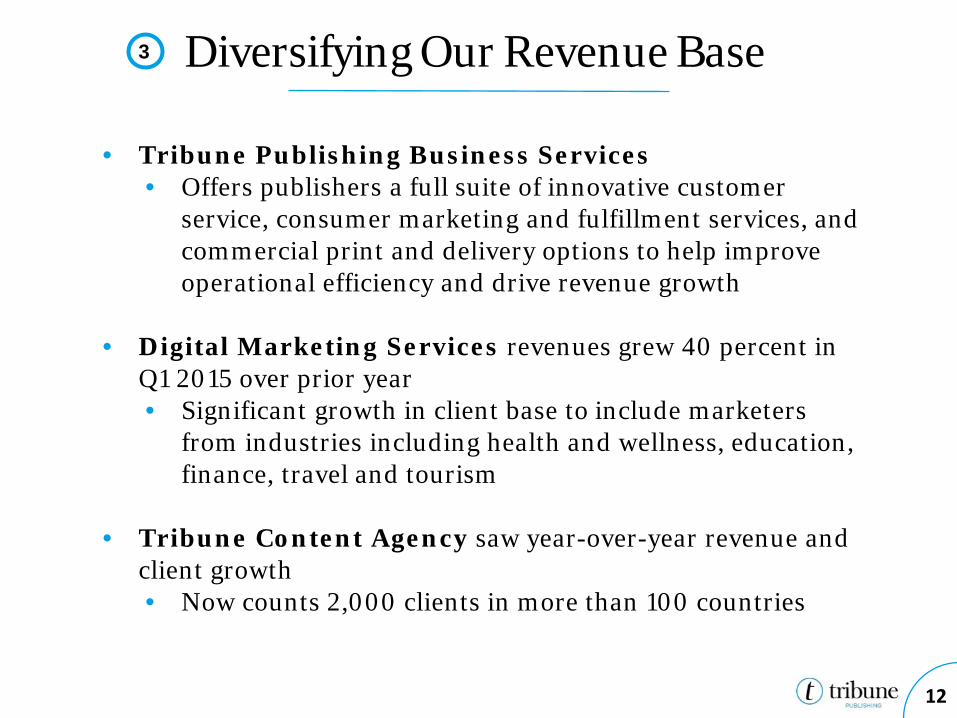
• Tribune Publishing Business Services • Offers publishers a full suite of innovative customer
service, consumer marketing and fulfillment services, and commercial print and delivery options to help improve operational efficiency and drive revenue growth
• Digital Marketing Services revenues grew 40 percent in
Q1 2015 over prior year • Significant growth in client base to include marketers
from industries including health and wellness, education, finance, travel and tourism
• Tribune Content Agency saw year-over-year revenue and client growth • Now counts 2,000 clients in more than 100 countries
Accelerating Our National Sales Revenue
13
4
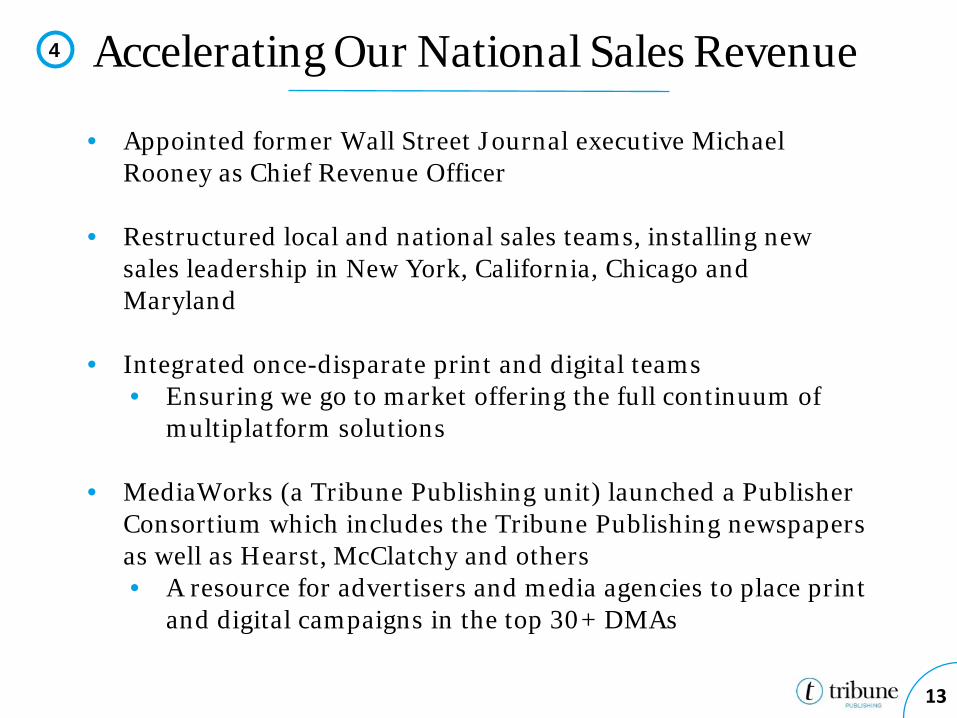
• Appointed former Wall Street Journal executive Michael Rooney as Chief Revenue Officer
• Restructured local and national sales teams, installing new sales leadership in New York, California, Chicago and Maryland
• Integrated once-disparate print and digital teams • Ensuring we go to market offering the full continuum of
multiplatform solutions
• MediaWorks (a Tribune Publishing unit) launched a Publisher Consortium which includes the Tribune Publishing newspapers as well as Hearst, McClatchy and others • A resource for advertisers and media agencies to place print
and digital campaigns in the top 30+ DMAs

Pursuing Accretive Acquisitions
14
Q2 2014 April 2014: In Hartford, we acquired Reminder Media, publisher of 15 free weekly titles in Connecticut
Q2 2014 May 2014: In Baltimore, we acquired Capital-Gazette and Carroll County Times & Baltimore City Paper
Q4 2014 October 2014: In Chicago, we acquired six daily & 32 weekly suburban titles from Chicago Sun-Times
Q2 2015 May 2015: In San Diego, we acquired U-T San Diego & 9 weekly community titles
5
San Diego Union Tribune Pro forma Financial Impact
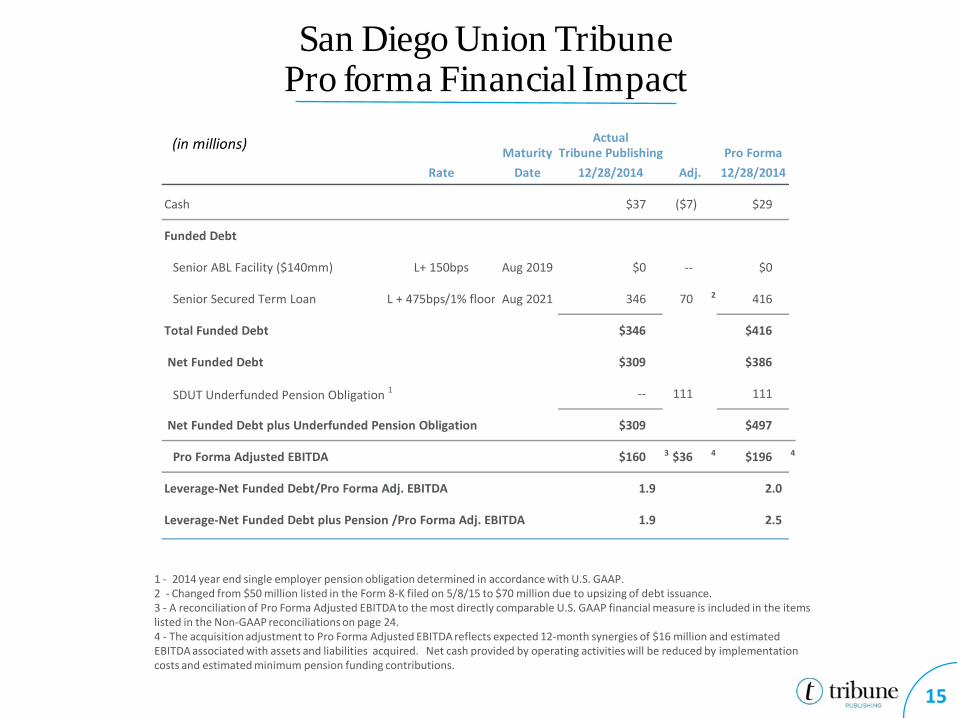
1 - 2014 year end single employer pension obligation determined in accordance with U.S. GAAP. 2 - Changed from $50 million listed in the Form 8-K filed on 5/8/15 to $70 million due to upsizing of debt issuance. 3 - A reconciliation of Pro Forma Adjusted EBITDA to the most directly comparable U.S. GAAP financial measure is included in the items listed in the Non-GAAP reconciliations on page 24. 4 - The acquisition adjustment to Pro Forma Adjusted EBITDA reflects expected 12-month synergies of $16 million and estimated EBITDA associated with assets and liabilities acquired. Net cash provided by operating activities will be reduced by implementation costs and estimated minimum pension funding contributions.
15
(in millions) ActualMaturity Tribune Publishing Pro Forma
Rate Date 12/28/2014 Adj. 12/28/2014
Cash $37 ($7) $29
Funded Debt
Senior ABL Facility ($140mm) L+ 150bps Aug 2019 $0 -- $0
Senior Secured Term Loan L + 475bps/1% floor Aug 2021 346 70 2 416
Total Funded Debt $346 $416
Net Funded Debt $309 $386
SDUT Underfunded Pension Obligation 1 -- 111 111
Net Funded Debt plus Underfunded Pension Obligation $309 $497
Pro Forma Adjusted EBITDA $160 3 $36 4 $196 4
Leverage-Net Funded Debt/Pro Forma Adj. EBITDA 1.9 2.0
Leverage-Net Funded Debt plus Pension /Pro Forma Adj. EBITDA 1.9 2.5

Appendix
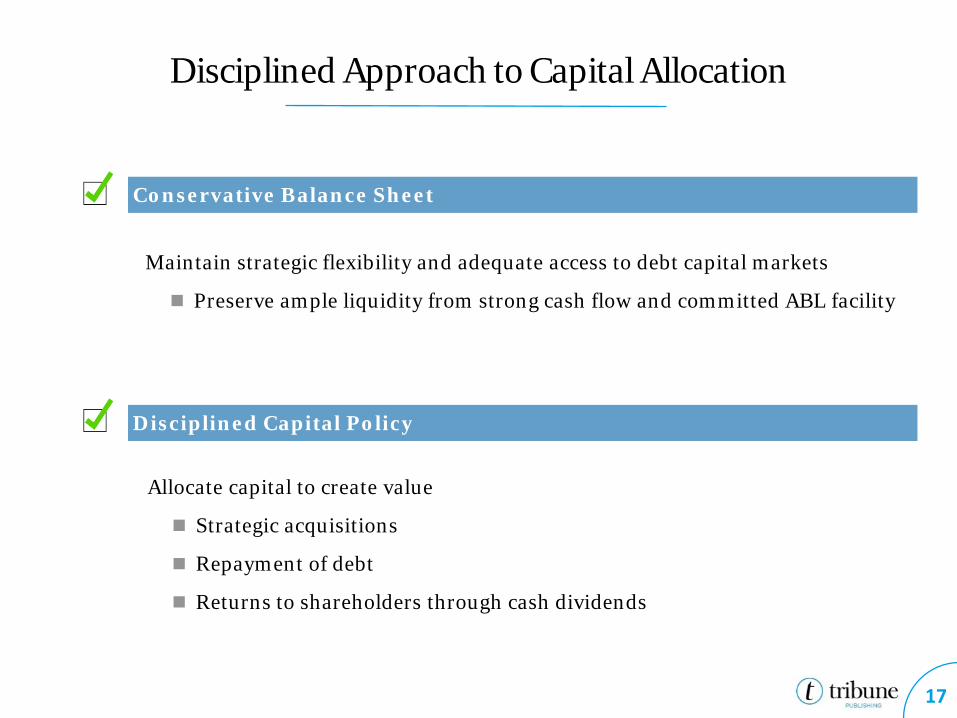
Disciplined Approach to Capital Allocation
Conservative Balance Sheet
Allocate capital to create value
Strategic acquisitions
Repayment of debt
Returns to shareholders through cash dividends
Disciplined Capital Policy
Maintain strategic flexibility and adequate access to debt capital markets
Preserve ample liquidity from strong cash flow and committed ABL facility
17

Financial Profile
18
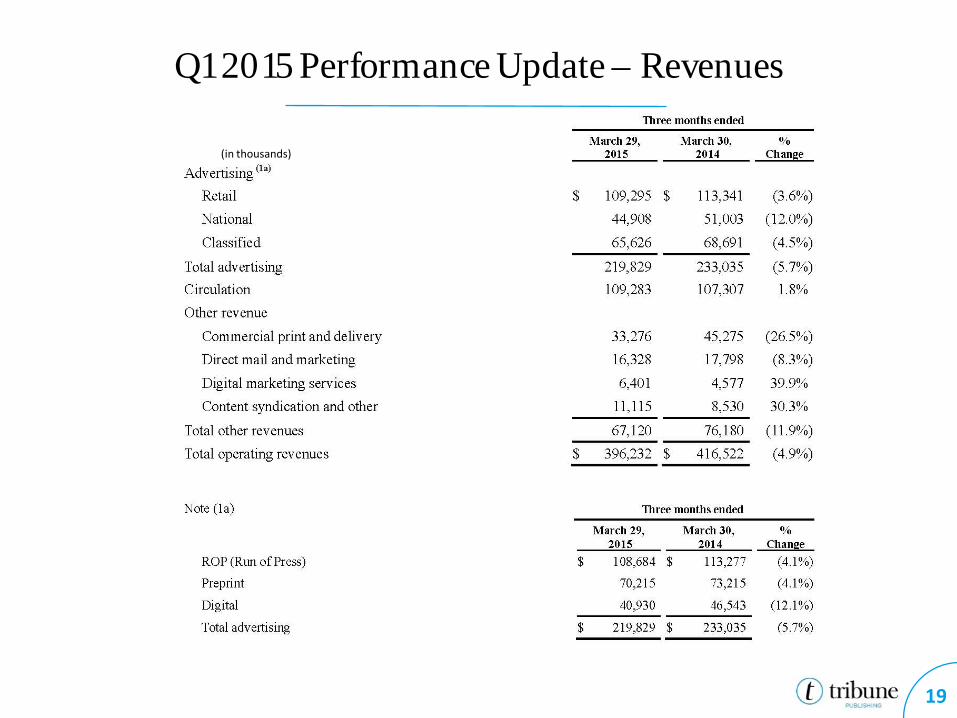
Q1 2015 Performance Update – Revenues
19
(in thousands)
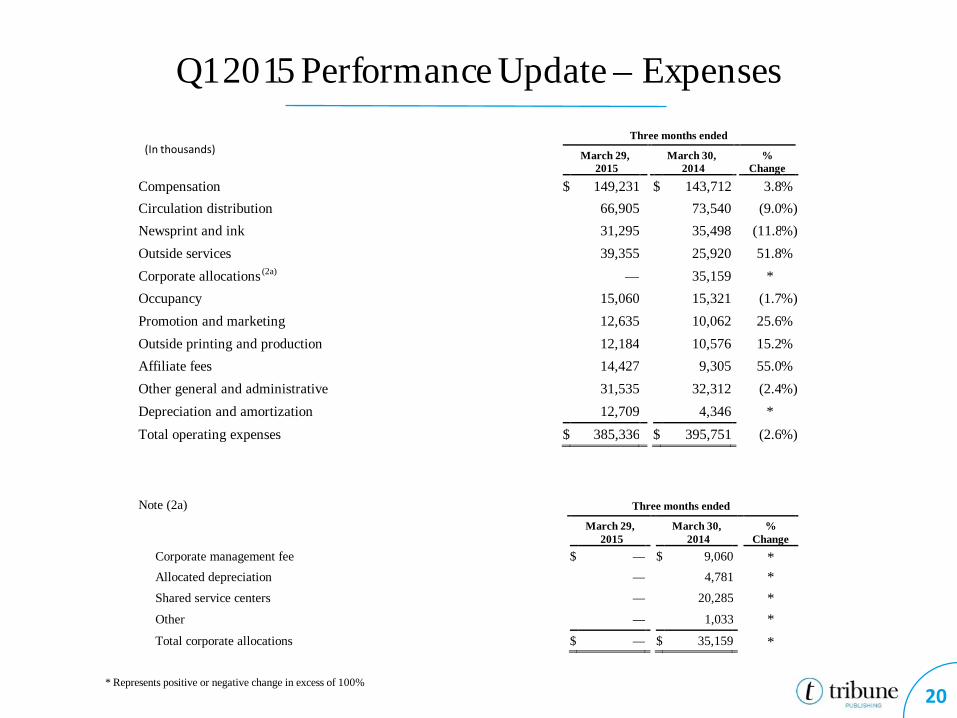
Q1 2015 Performance Update – Expenses
20
Three months ended
March 29, 2015 March 30,
2014 % Change
Compensation $ 149,231 $ 143,712 3.8 % Circulation distribution 66,905 73,540 (9.0 %) Newsprint and ink 31,295 35,498 (11.8 %) Outside services 39,355 25,920 51.8 % Corporate allocations (2a) — 35,159 * Occupancy 15,060 15,321 (1.7 %) Promotion and marketing 12,635 10,062 25.6 % Outside printing and production 12,184 10,576 15.2 % Affiliate fees 14,427 9,305 55.0 % Other general and administrative 31,535 32,312 (2.4 %) Depreciation and amortization 12,709 4,346 * Total operating expenses $ 385,336 $ 395,751 (2.6 %)
Note (2a) Three months ended
March 29, 2015 March 30,
2014 % Change
Corporate management fee $ — $ 9,060 * Allocated depreciation — 4,781 * Shared service centers — 20,285 * Other — 1,033 * Total corporate allocations $ — $ 35,159 *
* Represents positive or negative change in excess of 100%
(In thousands)
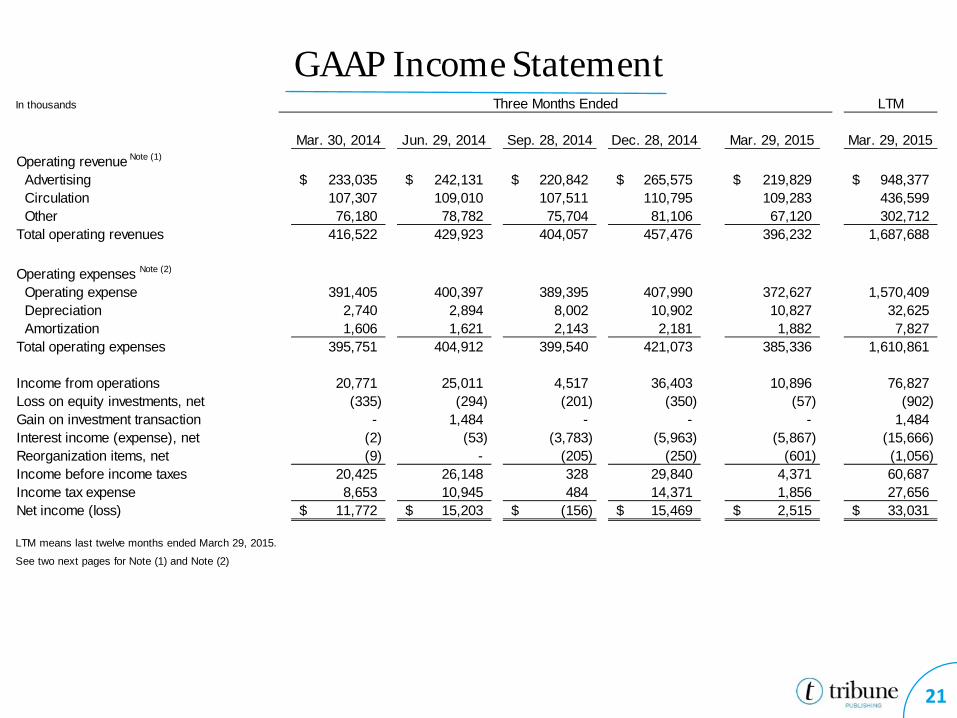
GAAP Income Statement
21
In thousands LTM
Mar. 30, 2014 Jun. 29, 2014 Sep. 28, 2014 Dec. 28, 2014 Mar. 29, 2015 Mar. 29, 2015Operating revenue Note (1)
Advertising 233,035$ 242,131$ 220,842$ 265,575$ 219,829$ 948,377$ Circulation 107,307 109,010 107,511 110,795 109,283 436,599 Other 76,180 78,782 75,704 81,106 67,120 302,712 Total operating revenues 416,522 429,923 404,057 457,476 396,232 1,687,688
Operating expenses Note (2)
Operating expense 391,405 400,397 389,395 407,990 372,627 1,570,409 Depreciation 2,740 2,894 8,002 10,902 10,827 32,625 Amortization 1,606 1,621 2,143 2,181 1,882 7,827 Total operating expenses 395,751 404,912 399,540 421,073 385,336 1,610,861
Income from operations 20,771 25,011 4,517 36,403 10,896 76,827 Loss on equity investments, net (335) (294) (201) (350) (57) (902) Gain on investment transaction - 1,484 - - - 1,484 Interest income (expense), net (2) (53) (3,783) (5,963) (5,867) (15,666) Reorganization items, net (9) - (205) (250) (601) (1,056) Income before income taxes 20,425 26,148 328 29,840 4,371 60,687 Income tax expense 8,653 10,945 484 14,371 1,856 27,656 Net income (loss) 11,772$ 15,203$ (156)$ 15,469$ 2,515$ 33,031$
LTM means last twelve months ended March 29, 2015.
See two next pages for Note (1) and Note (2)
Three Months Ended
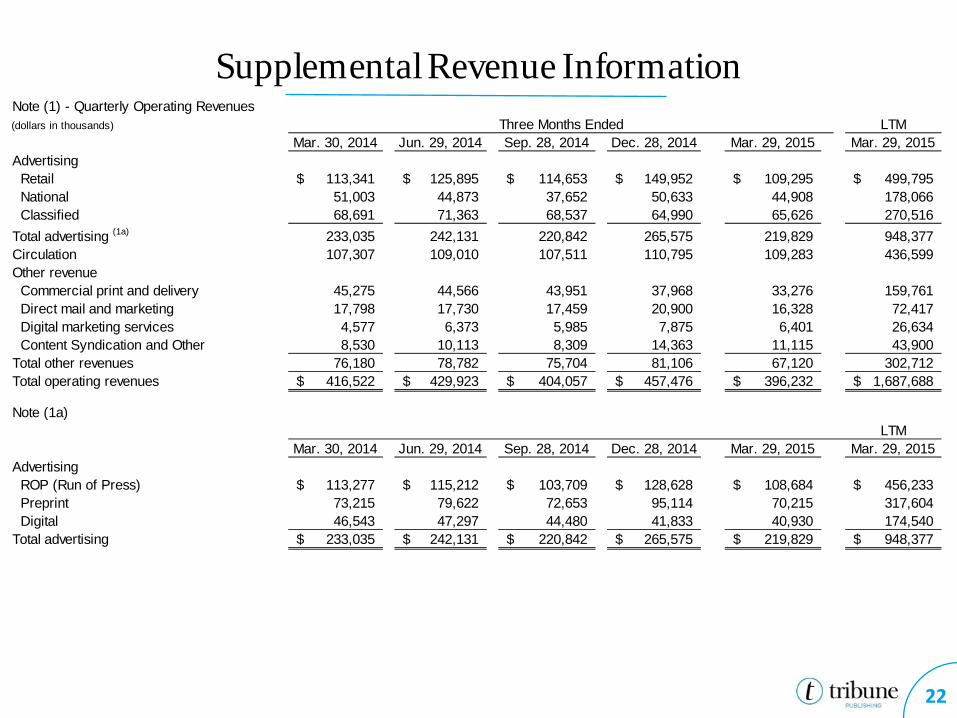
Supplemental Revenue Information
22
Note (1) - Quarterly Operating Revenues(dollars in thousands) LTM
Mar. 30, 2014 Jun. 29, 2014 Sep. 28, 2014 Dec. 28, 2014 Mar. 29, 2015 Mar. 29, 2015Advertising Retail 113,341$ 125,895$ 114,653$ 149,952$ 109,295$ 499,795$ National 51,003 44,873 37,652 50,633 44,908 178,066 Classified 68,691 71,363 68,537 64,990 65,626 270,516 Total advertising (1a) 233,035 242,131 220,842 265,575 219,829 948,377 Circulation 107,307 109,010 107,511 110,795 109,283 436,599 Other revenue Commercial print and delivery 45,275 44,566 43,951 37,968 33,276 159,761 Direct mail and marketing 17,798 17,730 17,459 20,900 16,328 72,417 Digital marketing services 4,577 6,373 5,985 7,875 6,401 26,634 Content Syndication and Other 8,530 10,113 8,309 14,363 11,115 43,900 Total other revenues 76,180 78,782 75,704 81,106 67,120 302,712 Total operating revenues 416,522$ 429,923$ 404,057$ 457,476$ 396,232$ 1,687,688$
Note (1a)LTM
Mar. 30, 2014 Jun. 29, 2014 Sep. 28, 2014 Dec. 28, 2014 Mar. 29, 2015 Mar. 29, 2015Advertising ROP (Run of Press) 113,277$ 115,212$ 103,709$ 128,628$ 108,684$ 456,233$ Preprint 73,215 79,622 72,653 95,114 70,215 317,604 Digital 46,543 47,297 44,480 41,833 40,930 174,540 Total advertising 233,035$ 242,131$ 220,842$ 265,575$ 219,829$ 948,377$
Three Months Ended
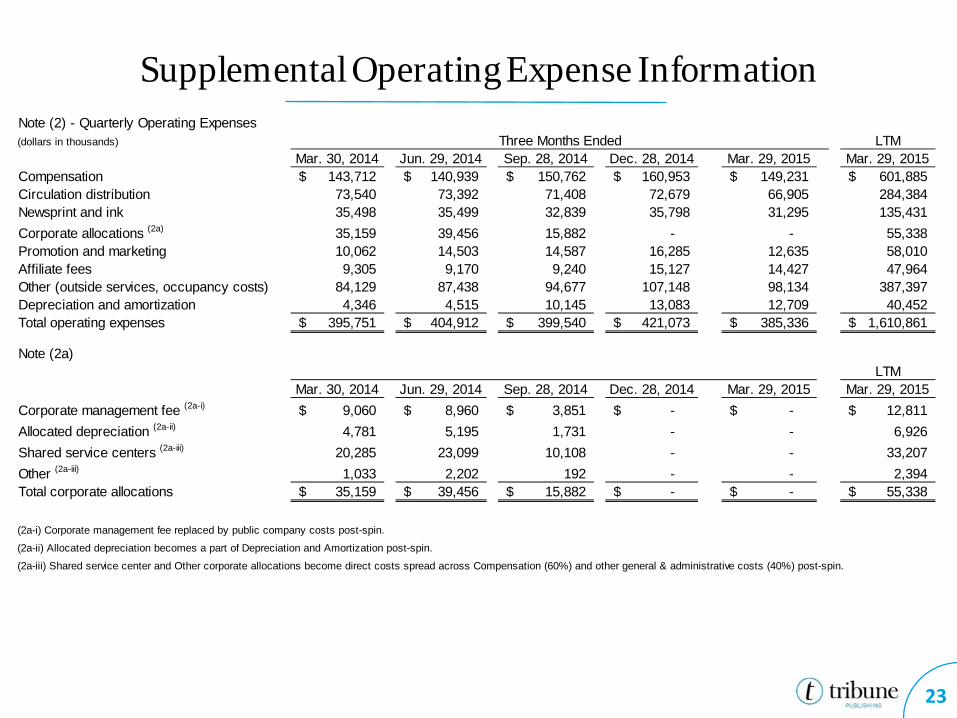
Supplemental Operating Expense Information
23
Note (2) - Quarterly Operating Expenses(dollars in thousands) LTM
Mar. 30, 2014 Jun. 29, 2014 Sep. 28, 2014 Dec. 28, 2014 Mar. 29, 2015 Mar. 29, 2015Compensation 143,712$ 140,939$ 150,762$ 160,953$ 149,231$ 601,885$ Circulation distribution 73,540 73,392 71,408 72,679 66,905 284,384 Newsprint and ink 35,498 35,499 32,839 35,798 31,295 135,431 Corporate allocations (2a) 35,159 39,456 15,882 - - 55,338 Promotion and marketing 10,062 14,503 14,587 16,285 12,635 58,010 Affiliate fees 9,305 9,170 9,240 15,127 14,427 47,964 Other (outside services, occupancy costs) 84,129 87,438 94,677 107,148 98,134 387,397 Depreciation and amortization 4,346 4,515 10,145 13,083 12,709 40,452 Total operating expenses 395,751$ 404,912$ 399,540$ 421,073$ 385,336$ 1,610,861$
Note (2a)LTM
Mar. 30, 2014 Jun. 29, 2014 Sep. 28, 2014 Dec. 28, 2014 Mar. 29, 2015 Mar. 29, 2015Corporate management fee (2a-i) 9,060$ 8,960$ 3,851$ -$ -$ 12,811$ Allocated depreciation (2a-ii) 4,781 5,195 1,731 - - 6,926 Shared service centers (2a-iii) 20,285 23,099 10,108 - - 33,207 Other (2a-iii) 1,033 2,202 192 - - 2,394 Total corporate allocations 35,159$ 39,456$ 15,882$ -$ -$ 55,338$
(2a-i) Corporate management fee replaced by public company costs post-spin.
(2a-ii) Allocated depreciation becomes a part of Depreciation and Amortization post-spin.
(2a-iii) Shared service center and Other corporate allocations become direct costs spread across Compensation (60%) and other general & administrative costs (40%) post-spin.
Three Months Ended
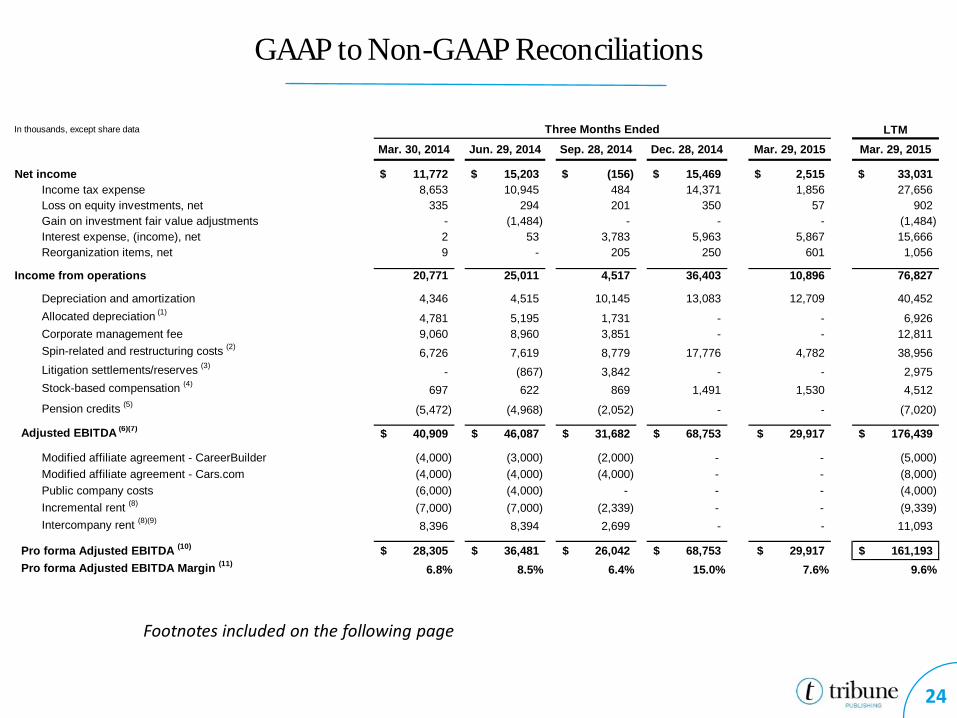
GAAP to Non-GAAP Reconciliations
24
In thousands, except share data LTMMar. 30, 2014 Jun. 29, 2014 Sep. 28, 2014 Dec. 28, 2014 Mar. 29, 2015 Mar. 29, 2015
Net income 11,772$ 15,203$ (156)$ 15,469$ 2,515$ 33,031$ Income tax expense 8,653 10,945 484 14,371 1,856 27,656 Loss on equity investments, net 335 294 201 350 57 902 Gain on investment fair value adjustments - (1,484) - - - (1,484) Interest expense, (income), net 2 53 3,783 5,963 5,867 15,666 Reorganization items, net 9 - 205 250 601 1,056
Income from operations 20,771 25,011 4,517 36,403 10,896 76,827
Depreciation and amortization 4,346 4,515 10,145 13,083 12,709 40,452 Allocated depreciation (1)
4,781 5,195 1,731 - - 6,926 Corporate management fee 9,060 8,960 3,851 - - 12,811 Spin-related and restructuring costs (2)
6,726 7,619 8,779 17,776 4,782 38,956 Litigation settlements/reserves (3)
- (867) 3,842 - - 2,975 Stock-based compensation (4)
697 622 869 1,491 1,530 4,512 Pension credits (5) (5,472) (4,968) (2,052) - - (7,020)
Adjusted EBITDA (6)(7) 40,909$ 46,087$ 31,682$ 68,753$ 29,917$ 176,439$
Modified affiliate agreement - CareerBuilder (4,000) (3,000) (2,000) - - (5,000)Modified affiliate agreement - Cars.com (4,000) (4,000) (4,000) - - (8,000)Public company costs (6,000) (4,000) - - - (4,000)Incremental rent (8) (7,000) (7,000) (2,339) - - (9,339)Intercompany rent (8)(9) 8,396 8,394 2,699 - - 11,093
Pro forma Adjusted EBITDA (10) 28,305$ 36,481$ 26,042$ 68,753$ 29,917$ 161,193$ Pro forma Adjusted EBITDA Margin (11) 6.8% 8.5% 6.4% 15.0% 7.6% 9.6%
Three Months Ended
Footnotes included on the following page
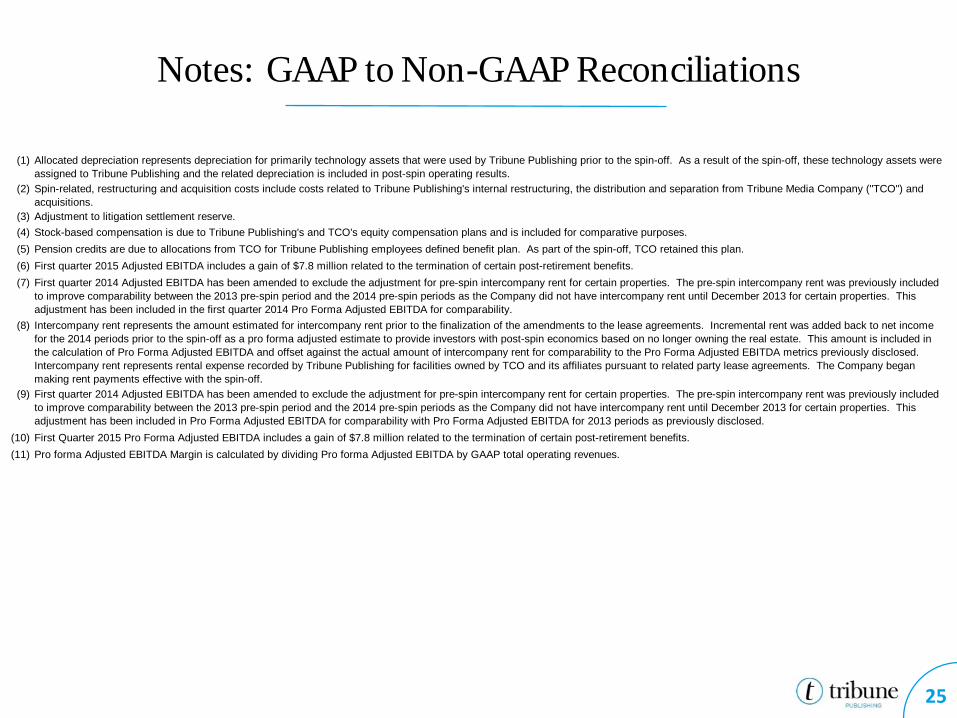
Notes: GAAP to Non-GAAP Reconciliations
25
(1)
(2)
(3)(4)(5)(6)(7)
(8)
(9)
(10)(11)
Intercompany rent represents the amount estimated for intercompany rent prior to the finalization of the amendments to the lease agreements. Incremental rent was added back to net income for the 2014 periods prior to the spin-off as a pro forma adjusted estimate to provide investors with post-spin economics based on no longer owning the real estate. This amount is included in the calculation of Pro Forma Adjusted EBITDA and offset against the actual amount of intercompany rent for comparability to the Pro Forma Adjusted EBITDA metrics previously disclosed. Intercompany rent represents rental expense recorded by Tribune Publishing for facilities owned by TCO and its affiliates pursuant to related party lease agreements. The Company began making rent payments effective with the spin-off.
First quarter 2015 Adjusted EBITDA includes a gain of $7.8 million related to the termination of certain post-retirement benefits.First quarter 2014 Adjusted EBITDA has been amended to exclude the adjustment for pre-spin intercompany rent for certain properties. The pre-spin intercompany rent was previously included to improve comparability between the 2013 pre-spin period and the 2014 pre-spin periods as the Company did not have intercompany rent until December 2013 for certain properties. This adjustment has been included in the first quarter 2014 Pro Forma Adjusted EBITDA for comparability.
Pro forma Adjusted EBITDA Margin is calculated by dividing Pro forma Adjusted EBITDA by GAAP total operating revenues.
First quarter 2014 Adjusted EBITDA has been amended to exclude the adjustment for pre-spin intercompany rent for certain properties. The pre-spin intercompany rent was previously included to improve comparability between the 2013 pre-spin period and the 2014 pre-spin periods as the Company did not have intercompany rent until December 2013 for certain properties. This adjustment has been included in Pro Forma Adjusted EBITDA for comparability with Pro Forma Adjusted EBITDA for 2013 periods as previously disclosed.
Pension credits are due to allocations from TCO for Tribune Publishing employees defined benefit plan. As part of the spin-off, TCO retained this plan.
Allocated depreciation represents depreciation for primarily technology assets that were used by Tribune Publishing prior to the spin-off. As a result of the spin-off, these technology assets were assigned to Tribune Publishing and the related depreciation is included in post-spin operating results.Spin-related, restructuring and acquisition costs include costs related to Tribune Publishing's internal restructuring, the distribution and separation from Tribune Media Company ("TCO") and acquisitions.Adjustment to litigation settlement reserve.Stock-based compensation is due to Tribune Publishing's and TCO's equity compensation plans and is included for comparative purposes.
First Quarter 2015 Pro Forma Adjusted EBITDA includes a gain of $7.8 million related to the termination of certain post-retirement benefits.