Embed Size (px)
Citation preview

2015
Full Year Results
February 24, 2016
DISCLAIMER
This presentation includes or may include representations or estimations concerning the future about intentions, expectations or forecasts of VIDRALA or its management. which may refer to the evolution of its business performance and its results. These forward looking statements refer to our intentions, opinions and future expectations, and include, without limitation, statements concerning our future business development and economic performance. While these
forward looking statements represent our judgment and future expectations concerning the development of our business, a number of risks, uncertainties and other important factors could cause actual developments and results to differ materially from our expectations. These factors include, but are not limited to, (1) general market, macro-economic, governmental and regulatory trends, (2) movements in local and international securities markets, currency exchange rates and interest rates as well as commodities, (3) competitive pressures, (4) technological developments, (5) changes in the financial position or credit worthiness of our customers, obligors and counterparties. The risk factors and other key factors that we have indicated in our past and future filings and reports, including those
with the regulatory and supervisory authorities (including the Spanish Securities Market Authority – Comisión Nacional del Mercado de Valores - CNMV), could adversely affect our business and financial performance. VIDRALA expressly declines any obligation or commitment to provide any update or revision of the information herein contained, any change in expectations or modification of the facts, conditions and circumstances upon which such estimations concerning the future have been based, even if those lead to a change in the strategy or the intentions shown herein. This presentation can be used by those entities that may have to adopt decisions or proceed to carry out opinions related to securities issued by VIDRALA and, in particular, by analysts. It is expressly warned that this document may contain not audited or summarised information. It is expressly advised to the readers of this document to consult the public information registered by VIDRALA with the regulatory authorities, in particular, the periodical information and prospectuses registered with the Spanish Securities Market Authority – Comisión Nacional del Mercado de Valores (CNMV).
2
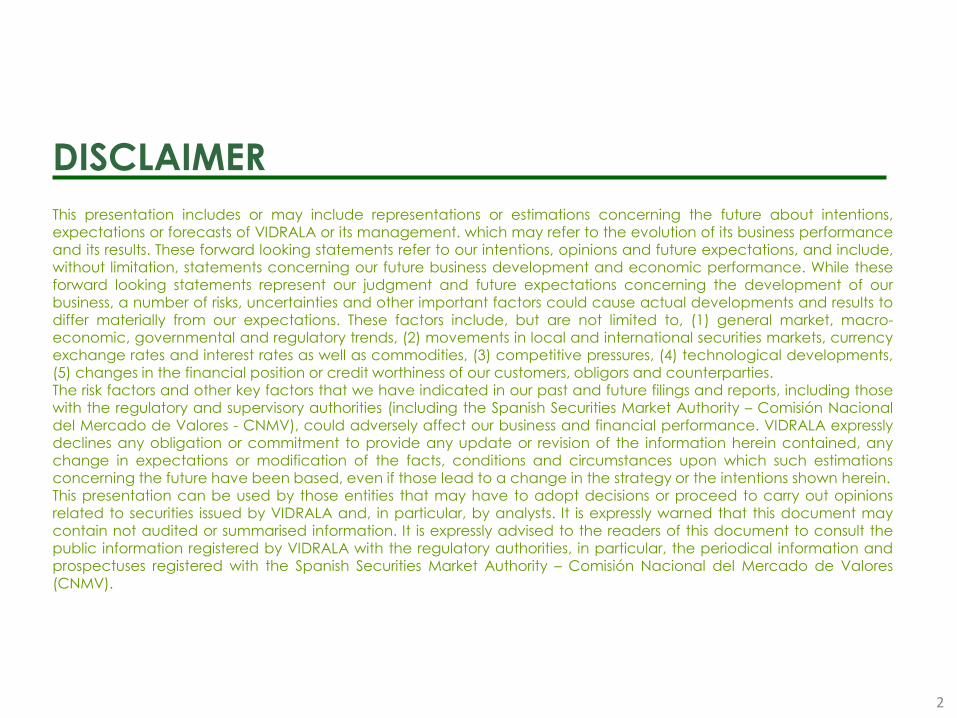
FY 2015 KEY FIGURES
3
*
* Free cash flow ex-acquistion of Encirc, as detailed in this document.
** Net debt variation year over year over net debt proforma at the start of the year after the acquisition of Encirc Ltd.
EUR in millions FY 2015 Change (yoy)
Sales 802.6 +71.4%
EBITDA 161.3 +48.6%
EBIT 86.3 +24.1%
Net income 60.9 +18.0%
EPS (EUR/share) 2.46 +18.0%
Free cash flow 88.2 +22.0%
Debt 404.3 -15.0%**
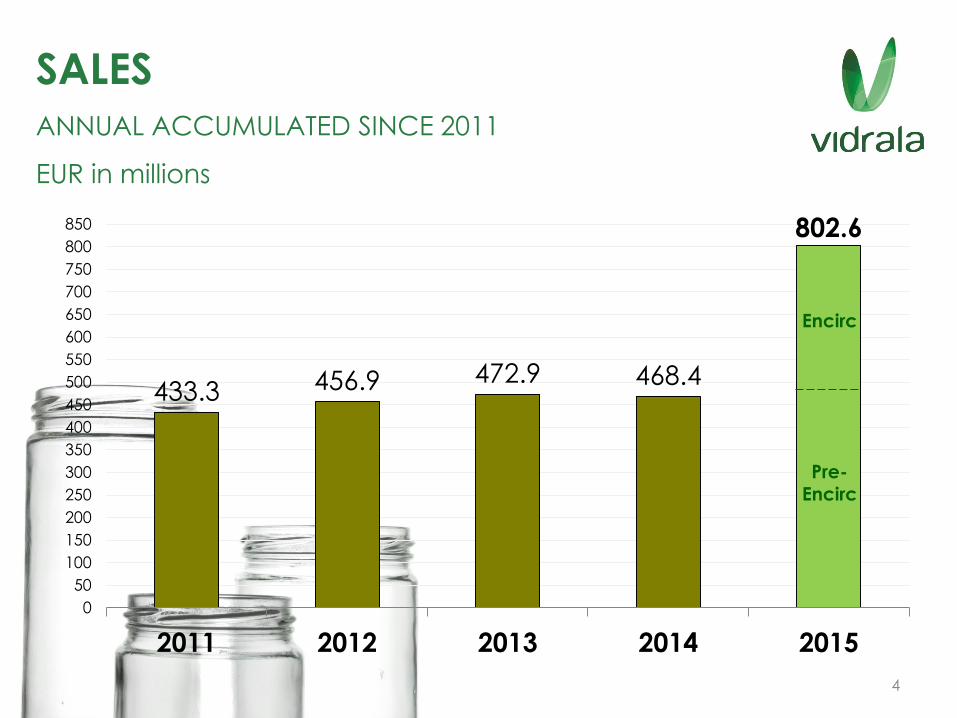
433.3 456.9 472.9 468.4
802.6
0
50
100
150
200
250
300
350
400
450
500
550
600
650
700
750
800
850
2011 2012 2013 2014 2015
353.6
387.2 382.4
405.9
433.3
300
350
400
450
2007 2008 2009 2010 2011
SALES
ANNUAL ACCUMULATED SINCE 2011
EUR in millions
Pre-Encirc
Encirc
4
353.6
387.2 382.4
405.9
433.3
300
350
400
450
2007 2008 2009 2010 2011
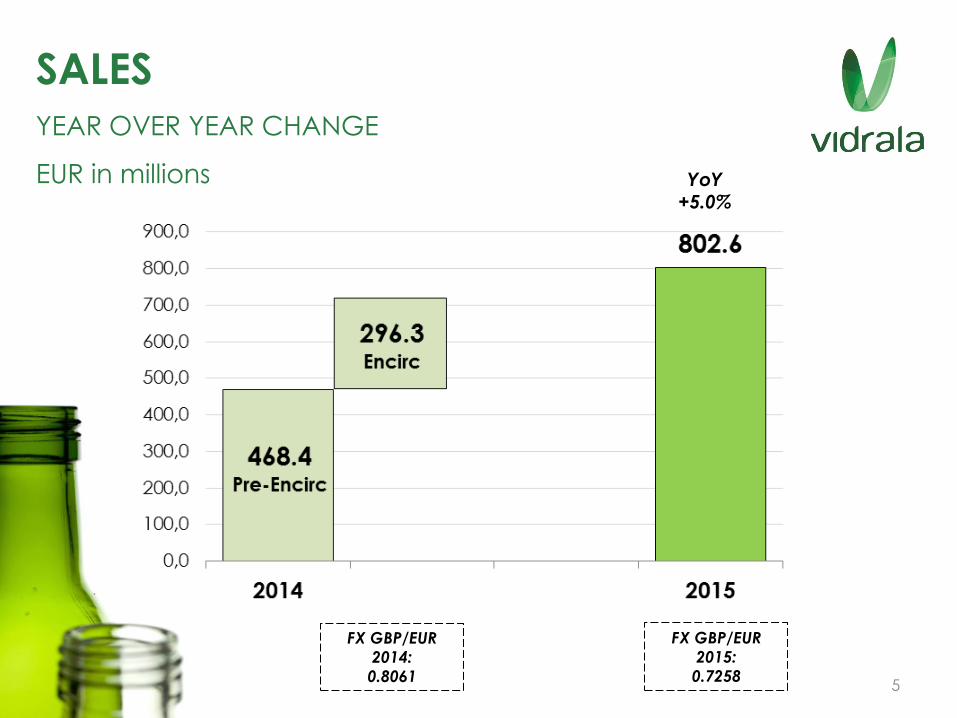
SALES
YEAR OVER YEAR CHANGE
EUR in millions
FX GBP/EUR
2014:
0.8061
FX GBP/EUR
2015:
0.7258
YoY +5.0%
5

353.6
387.2 382.4
405.9
433.3
300
350
400
450
2007 2008 2009 2010 2011
SALES
QUARTER BY QUARTER 2014 proforma vs 2015
EUR in millions
6
171.0
203.0 203.7 186.9 177.7
211.2 213.9 199.8
0,0
50,0
100,0
150,0
200,0
250,0
FIRST QUARTER SECOND QUARTER THIRD QUARTER FOURTH QUARTER
2014 PROFORMA 2015
QoQ +3.9%
QoQ +4.0%
QoQ +5.0% QoQ
+6.9%
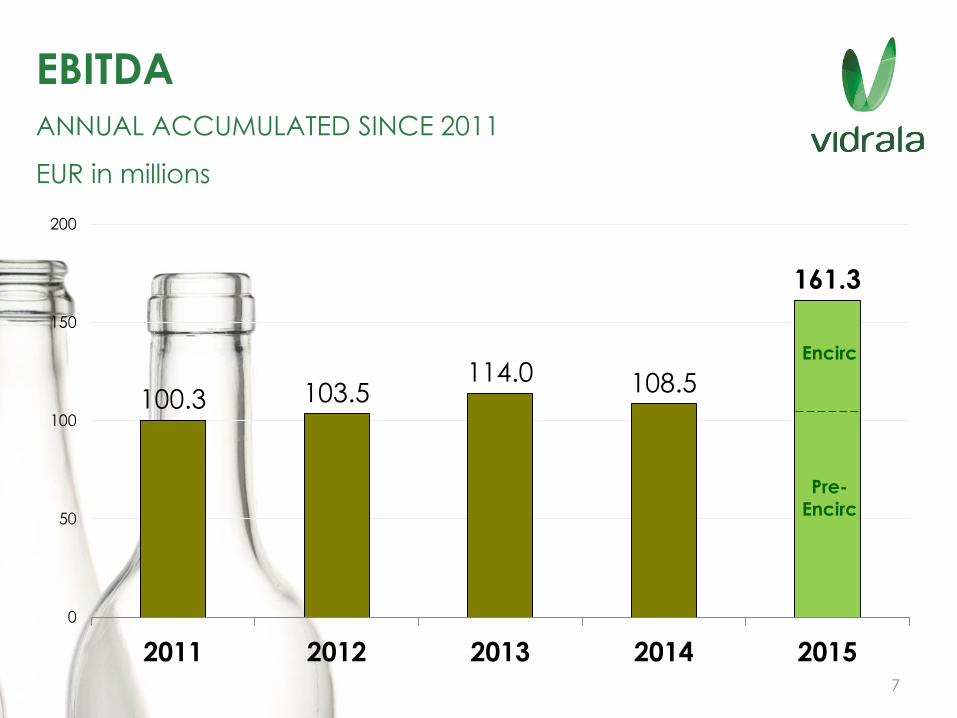
100.3 103.5 114.0 108.5
161.3
0
50
100
150
200
2011 2012 2013 2014 2015
353.6
387.2 382.4
405.9
433.3
300
350
400
450
2007 2008 2009 2010 2011
EBITDA
ANNUAL ACCUMULATED SINCE 2011
EUR in millions
Pre-Encirc
Encirc
7
353.6
387.2 382.4
405.9
433.3
300
350
400
450
2007 2008 2009 2010 2011
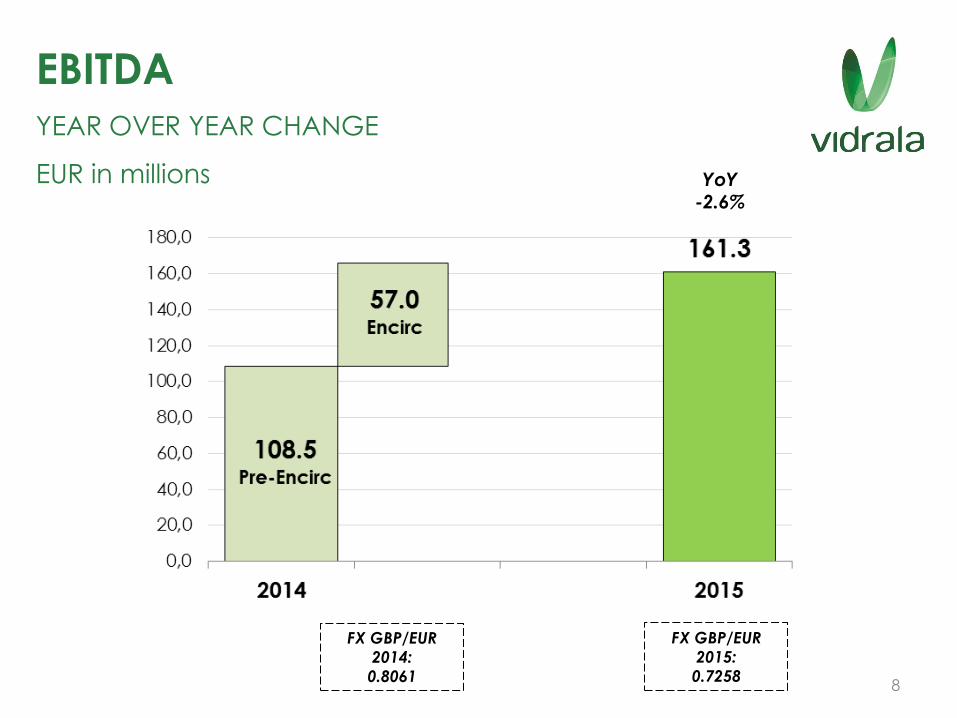
EBITDA
YEAR OVER YEAR CHANGE
EUR in millions
YoY -2.6%
8
FX GBP/EUR
2014:
0.8061
FX GBP/EUR
2015:
0.7258
353.6
387.2 382.4
405.9
433.3
300
350
400
450
2007 2008 2009 2010 2011
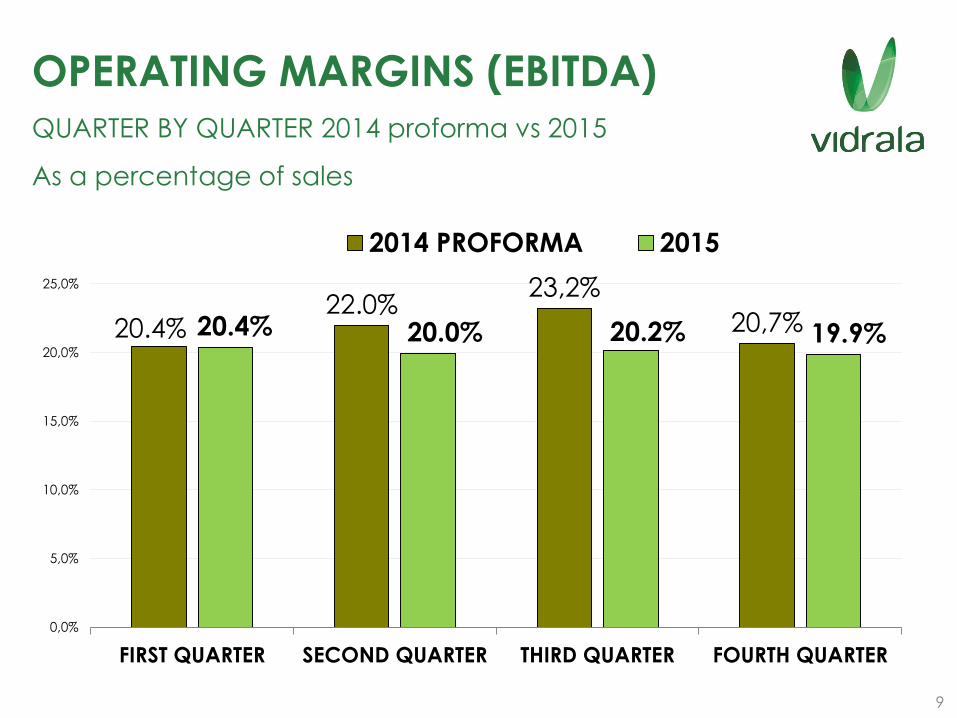
OPERATING MARGINS (EBITDA)
QUARTER BY QUARTER 2014 proforma vs 2015
As a percentage of sales
9
20.4% 22.0%
23,2%
20,7% 20.4% 20.0% 20.2% 19.9%
0,0%
5,0%
10,0%
15,0%
20,0%
25,0%
FIRST QUARTER SECOND QUARTER THIRD QUARTER FOURTH QUARTER
2014 PROFORMA 2015

EARNINGS PER SHARE
SINCE 2004
EUR per share
353.6
387.2 382.4
405.9
433.3
300
350
400
450
2007 2008 2009 2010 2011
55,0
62,9 61,0
34,9
70,9
63,9
2009 2010 2011
EBIT EBITDA after Capex
10
2.08
2.46
0,00
0,50
1,00
1,50
2,00
2,50
3,00
200
4
200
5
200
6
200
7
200
8
200
9
201
0
201
1
201
2
201
3
201
4
201
5
YoY +18%
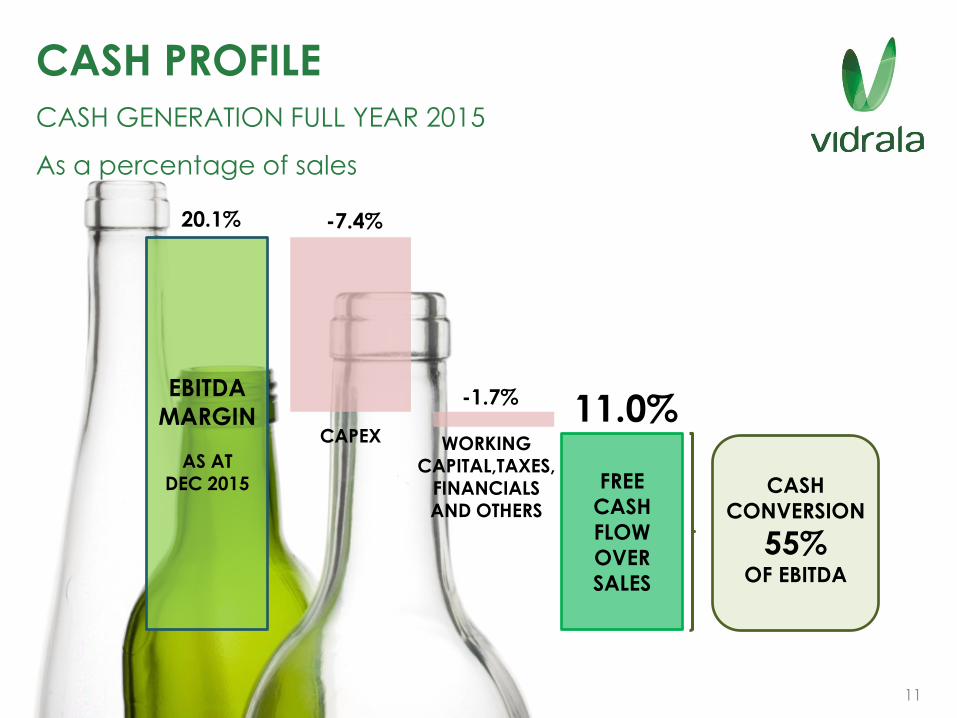
CASH PROFILE
CASH GENERATION FULL YEAR 2015
As a percentage of sales
353.6
387.2 382.4
405.9
433.3
300
350
400
450
2007 2008 2009 2010 2011
55,0
62,9 61,0
34,9
70,9
63,9
2009 2010 2011
EBIT EBITDA after Capex
11
EBITDA
MARGIN
AS AT DEC 2015
20.1% -7.4%
CAPEX
WORKING CAPITAL,TAXES,
FINANCIALS AND OTHERS
-1.7%
FREE
CASH
FLOW
OVER
SALES
11.0%
CASH
CONVERSION
55% OF EBITDA
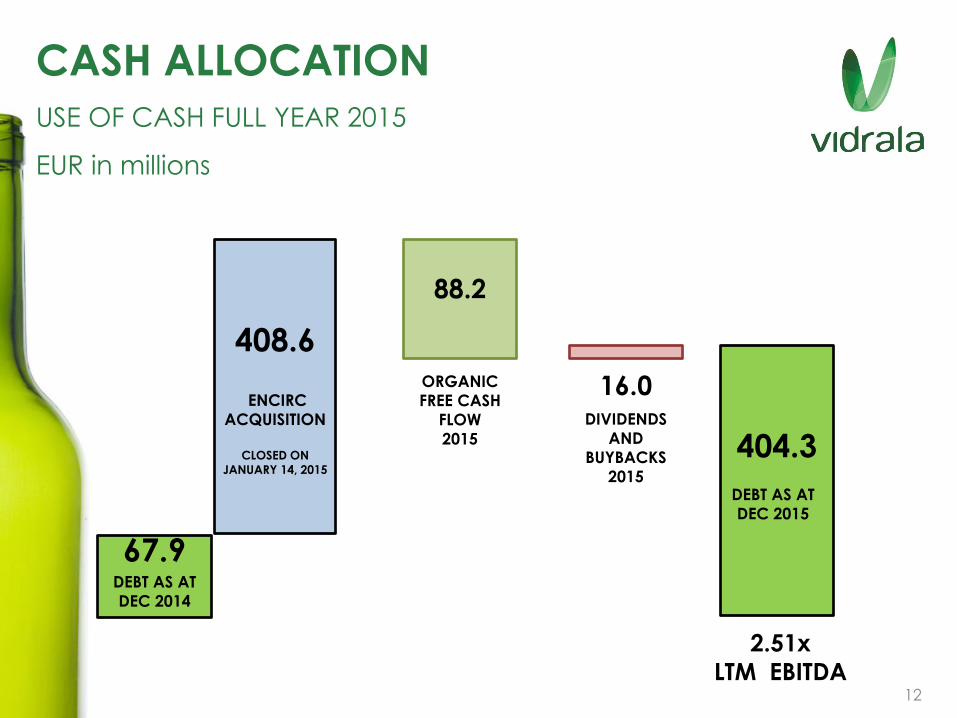
CASH ALLOCATION
USE OF CASH FULL YEAR 2015
EUR in millions
353.6
387.2 382.4
405.9
433.3
300
350
400
450
2007 2008 2009 2010 2011
55,0
62,9 61,0
34,9
70,9
63,9
2009 2010 2011
EBIT EBITDA after Capex
408.6
ENCIRC
ACQUISITION
CLOSED ON
JANUARY 14, 2015
404.3
DEBT AS AT
DEC 2015
ORGANIC
FREE CASH
FLOW
2015
88.2
DIVIDENDS
AND
BUYBACKS
2015
16.0
DEBT AS AT
DEC 2014
67.9
12
2.51x
LTM EBITDA
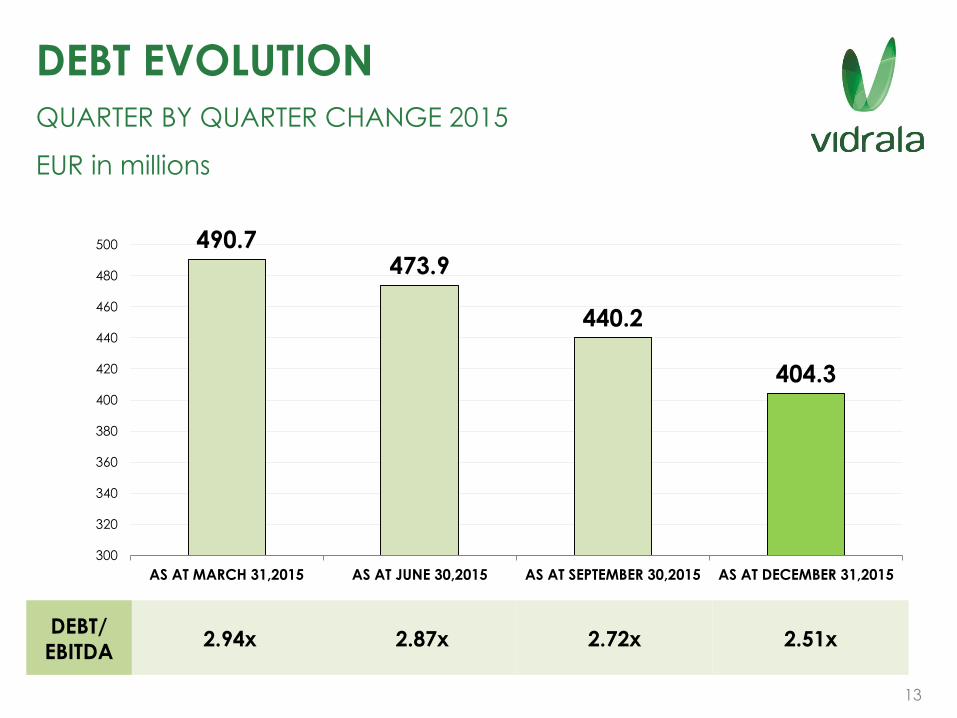
DEBT EVOLUTION
QUARTER BY QUARTER CHANGE 2015
EUR in millions
353.6
387.2 382.4
405.9
433.3
300
350
400
450
2007 2008 2009 2010 2011
55,0
62,9 61,0
34,9
70,9
63,9
2009 2010 2011
EBIT EBITDA after Capex
13
DEBT/
EBITDA 2.94x 2.87x 2.72x 2.51x
490.7 473.9
440.2
404.3
300
320
340
360
380
400
420
440
460
480
500
AS AT MARCH 31,2015 AS AT JUNE 30,2015 AS AT SEPTEMBER 30,2015 AS AT DECEMBER 31,2015

Q&A