Embed Size (px)
Citation preview
Reproduced with permission from Privacy & Security Law Report, 13 PVLR 823, 05/12/2014. Copyright � 2014 byThe Bureau of National Affairs, Inc. (800-372-1033) http://www.bna.com
Privacy Enforcers in the EU: A Comparative StudyOf National Data Protection Agencies’ Annual Reports
BY AURELIE POLS
F ollowing are graphics highlighting comparisons of selected topics discussed in the annual reports of data pro-tection authorities in various European Union member states.
17 %
83 %
Solemnly publicbudget financed
Loss-makingagencies
Balancedbudget
Moderate surplus(up to 25%)
High surplus(over 50%)
SOURCES OF FUNDING
DIStRIbUtION OF DPAs bUDGEtS9
7
5
3
13
5
87
135%SPAIN
MAjoR SURPLUS
-32%CzeCh
RePublIC
MAjoR DefICIT
Data Protection Agencies are rarely huge money loosingenterprises for european countries, on the contrary! With Spainleading the way, the right equilibrium needs to be found betweenhaving a balanced budget, protecting citizens’ rights andfostering economic growth through nurtured entrepreneurship.
DPAs and their finances: where does the moneycome from & is Data Protection a cost?DPAs are public budget financed to cover functioning costs. The ways ofallocating this budget varies per country. Some countries also charge fees forregistering their data files while others rely more on fines to assure revenue.
INCoMeCoSTS
fees and publicbudget financed
Popu
lation
(inm
illion
s)Population
Budget
DPAs
annu
albu
dget
(ineu
ros)
DPA bUDGEt AND POPUlAtION
Hunga
ryIre
land
Icelan
d
Portug
alUK
Romani
a
Swede
nest
onia
Italy
Czech
Repub
licPol
andGre
eceLatvia
Sloven
ia
Nethe
rlands
Bulga
ria
Denm
ark
Louxem
bourg
finlan
dMalt
a
Slovak
iafra
nce Spain
25.000.000
20.000.000
15.000.000
10.000.000
5.000.000
0
70
60
50
40
30
20
10
0
COPYRIGHT � 2014 BY THE BUREAU OF NATIONAL AFFAIRS, INC. ISSN 1538-3423
Privacy and Security Law Report®
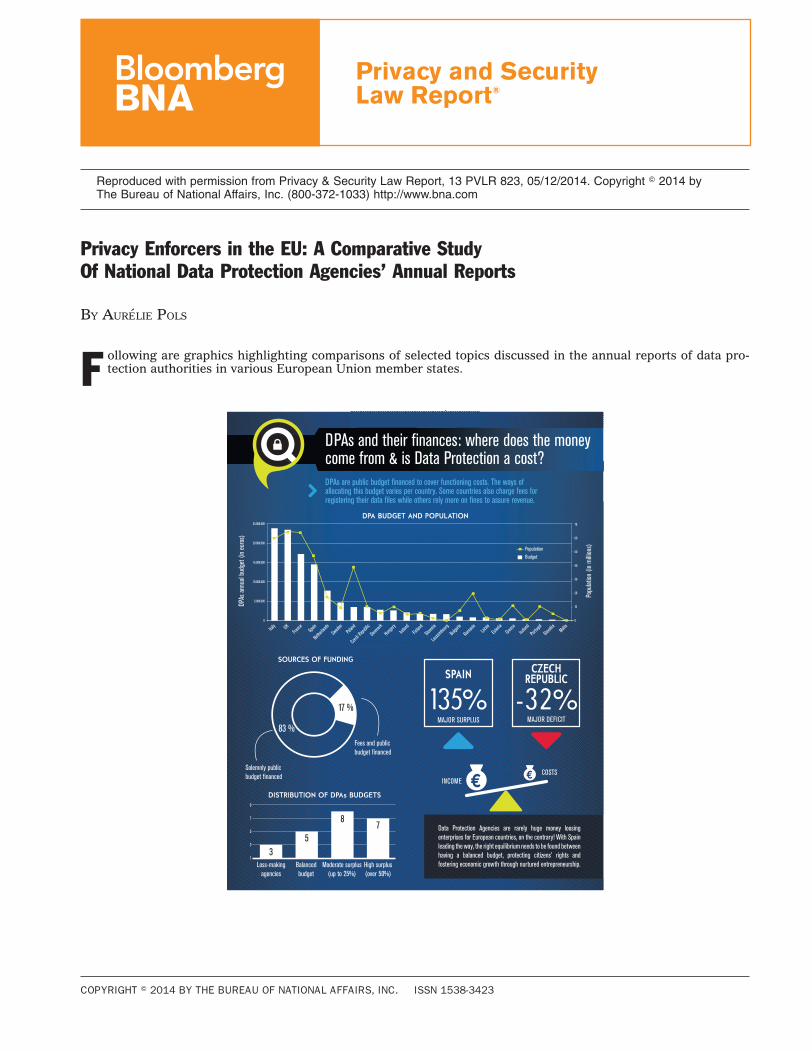
COUNtRIES wIth thE hIGhEStRISk OF SANCtIONS
(total sanctions / # of inspections)
COUNtRIES wIth thE hIGhEStAvERAGE SANCtIONS
(total amount earned by sanctions / # of total sanctions)
COUNtRIES wIth mOSt CItIzEN COmPlAINtS COUNtRIES DOING thE mOSt INSPECtIONS
While the highest average amount of sanctions goes to the UK, the ICo also enjoys the lowest sanctions and inspections compared to citizens
complaints. Additionally, countries are also limited in the maximum amount of sanctions they can attribute.
UK france HungarySpain Denmark Belgium Ireland
Poland
16.000
12.000
8.000
4.000
0
Complaints
francePortugal
SloveniaItaly
UKSlovakiaSweden
500
400
300
200
100
0
Inspections
13.8005.389 2.929
421.350
UK Spain Hungary
200€Romania8.800€
Italy
135.650€United Kingdom
34.000€Spain
1.700€Portugal
370€Netherlands
LoWeST
75%Romania
38%Italy
55%United Kingdom
11%Spain(*)
79%Portugal
21%Netherlands
LoWeRRISK
DPAs and their activities: what is all this moneyused for & does it defend citizens’ rights?DPAs exist to defend citizens’ rights to data protection. While sanctions are the most publicizedoutcomes, their daily tasks revert around consulting, inspecting and following-up on complaintsor denunciations -think of the ombudsman type of profile- while giving recommendations.
UK france HungarySpain Denmark Belgium Ireland
Poland
16.000
12.000
8.000
4.000
0
Complaints
2
5-12-14 COPYRIGHT � 2014 BY THE BUREAU OF NATIONAL AFFAIRS, INC. PVLR ISSN 1538-3423
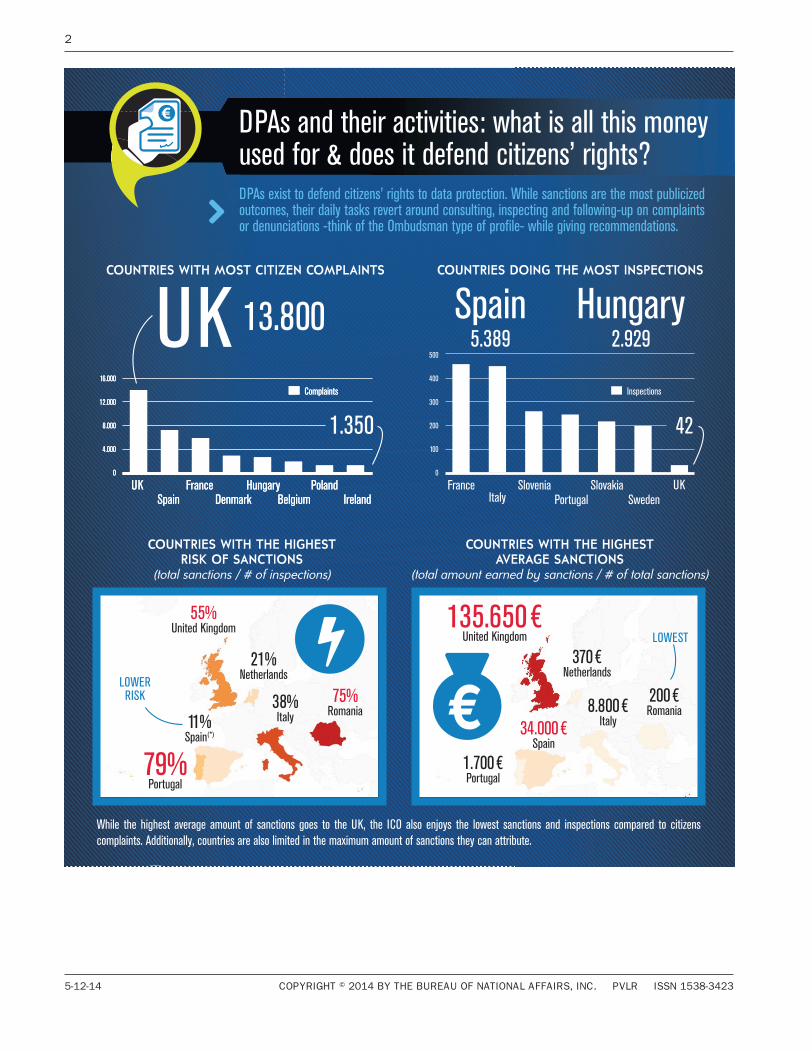
NUmbER OF SANCtIONS PER COUNtRy
SANCtIONS IN thE lIGht OF COmPlAINtS
mAxImUmAmOUNt OFSANCtIONSDPAS CANhAND OUt(in euros)
AmOUNt GAINED by SANCtIONS PER COUNtRy
As the data emanating from the annual reports we looked at is so disparate, it rapidlybecame dangerous to go into further detail. We did want to leave you with some ideasof quantity and amount of sanctions for the last available year for each DPA as well asmaximum fines each country is allowed, by law, to hand out.
Sanctions
Amount gainedby sanctions
Portugal
Italy
Spain
UK
€- 5.000 10.000 15.000 20.000 25.000 30.000 35.000 40.000 135.000 140.000
Portugal Italy Spain UK
Average sanction € 1,690 € 8,823 € 34,091 € 135,650Average sanction generated by a complaint € 681 € 5,837 € 2,550 € 230
700
600
500
400
300
200
100
0
Spain Ital
yest
onia
Latvia
france
Bulgar
ia
Sloven
ia
Portug
al
Romani
a UK
Slovak
ia
Nether
lands
Hungar
y
Czech
Republ
ic
572
19.500.000 €3.120.000 €
1.500.000 €
644.000 €
Spain
SpainUK
3
20.000.000
19.500.000
19.000.000
18.500.000
18.000.000
3.000.000
2.500.000
2.000.000
1.500.000
1.000.000
500.000
0
Spain UK Ital
y
Portug
alfra
nce
Bulgar
ia
Romani
aIrel
and
Nether
lands
Czech
Republ
ic
Min MaxUK 606,642
Spain 900 600,000
Czech Republic 204,000 408,000
Germany 50,000 300,000
Poland 270,000
Netherlands 250,000
france 150,000
Greece 146,000
Italy 6,000 120,000
Hungary 36,000
Portugal 250 30,000
Switzerland 7,900
All the amount are in € currency, the currency is in constant value of last october, in order to do the comparison and comprehension of information easier.
Metrics and KPIs
T H O M O G E N I z A T I O N O f f I N A N C I A L D A T A ,
3
PRIVACY & SECURITY LAW REPORT ISSN 1538-3423 BNA 5-12-14
TO START YOUR FREE TRIALCALL 800.372.1033 OR GO TO www.bna.com/privacy-insights
Unparalleled news. Expert analysis from the new Privacy & Data Security Portfolio Practice Series. Comprehensive new treatises. Proprietary practice tools. State, federal, and international primary sources. The all-in-one research solution that today’s professionals trust to navigate and stay in compliance with the maze of evolving privacy and data security laws.
Privacy & Data Security Law Resource Center™
= = = = = = = = = = = = = =
SAFE DATA & SOUND SOLUTIONS
0214-JO11295 © 2014 The Bureau of National Affairs, Inc.
NEW PORTFOLIOS & TREATISES NOW AVAILABLE