Embed Size (px)
Citation preview

Vadodara Institute of Engineering
Concept of Six SigmaGuided By: Prof. Ankur Joshi
Prepared by:Varia Niraj Chaturvedi Anupam
Patel Milan Rathava Gaurang
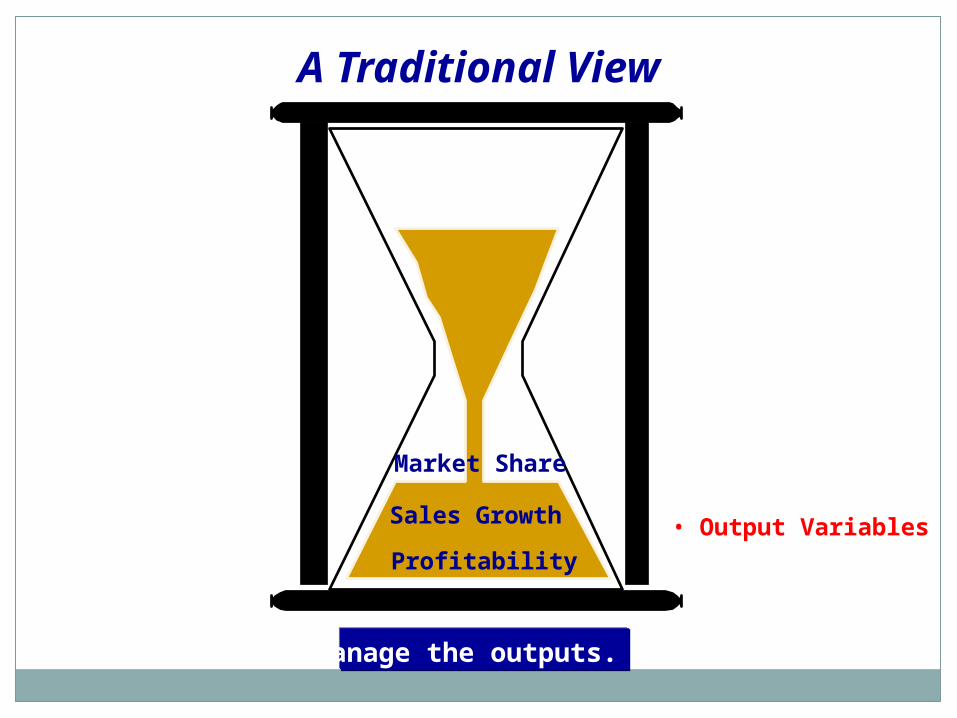
• Output Variables
Manage the outputs.
A Traditional View
Sales Growth
Market Share
Profitability

• Output Variables
• Input Variables
Manage the inputs; respond to the outputs.
A Non-traditional View
Sales Growth
Market Share
Profitability
Customer Satisfaction
Product Quality
On-Time DeliveryCOQ
Credit TermsRelationships
Service
Customer Training
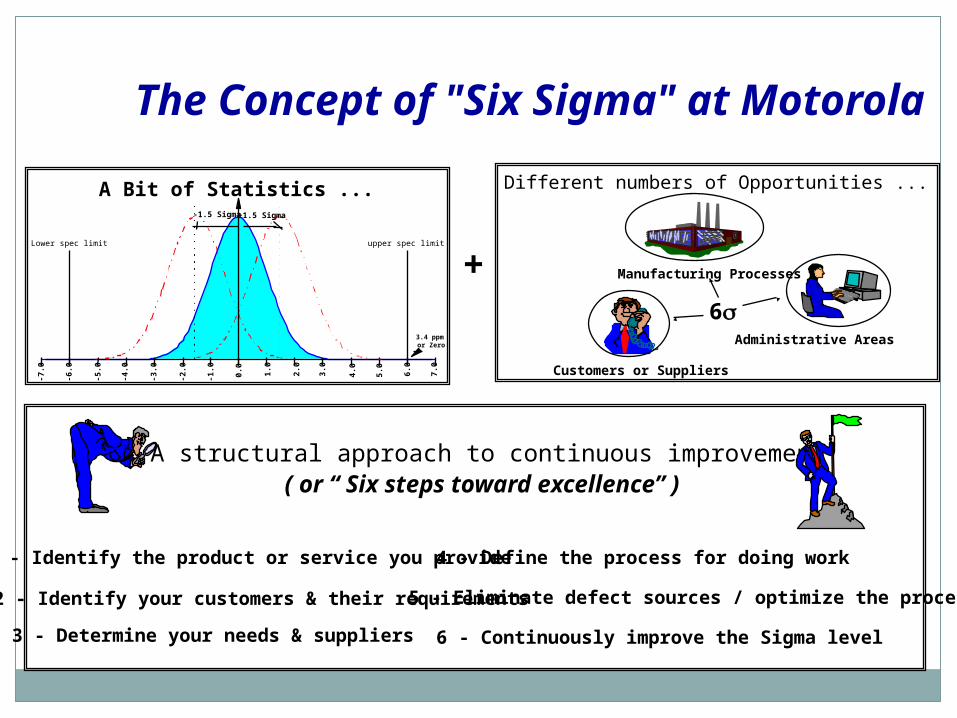
The Concept of "Six Sigma" at MotorolaDifferent numbers of Opportunities ...
Manufacturing Processes
Customers or Suppliers
Administrative Areas6
= A structural approach to continuous improvement
1 - Identify the product or service you provide
2 - Identify your customers & their requirements
3 - Determine your needs & suppliers
4 - Define the process for doing work
5 - Eliminate defect sources / optimize the process
6 - Continuously improve the Sigma level
( or “ Six steps toward excellence” )
A Bit of Statistics ...
-7.0
-6.0
-5.0
-4.0
-3.0
-2.0
-1.0 0.0
1.0
2.0
3.0
4.0
5.0
6.0
7.0
upper spec limitLower spec limit
+1.5 Sigma-1.5 Sigma
3.4 ppm or Zero
+

Six Sigma...And the Statistics
-7.0
-6.0
-5.0
-4.0
-3.0
-2.0
-1.0
0.0
1.0
2.0
3.0
4.0
5.0
6.0
7.0
+1.5 Sigma-1.5 Sigma
3.4 ppmor Zero
Upper spec. limitLower spec. limit
Reduce the variation: when < = Design specification width / 12
Stabilize the process, without affecting the variance,to limit the maximum process shift to +/- 1.5 Under these conditions, and in the worst case, there will be no more than a 3.4 ppmdefect (reject) level, with specification limits at 4.5 on one side and 7.5 on the other.
Cp > = 2 and Cpk > = 1.5
Cp > = 2

Six Sigma...And Capability
1 2 3 4 5 6 7 8
Cp 0.33 0.66 1 1.33 1.66 2 2.33 2.66
Cpk -0.16 0.16 0.5 0.83 1.16 1.5 1.83 2.16
Cp = Design specification width
6
3Cpk = Min.
Mean - Spec Limit
With a maximum process shift of +/- 1.5

Different Numbers of Opportunities ...
Manufacturing Process
Customers or Suppliers
Administra tive Areas
6
- Customers or Suppliers: One opportunity per product delivered or per component purchased.
- Manufacturing process: Opportunities at each process step)
- Administrative areas: Number of opportunities for error for each activity performed
The Opportunities...
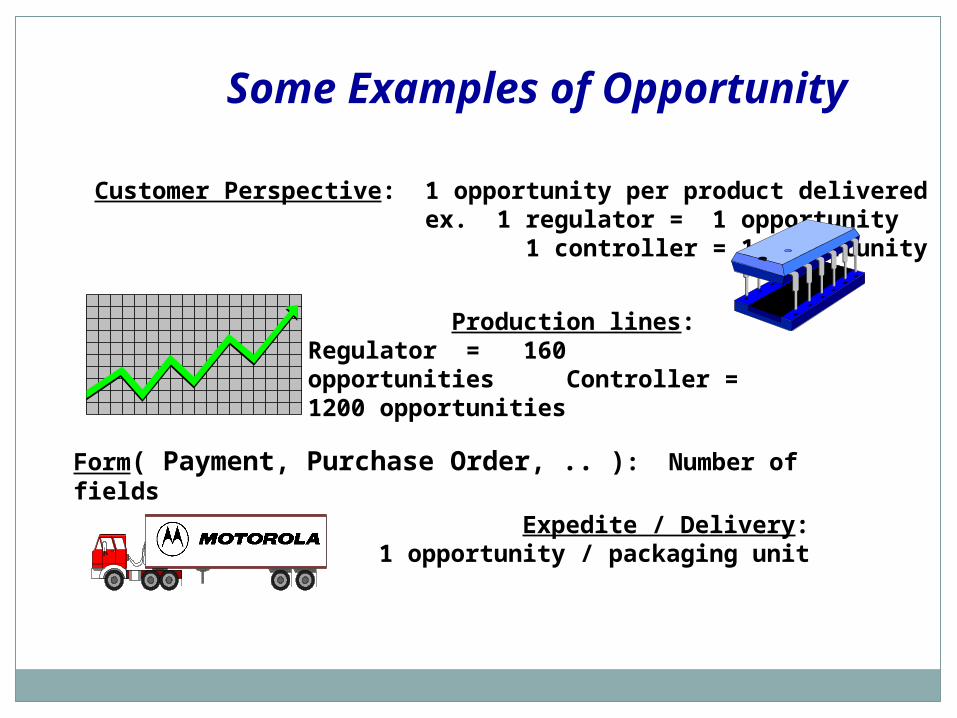
Some Examples of Opportunity
Customer Perspective: 1 opportunity per product delivered ex. 1 regulator = 1 opportunity 1 controller = 1 opportunity
Production lines: Regulator = 160 opportunities Controller = 1200 opportunities
Form( Payment, Purchase Order, .. ): Number of fields Expedite / Delivery:
1 opportunity / packaging unit

A quality level of "6" corresponds to less than 3.4 defects per million Opportunities
( i.e., correct 99.99966 % of the time )
Number of DefectsNumber of Units= D.P.U
D.P.U x 1000000
Number of Opportunities = D.P.M.Op.
Sigma and Opportunities
1 Opportunity =
D.P.M.Op
CENSO
RED
1)( 2
n
xxi �
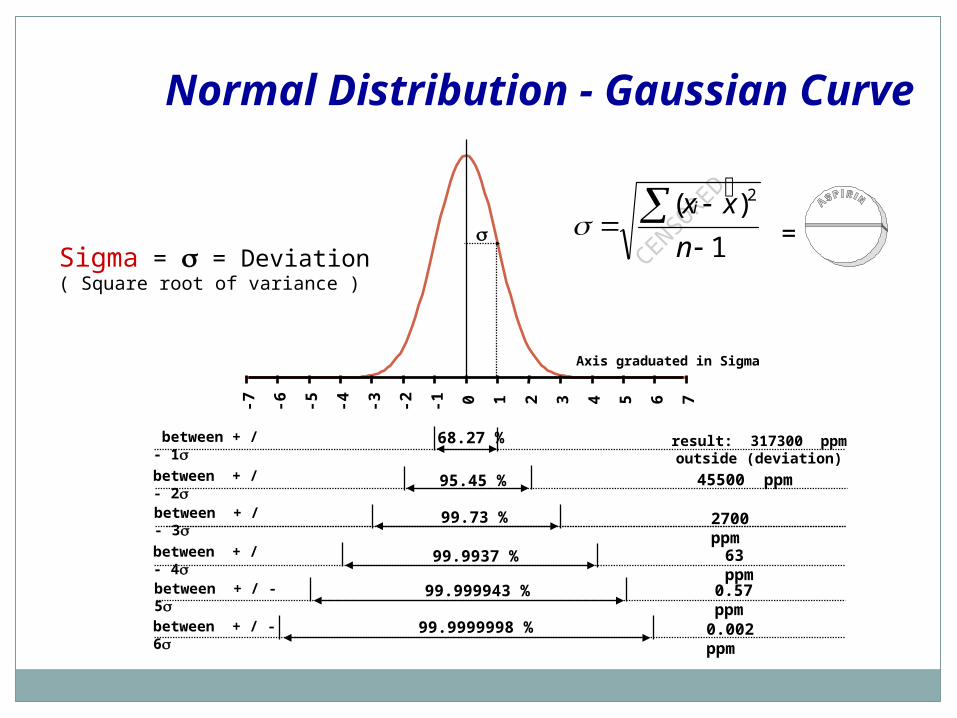
Normal Distribution - Gaussian Curve
Sigma = = Deviation ( Square root of variance )
-7 -6 -5 -4 -3 -2 -1 0 1 2 3 4 5 6 7
Axis graduated in Sigma
68.27 %
95.45 %
99.73 %
99.9937 %
99.999943 %
99.9999998 %
result: 317300 ppm outside (deviation)45500 ppm
2700 ppm
63 ppm
0.57 ppm
0.002 ppm
between + / - 1between + / - 2between + / - 3between + / - 4between + / - 5between + / - 6
=

A Universal Measurement Scale ...
34
56
7
66810
6210
233
3.4
Sigma
DPMOpOn one condition :Calculate the defects and estimate the opportunitiesin the same way...
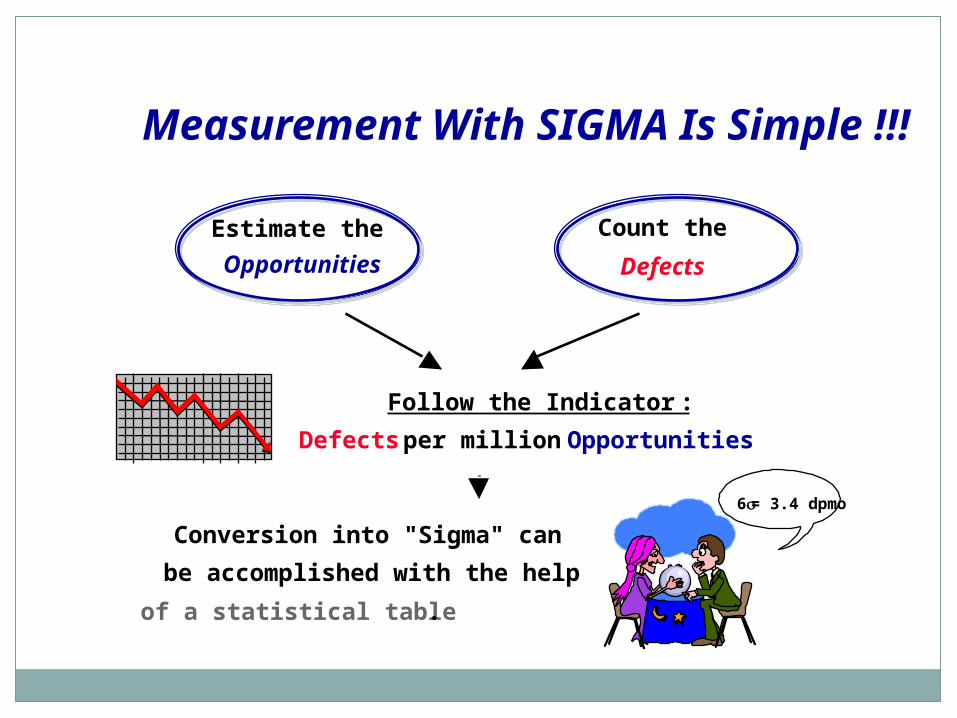
Measurement With SIGMA Is Simple !!!
Estimate theOpportunities
Count the Defects
Follow the Indicator :Defects per million Opportunities
Conversion into "Sigma" canbe accomplished with the helpof a statistical table.
6= 3.4 dpmo

Six Sigma: An Ambitious Objective?
•Accurate to 99.99966 % ( less than 3.4 defects for each millionopportunities ) could appear excessive....!
99.9% is already VERY GOOD ! But what could happen at a quality level of 99.9% (i.e., 1000 ppm),
in our everyday lives (about 4.6)? •4000 wrong medical prescriptions each year
•More than 3000 newborns accidentally falling from the hands of nurses or doctors each year
•Two long or short landings at American airports each day
•400 letters per hour which never arrive at their destination

The Impact of Quality: “6 Sigma Suppliers”
13 wrong drug prescriptions per year
10 newborn babies dropped by doctors/nurses per year
Two short or long landings per year in all the airports in the U.S.
One lost article of mail per hour
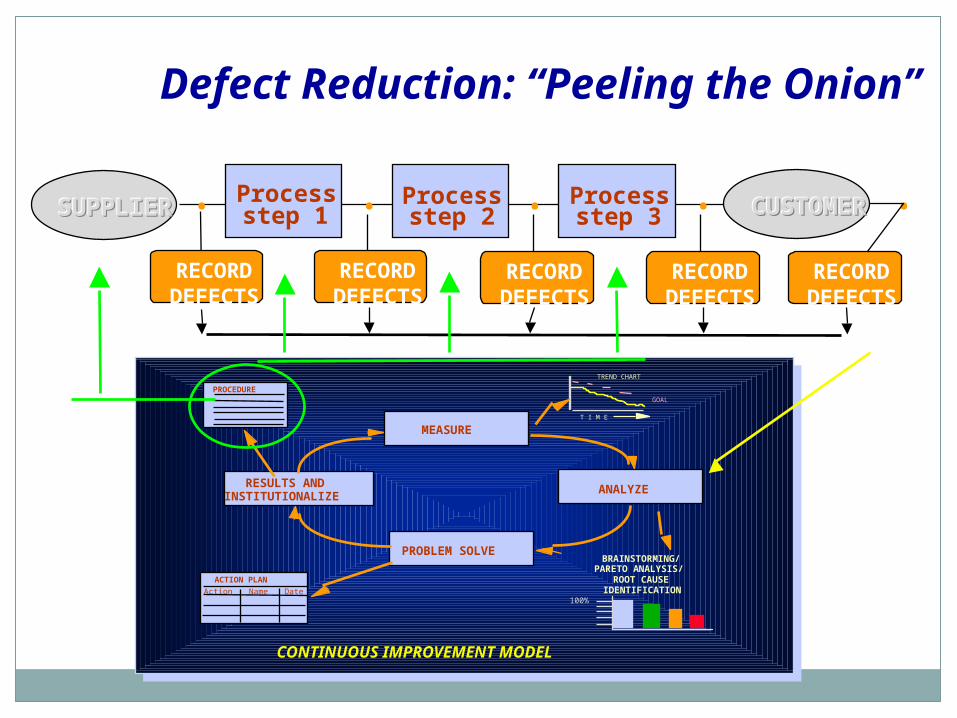
Defect Reduction: “Peeling the Onion”
•
Action Name DateACTION PLAN
PROCEDURE
CONTINUOUS IMPROVEMENT MODEL
TREND CHART
GOAL
T I M E
100%
BRAINSTORMING/PARETO ANALYSIS/
ROOT CAUSE IDENTIFICATION
RESULTS AND INSTITUTIONALIZE
MEASURE
ANALYZE
PROBLEM SOLVE
Processstep 1
Processstep 3
Processstep 2• • ••SUPPLIERSUPPLIERSUPPLIER CUSTOMERCUSTOMERCUSTOMER
RECORDDEFECTS
RECORDDEFECTS
RECORDDEFECTS
RECORDDEFECTS
RECORDDEFECTS
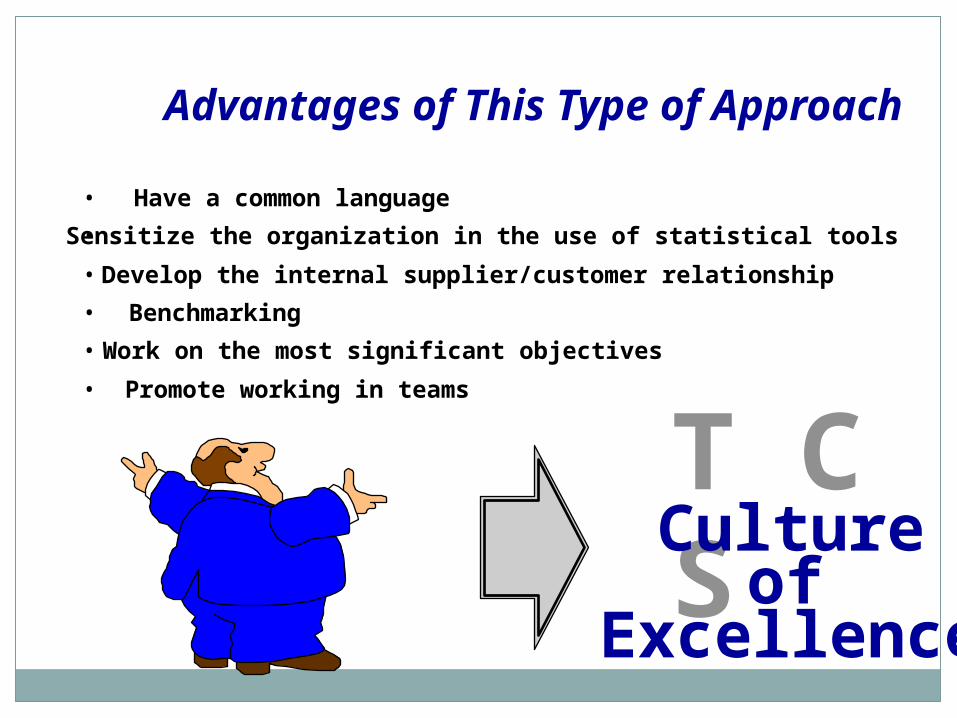
Advantages of This Type of Approach
• Have a common language• Sensitize the organization in the use of statistical tools• Develop the internal supplier/customer relationship• Benchmarking • Work on the most significant objectives • Promote working in teams
T C S Culture
ofExcellence

Use of Six Sigma Black Belts
• Highly trained in statistical tools• Act as consultants / change agents• Recognized as skilled in an engineering
discipline• Strong interpersonal and communication
skills• Significant experience with demonstrated
results• Continuous learning aptitude

History of Six Sigma Black Belt Program
1990 - Motorola DOE Symposium Committee organized 1991 - Motorola Six Sigma Research Institute established 1991 - Corporate Six Sigma Black Belt Steering
Committee formed 1992 - Initiated an effort between Motorola, TI, IBM,
Kodak and others to jointly develop the Six Sigma Black Belt Program
1992 - Six Sigma Technical Institute (SSTI) developed as a required training vehicle for Black Belt candidates
1992 - First Six Sigma Black Belts recognized in Asia and US
1993 - First Six Sigma Black Belt symposium held 1996 - SPS Six Sigma Black Belt Steering committee
formed 1996 - “Intro. to Black Belt Program” replaces SSTI as
required course 1998 - Motorola Elma leads AIEG/ACCES group wide push
for Black Belts - Reintroduces program
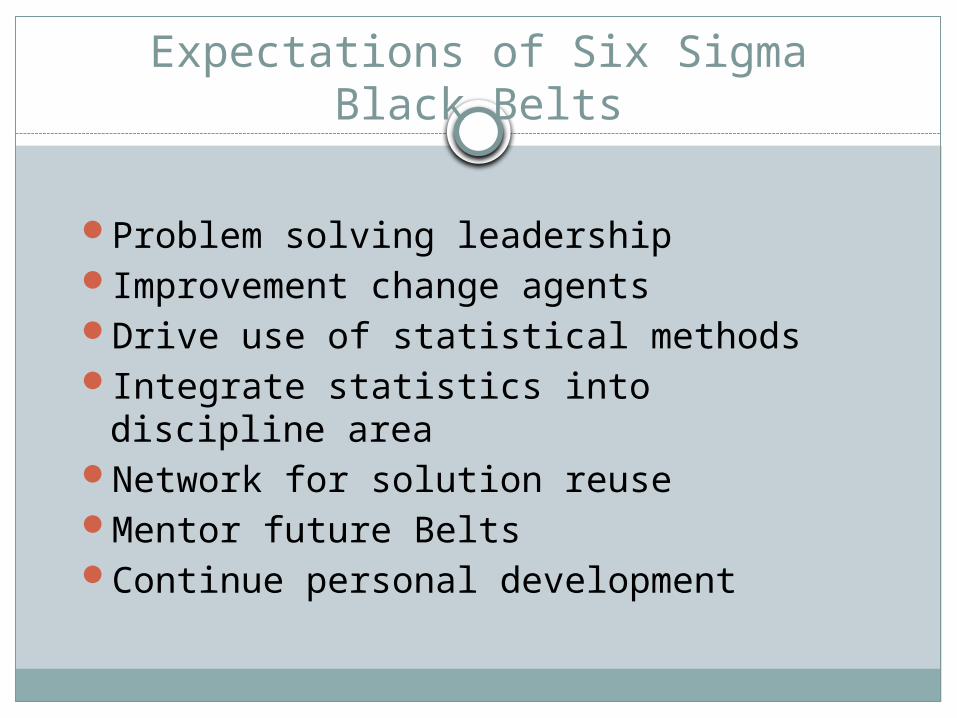
Expectations of Six Sigma Black Belts
Problem solving leadershipImprovement change agentsDrive use of statistical methodsIntegrate statistics into discipline areaNetwork for solution reuseMentor future BeltsContinue personal development

Six Sigma Black Belt Mentor Structure
Belt Sponsorship Related Projects
Master Black Belt 5 Black Belts 10 / Year
Black Belt 2 Green Belts 4 / Year
Green Belt Find 1 new Green Belt 2 / Year
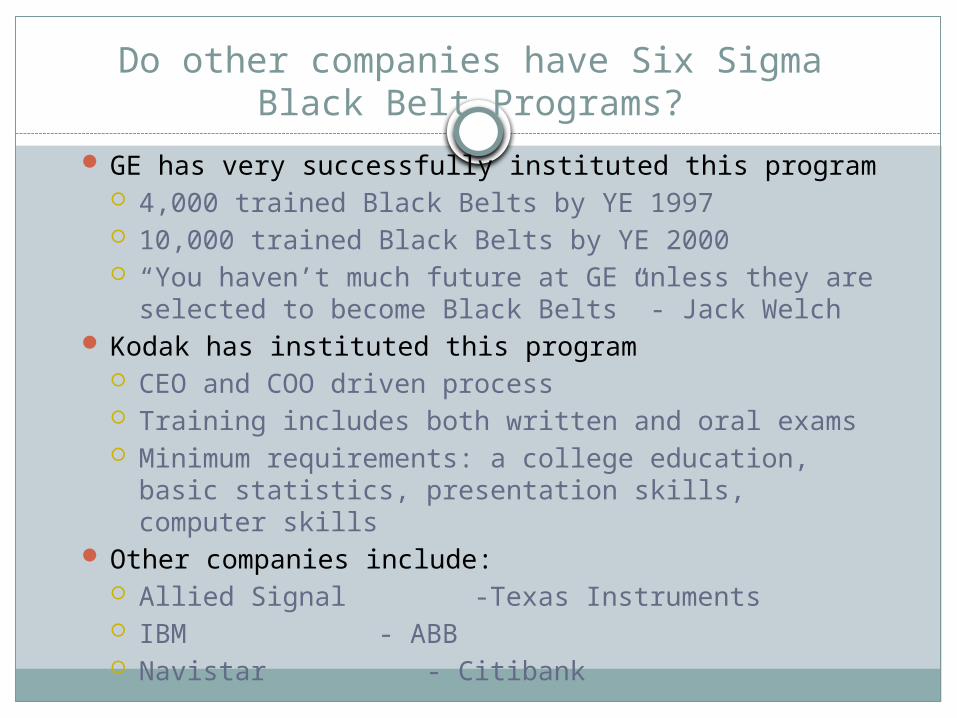
Do other companies have Six Sigma Black Belt Programs?
GE has very successfully instituted this program 4,000 trained Black Belts by YE 1997 10,000 trained Black Belts by YE 2000 “You haven’t much future at GE unless they are
selected to become Black Belts” - Jack Welch Kodak has instituted this program
CEO and COO driven process Training includes both written and oral exams Minimum requirements: a college education, basic
statistics, presentation skills, computer skills Other companies include:
Allied Signal -Texas Instruments IBM - ABB Navistar - Citibank

Companies Adopting the 6 Culture
• General Electric• Eastman Kodak• Allied Signal• Texas Instruments• Citibank• Sony• ABB• plus 30 others who have licensed
6 training

• 1997 Sales $29.8 Billion (42% / 58%)• 24th in Fortune 500• 1st in Electronics Manufacturing • 7th in Total Exports• 142,000 Employees in 53 countries
Motorola Statistics
By Product By Region
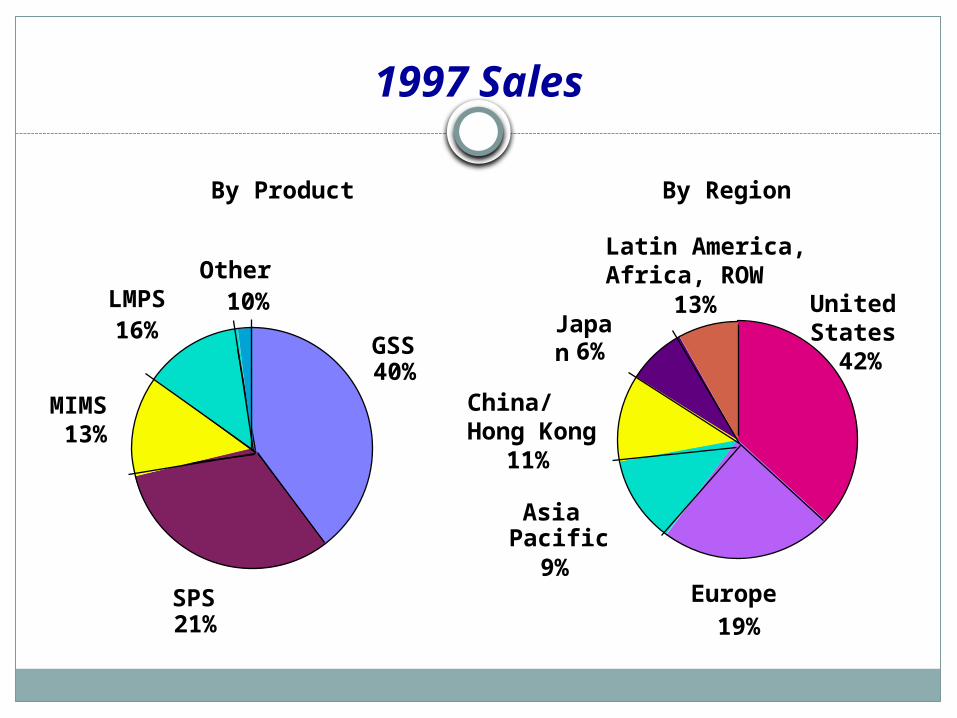
1997 Sales
GSS40%
SPS21%
LMPS16%
Other10%
MIMS 13%
Europe19%
Asia Pacific
9%
11%
Japan6%
Latin America, Africa, ROW
13%
China/Hong Kong
United States 42%
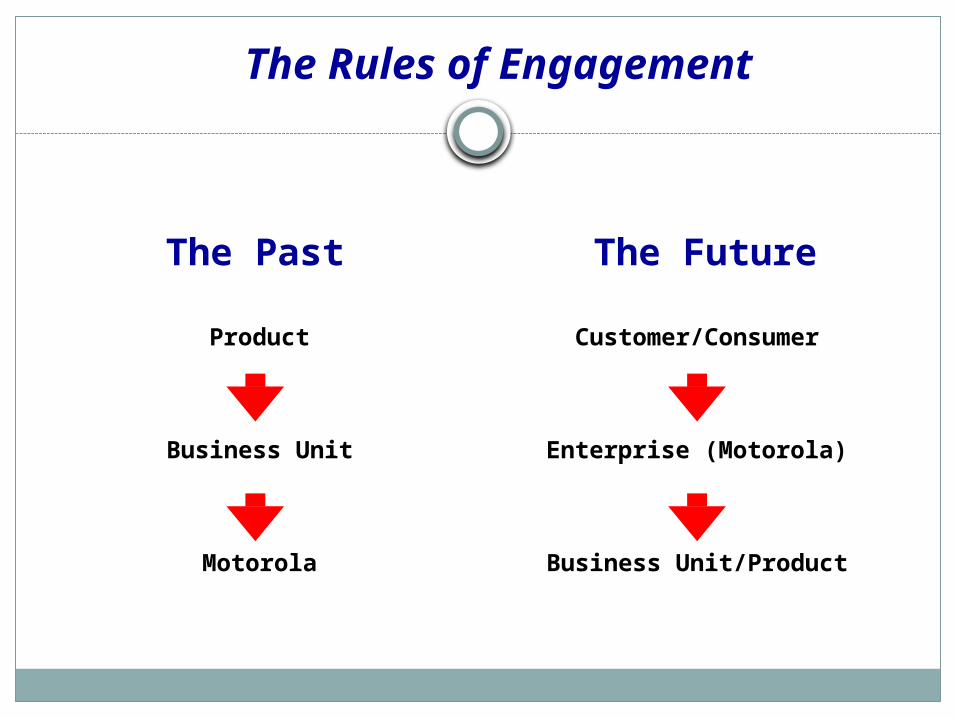
The Rules of Engagement
The Past The Future
Product
Business Unit
Motorola
Customer/Consumer
Enterprise (Motorola)
Business Unit/Product

Communications Enterprise
PERSO NALCOM M UNICAT IO NS
SECT OR
NET W O RKM ANAG EMENT
G RO UP
CO M M ERCIAL,GO VERNM ENT
AND INDUST RIALSO LUTIO NS SECT OR
NET W O RKSO LUT IO NS
SECT OR
G LOBAL T ELECOMSO LUT IO NS
G RO UP
INT ERNET ANDNET W ORKING
GRO UP
T HECO M M UNICAT IO NS
ENTERPRISE
Cellular Phones Pagers Consumer 2-Way Products Accessories
Terrestrial Network Operators Satellite Network Operators
Systems Equipment Software Services Applications Content
Cellular Infrastructures Satellite Infrastructures
Global Network Operator Solutions Integrate PCS & NSS Products
Servers S/W Applications Internet Solutions Data Networking

ACCES
AUTO M OTIVE& INDUSTRIALELECTRONICS
G RO UP
CO M PO NENTPRO DUCTS
GRO UP
ENERGYSYST EMS
G RO UP
FLAT PANELDISPLAYDIV ISION
M O TO RO LACO M PUTER
G RO UP
AUTOM O TIVE.COM PO NENT,CO M PUTER AND
ENERG Y SECT OR
Powertrain Controls Autobody Controls Sensors Telematics
Ceramics LightingQuartz Products Oscillators SAWs
Battery Products Battery Chargers Power Supplies
Flat Panel Displays Embedded Systems Single Board PCs

SPS
TRANSPORTATIONSYSTEMS
GRO UP
CONSUM ERSYSTEMS
GROUP
W IRELESSSUBSCRIBER
SYST EM S GROUP
NETW ORK ANDCOM PUTING
SYSTEM S GROUP
SEM ICO NDUCTORCOM PONENTS
GRO UP
SEM ICONDUCTORPRODUCTS
SECTOR
Systems Electronics Transportation Technology Industrial
Imaging Displays & Modems Storage Entertainment Consumer Media
Telephony Messaging Wireless New Media
Modems Switching Networking Customer Equipment Base Stations PC Technology
Key Components Distribution Contract Manufacture Emerging Markets

Motorola Products
Cellular TelephonesTwo Way CommunicationsPagersSemiconductorsAutomotive Electronic Modules and
ComponentsModems and Integrated Management SystemsCellular and Satellite Infrastructure Systems

SOUTH KOREA
Global Facilities
UNITED KINGDOM
DENMARK
GERMANY
FRANCE
JAPAN
HONG KONG
PHILIPPINES
AUSTRALIAMALAYSIA
ISRAELCOSTA RICA
MEXICO
CANADA Copenhagen
Flensburg, MunichTaunusstein, Dresden
Angers, Bordeaux, Toulouse
Aizu Wakamatsu, Tokyo, Sendai
Seoul
Kowloon
Manila
Melbourne Adelaide
Kuala LumpurPenang, Seremban
Tel AvivArad
Guadeloupe
GuadalajaraMexico CityChihuahua
Brampton,North York
Richmond
Basingstoke, Stotfold, SwindonEaster Inch, East Kilbride Cork, Swords
TAIWANChung-Li
CHINATianjin
INDIA Bangalore
BRAZILSao Paulo
SINGAPORE

Identify Customersby Organization by Key Contacts
Hierarchy Of Customer Satisfaction
GainCustomer
LoyaltyInnovation &
Implementation
ExceedCustomer Expectations
MeetCustomer Requirements
AnticipateCustomer Needs
Determine CustomerRequirements & Expectations
MISSI
ON
VISI
ON
DefensiveStrategy
MeetCommitments
OffensiveStrategy Trust
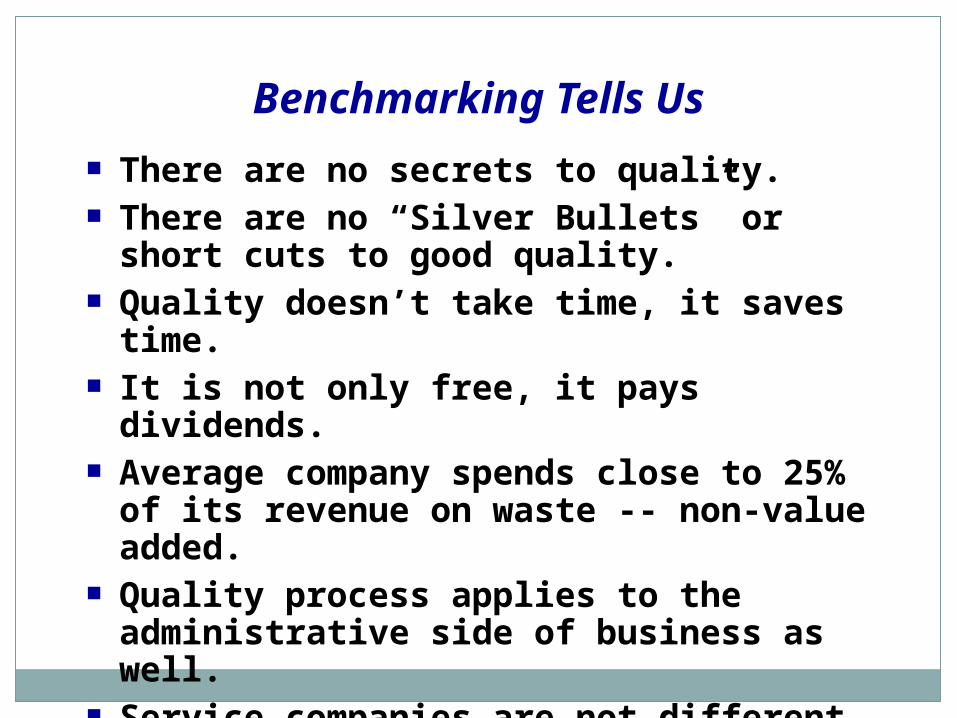
Benchmarking Tells Us There are no secrets to quality. There are no “Silver Bullets” or short
cuts to good quality. Quality doesn’t take time, it saves
time. It is not only free, it pays dividends. Average company spends close to 25%
of its revenue on waste -- non-value added.
Quality process applies to the administrative side of business as well.
Service companies are not different from manufacturing.
A Quality Plan’s Key Requirements
A methodology A metric Measure a complete
product/service Accountability
(Application -- The Customer View) and ... Reach Out Goals!!!

Actions Required to Institutionalize a Quality Process
– TOP DOWN COMMITMENT AND INVOLVEMENT• Set the example, be active in the audit process
– MEASUREMENT SYSTEM TO TRACK PROGRESS• At both macro and micro levels
– TOUGH GOAL SETTING (REACH OUT!!)• Benchmark Best-In-Class -- audit often
– PROVIDE THE REQUIRED EDUCATION• The “Why” and “How To”
– SPREAD THE SUCCESS STORIES

Other Lessons Learned
Be careful that you don’t get too focused on winning the metric game.
Be careful that you don’t loose sight of the customer’s priorities.
Be careful that you don’t become arrogant.
Look at the cost of defects, not just the number.

Qualityis not an Assignable Task
it must be Rooted and InstitutionalizedWithin every Step of the
“Business Process”IT IS EVERYONE'S RESPONSIBILITY


![01 Six Sigma Concept[1]](https://img.pdfslide.net/doc/110x75/577cca1f1a28aba711a56d1e/01-six-sigma-concept1.jpg)