Embed Size (px)
Citation preview

10 SlidesTV Doesn’t Want YouTo See

-1%
+2%
+5%
+11%
+8%
Spring 2015 Summer 2015 Fall 2015 Winter 2016 Spring 2016
Total radio listening
growth over prior year
Adults 18-49, Mon-Fri 6a-7p
Source: Spring 2015-Spring 2016 Nielsen Audio (% Change YOY from Prior Year), AQH Persons, Persons 18-49, M-F 6a-7p, 45 Portable People Meter Markets
Total AM/FM radio listening grows for five straight quarters

Adults 18-49, Mon-Fri 6a-7p
Total AM/FM listening is growing while TV viewing declines
Source: Radio: Spring 2015-Spring 2016 Nielsen Audio (% Change YOY from Prior Year), AQH Persons, Persons 18-49, M-F 6a-7p, 45 Portable
People Meter Markets. TV: Nielsen, Bernstein Research analysis, weighted average of Live+SD deliveries, Adults 18-49
-1%
+2%
+5%
+11%
+8%
-9%-8%
-6% -6%-4%
Total radio listening
growth over prior year
Total TV audience delivery
vs. prior year
Spring 2015 Fall 2015Summer 2015 Spring 2016Winter 2016
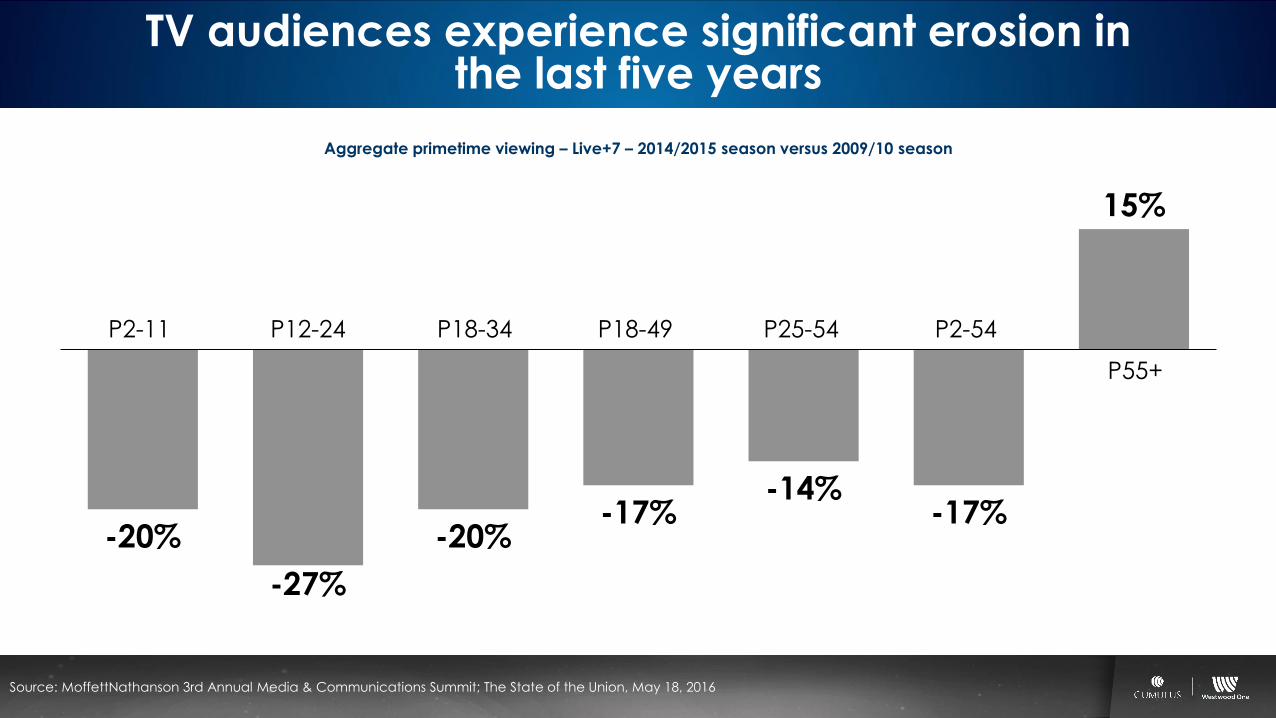
TV audiences experience significant erosion inthe last five years
Source: MoffettNathanson 3rd Annual Media & Communications Summit; The State of the Union, May 18, 2016
Aggregate primetime viewing – Live+7 – 2014/2015 season versus 2009/10 season
-20%
-27%
-20%-17%
-14%-17%
15%
P2-11 P12-24 P18-34 P18-49 P25-54 P2-54
P55+

Source: Nomura U.S. Media, September 2016
-9.2%
-6.6%
-5.7%
-8.7% -8.9%
-5.3%
-7.1%
-5.7%
-4.9%-5.4%
-2.6%
-3.8%
-7.9%
-6.7%
August
2015
September
2015
October
2015
November
2015
December
2015
January
2016
February
2016
March
2016
April
2016
May
2016
June
2016
July
2016
August
2016
September
2016
Year-over-year cable TV viewership worsens in first month following the Olympics
Cable TV total day live year-over-year monthly growth

Residential pay TV penetration is falling
Source: U.S. Census, Company reports, MoffettNathanson 3rd Annual Media & Communications Summit; The State of the Union, May 18, 2016
Residential pay TV penetration of occupied households, 2006 to present
84%
85%
85%
85%
85%
86%
86%
86%86%
87%
87%
87%
88%
88%88%
87% 87%
88%
87%
87%87%
87%87%
86% 86%
87%
86%
86% 86%
86%
86%
85%
84%
85%
84%
83%
82%
82%
79%
80%
81%
82%
83%
84%
85%
86%
87%
88%
89%
Q1 2007 Q1 2008 Q1 2009 Q1 2010 Q1 2011 Q1 2012 Q1 2013 Q1 2014 Q1 2015 Q1 2016

Cable ads are losing reach because pay TVsubscriptions are eroding
Source: BTIG Research, Video Subscriber Losses Continue to Grow #goodluckbundle, 2016
-100,000
-533,000
-926,000
January-September
2014
January-September
2015
January-September
2016
How to read: Pay TV lost 926,000 subscribers over the course of the first 9 months of 2016.
# of pay TV (cable, satellite, telecom) subscription losses

Television commercial loads are growing
Source: Pivotal Research Group 2016
Average minutes of national inventory per hour, total day
Network group Q1 2012 Q1 2016 % change
Viacom 12.1 14.7 +21%
Scripps 12.4 13.3 +7%
AMC 10.8 12.1 +12%
NBC Universal 10.3 11.1 +8%
Discovery 9.2 9.7 +5%
Fox 9.3 9.6 +3%
Time Warner 9.1 8.9 -2%
Disney 9.3 7.7 -17%
CBS 6.1 7.2 +18%

Most TV networks skew older than radio listeners
Source: MoffettNathanson 3rd Annual Media & Communications Summit; The State of the Union, May 18, 2016
Radio: Scarborough USA+ (current 6 months only) 2015 Release 2 Current (Feb 2015-Oct 2015)
Average age of network by parent company
60.057.2 57.0
48.6
54.5 53.4 51.7 51.6 50.1 50.0
35.7
26.6 24.7
CBS ABC NBC FOX Fox Cable Scripps
Networks
A&E NBC
Cable
Discovery AMC Time
Warner
Viacom Disney
Average age of
heavy radio listeners:
45
CableBroadcast network

There’s a radio format for every consumer target
Source: Scarborough USA+ (current 6 months only) 2015 Release 2 Current (Aug 2014-Oct 2015)
Average age of radio listener by format
53.350.1 47.9
44.5 43.6 43.439.8 38.1 35.6
News/talk Classic hits Sports Classic rock Country AC Urban Rock Top 40

AM/FM radio reaches more Americans than network cable
% of Americans reached by media
60%
74%
78%
93%AM/FM radio
Top 20 cable networks
Midsize cable networks
Small cable networks
1 out of 5 American homes are not reached by the top 20 cable networks
Source: Radio - Nielsen Audio Comparable Metrics Report Q2 2016. TV - Nielsen cable network universe estimates September 2016.
Cable networks ranked by average coverage rating. Top 20 cable networks, midsize 21-51, small 52-82

All concepts property of Westwood One and may not be used without permission or agreed upon spending levels. Details pending partner and talent approval and subject to revision. © 2016-2017 Westwood One, Inc.
Thank You