Embed Size (px)
Citation preview
2017 Edelman
Trust BarometerMalaysia
1
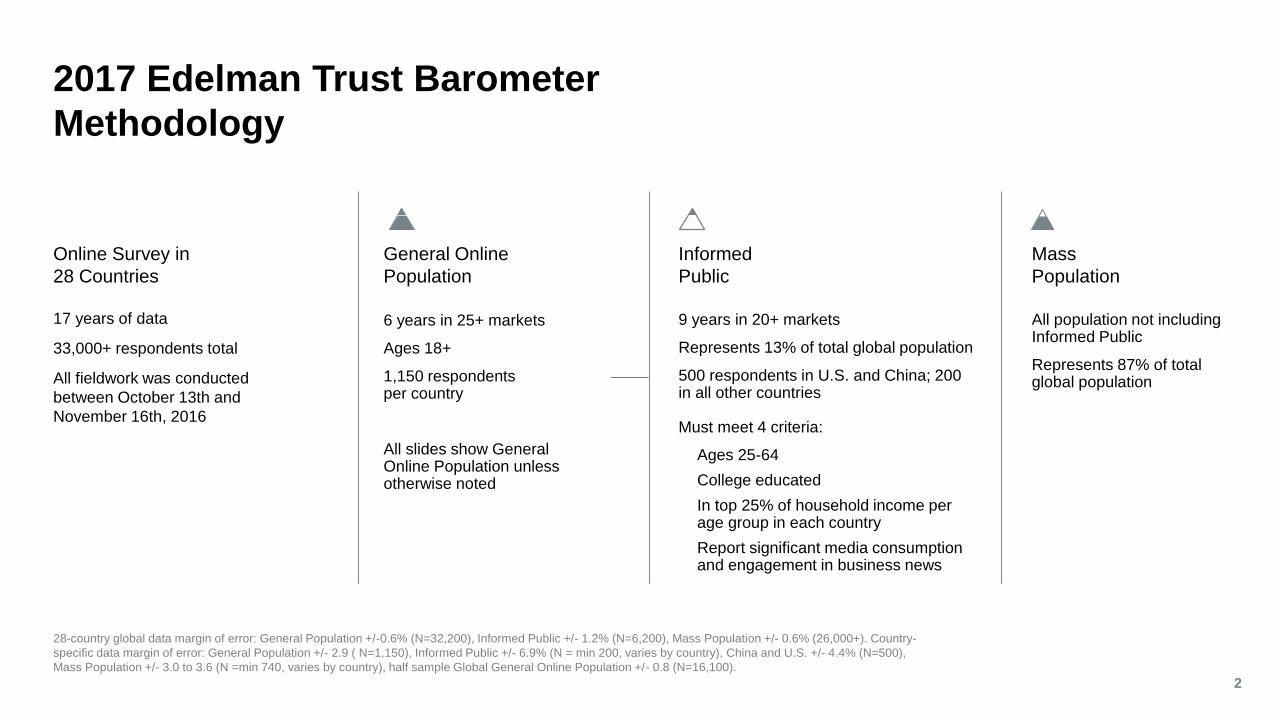
Informed
Public
9 years in 20+ markets
Represents 13% of total global population
500 respondents in U.S. and China; 200 in all other countries
Must meet 4 criteria:
Ages 25-64
College educated
In top 25% of household income per age group in each country
Report significant media consumption and engagement in business news
General Online
Population
6 years in 25+ markets
Ages 18+
1,150 respondents per country
All slides show General Online Population unless otherwise noted
2017 Edelman Trust Barometer
Methodology
28-country global data margin of error: General Population +/-0.6% (N=32,200), Informed Public +/- 1.2% (N=6,200), Mass Population +/- 0.6% (26,000+). Country-
specific data margin of error: General Population +/- 2.9 ( N=1,150), Informed Public +/- 6.9% (N = min 200, varies by country), China and U.S. +/- 4.4% (N=500),
Mass Population +/- 3.0 to 3.6 (N =min 740, varies by country), half sample Global General Online Population +/- 0.8 (N=16,100).
2
17 years of data
33,000+ respondents total
All fieldwork was conducted
between October 13th and
November 16th, 2016
Online Survey in
28 Countries
Mass
Population
All population not including Informed Public
Represents 87% of total global population
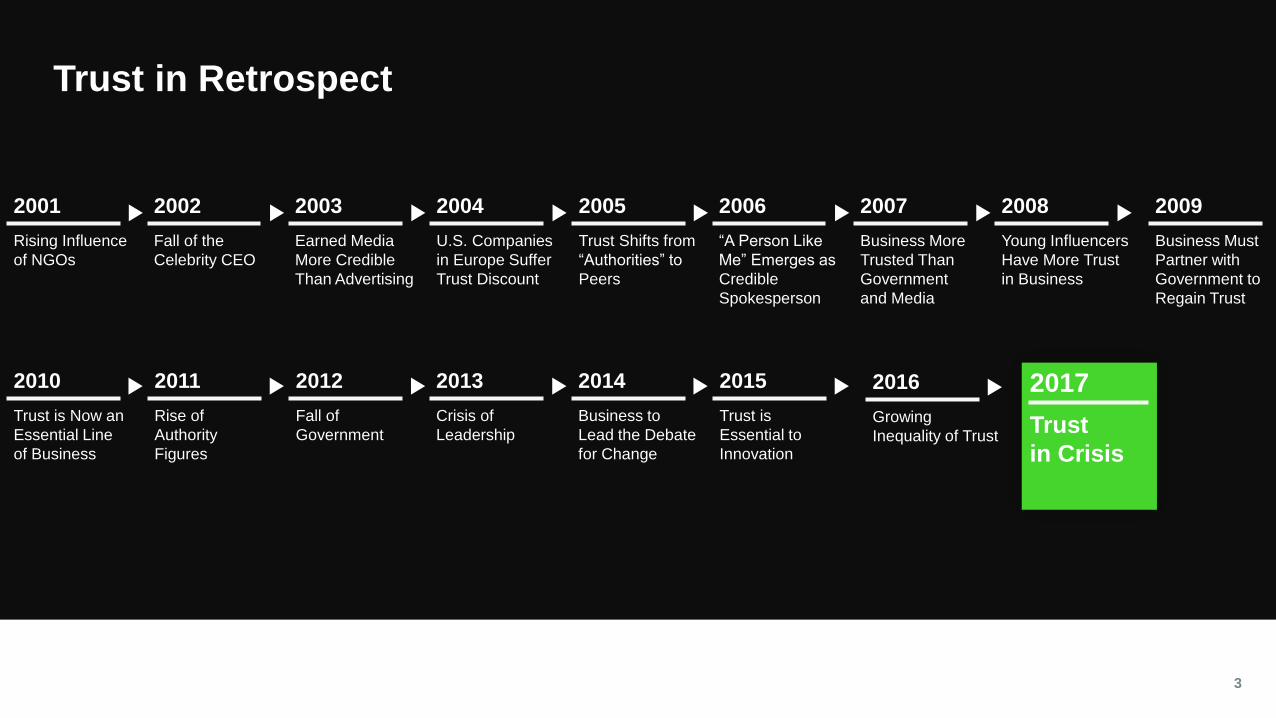
Trust in Retrospect
3
Rising Influence
of NGOs
2001
Business Must
Partner with
Government to
Regain Trust
2009
Fall of the
Celebrity CEO
2002
Earned Media
More Credible
Than Advertising
2003
U.S. Companies
in Europe Suffer
Trust Discount
2004
Trust Shifts from
“Authorities” to
Peers
2005
“A Person Like
Me” Emerges as
Credible
Spokesperson
2006
Business More
Trusted Than
Government
and Media
2007
Young Influencers
Have More Trust
in Business
2008
Trust is Now an
Essential Line
of Business
2010
Rise of
Authority
Figures
2011
Fall of
Government
2012
Crisis of
Leadership
2013
Business to
Lead the Debate
for Change
2014
Trust is
Essential to
Innovation
2015
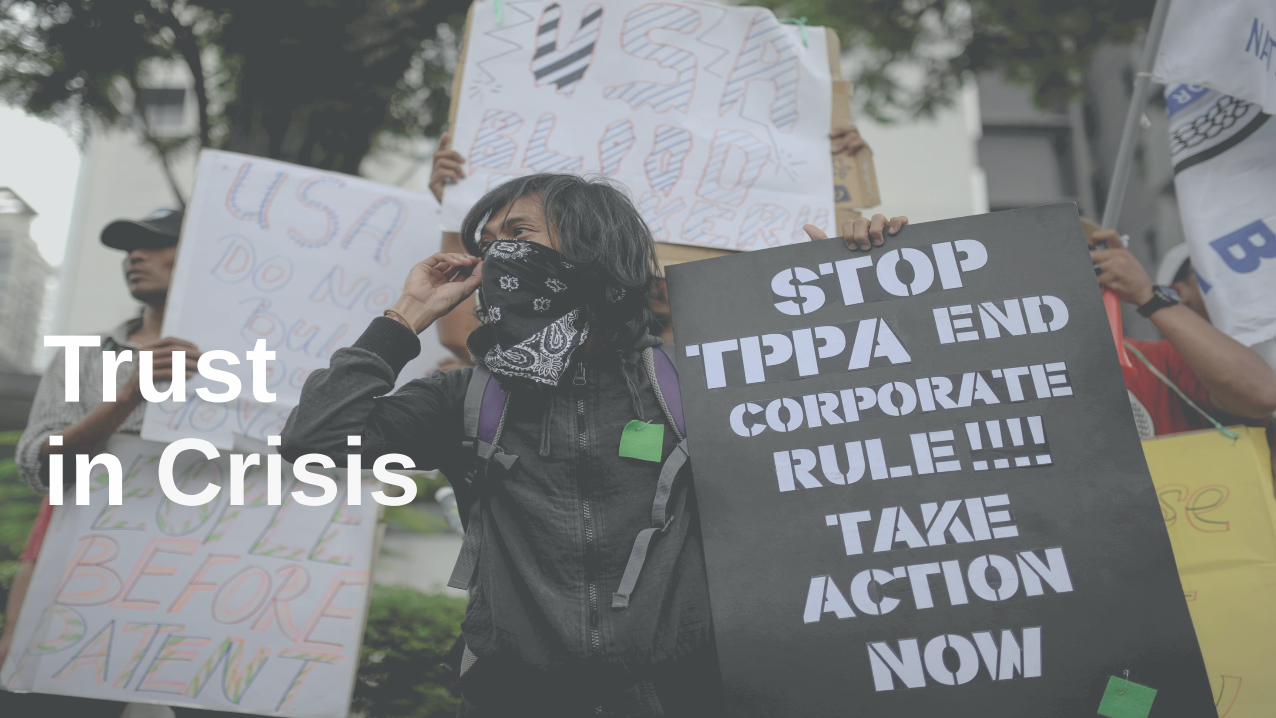
Trust
in Crisis
2017Growing
Inequality of Trust
2016
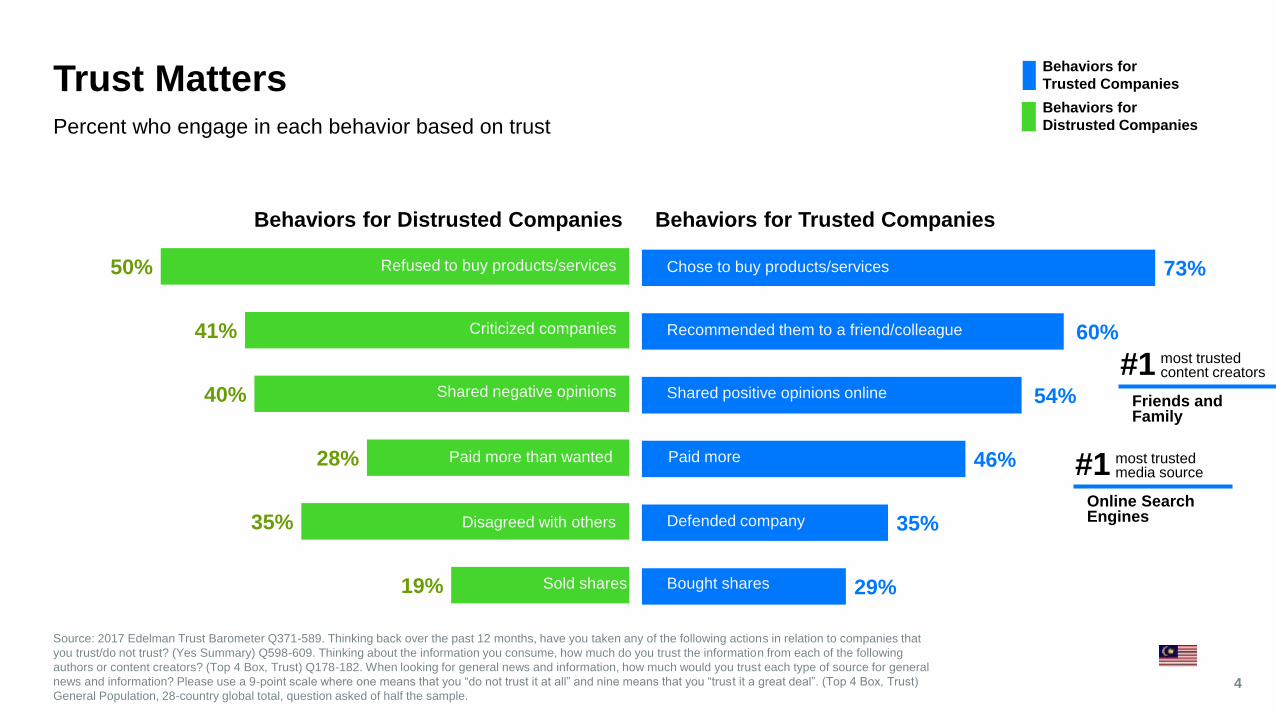
73%
60%
54%
46%
35%
29%
50%
41%
40%
28%
35%
19%
Trust Matters
Source: 2017 Edelman Trust Barometer Q371-589. Thinking back over the past 12 months, have you taken any of the following actions in relation to companies that
you trust/do not trust? (Yes Summary) Q598-609. Thinking about the information you consume, how much do you trust the information from each of the following
authors or content creators? (Top 4 Box, Trust) Q178-182. When looking for general news and information, how much would you trust each type of source for general
news and information? Please use a 9-point scale where one means that you “do not trust it at all” and nine means that you “trust it a great deal”. (Top 4 Box, Trust)
General Population, 28-country global total, question asked of half the sample.4
Percent who engage in each behavior based on trust
Behaviors for Distrusted Companies Behaviors for Trusted Companies
Refused to buy products/services
Criticized companies
Shared negative opinions
Disagreed with others
Paid more than wanted
Sold shares
Chose to buy products/services
Recommended them to a friend/colleague
Shared positive opinions online
Defended company
Paid more
Bought shares
most trusted content creators #1
Friends and Family
most trusted media source #1
Online Search Engines
Behaviors for
Trusted Companies
Behaviors for
Distrusted Companies
Trust in Crisis
How much do you
trust each institution
to do what is right?
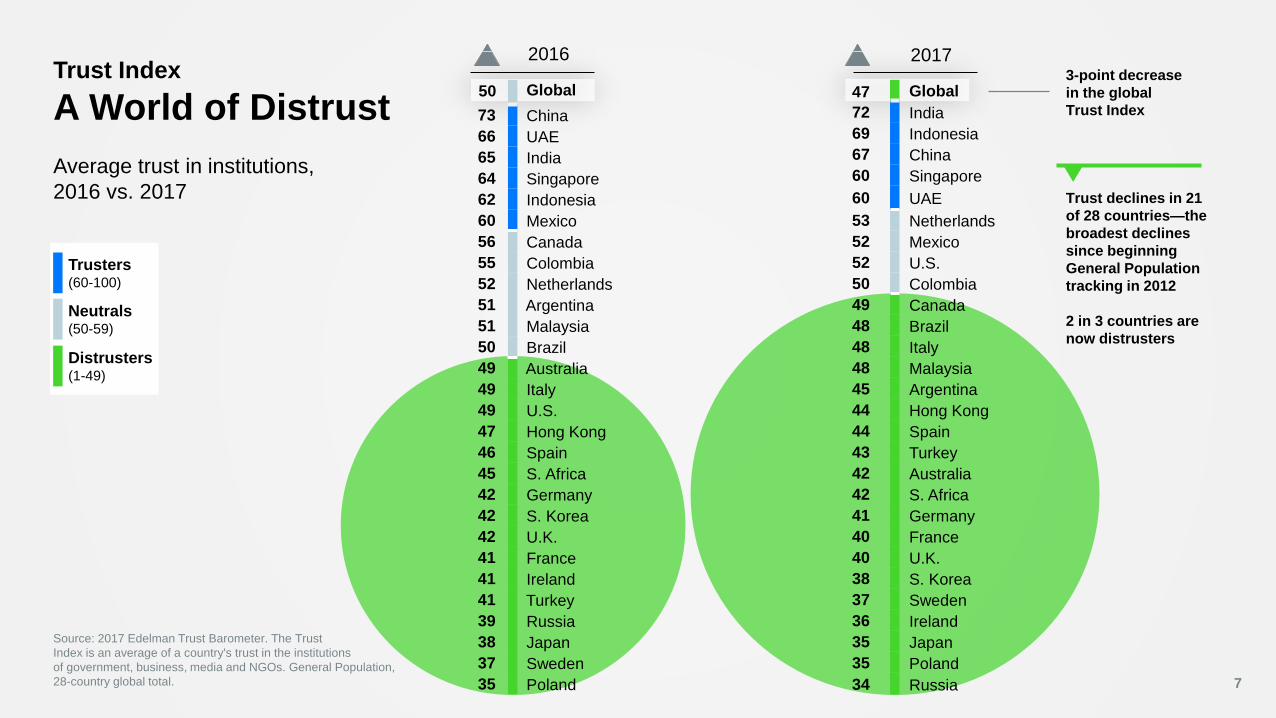
Trust Index
A World of Distrust
Average trust in institutions,
2016 vs. 2017
7
47 Global
72 India
69 Indonesia
67 China
60 Singapore
60 UAE
53 Netherlands
52 Mexico
52 U.S.
50 Colombia
49 Canada
48 Brazil
48 Italy
48 Malaysia
45 Argentina
44 Hong Kong
44 Spain
43 Turkey
42 Australia
42 S. Africa
41 Germany
40 France
40 U.K.
38 S. Korea
37 Sweden
36 Ireland
35 Japan
35 Poland
34 Russia
2016 2017
50 Global
73 China
66 UAE
65 India
64 Singapore
62 Indonesia
60 Mexico
56 Canada
55 Colombia
52 Netherlands
51 Argentina
51 Malaysia
50 Brazil
49 Australia
49 Italy
49 U.S.
47 Hong Kong
46 Spain
45 S. Africa
42 Germany
42 S. Korea
42 U.K.
41 France
41 Ireland
41 Turkey
39 Russia
38 Japan
37 Sweden
35 Poland
Trusters(60-100)
Neutrals(50-59)
Distrusters (1-49)
Source: 2017 Edelman Trust Barometer. The Trust
Index is an average of a country's trust in the institutions
of government, business, media and NGOs. General Population,
28-country global total.
3-point decrease
in the global
Trust Index
Trust declines in 21
of 28 countries—the
broadest declines
since beginning
General Population
tracking in 2012
2 in 3 countries are
now distrusters
45 Global
70 India
67 Indonesia
62 China
59 Singapore
59 UAE
52 Netherlands
50 Colombia
50 Mexico
47 Brazil
47 Canada
47 Italy
47 Malaysia
47 U.S.
45 Argentina
42 Hong Kong
41 S. Africa
41 Spain
41 Turkey
40 Australia
39 Germany
38 France
37 U.K.
36 S. Korea
36 Sweden
35 Ireland
34 Japan
34 Poland
31 Russia
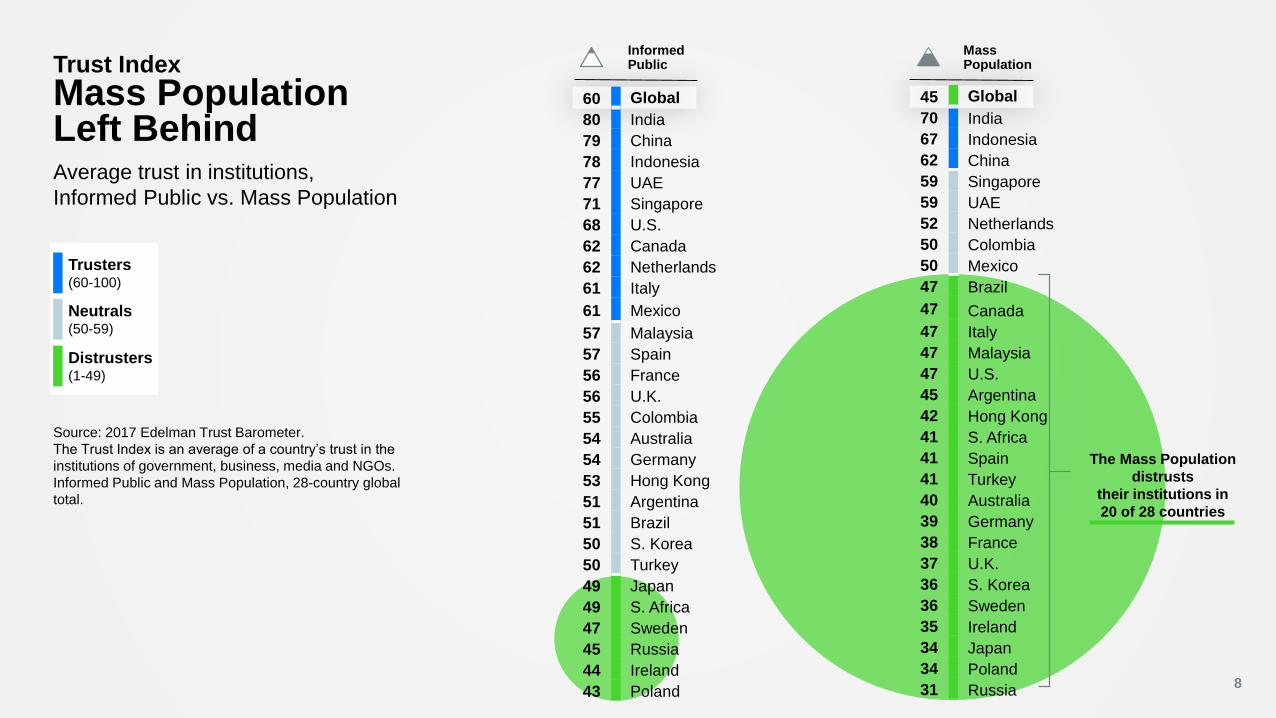
Trust Index
Mass Population Left BehindAverage trust in institutions,
Informed Public vs. Mass Population
The Mass Population
distrusts
their institutions in
20 of 28 countries
Source: 2017 Edelman Trust Barometer.
The Trust Index is an average of a country’s trust in the
institutions of government, business, media and NGOs.
Informed Public and Mass Population, 28-country global
total.
MassPopulation
InformedPublic
8
60 Global
80 India
79 China
78 Indonesia
77 UAE
71 Singapore
68 U.S.
62 Canada
62 Netherlands
61 Italy
61 Mexico
57 Malaysia
57 Spain
56 France
56 U.K.
55 Colombia
54 Australia
54 Germany
53 Hong Kong
51 Argentina
51 Brazil
50 S. Korea
50 Turkey
49 Japan
49 S. Africa
47 Sweden
45 Russia
44 Ireland
43 Poland
Trusters (60-100)
Neutrals (50-59)
Distrusters (1-49)
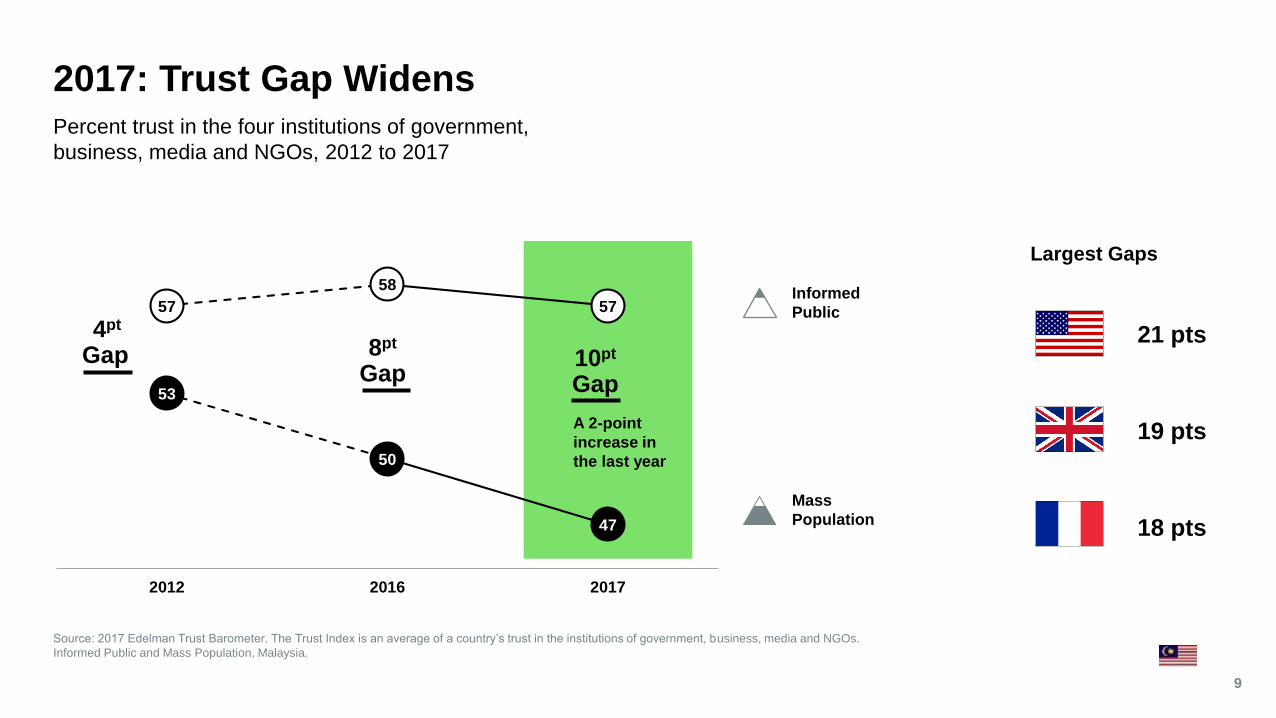
2017: Trust Gap Widens
Source: 2017 Edelman Trust Barometer. The Trust Index is an average of a country’s trust in the institutions of government, business, media and NGOs.
Informed Public and Mass Population, Malaysia.
9
Percent trust in the four institutions of government,
business, media and NGOs, 2012 to 2017
21 pts
19 pts
18 pts
57
58
57
53
50
47
2012 2016 2017
Informed
Public
10pt
Gap
4pt
Gap
A 2-point
increase in
the last year
8pt
Gap
Largest Gaps
Mass
Population
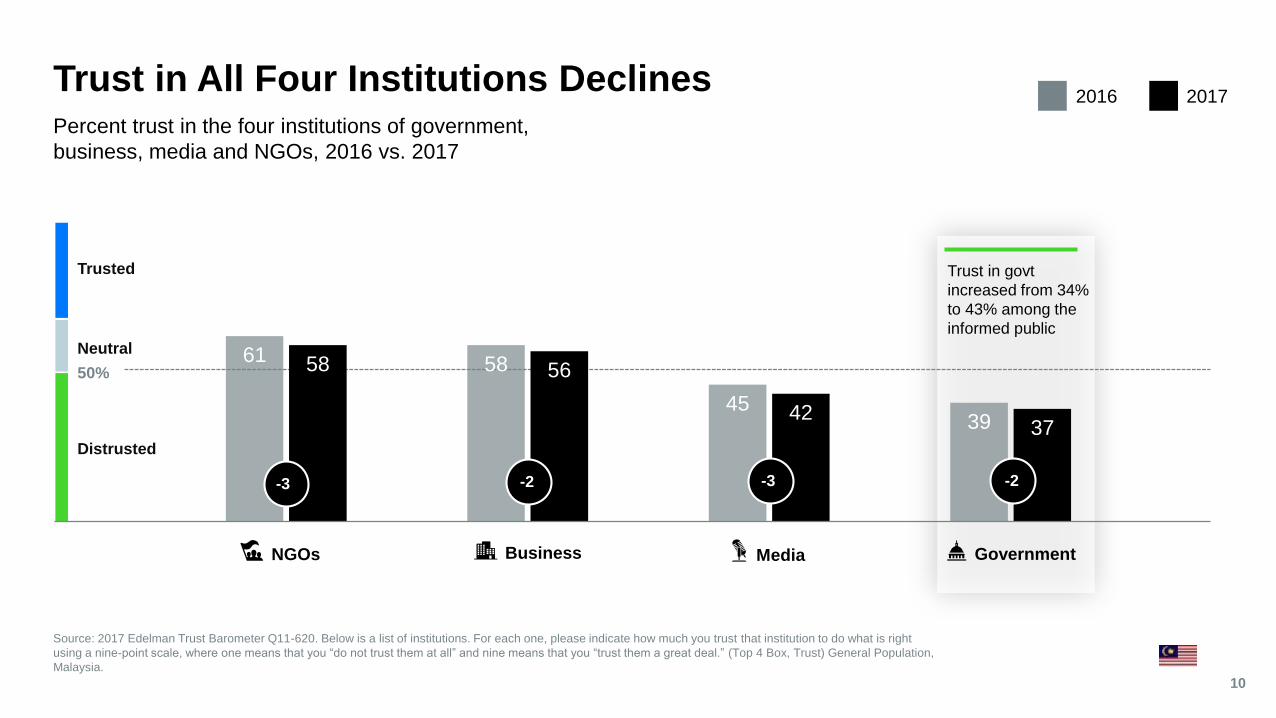
61 58
4539
58 56
4237
Trust in All Four Institutions Declines
Source: 2017 Edelman Trust Barometer Q11-620. Below is a list of institutions. For each one, please indicate how much you trust that institution to do what is right
using a nine-point scale, where one means that you “do not trust them at all” and nine means that you “trust them a great deal.” (Top 4 Box, Trust) General Population,
Malaysia.
10
Percent trust in the four institutions of government,
business, media and NGOs, 2016 vs. 2017
Business MediaNGOs Government
Trust in govt
increased from 34%
to 43% among the
informed public
50%
Neutral
Trusted
Distrusted
-3 -2 -3 -2
20172016
The SystemIs Broken
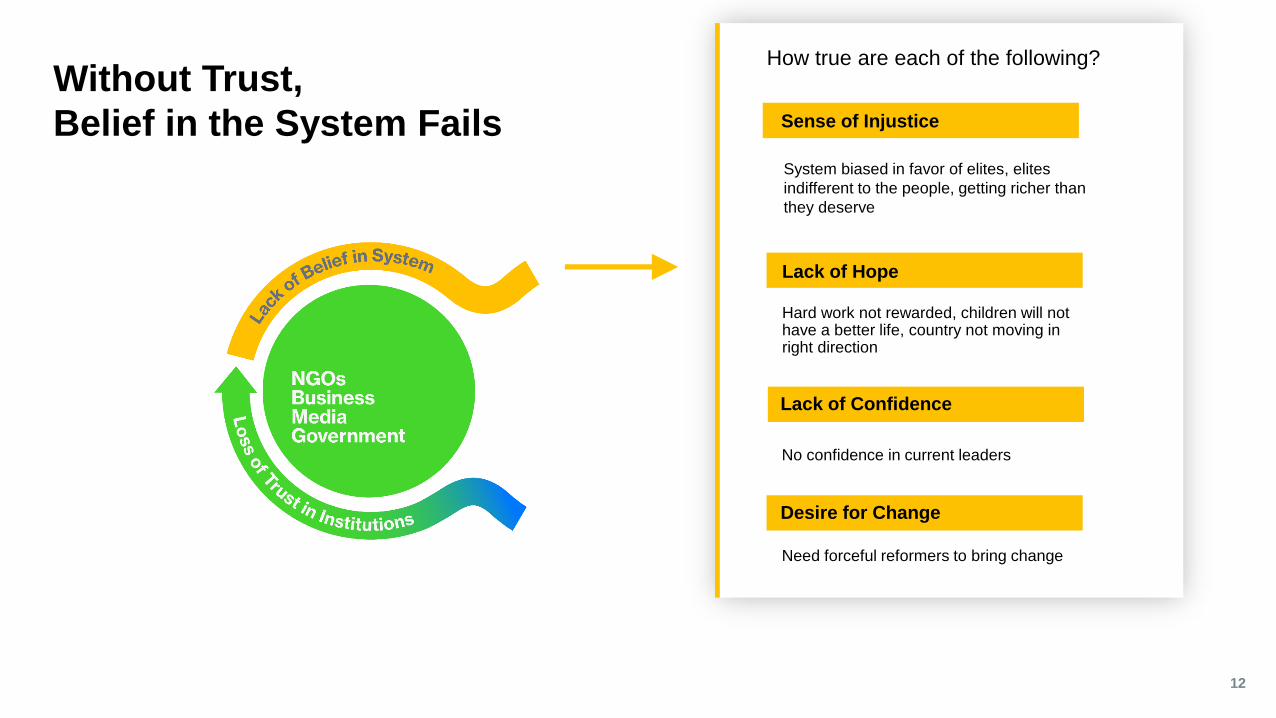
Without Trust,
Belief in the System Fails
12
How true are each of the following?
Sense of Injustice
Desire for Change
Need forceful reformers to bring change
Lack of Confidence
No confidence in current leaders
Lack of Hope
Hard work not rewarded, children will not have a better life, country not moving in right direction
System biased in favor of elites, elites
indifferent to the people, getting richer than
they deserve
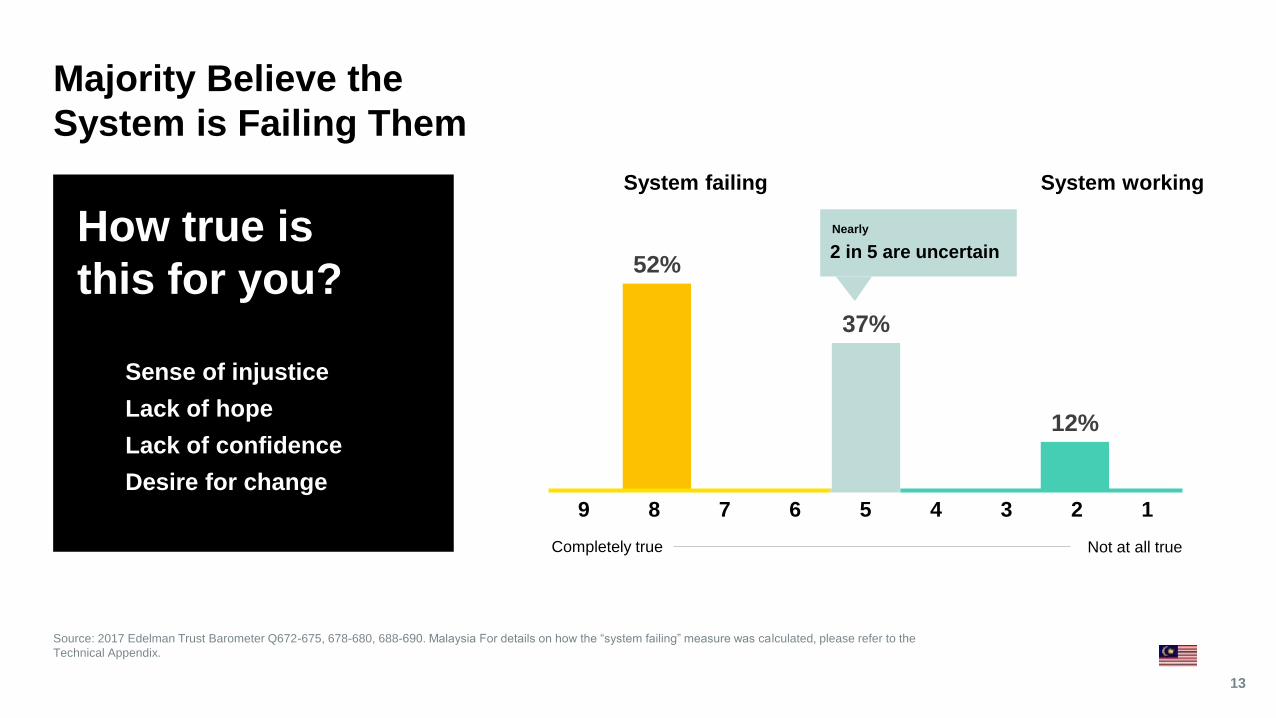
How true is
this for you?
Sense of injustice
Lack of hope
Lack of confidence
Desire for change
52%
37%
12%
Majority Believe the
System is Failing Them
Source: 2017 Edelman Trust Barometer Q672-675, 678-680, 688-690. Malaysia For details on how the “system failing” measure was calculated, please refer to the
Technical Appendix.
13
Not at all true
9 8 7 6 5 4 3 2 1
2 in 5 are uncertain
Completely true
System failing System working
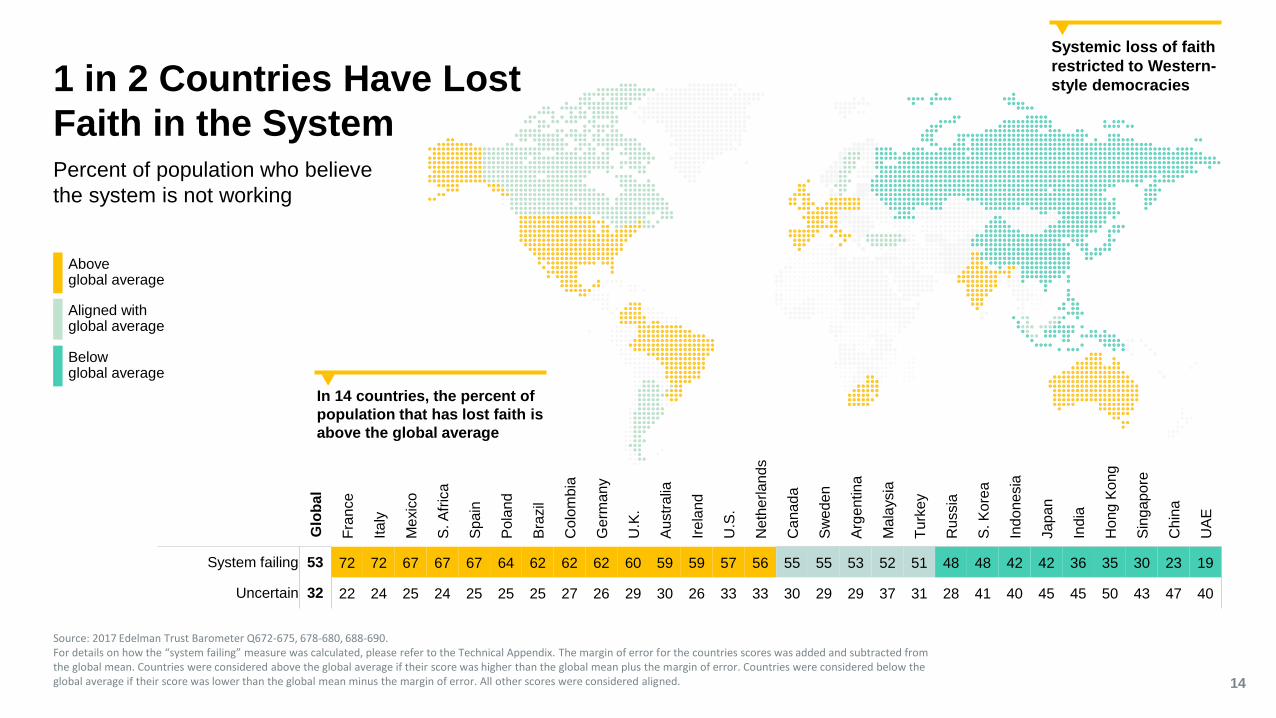
Nearly
Source: 2017 Edelman Trust Barometer Q672-675, 678-680, 688-690. For details on how the “system failing” measure was calculated, please refer to the Technical Appendix. The margin of error for the countries scores was added and subtracted from the global mean. Countries were considered above the global average if their score was higher than the global mean plus the margin of error. Countries were considered below the global average if their score was lower than the global mean minus the margin of error. All other scores were considered aligned. 14
Glo
ba
l
Fra
nce
Ita
ly
Me
xic
o
S. A
fric
a
Sp
ain
Po
land
Bra
zil
Co
lom
bia
Ge
rma
ny
U.K
.
Au
str
alia
Ire
land
U.S
.
Ne
the
rla
nd
s
Ca
na
da
Sw
ede
n
Arg
entin
a
Ma
laysia
Tu
rke
y
Ru
ssia
S. K
ore
a
Indo
ne
sia
Ja
pa
n
India
Ho
ng
Ko
ng
Sin
ga
po
re
Ch
ina
UA
E
System failing 53 72 72 67 67 67 64 62 62 62 60 59 59 57 56 55 55 53 52 51 48 48 42 42 36 35 30 23 19
Uncertain 32 22 24 25 24 25 25 25 27 26 29 30 26 33 33 30 29 29 37 31 28 41 40 45 45 50 43 47 40
In 14 countries, the percent of
population that has lost faith is
above the global average
Systemic loss of faith
restricted to Western-
style democracies1 in 2 Countries Have Lost
Faith in the SystemPercent of population who believe
the system is not working
Above global average
Aligned withglobal average
Belowglobal average
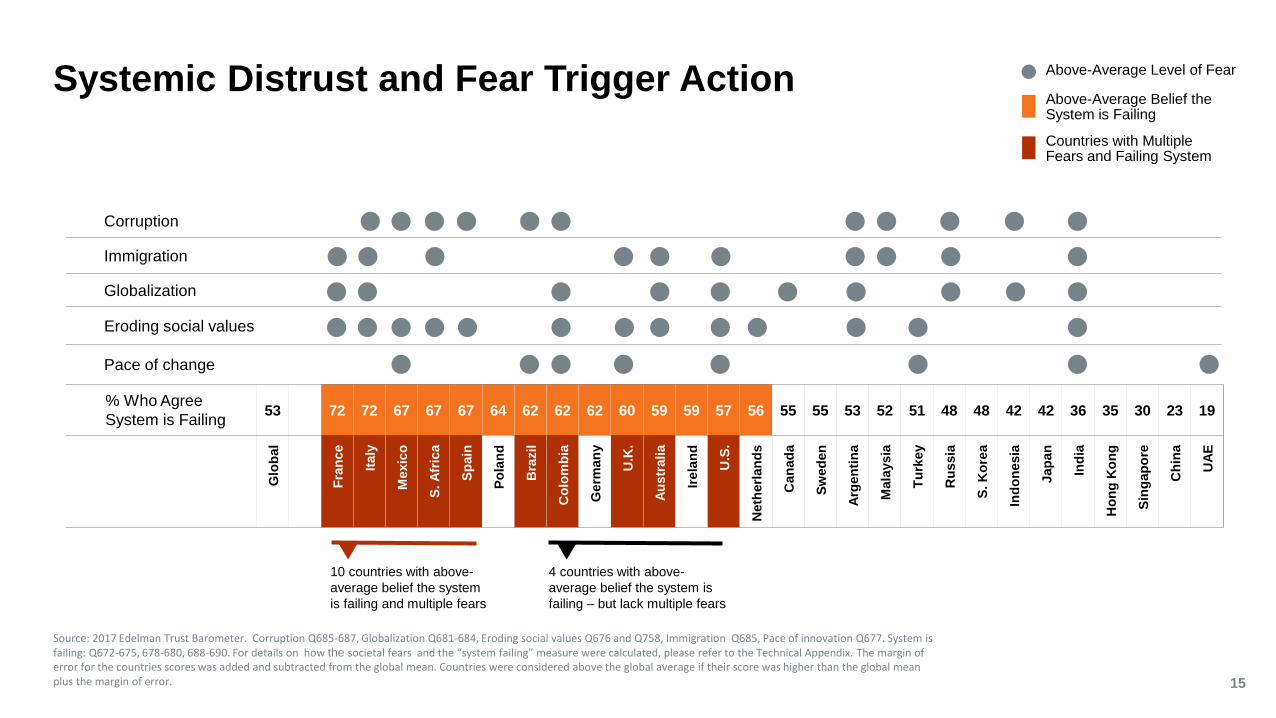
Systemic Distrust and Fear Trigger Action
Source: 2017 Edelman Trust Barometer. Corruption Q685-687, Globalization Q681-684, Eroding social values Q676 and Q758, Immigration Q685, Pace of innovation Q677. System is failing: Q672-675, 678-680, 688-690. For details on how the societal fears and the “system failing” measure were calculated, please refer to the Technical Appendix. The margin of error for the countries scores was added and subtracted from the global mean. Countries were considered above the global average if their score was higher than the global mean plus the margin of error. 15
% Who Agree
System is Failing53 72 72 67 67 67 64 62 62 62 60 59 59 57 56 55 55 53 52 51 48 48 42 42 36 35 30 23 19
Glo
bal
Fra
nce
Italy
Mexic
o
S. A
fric
a
Sp
ain
Po
lan
d
Bra
zil
Co
lom
bia
Germ
an
y
U.K
.
Au
str
alia
Irela
nd
U.S
.
Neth
erl
an
ds
Can
ad
a
Sw
ed
en
Arg
en
tin
a
Mala
ysia
Tu
rkey
Ru
ssia
S. K
ore
a
Ind
on
esia
Jap
an
Ind
ia
Ho
ng
Ko
ng
Sin
gap
ore
Ch
ina
UA
E
Above-Average Level of Fear
Above-Average Belief the System is Failing
Countries with Multiple Fears and Failing System
10 countries with above-
average belief the system
is failing and multiple fears
4 countries with above-
average belief the system is
failing – but lack multiple fears
Corruption
Immigration
Globalization
Eroding social values
Pace of change
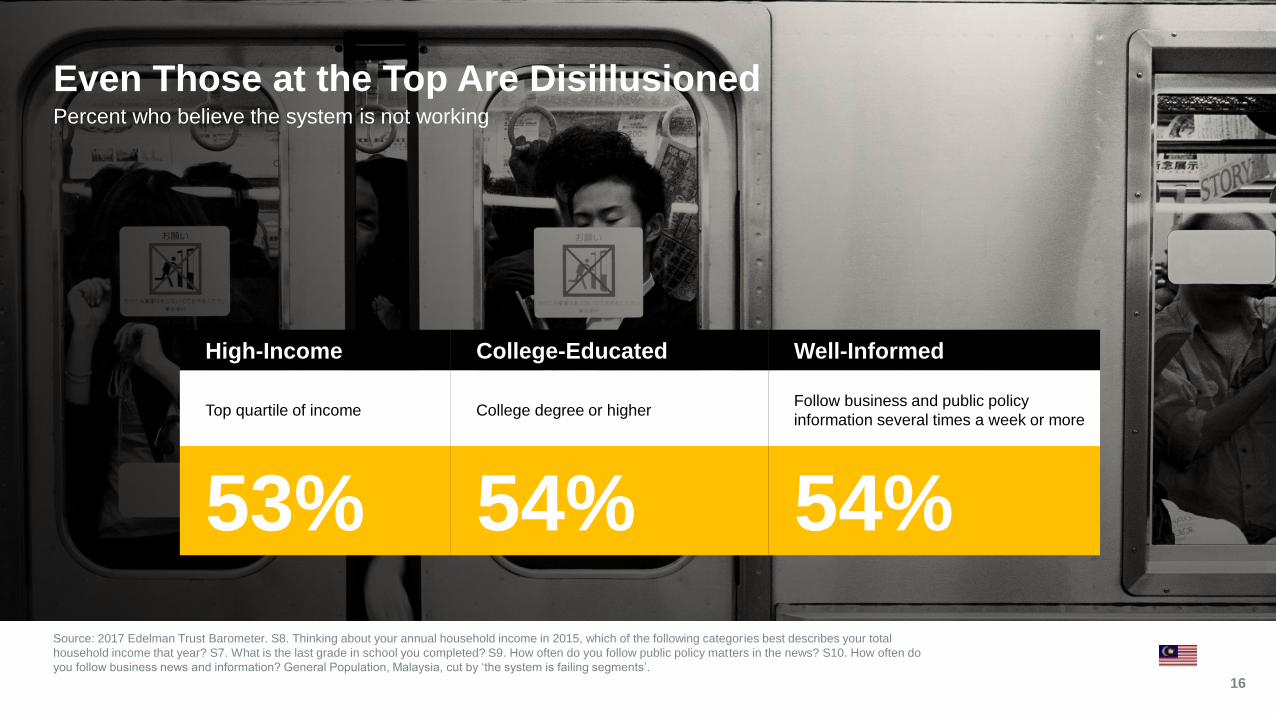
Even Those at the Top Are DisillusionedPercent who believe the system is not working
Source: 2017 Edelman Trust Barometer. S8. Thinking about your annual household income in 2015, which of the following categories best describes your total
household income that year? S7. What is the last grade in school you completed? S9. How often do you follow public policy matters in the news? S10. How often do
you follow business news and information? General Population, Malaysia, cut by ‘the system is failing segments’.
High-Income College-Educated Well-Informed
Top quartile of income College degree or higherFollow business and public policy
information several times a week or more
53% 54% 54%
16
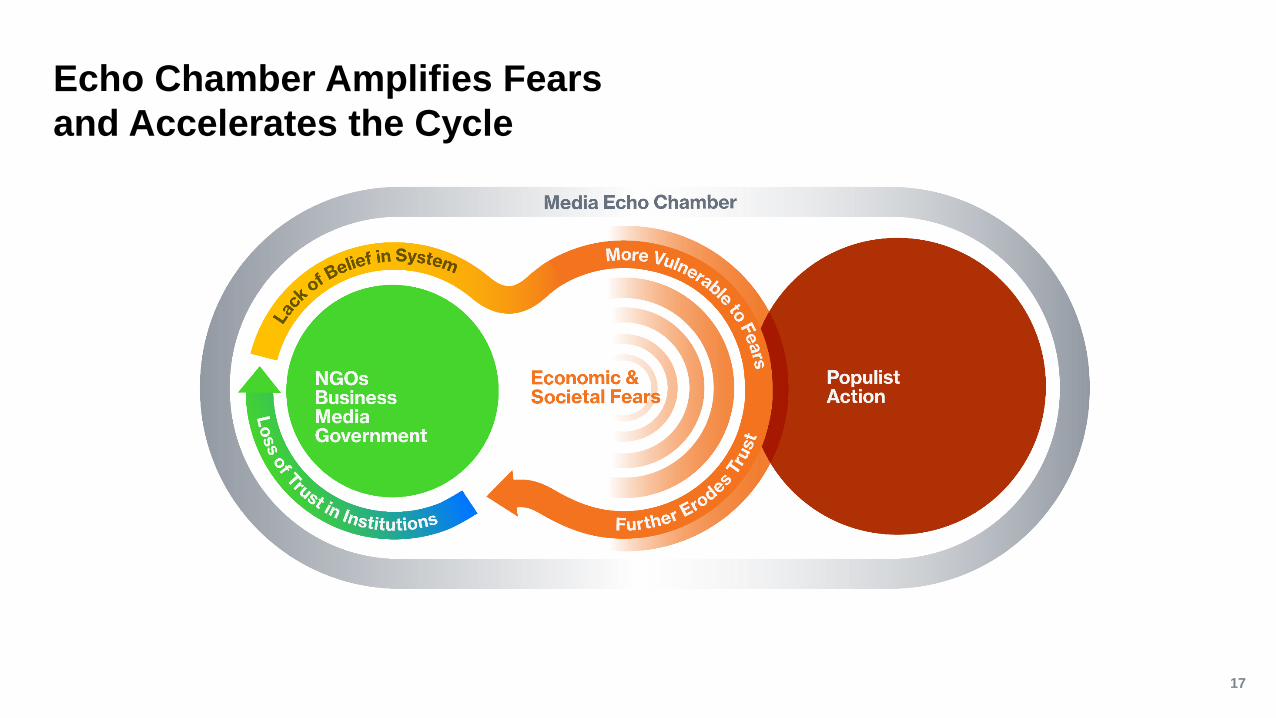
Echo Chamber Amplifies Fears
and Accelerates the Cycle
17
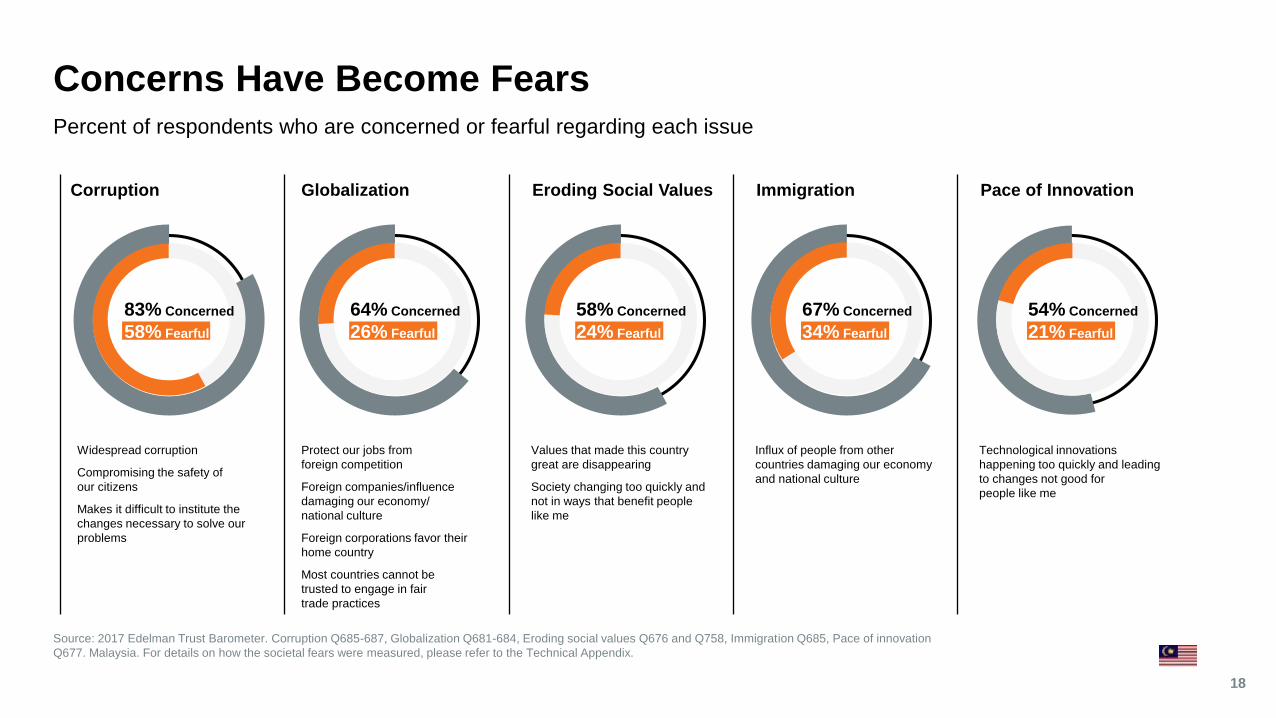
Corruption Globalization Eroding Social Values Immigration Pace of Innovation
Widespread corruption
Compromising the safety of
our citizens
Makes it difficult to institute the
changes necessary to solve our
problems
Protect our jobs from
foreign competition
Foreign companies/influence
damaging our economy/
national culture
Foreign corporations favor their
home country
Most countries cannot be
trusted to engage in fair
trade practices
Values that made this country
great are disappearing
Society changing too quickly and
not in ways that benefit people
like me
Influx of people from other
countries damaging our economy
and national culture
Technological innovations
happening too quickly and leading
to changes not good for
people like me
Concerns Have Become Fears
Source: 2017 Edelman Trust Barometer. Corruption Q685-687, Globalization Q681-684, Eroding social values Q676 and Q758, Immigration Q685, Pace of innovation
Q677. Malaysia. For details on how the societal fears were measured, please refer to the Technical Appendix.
18
Percent of respondents who are concerned or fearful regarding each issue
83% Concerned
58% Fearful
67% Concerned
34% Fearful
58% Concerned
24% Fearful
64% Concerned
26% Fearful
54% Concerned
21% Fearful
11
34
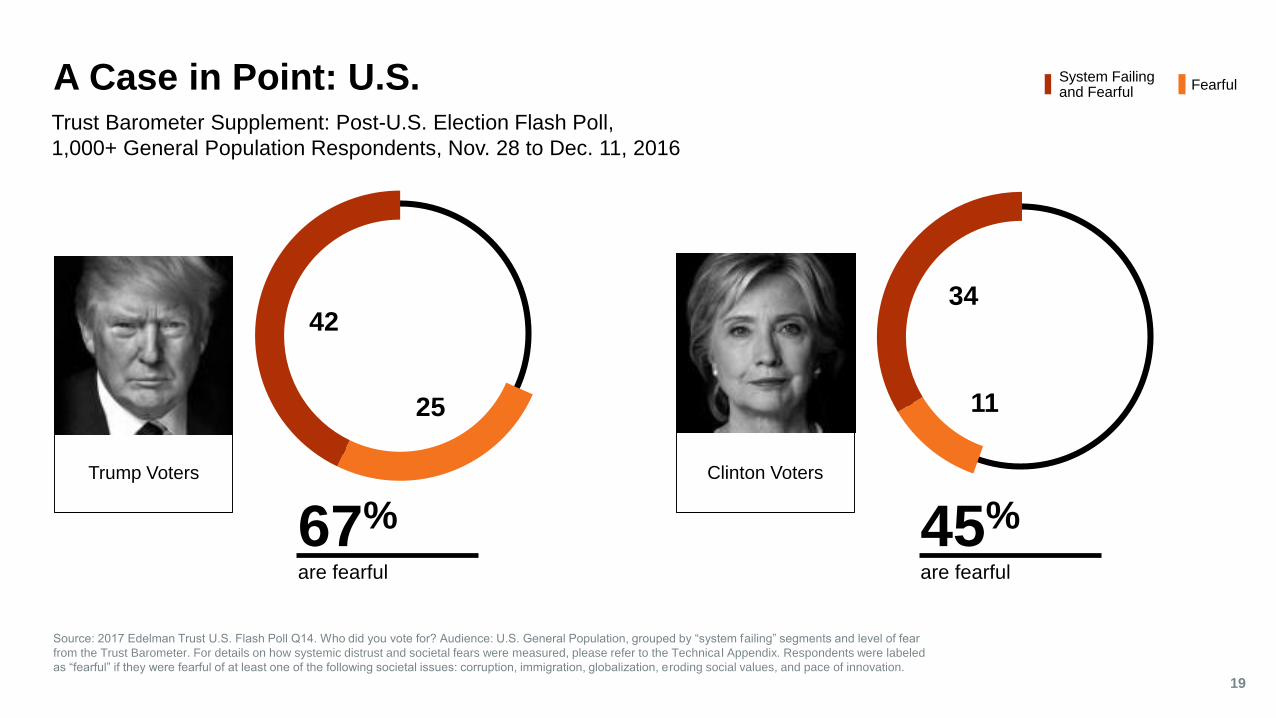
A Case in Point: U.S.
19
Trust Barometer Supplement: Post-U.S. Election Flash Poll,
1,000+ General Population Respondents, Nov. 28 to Dec. 11, 2016
Trump Voters Clinton Voters
25
42
67%
are fearful
45%
are fearful
Source: 2017 Edelman Trust U.S. Flash Poll Q14. Who did you vote for? Audience: U.S. General Population, grouped by “system failing” segments and level of fear
from the Trust Barometer. For details on how systemic distrust and societal fears were measured, please refer to the Technical Appendix. Respondents were labeled
as “fearful” if they were fearful of at least one of the following societal issues: corruption, immigration, globalization, eroding social values, and pace of innovation.
System Failingand Fearful
Fearful
7
20
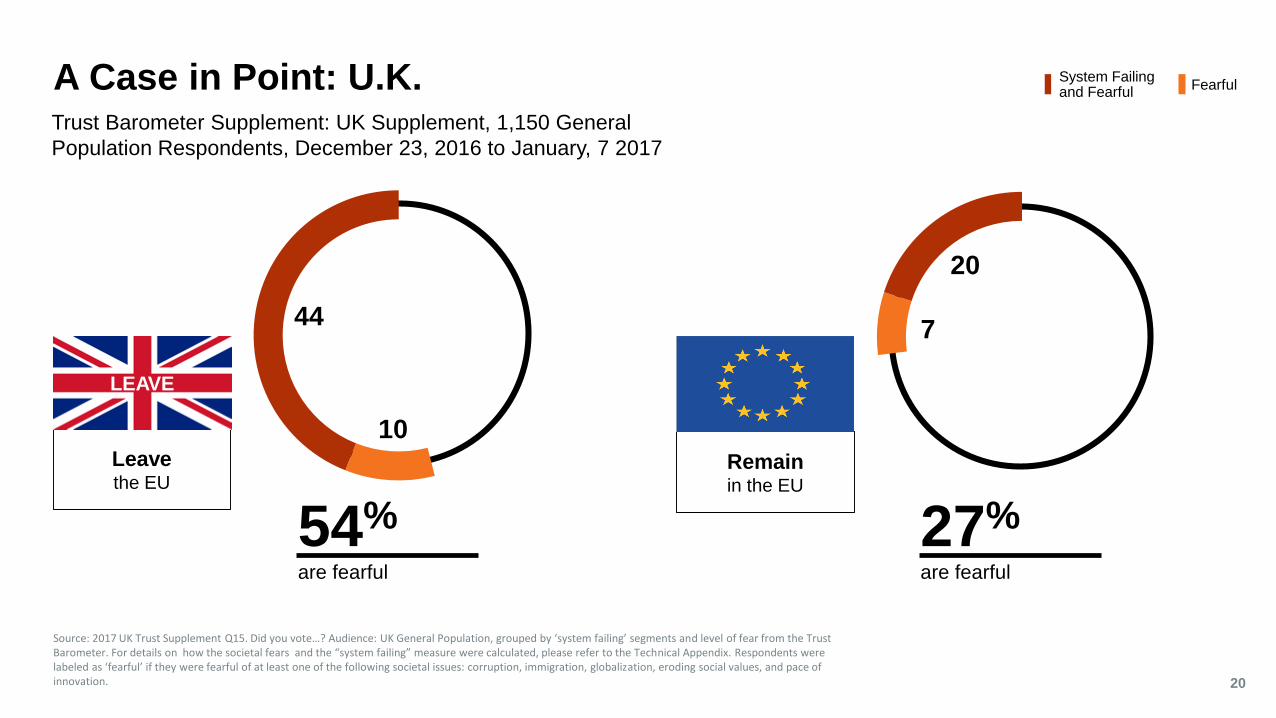
A Case in Point: U.K.
20
Trust Barometer Supplement: UK Supplement, 1,150 General
Population Respondents, December 23, 2016 to January, 7 2017
Leavethe EU
Remainin the EU
54%
are fearful
27%
are fearful
Source: 2017 UK Trust Supplement Q15. Did you vote…? Audience: UK General Population, grouped by ‘system failing’ segments and level of fear from the Trust Barometer. For details on how the societal fears and the “system failing” measure were calculated, please refer to the Technical Appendix. Respondents were labeled as ‘fearful’ if they were fearful of at least one of the following societal issues: corruption, immigration, globalization, eroding social values, and pace of innovation.
System Failingand Fearful
Fearful
LEAVE
10
44
The EchoChamber
22
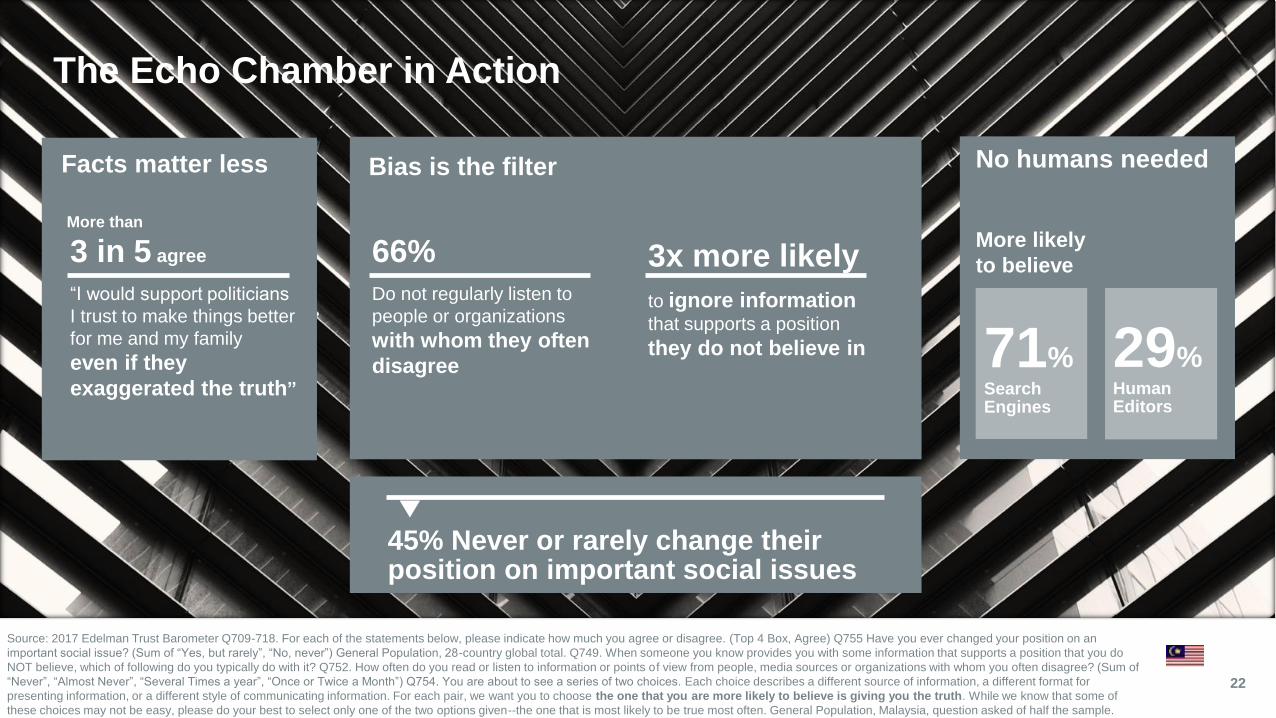
The Echo Chamber in Action
Facts matter less Bias is the filter No humans needed
3 in 5 agree
“I would support politicians
I trust to make things better
for me and my family
even if they
exaggerated the truth”
66%
Do not regularly listen to
people or organizations
with whom they often
disagree
3x more likely
to ignore information that supports a position
they do not believe in
More likely
to believe
71%Search Engines
29%Human Editors
53%45% Never or rarely change their position on important social issues
Source: 2017 Edelman Trust Barometer Q709-718. For each of the statements below, please indicate how much you agree or disagree. (Top 4 Box, Agree) Q755 Have you ever changed your position on an
important social issue? (Sum of “Yes, but rarely”, “No, never”) General Population, 28-country global total. Q749. When someone you know provides you with some information that supports a position that you do
NOT believe, which of following do you typically do with it? Q752. How often do you read or listen to information or points of view from people, media sources or organizations with whom you often disagree? (Sum of
“Never”, “Almost Never”, “Several Times a year”, “Once or Twice a Month”) Q754. You are about to see a series of two choices. Each choice describes a different source of information, a different format for
presenting information, or a different style of communicating information. For each pair, we want you to choose the one that you are more likely to believe is giving you the truth. While we know that some of
these choices may not be easy, please do your best to select only one of the two options given--the one that is most likely to be true most often. General Population, Malaysia, question asked of half the sample.
More than
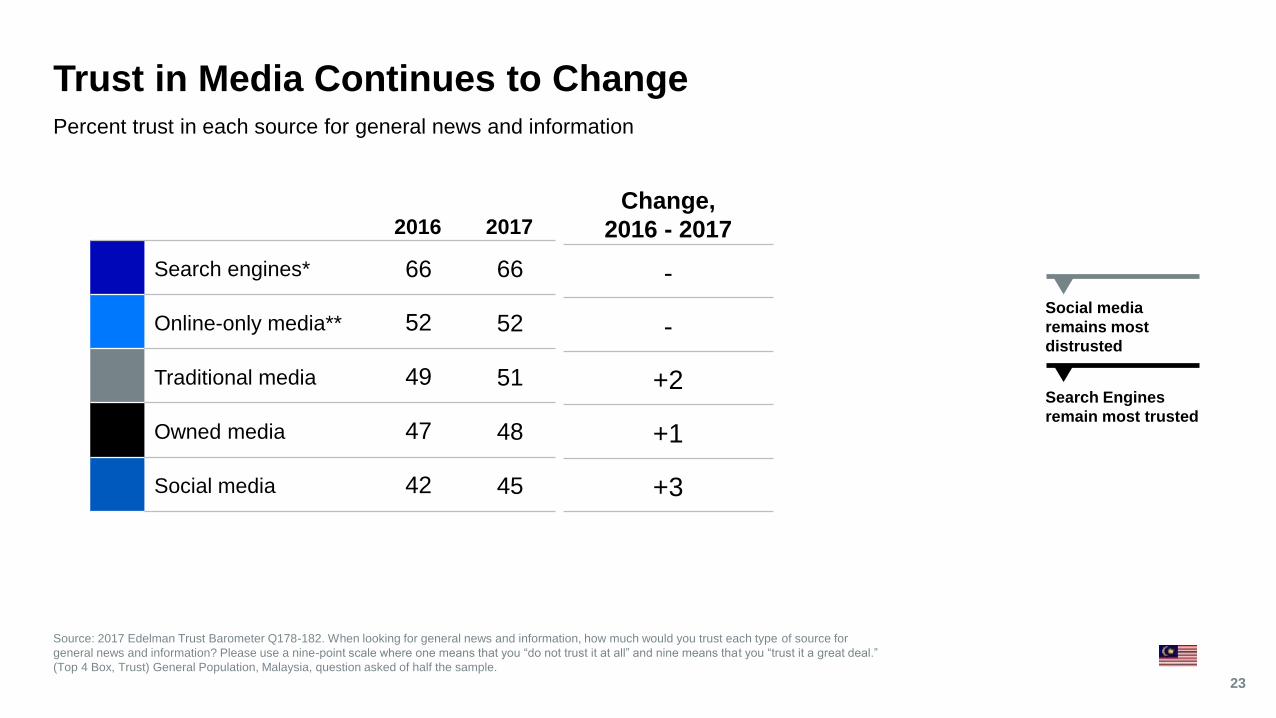
2016 2017
Search engines* 66 66
Online-only media** 52 52
Traditional media 49 51
Owned media 47 48
Social media 42 45
Trust in Media Continues to Change
Source: 2017 Edelman Trust Barometer Q178-182. When looking for general news and information, how much would you trust each type of source for
general news and information? Please use a nine-point scale where one means that you “do not trust it at all” and nine means that you “trust it a great deal.”
(Top 4 Box, Trust) General Population, Malaysia, question asked of half the sample.
Percent trust in each source for general news and information
23
Change,
2016 - 2017
-
-
+2
+1
+3
Search Engines
remain most trusted
Social media
remains most
distrusted
Business on Notice
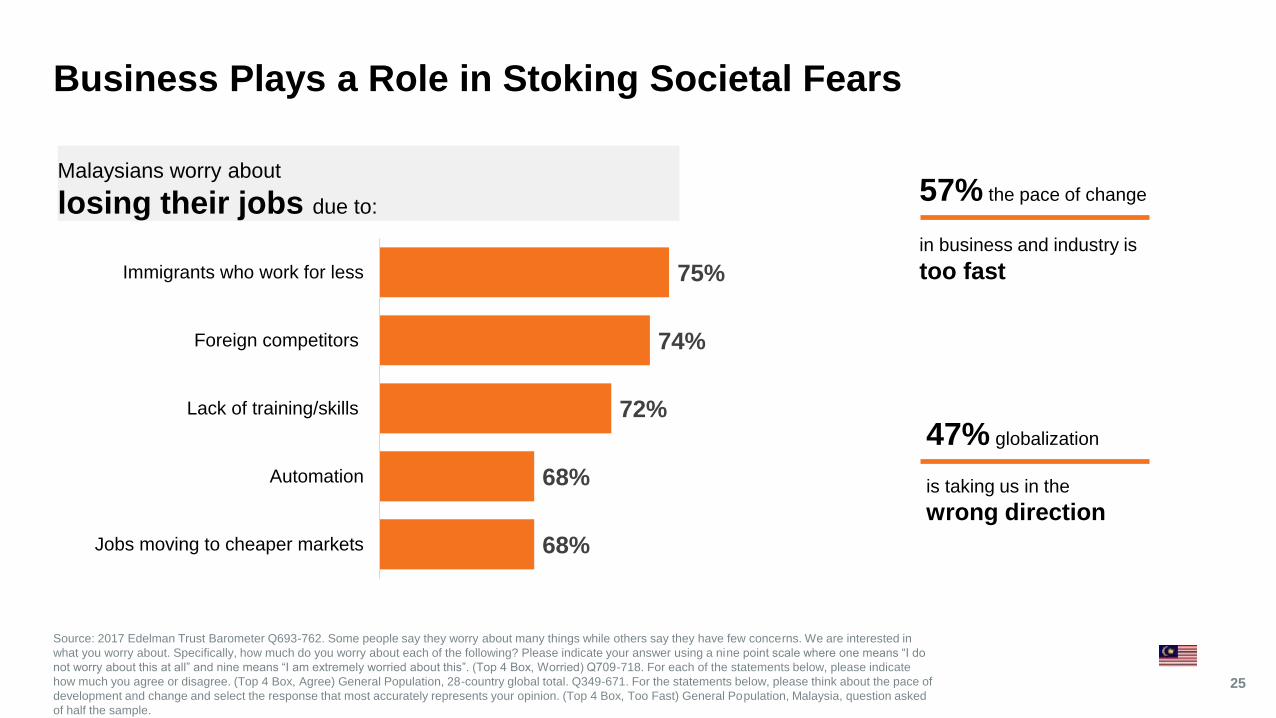
Business Plays a Role in Stoking Societal Fears
Source: 2017 Edelman Trust Barometer Q693-762. Some people say they worry about many things while others say they have few concerns. We are interested in
what you worry about. Specifically, how much do you worry about each of the following? Please indicate your answer using a nine point scale where one means “I do
not worry about this at all” and nine means “I am extremely worried about this”. (Top 4 Box, Worried) Q709-718. For each of the statements below, please indicate
how much you agree or disagree. (Top 4 Box, Agree) General Population, 28-country global total. Q349-671. For the statements below, please think about the pace of
development and change and select the response that most accurately represents your opinion. (Top 4 Box, Too Fast) General Population, Malaysia, question asked
of half the sample.
25
Malaysians worry about
losing their jobs due to:
47% globalization
is taking us in the
wrong direction
57% the pace of change
in business and industry is
too fast
68%
68%
72%
74%
75%
Jobs moving to cheaper markets
Automation
Lack of training/skills
Foreign competitors
Immigrants who work for less
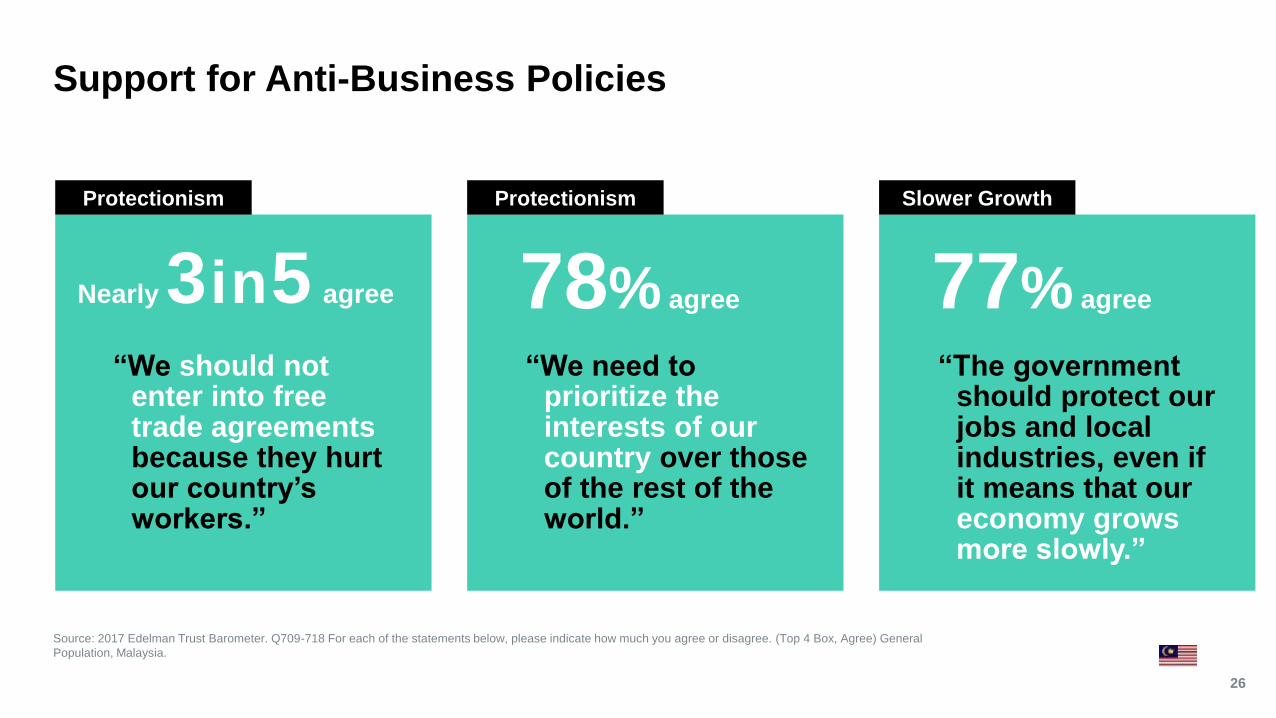
Support for Anti-Business Policies
Source: 2017 Edelman Trust Barometer. Q709-718 For each of the statements below, please indicate how much you agree or disagree. (Top 4 Box, Agree) General
Population, Malaysia.
26
Nearly 3in5 agree 78% agree 77% agree
Protectionism Slower Growth
“The government should protect our jobs and local industries, even if it means that our economy grows more slowly.”
“We need to prioritize the interests of our country over those of the rest of the world.”
“We should not enter into free trade agreements because they hurt our country’s workers.”
Protectionism
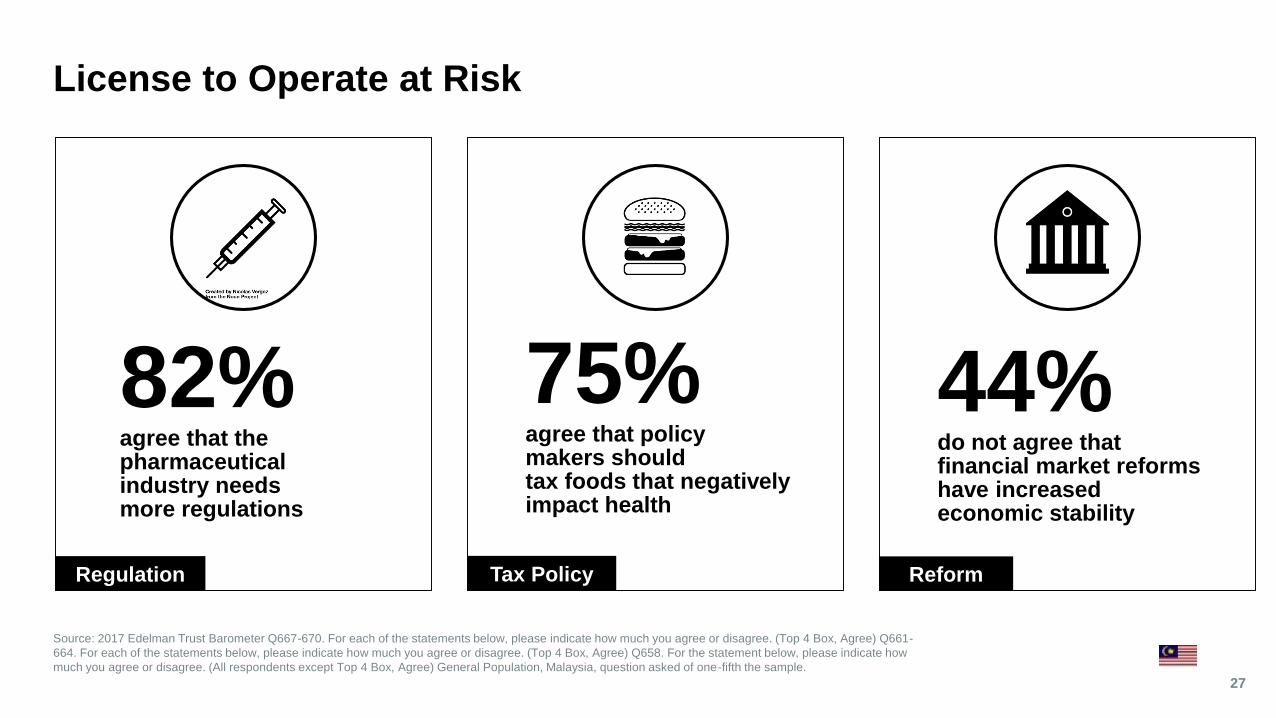
License to Operate at Risk
Source: 2017 Edelman Trust Barometer Q667-670. For each of the statements below, please indicate how much you agree or disagree. (Top 4 Box, Agree) Q661-
664. For each of the statements below, please indicate how much you agree or disagree. (Top 4 Box, Agree) Q658. For the statement below, please indicate how
much you agree or disagree. (All respondents except Top 4 Box, Agree) General Population, Malaysia, question asked of one-fifth the sample.
27
82% agree that the pharmaceutical industry needs more regulations
75%agree that policy makers should tax foods that negatively impact health
44%do not agree that financial market reforms have increased economic stability
Regulation ReformTax Policy
Business Must Act
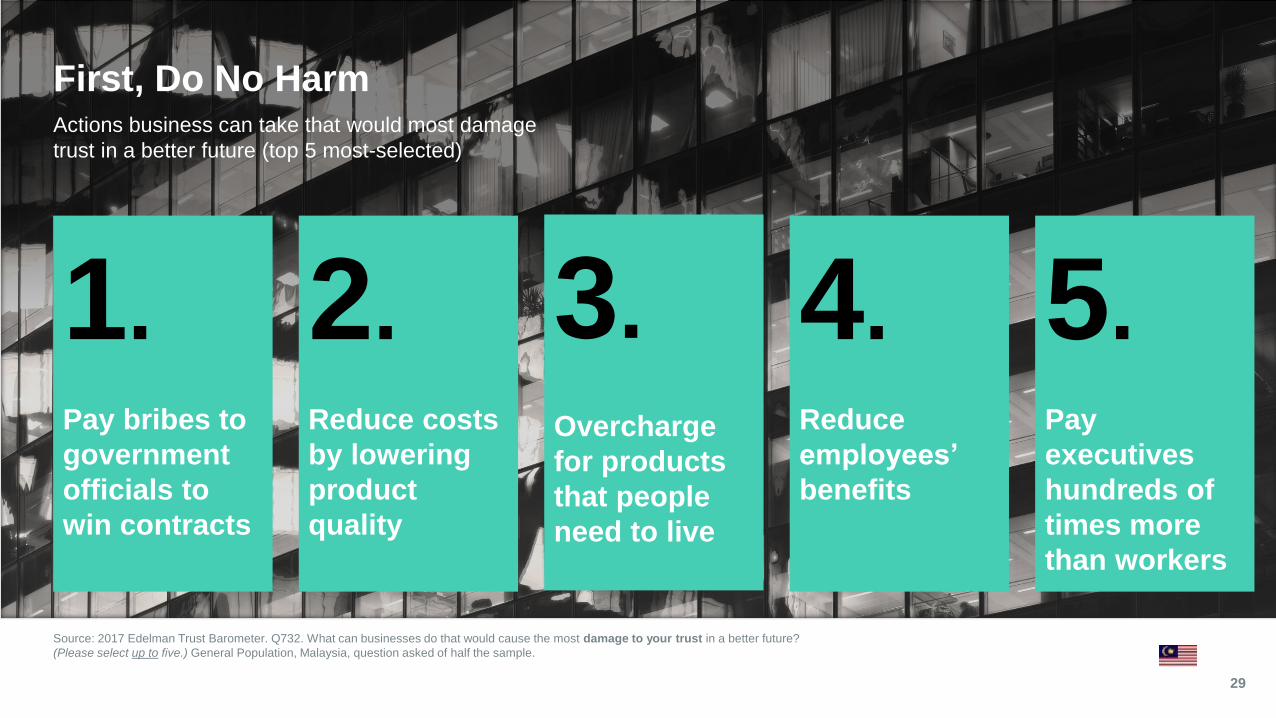
Source: 2017 Edelman Trust Barometer. Q732. What can businesses do that would cause the most damage to your trust in a better future?
(Please select up to five.) General Population, Malaysia, question asked of half the sample.
29
First, Do No HarmActions business can take that would most damage
trust in a better future (top 5 most-selected)
1.Pay bribes to
government
officials to
win contracts
2. Reduce costs
by lowering
product
quality
3.Overcharge
for products
that people
need to live
4.Reduce
employees’
benefits
5. Pay
executives
hundreds of
times more
than workers
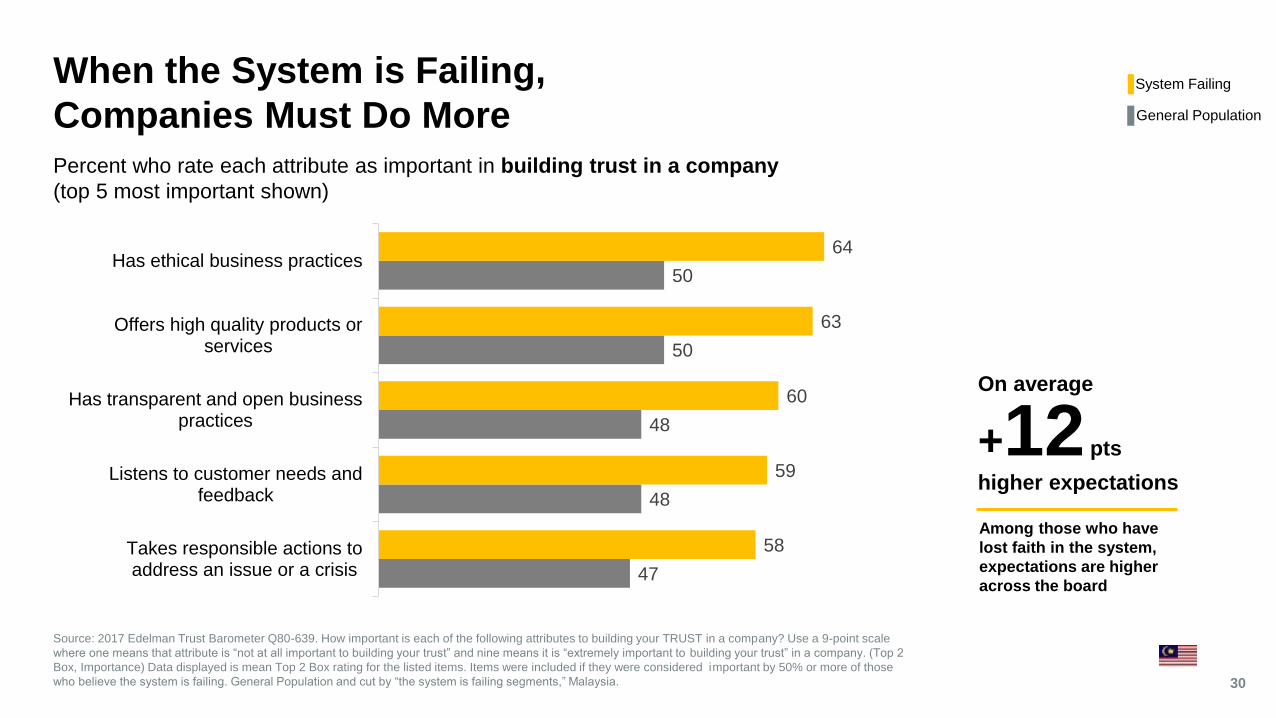
When the System is Failing,
Companies Must Do More
Source: 2017 Edelman Trust Barometer Q80-639. How important is each of the following attributes to building your TRUST in a company? Use a 9-point scale
where one means that attribute is “not at all important to building your trust” and nine means it is “extremely important to building your trust” in a company. (Top 2
Box, Importance) Data displayed is mean Top 2 Box rating for the listed items. Items were included if they were considered important by 50% or more of those
who believe the system is failing. General Population and cut by “the system is failing segments,” Malaysia. 30
Percent who rate each attribute as important in building trust in a company
(top 5 most important shown)
47
48
48
50
50
58
59
60
63
64
Takes responsible actions toaddress an issue or a crisis
Listens to customer needs andfeedback
Has transparent and open businesspractices
Offers high quality products orservices
Has ethical business practices
Among those who have
lost faith in the system,
expectations are higher
across the board
On average
+12 pts
higher expectations
System Failing
General Population
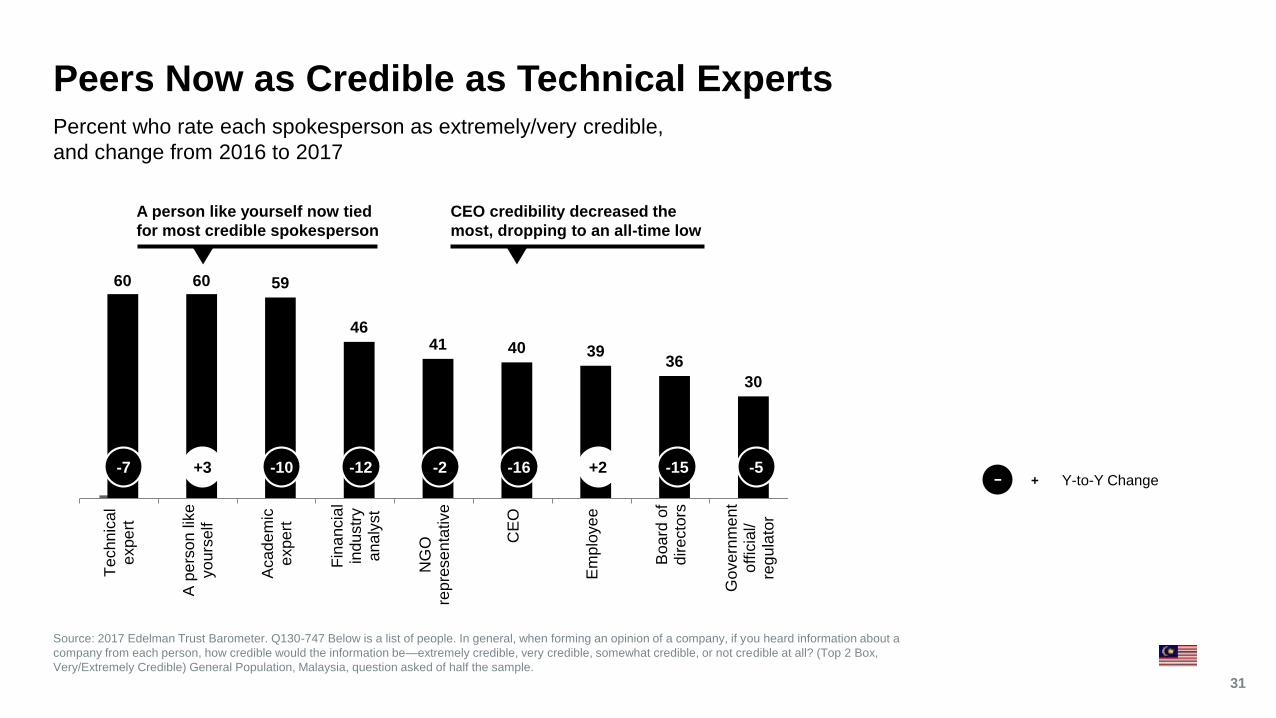
1
60 60 59
4641 40 39
36
30
Te
chn
ical
expe
rt
A p
ers
on lik
eyo
urs
elf
Acad
em
ice
xpe
rt
Fin
ancia
lin
du
str
ya
na
lyst
NG
Ore
pre
se
nta
tive
CE
O
Em
plo
ye
e
Boa
rd o
fd
ire
cto
rs
Gove
rnm
en
to
ffic
ial/
reg
ula
tor
Peers Now as Credible as Technical Experts
Source: 2017 Edelman Trust Barometer. Q130-747 Below is a list of people. In general, when forming an opinion of a company, if you heard information about a
company from each person, how credible would the information be—extremely credible, very credible, somewhat credible, or not credible at all? (Top 2 Box,
Very/Extremely Credible) General Population, Malaysia, question asked of half the sample.
31
Percent who rate each spokesperson as extremely/very credible,
and change from 2016 to 2017
CEO credibility decreased the
most, dropping to an all-time low
A person like yourself now tied
for most credible spokesperson
-7 +3 -10 -12 -2 -16 +2 -15 -5Y-to-Y Change+−
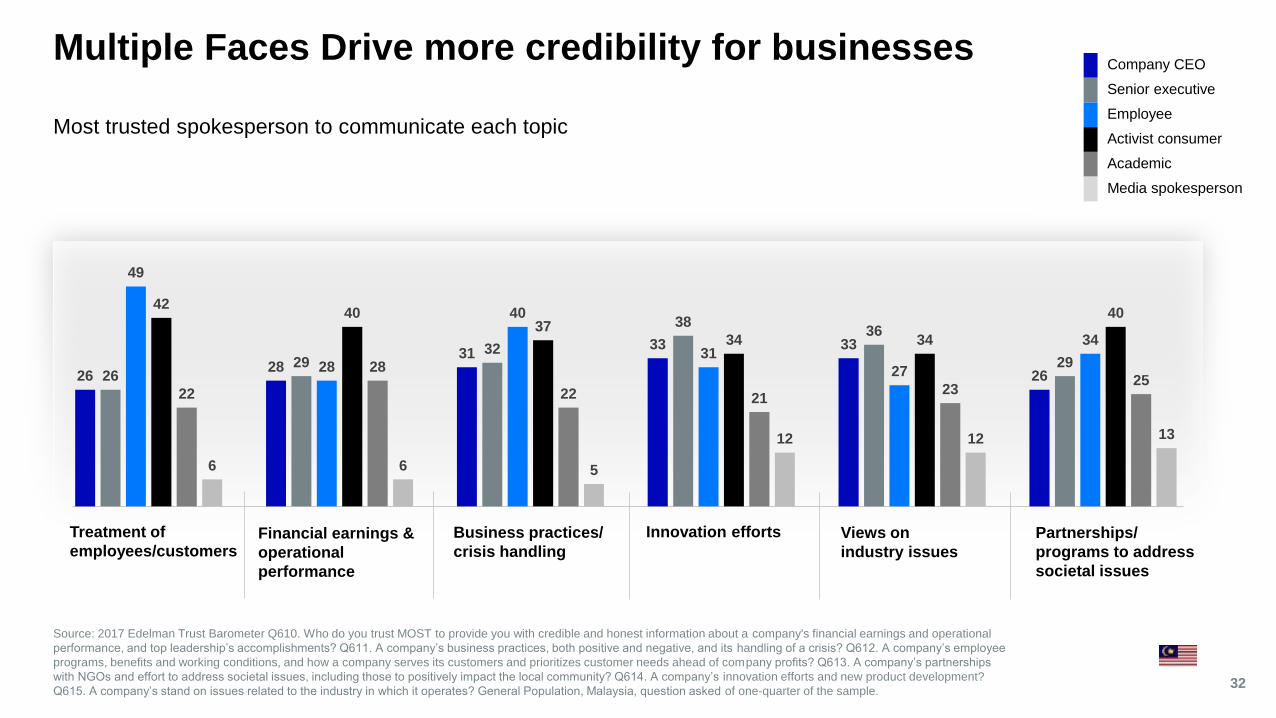
Partnerships/
programs to address
societal issues
Business practices/
crisis handlingFinancial earnings &
operational
performance
Multiple Faces Drive more credibility for businesses
Source: 2017 Edelman Trust Barometer Q610. Who do you trust MOST to provide you with credible and honest information about a company's financial earnings and operational
performance, and top leadership’s accomplishments? Q611. A company’s business practices, both positive and negative, and its handling of a crisis? Q612. A company’s employee
programs, benefits and working conditions, and how a company serves its customers and prioritizes customer needs ahead of company profits? Q613. A company’s partnerships
with NGOs and effort to address societal issues, including those to positively impact the local community? Q614. A company’s innovation efforts and new product development?
Q615. A company’s stand on issues related to the industry in which it operates? General Population, Malaysia, question asked of one-quarter of the sample.32
Most trusted spokesperson to communicate each topic
Innovation effortsTreatment of
employees/customersViews on
industry issues
Company CEO
Senior executive
Employee
Activist consumer
Academic
Media spokesperson
2628
3133 33
262629
32
3836
29
49
28
40
31
27
34
4240
3734 34
40
22
28
22 2123
25
6 6 5
12 12 13
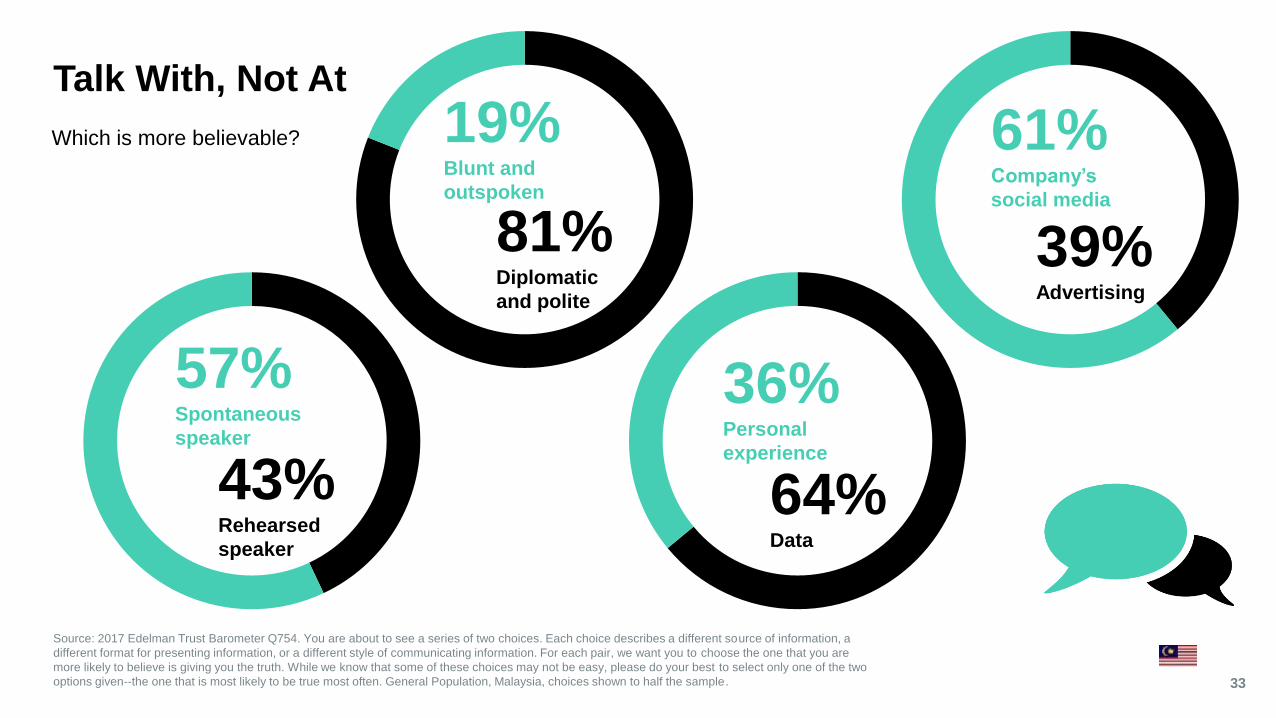
Which is more believable?
Talk With, Not At
33
Source: 2017 Edelman Trust Barometer Q754. You are about to see a series of two choices. Each choice describes a different source of information, a
different format for presenting information, or a different style of communicating information. For each pair, we want you to choose the one that you are
more likely to believe is giving you the truth. While we know that some of these choices may not be easy, please do your best to select only one of the two
options given--the one that is most likely to be true most often. General Population, Malaysia, choices shown to half the sample.
36% Personal
experience
64% Data
57% Spontaneous
speaker
43% Rehearsed
speaker
19% Blunt and
outspoken
81% Diplomatic
and polite
61% Company’s
social media
39% Advertising
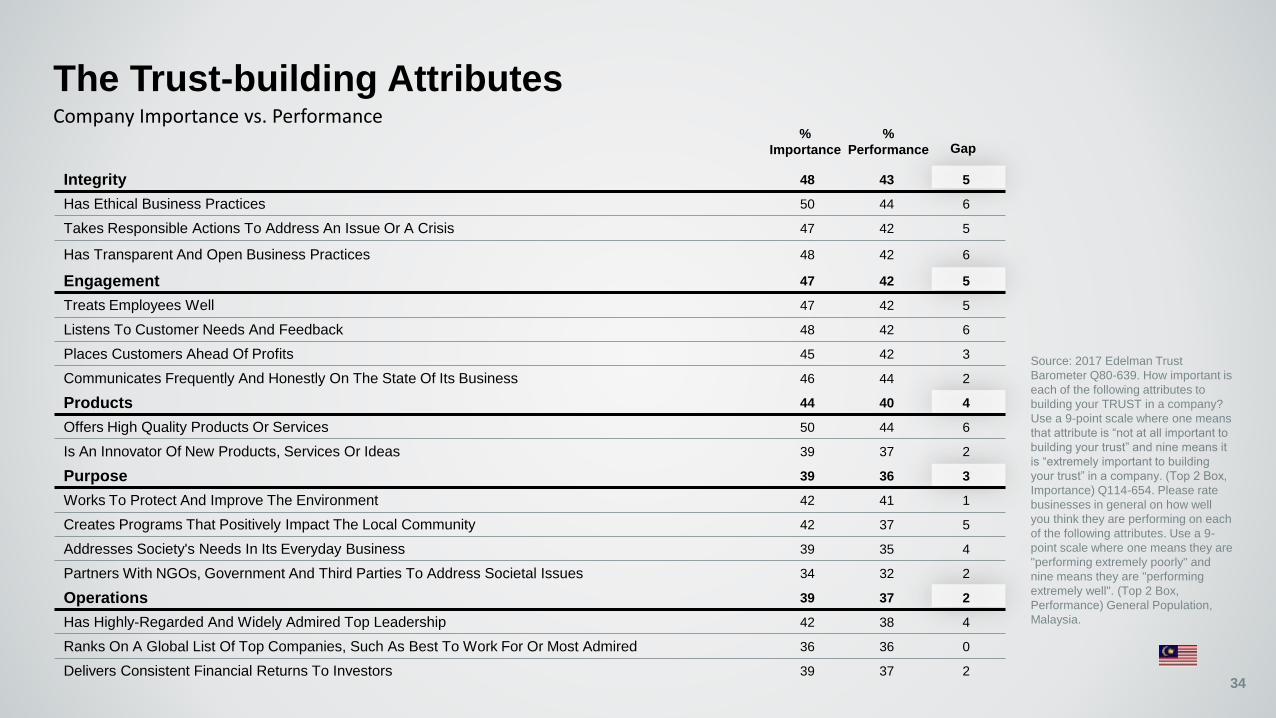
Integrity 48 43 5
Has Ethical Business Practices 50 44 6
Takes Responsible Actions To Address An Issue Or A Crisis 47 42 5
Has Transparent And Open Business Practices 48 42 6
Engagement 47 42 5
Treats Employees Well 47 42 5
Listens To Customer Needs And Feedback 48 42 6
Places Customers Ahead Of Profits 45 42 3
Communicates Frequently And Honestly On The State Of Its Business 46 44 2
Products 44 40 4
Offers High Quality Products Or Services 50 44 6
Is An Innovator Of New Products, Services Or Ideas 39 37 2
Purpose 39 36 3
Works To Protect And Improve The Environment 42 41 1
Creates Programs That Positively Impact The Local Community 42 37 5
Addresses Society's Needs In Its Everyday Business 39 35 4
Partners With NGOs, Government And Third Parties To Address Societal Issues 34 32 2
Operations 39 37 2
Has Highly-Regarded And Widely Admired Top Leadership 42 38 4
Ranks On A Global List Of Top Companies, Such As Best To Work For Or Most Admired 36 36 0
Delivers Consistent Financial Returns To Investors 39 37 2
The Trust-building AttributesCompany Importance vs. Performance
%
Performance
%
Importance Gap
34
Source: 2017 Edelman Trust
Barometer Q80-639. How important is
each of the following attributes to
building your TRUST in a company?
Use a 9-point scale where one means
that attribute is “not at all important to
building your trust” and nine means it
is “extremely important to building
your trust” in a company. (Top 2 Box,
Importance) Q114-654. Please rate
businesses in general on how well
you think they are performing on each
of the following attributes. Use a 9-
point scale where one means they are
"performing extremely poorly" and
nine means they are "performing
extremely well". (Top 2 Box,
Performance) General Population,
Malaysia.
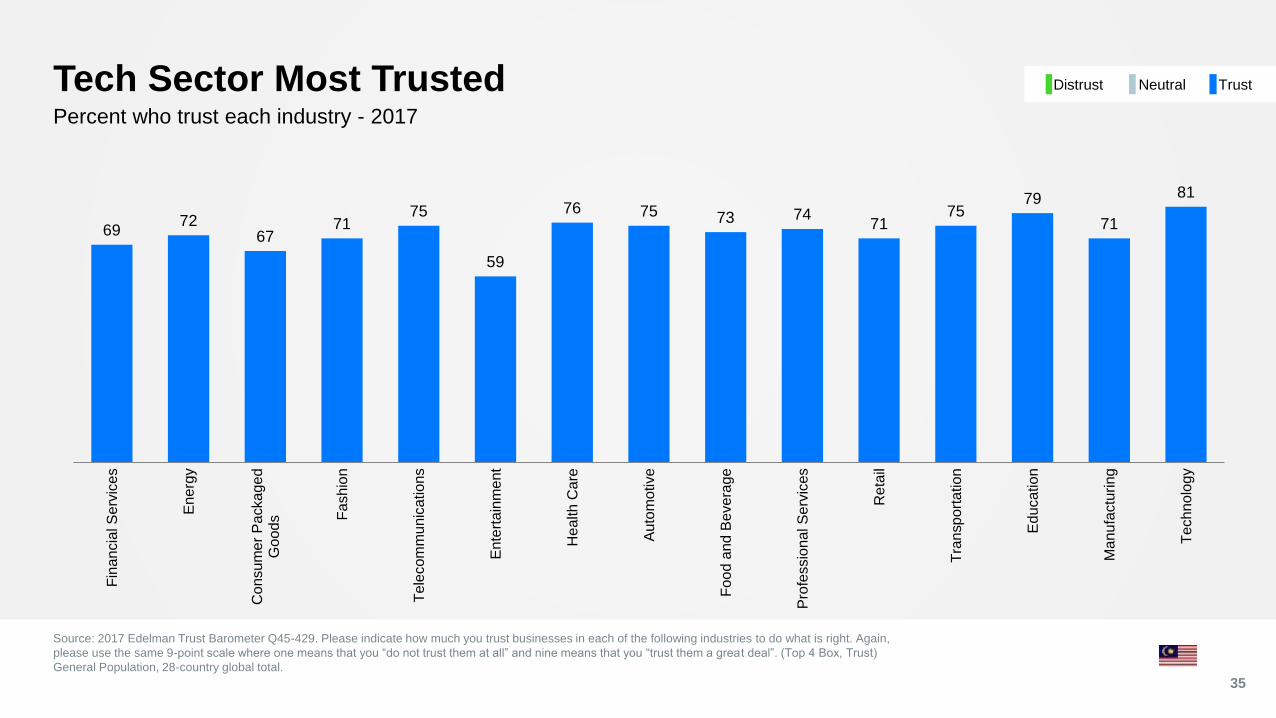
6972
6771
75
59
76 75 73 7471
7579
71
81
Fin
an
cia
l S
erv
ice
s
En
erg
y
Co
nsu
me
r P
acka
ge
dG
ood
s Fa
shio
n
Tele
com
mu
nic
ation
s
En
tert
ain
me
nt
He
alth
Care
Au
tom
otive
Foo
d a
nd
Be
vera
ge
Pro
fessio
na
l S
erv
ices
Re
tail
Tra
nsp
ort
ation
Edu
catio
n
Ma
nu
factu
ring
Tech
no
logy
Source: 2017 Edelman Trust Barometer Q45-429. Please indicate how much you trust businesses in each of the following industries to do what is right. Again,
please use the same 9-point scale where one means that you “do not trust them at all” and nine means that you “trust them a great deal”. (Top 4 Box, Trust)
General Population, 28-country global total.
Tech Sector Most Trusted
35
Percent who trust each industry - 2017
NeutralDistrust Trust
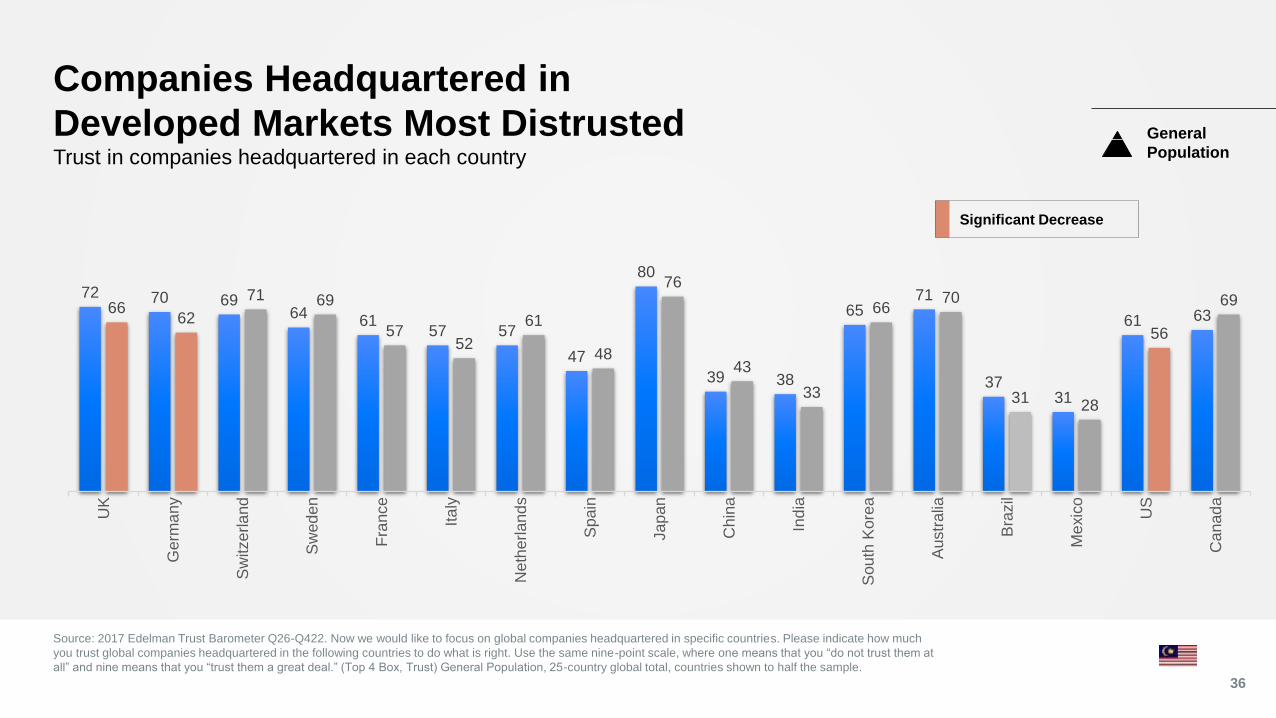
Companies Headquartered in
Developed Markets Most Distrusted
Source: 2017 Edelman Trust Barometer Q26-Q422. Now we would like to focus on global companies headquartered in specific countries. Please indicate how much
you trust global companies headquartered in the following countries to do what is right. Use the same nine-point scale, where one means that you “do not trust them at
all” and nine means that you “trust them a great deal.” (Top 4 Box, Trust) General Population, 25-country global total, countries shown to half the sample.
36
Trust in companies headquartered in each country
72 70 6964
6157 57
47
80
39 38
6571
3731
61 6366
62
71 69
5752
61
48
76
43
33
6670
3128
56
69
UK
Germ
any
Sw
itze
rla
nd
Sw
ed
en
Fra
nce
Ita
ly
Neth
erl
and
s
Spain
Jap
an
Chin
a
Ind
ia
South
Kore
a
Austr
alia
Bra
zil
Me
xic
o
US
Canad
a
General
Population
Significant Decrease
WORKING DRAFT
With the People,Not For the People
38
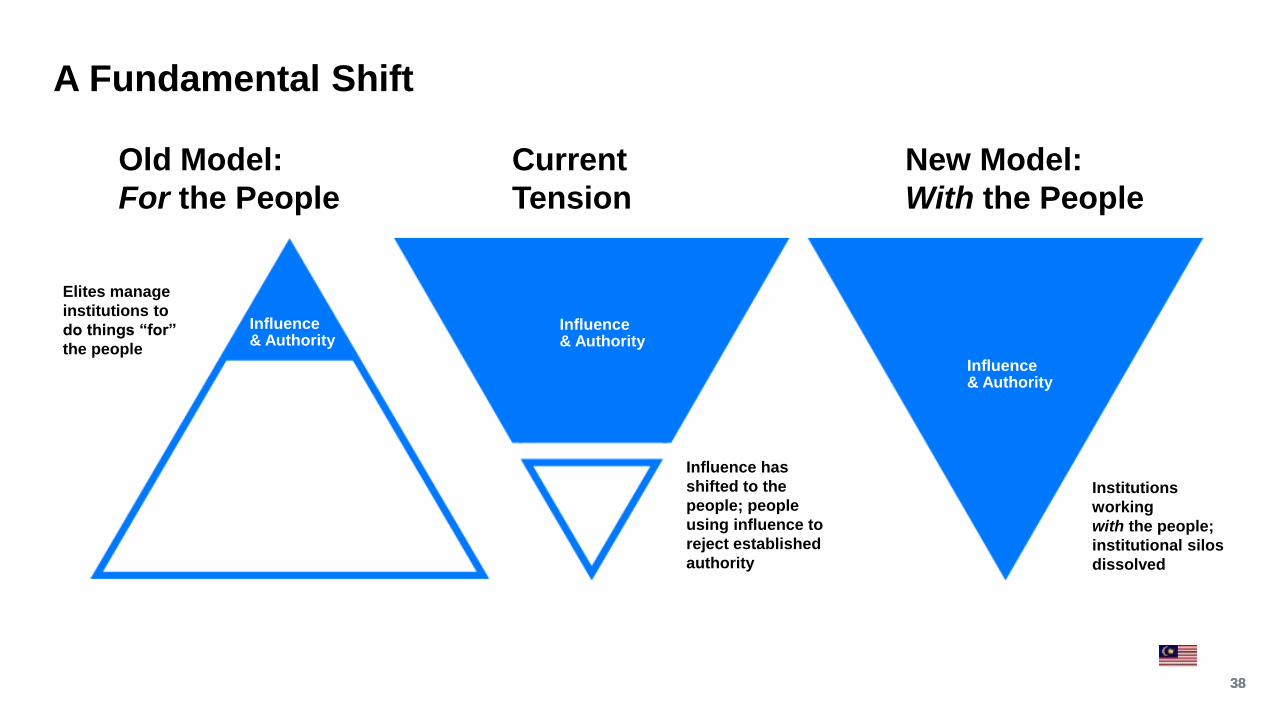
A Fundamental Shift
38
Current
Tension
Old Model:
For the People
New Model:
With the People
Elites manage
institutions to
do things “for”
the people
Influence has
shifted to the
people; people
using influence to
reject established
authority
Institutions
working
with the people;
institutional silos
dissolved
Influence & Authority
Influence & Authority
Influence & Authority
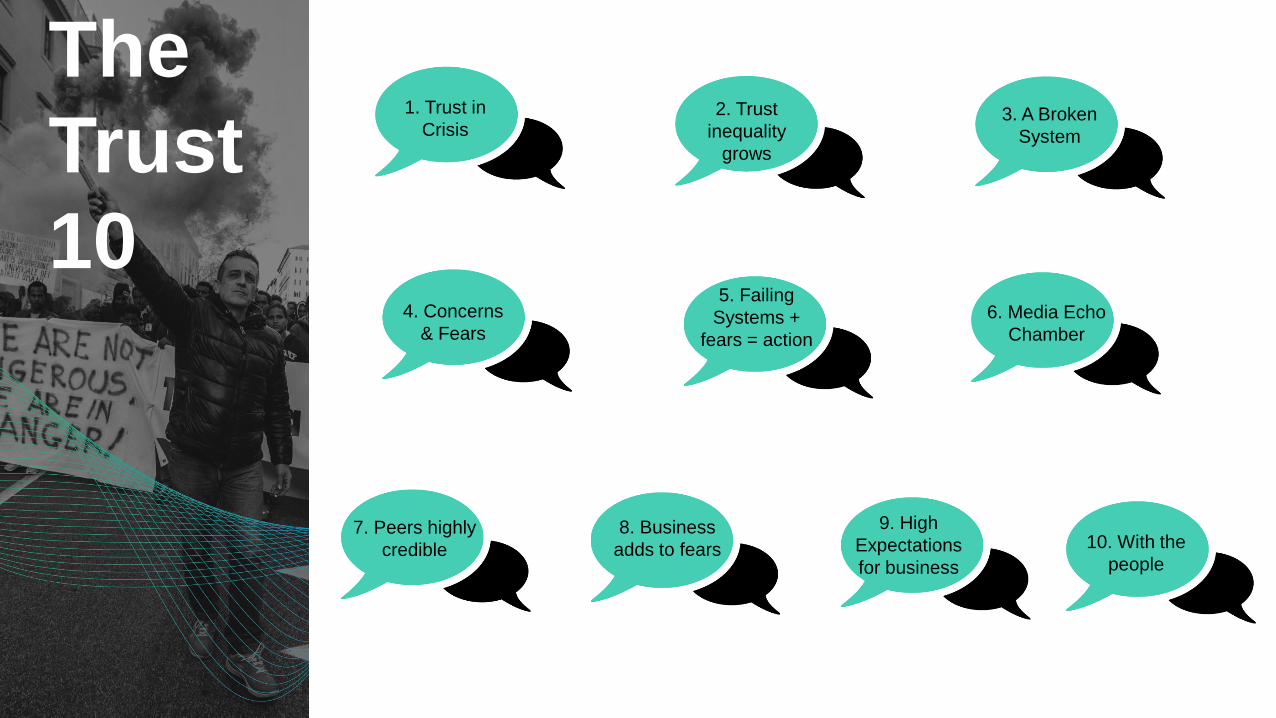
The
Trust
10
1. Trust in
Crisis 2. Trust
inequality
grows
3. A Broken
System
4. Concerns
& Fears
5. Failing
Systems +
fears = action
6. Media Echo
Chamber
7. Peers highly
credible
9. High
Expectations
for business
8. Business
adds to fears 10. With the
people
Thank You