Embed Size (px)
Citation preview
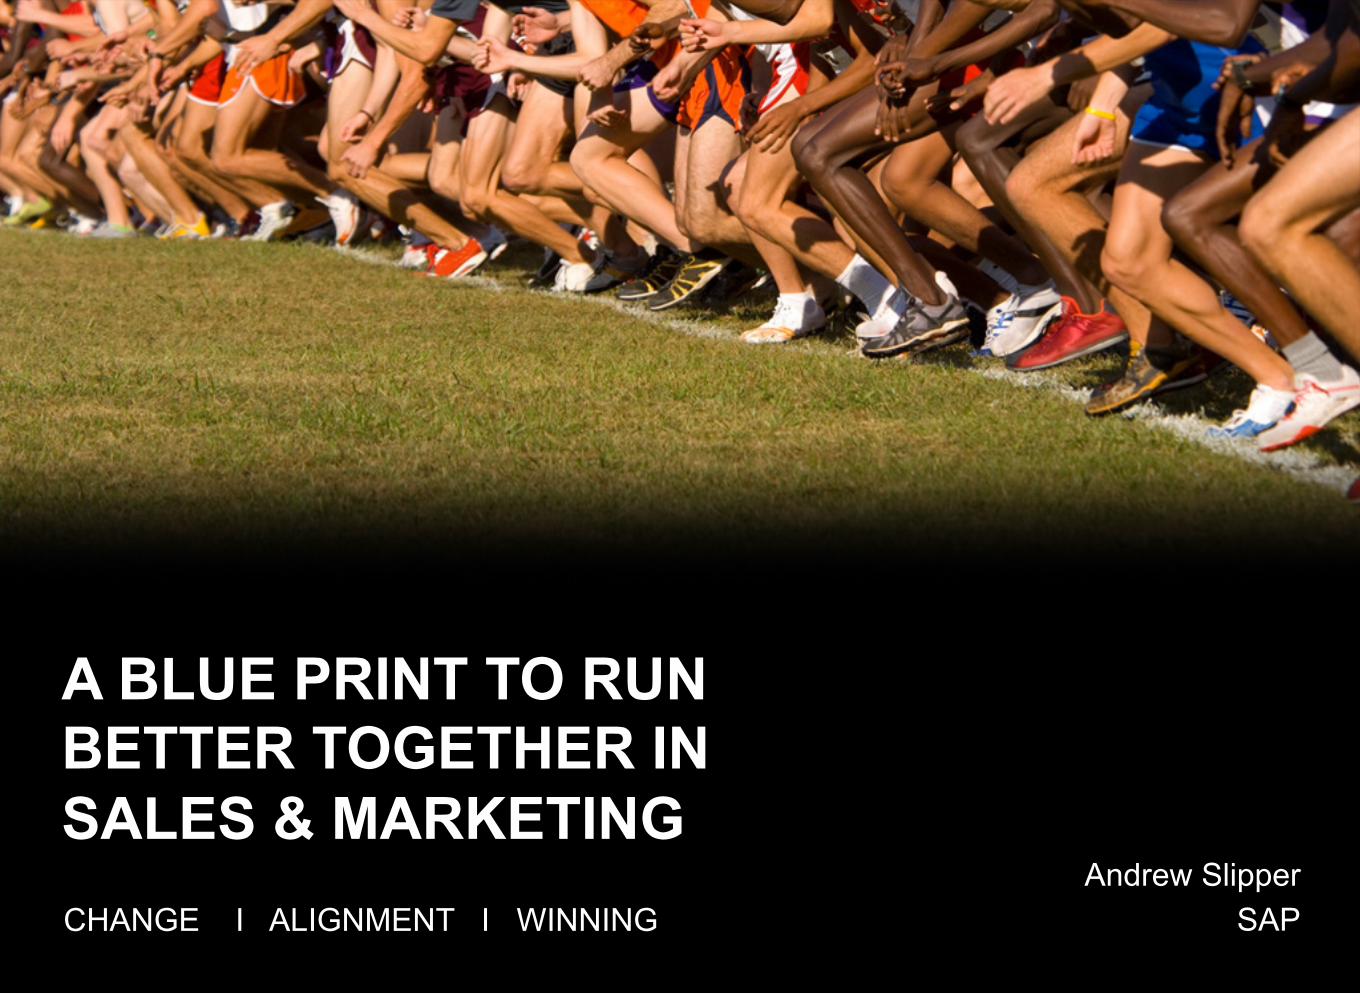
A BLUE PRINT TO RUN BETTER TOGETHER IN SALES & MARKETING CHANGE I ALIGNMENT I WINNING
Andrew Slipper SAP

63% of the world’s transaction revenue touches an SAP system.

SAP customers represent 85% of the Top 100 most valued brands in the world.

Our customers fly more than 1.1 billion of the world’s passengers.

SAP powers business operations at the SEC, tracking billions of daily stock trades across the US stock market.


FROM
TO

THE CHALLENGE
Over 5000 Solutions
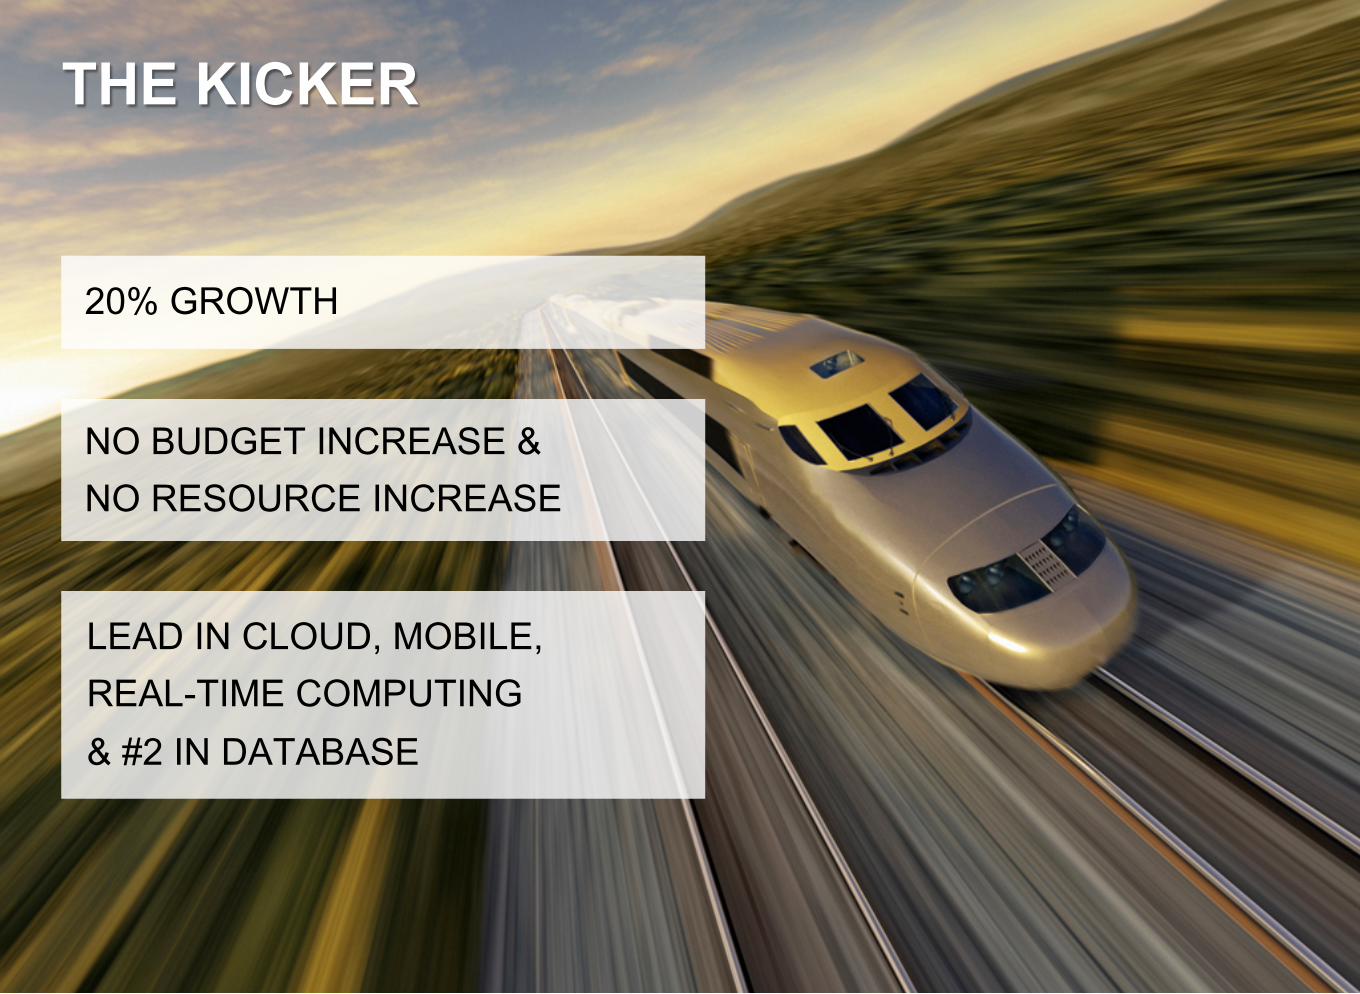
20% GROWTH
NO BUDGET INCREASE & NO RESOURCE INCREASE
LEAD IN CLOUD, MOBILE, REAL-TIME COMPUTING & #2 IN DATABASE
THE KICKER

HOW DO WE ESCAPE THE WHEEL OF PAIN?

WHAT ARE THE KEY STEPS FOR SUCCESS IN ALIGNING SALES AND MARKETING?

RELATIONSHIP WITH SALES IS A JOURNEY
Tactical Hot Coffee & T-Shirts Events Brand
Collaborative Demand Generation Marketing Leads - # & Vol One-Touch Campaigns Standard Processes
Strategic Market Creation Marketing Won & Booked Revenue Nurture Multi-touch Campaigns Marketing Automation

1
2
3
4
5
6
7
Step 1: PRIORITIZATION : THE POWER OF CHOICE AND FOCUS
Strategic Critical Focus
De-Focus Maintain
Business View
Numbers driven: 2012 revenue / 3yr CAGR
Low Medium High
Revenue Potential (2012)
Low
M
ediu
m
Hig
h
Gro
wth
and
inno
vatio
n (3
yr C
AG
R)
Business View
numbers driven: 2012 revenue /
3yr CAGR
Marketing View
Marketing Value Add
WW View
Regional View
Local View
Solution Specific
Local Only
Initiatives
Regional Initiatives

1
2
3
4
5
6
7
Step 2: AGREE INVESTMENT LEVELS
+
STR
ATE
GIC
CR
ITICA
L ++ M
AIN
TAIN
- -- DEF
OC
US

1
2
3
4
5
6
7
Step 3: BE VERY SPECIFIC ON THE CONSEQUENCES
DRIVE THE BUSINESS Strategic High growth segments & solutions Regional Revenue Priorities
SUPPORT The Business Maintain & De-focus High SAP Market Penetration Reactive Support only
CREATE THE BUSINESS Critical New markets or Technologies WW Programs & Campaigns

1
2
3
4
5
6
7
Step 4: DECIDE ON YOUR STRUCTURE
Model A - Local Model B - Central
Strategy/Plan Next 3 months One year and beyond
Budget Responsibility Local/Country EMEAI or Corporate
Headcount Reporting To Sales To Marketing and to CEO
Office
Style Reactive/Dynamic Planned/‘Bureaucratic’/ Considered
Systems Multiple Standardised
Staff Execution oriented ‘Strategic’
Measurement Tied tightly to local metrics Tied to brand/corporate Metrics

1
2
3
4
5
6
7
Step 5: ALIGN THE RESOURCES
Brand Solution
Marketing Demand Center
Market Intelligence
Social Media
Events Sponsorship Hospitality
Industry Marketing
Global Programs
Customer Reference Marketing
Marketing Operations
SAP.com
Field Marketing

1
2
3
4
5
6
7
Step 6: SHOW THE VALUE
MEASURE
COMMUNICATE
ENGAGE

1
2
3
4
5
6
7
HOW WE MEASURE OUR PROGRESS Contributing Value to 4RQ Pipeline & Won/Booked Wins

1
2
3
4
5
6
7
HOW WE MEASURE OUR PROGRESS Contributing To 3X Pipeline Coverage
Total LE SME BU
FY 2009 Sales Targets
Budget SW Lic. Revenue
3X Pipeline Coverage
FY 2009 MKT Targets - % of FY 3X Pipeline Coverage
Mkt Generated Pipeline 737,049 14% 402,161 10% 334,888 29% 132,970 13%
Mkt Influenced Pipeline 1,820,753 35% 1,704,186 42% 116,567 10% 333,038 33%
Mkt Contributed Pipeline 2,557,802 49% 2,106,347 52% 451,455 39% 466,009 46%
YTD MKT Actual - % Of FY 3X Pipeline Coverage
Mkt Generated Pipeline 758,140 15% 448,481 11% 309,659 26% 166,117 16%
Mkt Influenced Pipeline 1,889,148 36% 1,694,027 42% 195,121 17% 351,783 34%
Mkt Contributed Pipeline 2,647,287 51% 2,142,508 53% 504,779 43% 517,900 51%
All Figures in KC

1
2
3
4
5
6
7
Step 7: A ROBUST REPORTING & ANALYTICS PLATFORM


1
2
3
4
5
6
7
PRIORITIZATION
AGREE € LEVELS
BE SPECIFIC
STRUCTURE
ALIGN RESOURCE
SHOW THE VALUE
ROBUST PLATFORM
KEY STEPS

SALES & MARKETING RUN BETTER TOGETHER WIN BETTER TOGETHER