Embed Size (px)
Citation preview
DIGITAL ADVERTISING REPORT ADOBE DIGITAL INDEX Q4 2015
Table of contents
ADOBE DIGITAL INDEX | Digital Advertising Report Q4 2015 2
Paid Search Paid search growth slowed in Q4
Both Google and Bing + Yahoo showed slower growth
Search Engine CTR and CPC trends varied in 2015
Launch of Yahoo Search was heavily discounted
Bing + Yahoo paid search share decreased in North America, grew in Europe
Industries either improved efficiency or spent more
Smartphone-based paid search helps close the “mobile gap”
Phone-based CPCs are 24% less than desktop; CTR is 40% higher
Paid search drove 10% more revenue than direct traffic over Thanksgiving weekend
Retailers focused on smartphone product ads; spend increased 2x in Q4 2015
Appendix
Methodology Glossary
Tables
Display Advertising Display is more efficient at driving traffic, but at a cost
“End of Quarter” pushes display advertising costs up 20% Display advertising cost 34% more over Thanksgiving weekend
For US Retailers, advertising accounted for 32% of revenue in the 2015 Holiday Season Facebook continues to improve relevancy, CTR up 30% YoY Google made progress in closing the display advertising gap with Facebook in Q4
Overview and key insights.
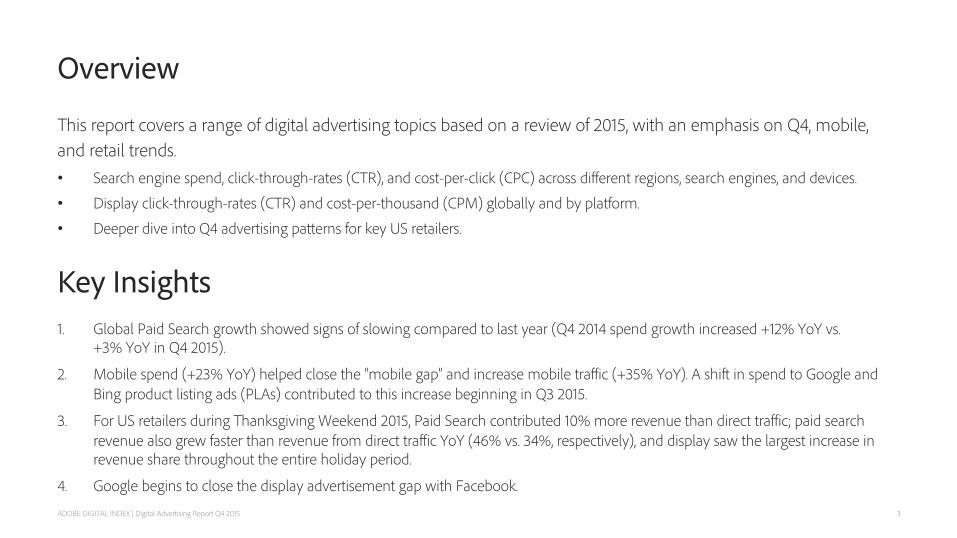
Overview
This report covers a range of digital advertising topics based on a review of 2015, with an emphasis on Q4, mobile, and retail trends. • Search engine spend, click-through-rates (CTR), and cost-per-click (CPC) across different regions, search engines, and devices. • Display click-through-rates (CTR) and cost-per-thousand (CPM) globally and by platform. • Deeper dive into Q4 advertising patterns for key US retailers.
3 ADOBE DIGITAL INDEX | Digital Advertising Report Q4 2015
Key Insights 1. Global Paid Search growth showed signs of slowing compared to last year (Q4 2014 spend growth increased +12% YoY vs.
+3% YoY in Q4 2015).
2. Mobile spend (+23% YoY) helped close the “mobile gap” and increase mobile traffic (+35% YoY). A shift in spend to Google and Bing product listing ads (PLAs) contributed to this increase beginning in Q3 2015.
3. For US retailers during Thanksgiving Weekend 2015, Paid Search contributed 10% more revenue than direct traffic; paid search revenue also grew faster than revenue from direct traffic YoY (46% vs. 34%, respectively), and display saw the largest increase in revenue share throughout the entire holiday period.
4. Google begins to close the display advertisement gap with Facebook.

Paid Search
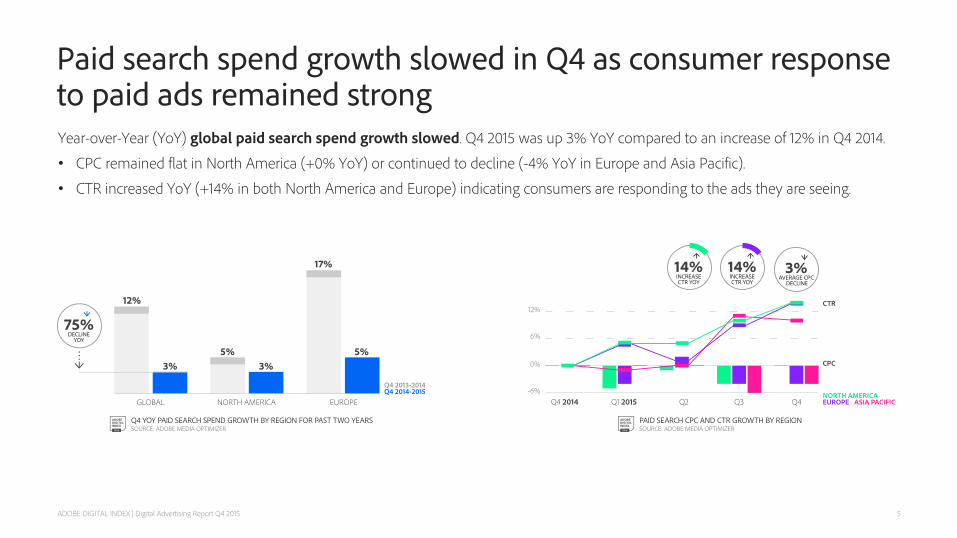
Paid search spend growth slowed in Q4 as consumer response to paid ads remained strong
5 ADOBE DIGITAL INDEX | Digital Advertising Report Q4 2015
Year-over-Year (YoY) global paid search spend growth slowed. Q4 2015 was up 3% YoY compared to an increase of 12% in Q4 2014. • CPC remained flat in North America (+0% YoY) or continued to decline (-4% YoY in Europe and Asia Pacific). • CTR increased YoY (+14% in both North America and Europe) indicating consumers are responding to the ads they are seeing.
Both Google and Bing + Yahoo showed slower growth
6
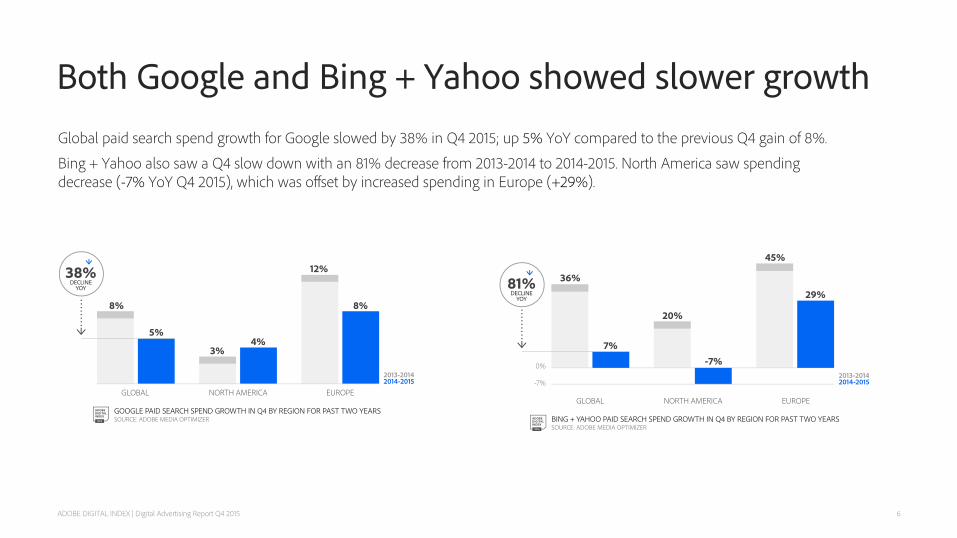
Global paid search spend growth for Google slowed by 38% in Q4 2015; up 5% YoY compared to the previous Q4 gain of 8%. Bing + Yahoo also saw a Q4 slow down with an 81% decrease from 2013-2014 to 2014-2015. North America saw spending decrease (-7% YoY Q4 2015), which was offset by increased spending in Europe (+29%).
ADOBE DIGITAL INDEX | Digital Advertising Report Q4 2015
Search engine CTR and CPC trends varied in 2015
7 ADOBE DIGITAL INDEX | Digital Advertising Report Q4 2015
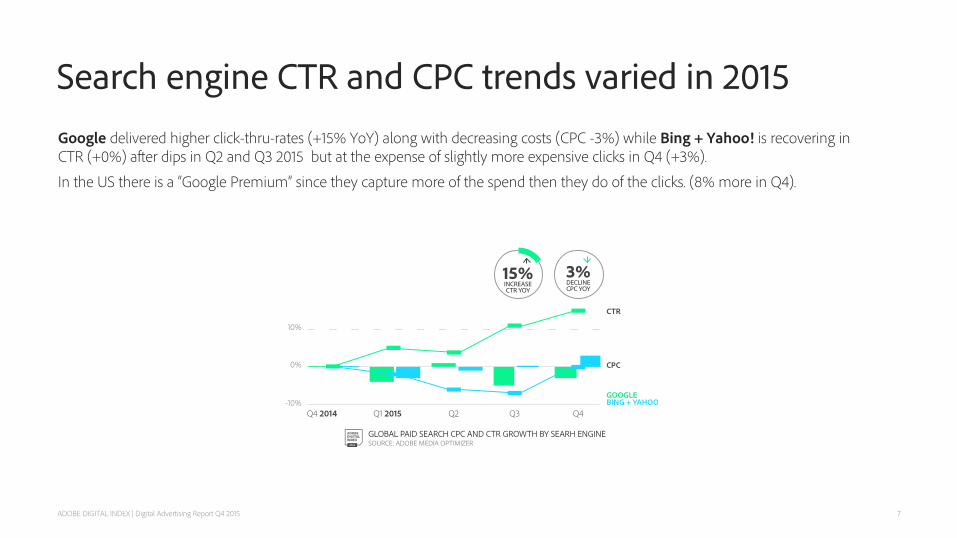
Google delivered higher click-thru-rates (+15% YoY) along with decreasing costs (CPC -3%) while Bing + Yahoo! is recovering in CTR (+0%) after dips in Q2 and Q3 2015 but at the expense of slightly more expensive clicks in Q4 (+3%). In the US there is a “Google Premium” since they capture more of the spend then they do of the clicks. (8% more in Q4).
Launch of Yahoo search was heavily discounted
8 ADOBE DIGITAL INDEX | Digital Advertising Report Q4 2015
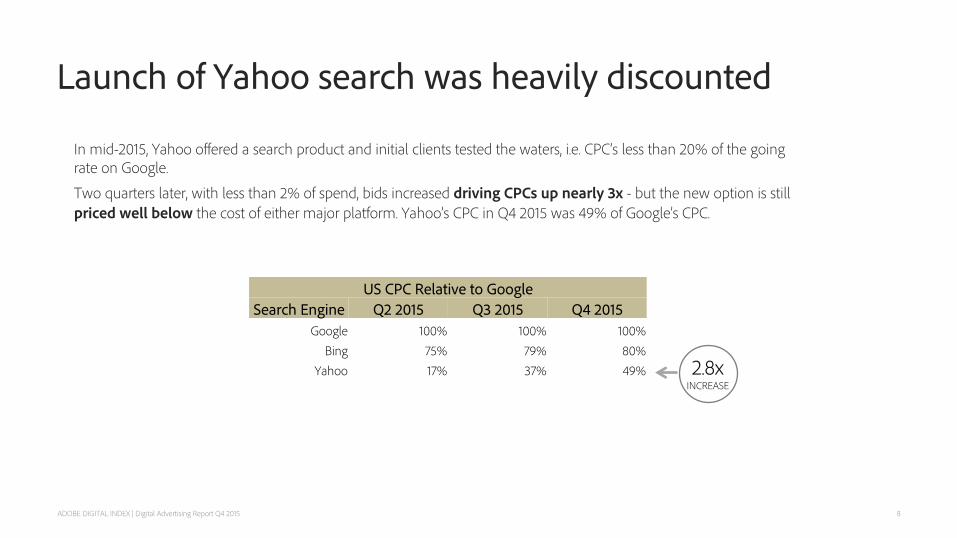
In mid-2015, Yahoo offered a search product and initial clients tested the waters, i.e. CPC’s less than 20% of the going rate on Google. Two quarters later, with less than 2% of spend, bids increased driving CPCs up nearly 3x - but the new option is still priced well below the cost of either major platform. Yahoo’s CPC in Q4 2015 was 49% of Google’s CPC.
US CPC Relative to Google Search Engine Q2 2015 Q3 2015 Q4 2015
Google 100% 100% 100% Bing 75% 79% 80%
Yahoo 17% 37% 49% 2.8x INCREASE
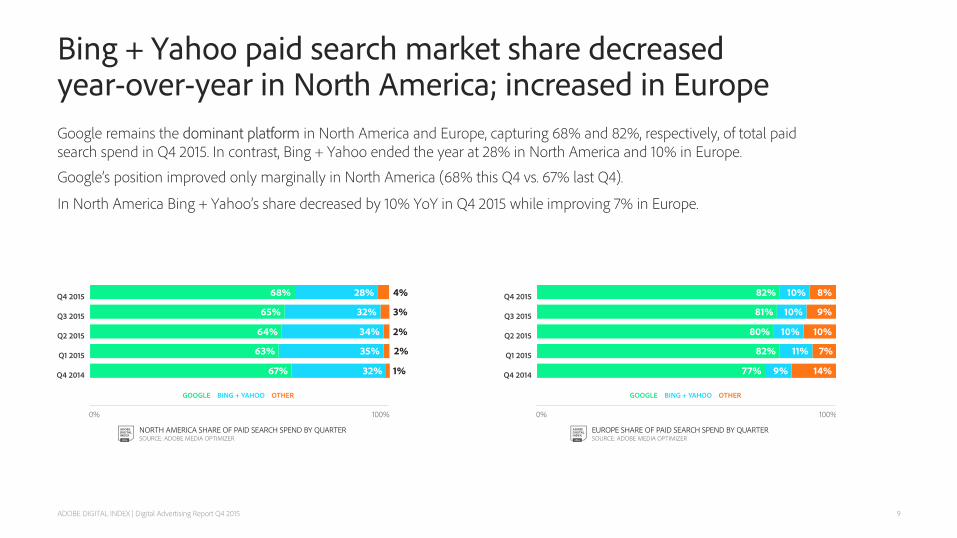
Bing + Yahoo paid search market share decreased year-over-year in North America; increased in Europe Google remains the dominant platform in North America and Europe, capturing 68% and 82%, respectively, of total paid search spend in Q4 2015. In contrast, Bing + Yahoo ended the year at 28% in North America and 10% in Europe. Google’s position improved only marginally in North America (68% this Q4 vs. 67% last Q4).
In North America Bing + Yahoo’s share decreased by 10% YoY in Q4 2015 while improving 7% in Europe.
9 ADOBE DIGITAL INDEX | Digital Advertising Report Q4 2015
Industries either improved efficiency or spent more
10 ADOBE DIGITAL INDEX | Digital Advertising Report Q4 2015
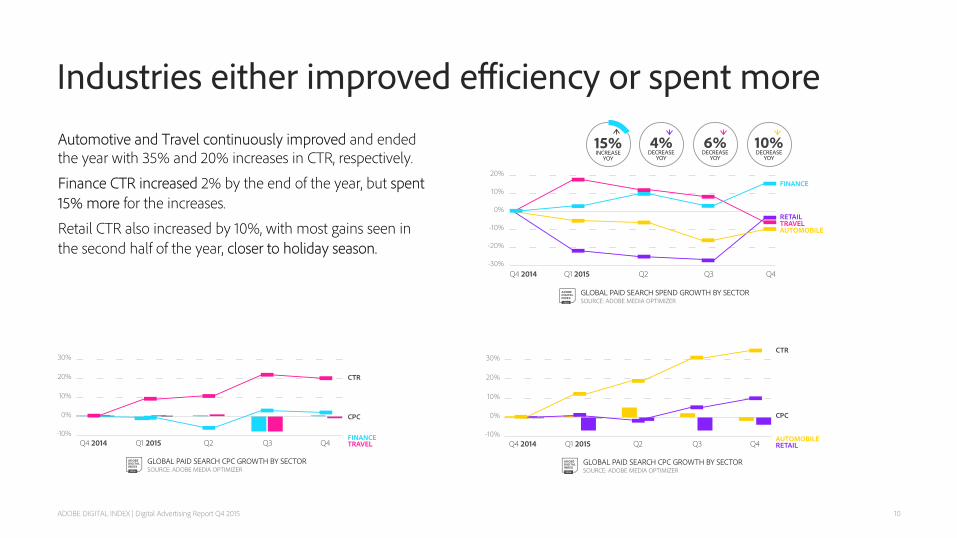
Automotive and Travel continuously improved and ended the year with 35% and 20% increases in CTR, respectively. Finance CTR increased 2% by the end of the year, but spent 15% more for the increases. Retail CTR also increased by 10%, with most gains seen in the second half of the year, closer to holiday season.
Smartphone-based search helped close the “mobile gap”
11 ADOBE DIGITAL INDEX | Digital Advertising Report Q4 2015
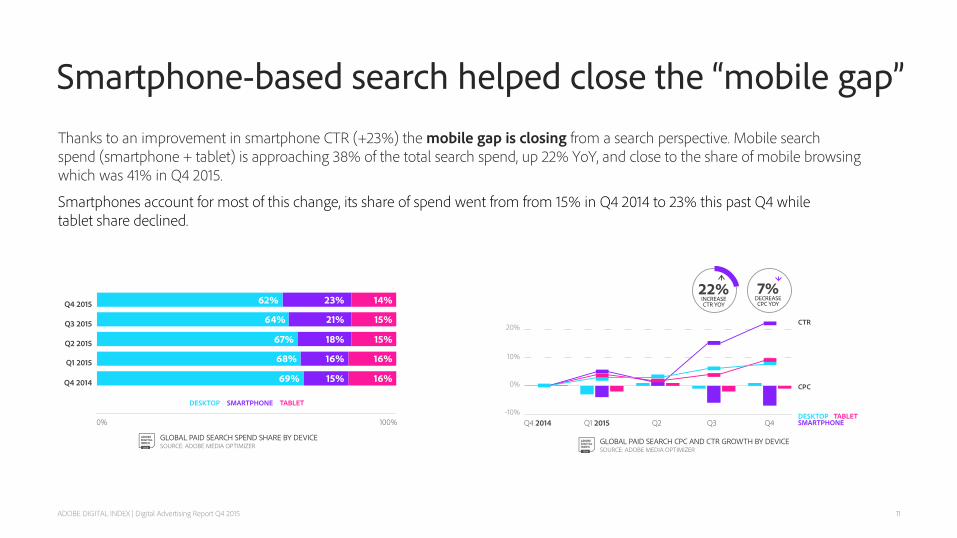
Thanks to an improvement in smartphone CTR (+23%) the mobile gap is closing from a search perspective. Mobile search spend (smartphone + tablet) is approaching 38% of the total search spend, up 22% YoY, and close to the share of mobile browsing which was 41% in Q4 2015.
Smartphones account for most of this change, its share of spend went from from 15% in Q4 2014 to 23% this past Q4 while tablet share declined.
Phone-based CPCs cost 24% less than desktop and have a 40% higher CTR
12 ADOBE DIGITAL INDEX | Digital Advertising Report Q4 2015
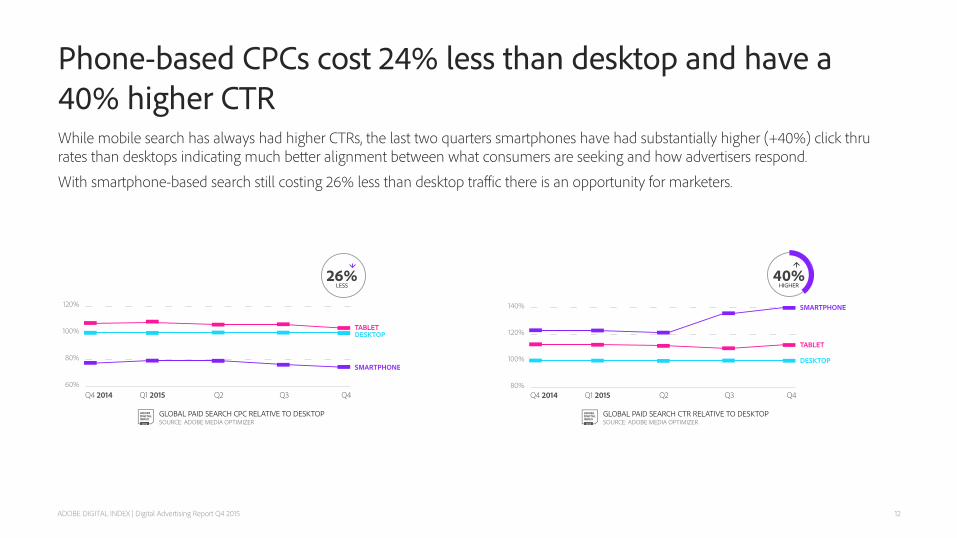
While mobile search has always had higher CTRs, the last two quarters smartphones have had substantially higher (+40%) click thru rates than desktops indicating much better alignment between what consumers are seeking and how advertisers respond. With smartphone-based search still costing 26% less than desktop traffic there is an opportunity for marketers.
Paid search drove 10% more revenue than direct traffic over Thanksgiving weekend
13 ADOBE DIGITAL INDEX | Digital Advertising Report Q4 2015
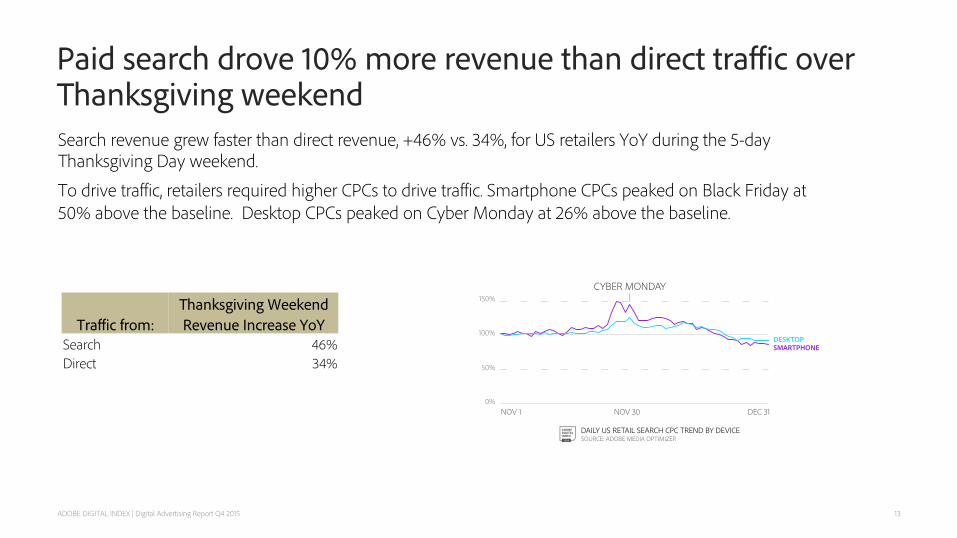
Search revenue grew faster than direct revenue, +46% vs. 34%, for US retailers YoY during the 5-day Thanksgiving Day weekend. To drive traffic, retailers required higher CPCs to drive traffic. Smartphone CPCs peaked on Black Friday at 50% above the baseline. Desktop CPCs peaked on Cyber Monday at 26% above the baseline.
Thanksgiving Weekend Traffic from: Revenue Increase YoY
Search 46% Direct 34%
Retailers focused on smartphone product ads increasing spend 2x in Q4 YoY
14 ADOBE DIGITAL INDEX | Digital Advertising Report Q4 2015
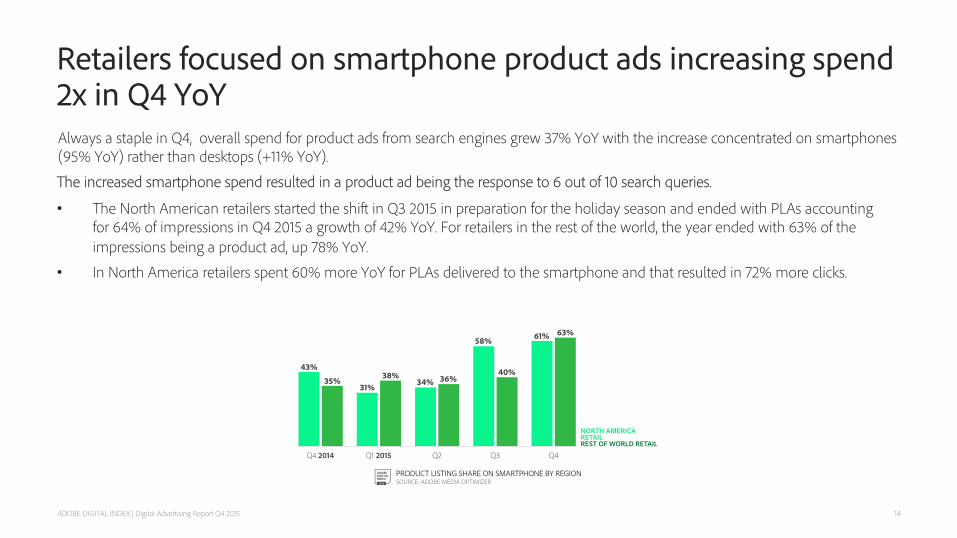
Always a staple in Q4, overall spend for product ads from search engines grew 37% YoY with the increase concentrated on smartphones (95% YoY) rather than desktops (+11% YoY). The increased smartphone spend resulted in a product ad being the response to 6 out of 10 search queries.
• The North American retailers started the shift in Q3 2015 in preparation for the holiday season and ended with PLAs accounting for 64% of impressions in Q4 2015 a growth of 42% YoY. For retailers in the rest of the world, the year ended with 63% of the impressions being a product ad, up 78% YoY.
• In North America retailers spent 60% more YoY for PLAs delivered to the smartphone and that resulted in 72% more clicks.

Display Advertising
Display is more effective in driving traffic, but at a cost
16 ADOBE DIGITAL INDEX | Digital Advertising Report Q4 2015
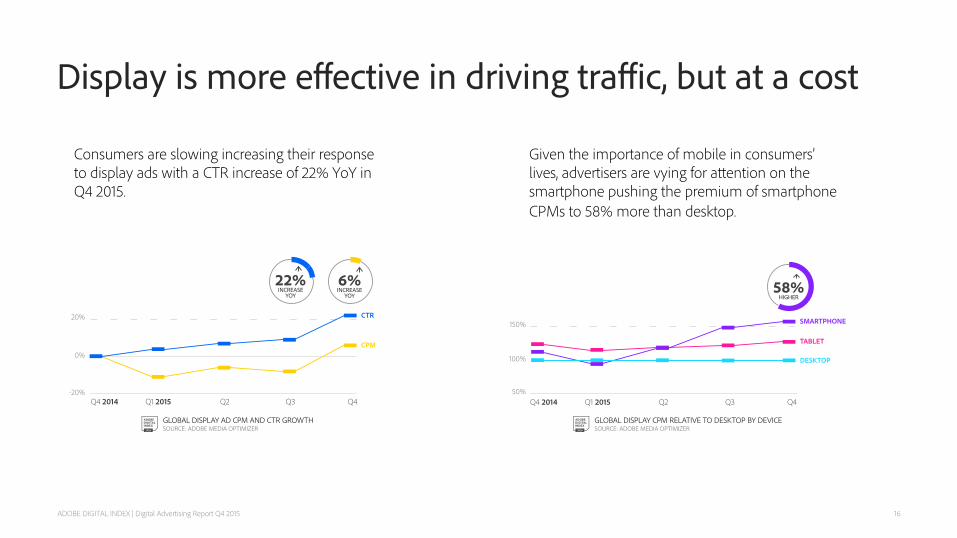
Given the importance of mobile in consumers’ lives, advertisers are vying for attention on the smartphone pushing the premium of smartphone CPMs to 58% more than desktop.
Consumers are slowing increasing their response to display ads with a CTR increase of 22% YoY in Q4 2015.
“End of Quarter” pushes display advertising costs up 20%
17 ADOBE DIGITAL INDEX | Digital Advertising Report Q4 2015
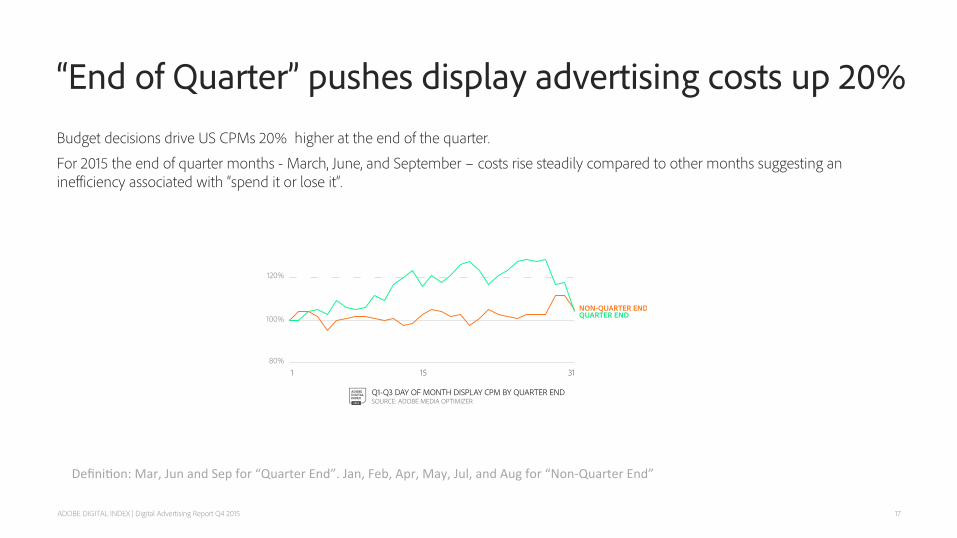
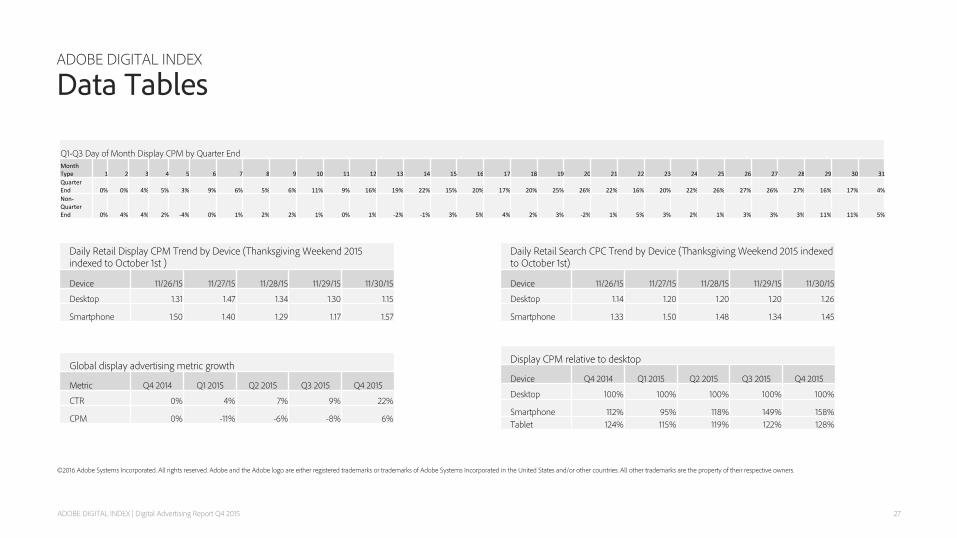
Budget decisions drive US CPMs 20% higher at the end of the quarter. For 2015 the end of quarter months - March, June, and September – costs rise steadily compared to other months suggesting an inefficiency associated with “spend it or lose it”.
Defini&on: Mar, Jun and Sep for “Quarter End”. Jan, Feb, Apr, May, Jul, and Aug for “Non-‐Quarter End”
Display advertising cost 34% more over Thanksgiving Weekend
18 ADOBE DIGITAL INDEX | Digital Advertising Report Q4 2015
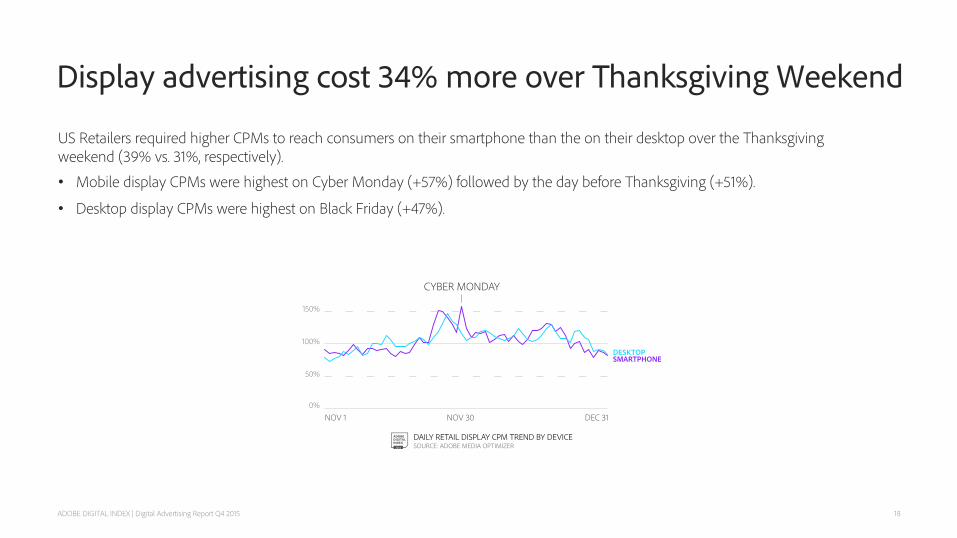
US Retailers required higher CPMs to reach consumers on their smartphone than the on their desktop over the Thanksgiving weekend (39% vs. 31%, respectively). • Mobile display CPMs were highest on Cyber Monday (+57%) followed by the day before Thanksgiving (+51%).
• Desktop display CPMs were highest on Black Friday (+47%).
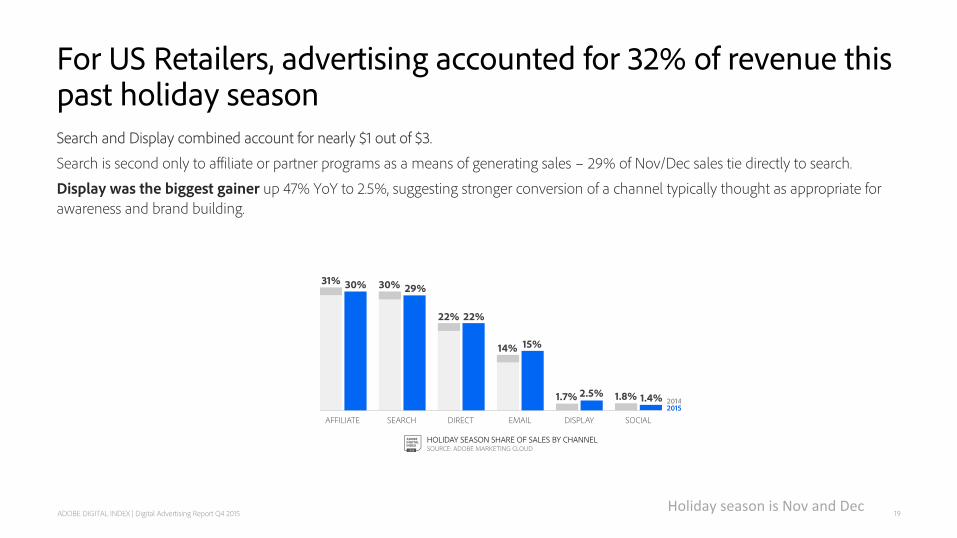
For US Retailers, advertising accounted for 32% of revenue this past holiday season
19 ADOBE DIGITAL INDEX | Digital Advertising Report Q4 2015
Search and Display combined account for nearly $1 out of $3. Search is second only to affiliate or partner programs as a means of generating sales – 29% of Nov/Dec sales tie directly to search. Display was the biggest gainer up 47% YoY to 2.5%, suggesting stronger conversion of a channel typically thought as appropriate for awareness and brand building.
Holiday season is Nov and Dec
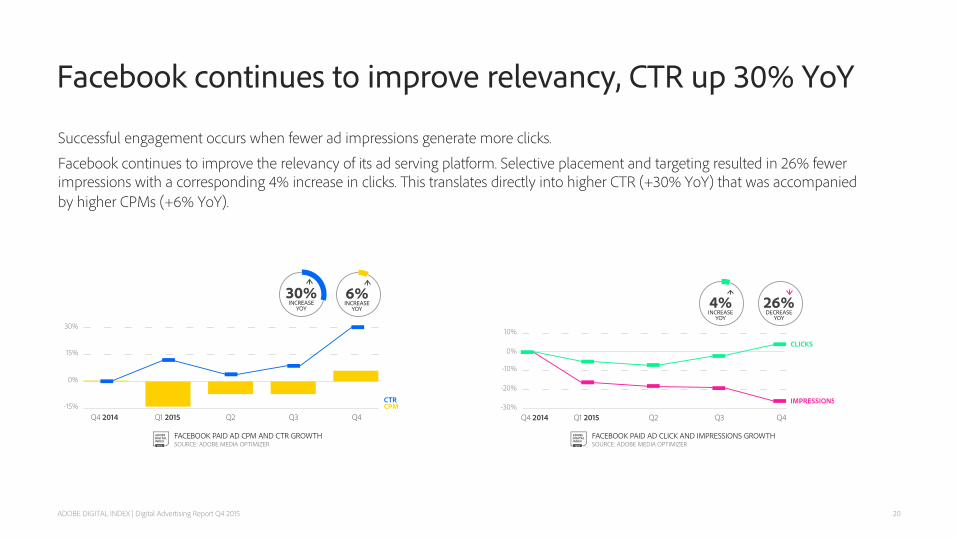
Facebook continues to improve relevancy, CTR up 30% YoY
20 ADOBE DIGITAL INDEX | Digital Advertising Report Q4 2015
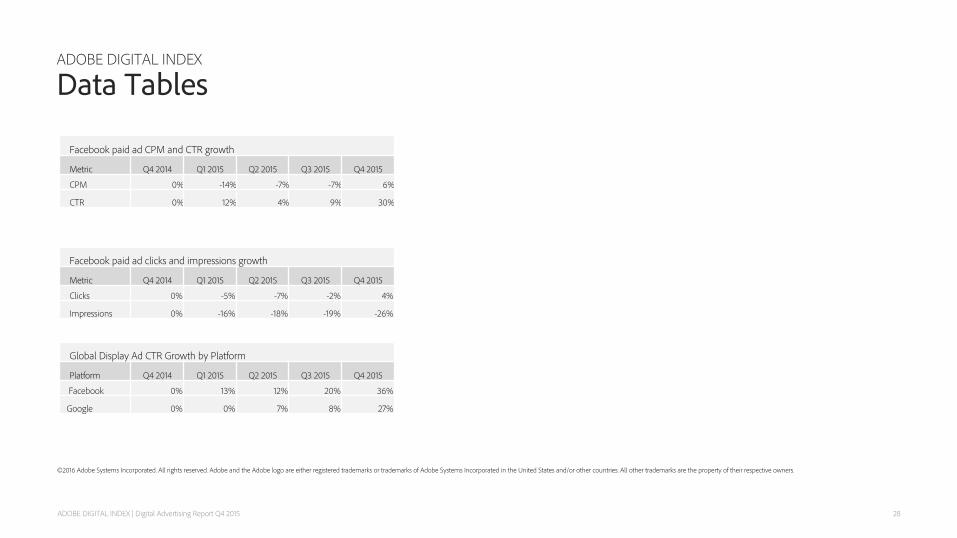
Successful engagement occurs when fewer ad impressions generate more clicks. Facebook continues to improve the relevancy of its ad serving platform. Selective placement and targeting resulted in 26% fewer impressions with a corresponding 4% increase in clicks. This translates directly into higher CTR (+30% YoY) that was accompanied by higher CPMs (+6% YoY).
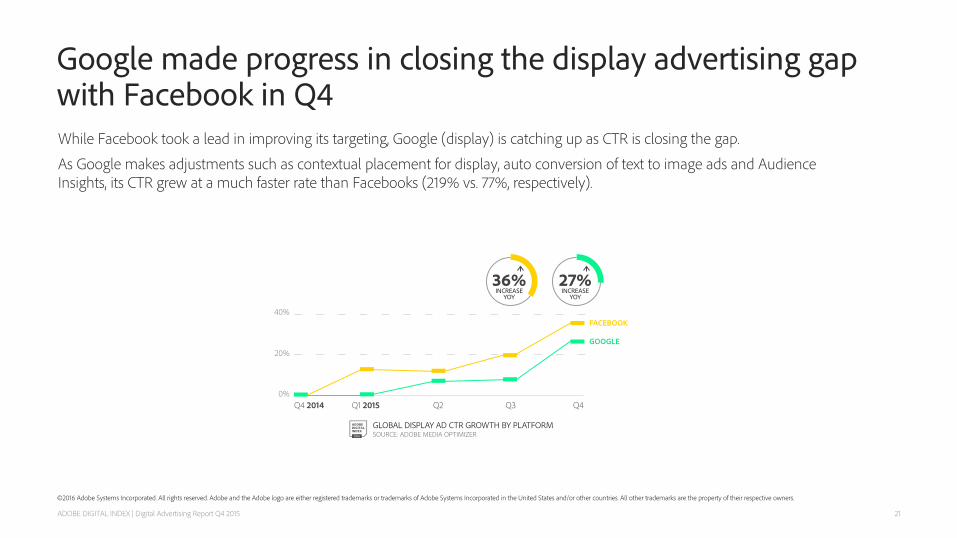
Google made progress in closing the display advertising gap with Facebook in Q4
21 ADOBE DIGITAL INDEX | Digital Advertising Report Q4 2015
While Facebook took a lead in improving its targeting, Google (display) is catching up as CTR is closing the gap. As Google makes adjustments such as contextual placement for display, auto conversion of text to image ads and Audience Insights, its CTR grew at a much faster rate than Facebooks (219% vs. 77%, respectively).
©2016 Adobe Systems Incorporated. All rights reserved. Adobe and the Adobe logo are either registered trademarks or trademarks of Adobe Systems Incorporated in the United States and/or other countries. All other trademarks are the property of their respective owners.
Appendix
Methodology, Glossary and Data Tables
Based on anonymous, aggregated consumer data from Q4 2014 through Q4 2015 from North America, Asia Pacific and Europe.
Data came from the following sources: • 400+ billion digital ad impressions from search/social platforms (Google, Facebook, Yahoo, Baidu, Yandex).
– Yahoo launched a separate search service in 2015; for consistency in YoY reporting they are reported along with Bing. They will be broken out in future editions.
• Consumer activity between Q4 2014 and Q4 2015 on 4 ,000+ branded sites across industries.
Visit our website: adobe.ly/digitalindex
Read our blog: adobe.ly/digitalindex
Follow us: @adobeindex
Ask a question or make a suggestion: [email protected]
ADOBE DIGITAL INDEX Methodology
23 ADOBE DIGITAL INDEX | Digital Advertising Report Q4 2015
©2016 Adobe Systems Incorporated. All rights reserved. Adobe and the Adobe logo are either registered trademarks or trademarks of Adobe Systems Incorporated in the United States and/or other countries. All other trademarks are the property of their respective owners.
• Acronym definitions: Anonymous and aggregated Adobe Marketing Cloud data (Adobe Media Optimizer, Adobe Analytics).
• CPC: Cost-per-click (cost divided by clicks); costs are typically in local currency to avoid changing exchange rates.
• CTR: Click-through-rate (clicks divided by impressions).
• CPM: Cost-per-thousand (cost per 1,000 impressions).
• YoY: Year-over-Year (comparing Q4 ‘15 to Q4 ’14).
• QoQ: Quarter-over-Quarter (comparing Q4 ’15 to Q4 ’15).
• PLA: Product Listing Ad on Google and Bing platforms.
• Advertising: Search, display, and email channels.
• Direct & Partners: Direct traffic and affiliates.
ADOBE DIGITAL INDEX Glossary
24 ADOBE DIGITAL INDEX | Digital Advertising Report Q4 2015
25
ADOBE DIGITAL INDEX Data Tables
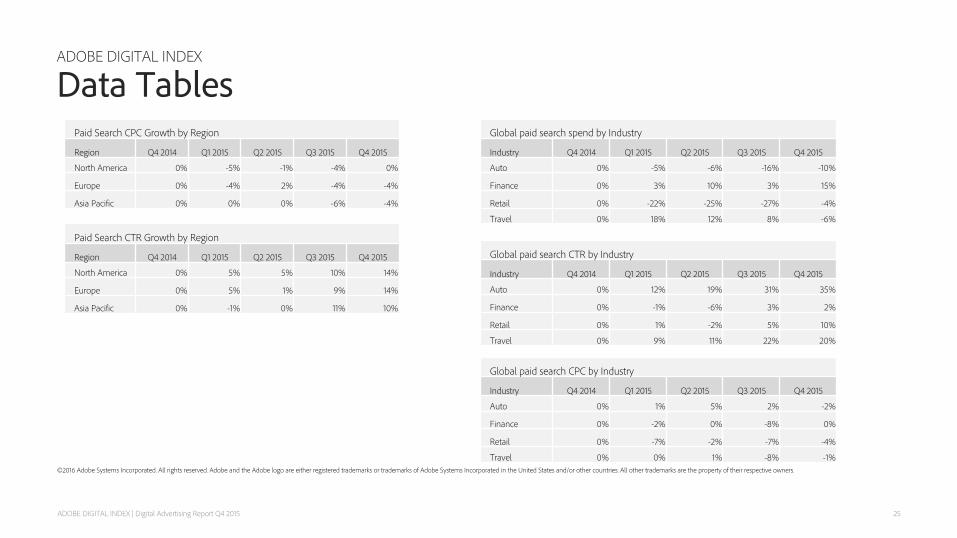
Global paid search spend by Industry
Industry Q4 2014 Q1 2015 Q2 2015 Q3 2015 Q4 2015
Auto 0% -5% -6% -16% -10%
Finance 0% 3% 10% 3% 15%
Retail 0% -22% -25% -27% -4%
Travel 0% 18% 12% 8% -6%
Paid Search CPC Growth by Region
Region Q4 2014 Q1 2015 Q2 2015 Q3 2015 Q4 2015
North America 0% -5% -1% -4% 0%
Europe 0% -4% 2% -4% -4%
Asia Pacific 0% 0% 0% -6% -4%
ADOBE DIGITAL INDEX | Digital Advertising Report Q4 2015
©2016 Adobe Systems Incorporated. All rights reserved. Adobe and the Adobe logo are either registered trademarks or trademarks of Adobe Systems Incorporated in the United States and/or other countries. All other trademarks are the property of their respective owners.
Paid Search CTR Growth by Region
Region Q4 2014 Q1 2015 Q2 2015 Q3 2015 Q4 2015
North America 0% 5% 5% 10% 14%
Europe 0% 5% 1% 9% 14%
Asia Pacific 0% -1% 0% 11% 10%
Global paid search CTR by Industry
Industry Q4 2014 Q1 2015 Q2 2015 Q3 2015 Q4 2015
Auto 0% 12% 19% 31% 35%
Finance 0% -1% -6% 3% 2%
Retail 0% 1% -2% 5% 10%
Travel 0% 9% 11% 22% 20%
Global paid search CPC by Industry
Industry Q4 2014 Q1 2015 Q2 2015 Q3 2015 Q4 2015
Auto 0% 1% 5% 2% -2%
Finance 0% -2% 0% -8% 0%
Retail 0% -7% -2% -7% -4%
Travel 0% 0% 1% -8% -1%
26
ADOBE DIGITAL INDEX Data Tables
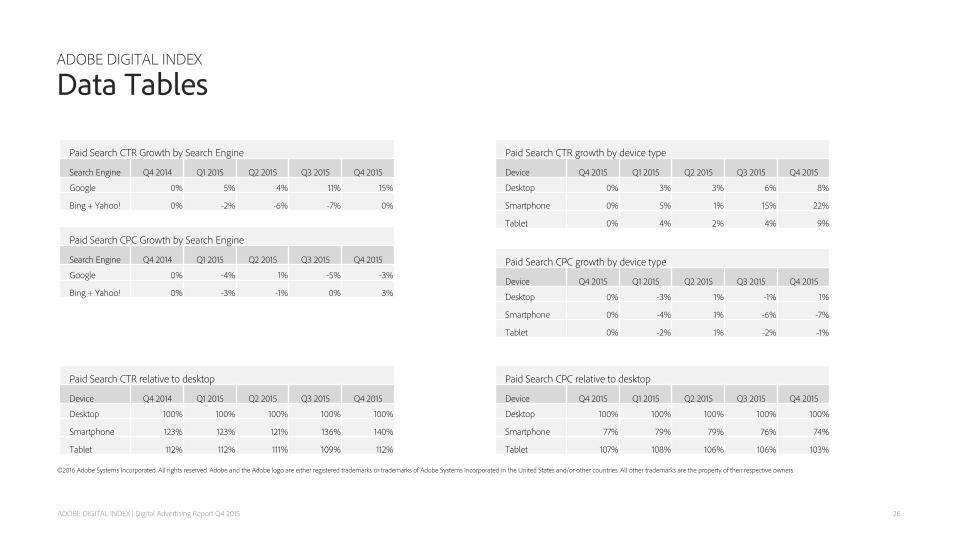
Paid Search CTR Growth by Search Engine
Search Engine Q4 2014 Q1 2015 Q2 2015 Q3 2015 Q4 2015
Google 0% 5% 4% 11% 15%
Bing + Yahoo! 0% -2% -6% -7% 0%
Paid Search CTR growth by device type
Device Q4 2015 Q1 2015 Q2 2015 Q3 2015 Q4 2015
Desktop 0% 3% 3% 6% 8%
Smartphone 0% 5% 1% 15% 22%
Tablet 0% 4% 2% 4% 9%
ADOBE DIGITAL INDEX | Digital Advertising Report Q4 2015
©2016 Adobe Systems Incorporated. All rights reserved. Adobe and the Adobe logo are either registered trademarks or trademarks of Adobe Systems Incorporated in the United States and/or other countries. All other trademarks are the property of their respective owners.
Paid Search CPC Growth by Search Engine
Search Engine Q4 2014 Q1 2015 Q2 2015 Q3 2015 Q4 2015
Google 0% -4% 1% -5% -3%
Bing + Yahoo! 0% -3% -1% 0% 3%
Paid Search CPC growth by device type
Device Q4 2015 Q1 2015 Q2 2015 Q3 2015 Q4 2015
Desktop 0% -3% 1% -1% 1%
Smartphone 0% -4% 1% -6% -7%
Tablet 0% -2% 1% -2% -1%
Paid Search CPC relative to desktop
Device Q4 2015 Q1 2015 Q2 2015 Q3 2015 Q4 2015
Desktop 100% 100% 100% 100% 100%
Smartphone 77% 79% 79% 76% 74%
Tablet 107% 108% 106% 106% 103%
Paid Search CTR relative to desktop
Device Q4 2014 Q1 2015 Q2 2015 Q3 2015 Q4 2015
Desktop 100% 100% 100% 100% 100%
Smartphone 123% 123% 121% 136% 140%
Tablet 112% 112% 111% 109% 112%
27
ADOBE DIGITAL INDEX Data Tables
Q1-Q3 Day of Month Display CPM by Quarter End Month Type 1 2 3 4 5 6 7 8 9 10 11 12 13 14 15 16 17 18 19 20 21 22 23 24 25 26 27 28 29 30 31 Quarter End 0% 0% 4% 5% 3% 9% 6% 5% 6% 11% 9% 16% 19% 22% 15% 20% 17% 20% 25% 26% 22% 16% 20% 22% 26% 27% 26% 27% 16% 17% 4% Non-‐Quarter End 0% 4% 4% 2% -‐4% 0% 1% 2% 2% 1% 0% 1% -‐2% -‐1% 3% 5% 4% 2% 3% -‐2% 1% 5% 3% 2% 1% 3% 3% 3% 11% 11% 5%
ADOBE DIGITAL INDEX | Digital Advertising Report Q4 2015
©2016 Adobe Systems Incorporated. All rights reserved. Adobe and the Adobe logo are either registered trademarks or trademarks of Adobe Systems Incorporated in the United States and/or other countries. All other trademarks are the property of their respective owners.
Daily Retail Display CPM Trend by Device (Thanksgiving Weekend 2015 indexed to October 1st )
Device 11/26/15 11/27/15 11/28/15 11/29/15 11/30/15
Desktop 1.31 1.47 1.34 1.30 1.15
Smartphone 1.50 1.40 1.29 1.17 1.57
Daily Retail Search CPC Trend by Device (Thanksgiving Weekend 2015 indexed to October 1st)
Device 11/26/15 11/27/15 11/28/15 11/29/15 11/30/15
Desktop 1.14 1.20 1.20 1.20 1.26
Smartphone 1.33 1.50 1.48 1.34 1.45
Global display advertising metric growth
Metric Q4 2014 Q1 2015 Q2 2015 Q3 2015 Q4 2015
CTR 0% 4% 7% 9% 22%
CPM 0% -11% -6% -8% 6%
Display CPM relative to desktop
Device Q4 2014 Q1 2015 Q2 2015 Q3 2015 Q4 2015
Desktop 100% 100% 100% 100% 100%
Smartphone 112% 95% 118% 149% 158% Tablet 124% 115% 119% 122% 128%
28
ADOBE DIGITAL INDEX Data Tables
ADOBE DIGITAL INDEX | Digital Advertising Report Q4 2015
©2016 Adobe Systems Incorporated. All rights reserved. Adobe and the Adobe logo are either registered trademarks or trademarks of Adobe Systems Incorporated in the United States and/or other countries. All other trademarks are the property of their respective owners.
Facebook paid ad CPM and CTR growth
Metric Q4 2014 Q1 2015 Q2 2015 Q3 2015 Q4 2015
CPM 0% -14% -7% -7% 6%
CTR 0% 12% 4% 9% 30%
Facebook paid ad clicks and impressions growth
Metric Q4 2014 Q1 2015 Q2 2015 Q3 2015 Q4 2015
Clicks 0% -5% -7% -2% 4%
Impressions 0% -16% -18% -19% -26%
Global Display Ad CTR Growth by Platform
Platform Q4 2014 Q1 2015 Q2 2015 Q3 2015 Q4 2015
Facebook 0% 13% 12% 20% 36%
Google 0% 0% 7% 8% 27%

![M&A in Advertising, Marketing Services & Marketing ...€¦ · Q4 2018 McCracken Advisory Partners - M&A in Advertising, Marketing Services & Marketing Technologies [Q4 and 2018 overview]Consolidation](https://img.pdfslide.net/doc/110x75/601b1f66ab06b11d51082561/ma-in-advertising-marketing-services-marketing-q4-2018-mccracken.jpg)