Embed Size (px)
Citation preview

CommunicatorBenchmark Report 2016Flying high or drifting low?See how you compare.
EXPERTS IN EMAIL PERFORMANCE
Welcome to the latest Communicator Benchmark Report,
analysing our stats from 2015.
communicatorcorp.com@CommCorp
Last time, you told us that our longer benchmark document was difficult to read and digest. This time
around we’ve condensed the important stuff into this easily digestible slide deck.
We’ve continued to look at specific sectors to give you the best possible insight into your activity to benchmark against other businesses within your sector. We’ve also highlighted some of the key trends from last year and
what’s hot for 2016.
EXPERTS IN EMAIL PERFORMANCE
Why Benchmark?
As marketers, we often analyse performance on a campaign by campaign basis. Benchmarking across your
sector and your competition is an invaluable way to take a step back. This can be key for strategic planning, securing future budget and planning future activity. It will also make it easier to show the real value of email as more than just
a tactical channel.
Remember to use this report when speaking to your Account Manager about areas of focus for the year ahead.
communicatorcorp.com@CommCorp
EXPERTS IN EMAIL PERFORMANCE
Let’s look at the results…
1. Year on year email sends have increased by 28%.Why?
Email works.
2. Automated emails using data to personalise achieve open rates 75% higher than non-recurring emails.
Why?Emails are tailored for individual recipients.
3. Personalised emails continue to achieve better opens, clicks and unsubscribe rates.
Why?Personalised emails drive engagement.
communicatorcorp.com@CommCorp
EXPERTS IN EMAIL PERFORMANCE
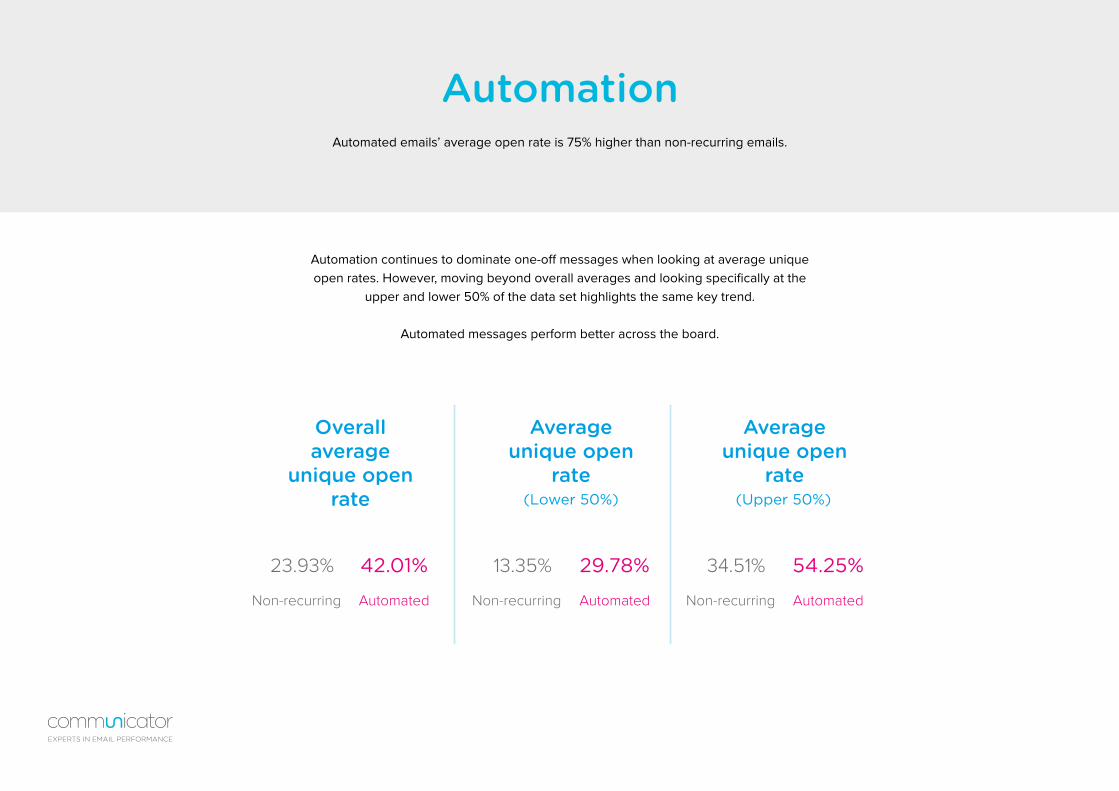
AutomationAutomated emails’ average open rate is 75% higher than non-recurring emails.
Automation continues to dominate one-off messages when looking at average unique open rates. However, moving beyond overall averages and looking specifically at the
upper and lower 50% of the data set highlights the same key trend.
Automated messages perform better across the board.
Overall average
unique open rate
Average unique open
rate(Lower 50%) (Upper 50%)
Average unique open
rate
Non-recurring Non-recurring Non-recurringAutomated Automated Automated
23.93% 13.35% 34.51%42.01% 29.78% 54.25%
EXPERTS IN EMAIL PERFORMANCE
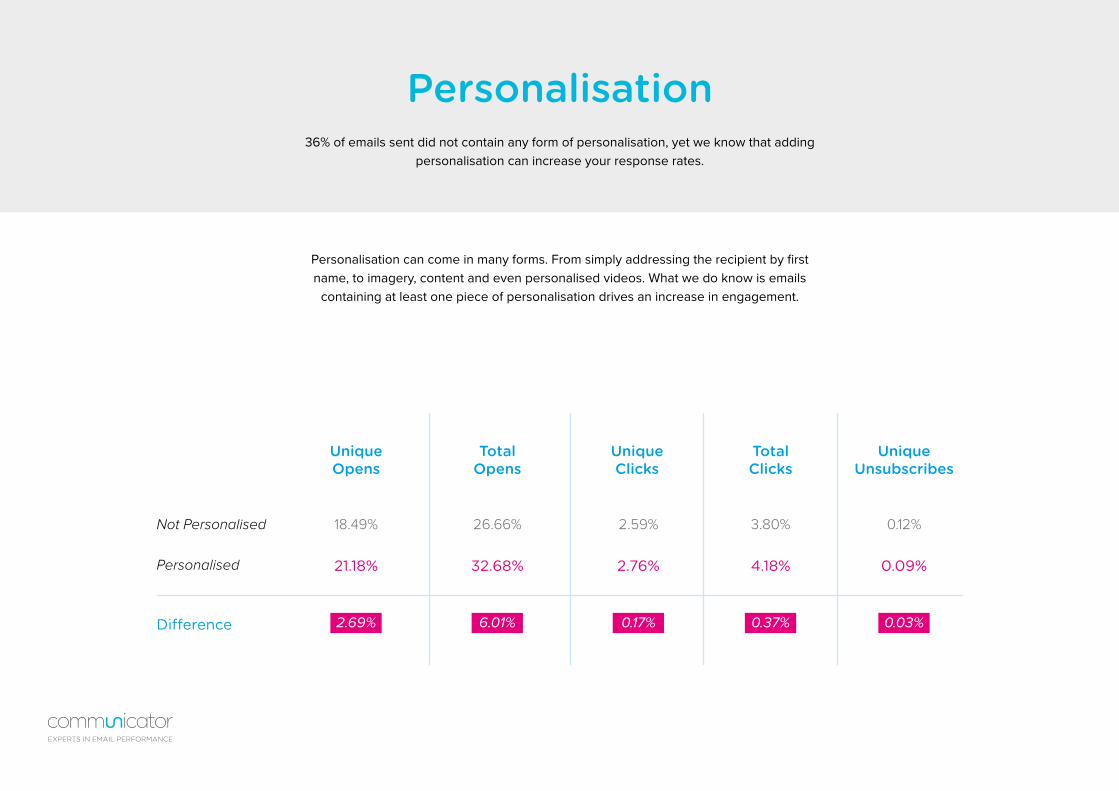
Personalisation36% of emails sent did not contain any form of personalisation, yet we know that adding
personalisation can increase your response rates.
Personalisation can come in many forms. From simply addressing the recipient by first name, to imagery, content and even personalised videos. What we do know is emails
containing at least one piece of personalisation drives an increase in engagement.
Difference
UniqueOpens
UniqueUnsubscribes
UniqueClicks
TotalOpens
TotalClicks
21.18% 32.68% 2.76% 4.18% 0.09%
Not Personalised
Personalised
18.49% 26.66% 2.59% 3.80% 0.12%
2.69% 6.01% 0.17% 0.37% 0.03%
EXPERTS IN EMAIL PERFORMANCE
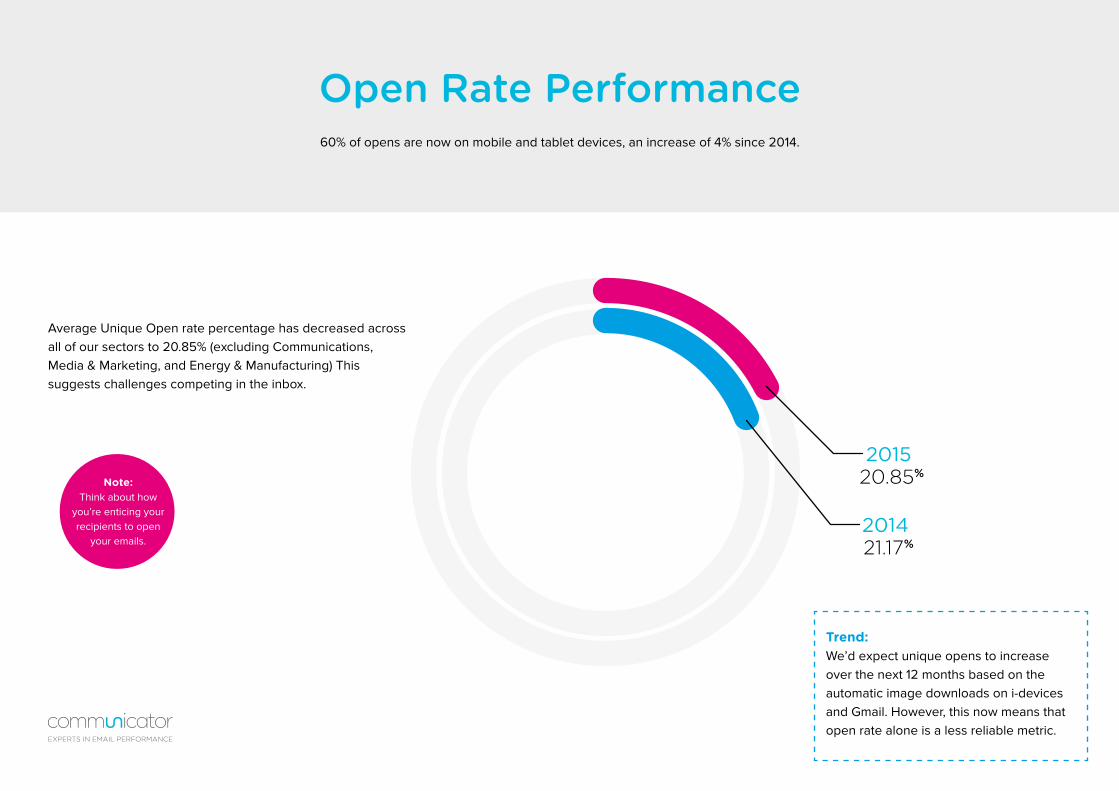
Open Rate Performance
Average Unique Open rate percentage has decreased across all of our sectors to 20.85% (excluding Communications, Media & Marketing, and Energy & Manufacturing) This suggests challenges competing in the inbox.
Trend:We’d expect unique opens to increase over the next 12 months based on the automatic image downloads on i-devices and Gmail. However, this now means that open rate alone is a less reliable metric.
60% of opens are now on mobile and tablet devices, an increase of 4% since 2014.
21.17%
20.85%
2014
2015Note:
Think about how you’re enticing your recipients to open
your emails.
EXPERTS IN EMAIL PERFORMANCE
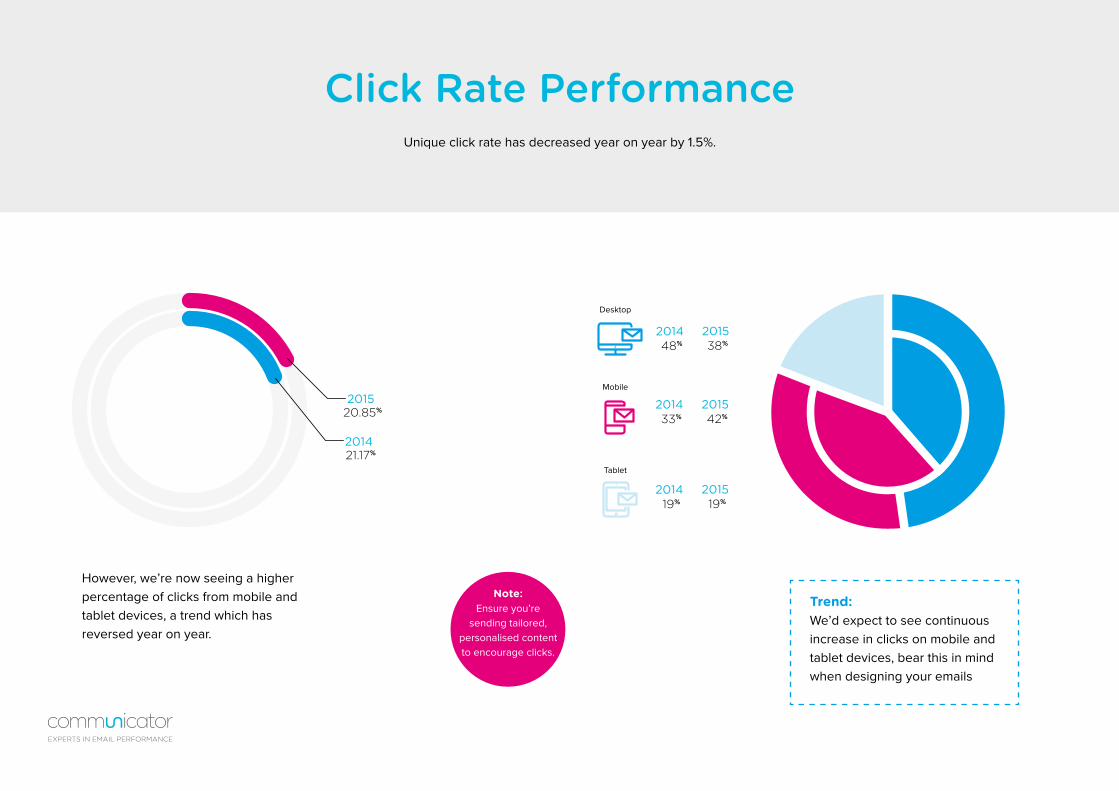
Click Rate PerformanceUnique click rate has decreased year on year by 1.5%.
21.17%
20.85%
2014
2015
However, we’re now seeing a higher percentage of clicks from mobile and tablet devices, a trend which has reversed year on year.
48%
33%
19%
38%
42%
19%
2014
2014
2014
2015
2015
2015
Desktop
Mobile
Tablet
Note:Ensure you’re
sending tailored, personalised content to encourage clicks.
Trend:We’d expect to see continuous increase in clicks on mobile and tablet devices, bear this in mind when designing your emails
EXPERTS IN EMAIL PERFORMANCE
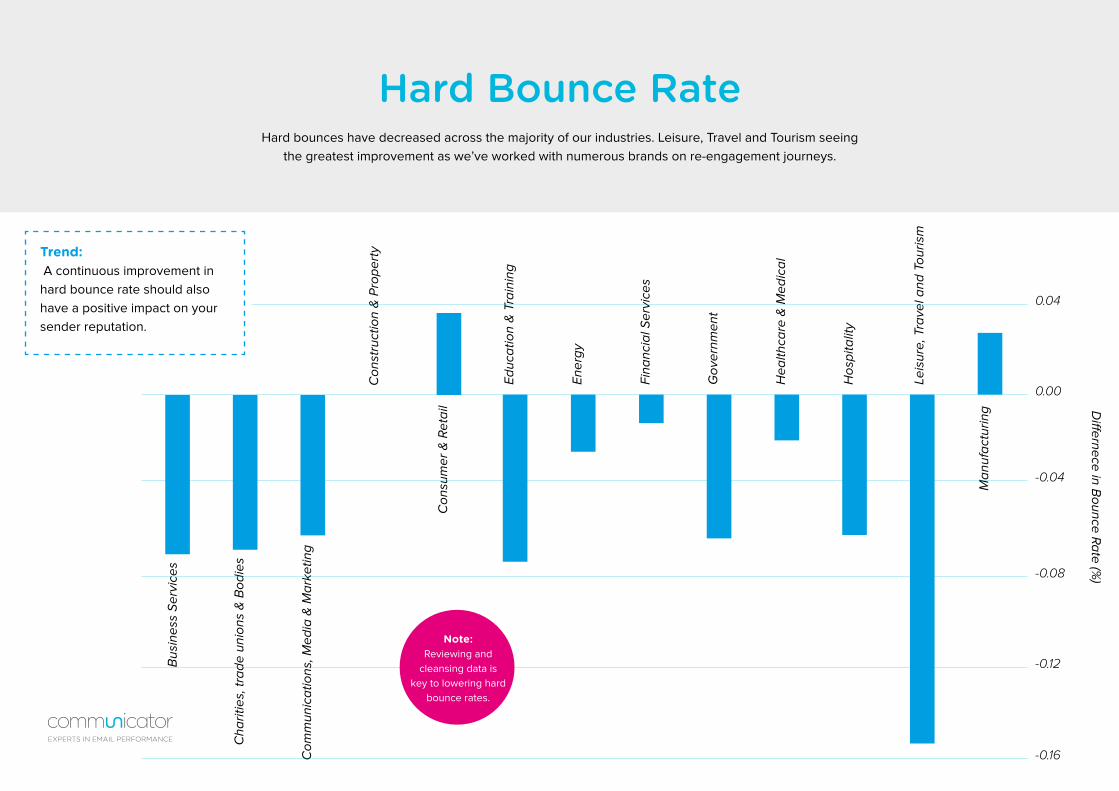
Hard Bounce RateHard bounces have decreased across the majority of our industries. Leisure, Travel and Tourism seeing
the greatest improvement as we’ve worked with numerous brands on re-engagement journeys.
0.04
0.00
-0.04
-0.08
-0.12
-0.16
Differnece in B
ounce Rate (%)
Bus
ines
s Se
rvic
es
Cha
ritie
s, tr
ade
unio
ns &
Bod
ies
Com
mun
icat
ions
, Med
ia &
Mar
ketin
g
Con
stru
ctio
n &
Pro
pert
y
Educ
atio
n &
Tra
inin
g
Ener
gy
Fina
ncia
l Ser
vice
s
Gov
ernm
ent
Hea
lthca
re &
Med
ical
Hos
pita
lity
Leis
ure,
Tra
vel a
nd T
ouris
m
Con
sum
er &
Ret
ail
Man
ufac
turin
g
Note:Reviewing and
cleansing data is key to lowering hard
bounce rates.
Trend: A continuous improvement in hard bounce rate should also have a positive impact on your sender reputation.
EXPERTS IN EMAIL PERFORMANCE
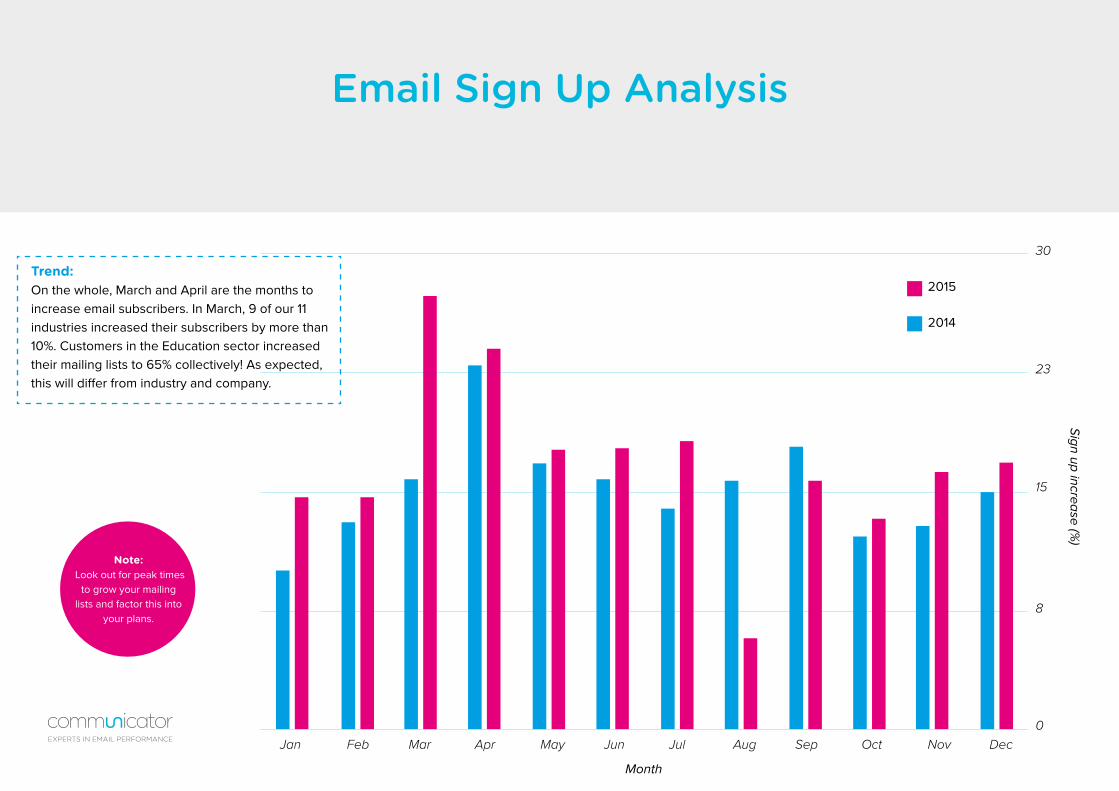
Email Sign Up Analysis
Trend:On the whole, March and April are the months to increase email subscribers. In March, 9 of our 11 industries increased their subscribers by more than 10%. Customers in the Education sector increased their mailing lists to 65% collectively! As expected, this will differ from industry and company.
2014
2015
30
23
Sign up increase (%)
Month
Jan JulApr OctFeb AugMay NovMar SepJun Dec
15
8
0
Note: Look out for peak times
to grow your mailing lists and factor this into
your plans.
EXPERTS IN EMAIL PERFORMANCE

Sectors cover page?
Resultsby SectorWhat’s rising and falling?
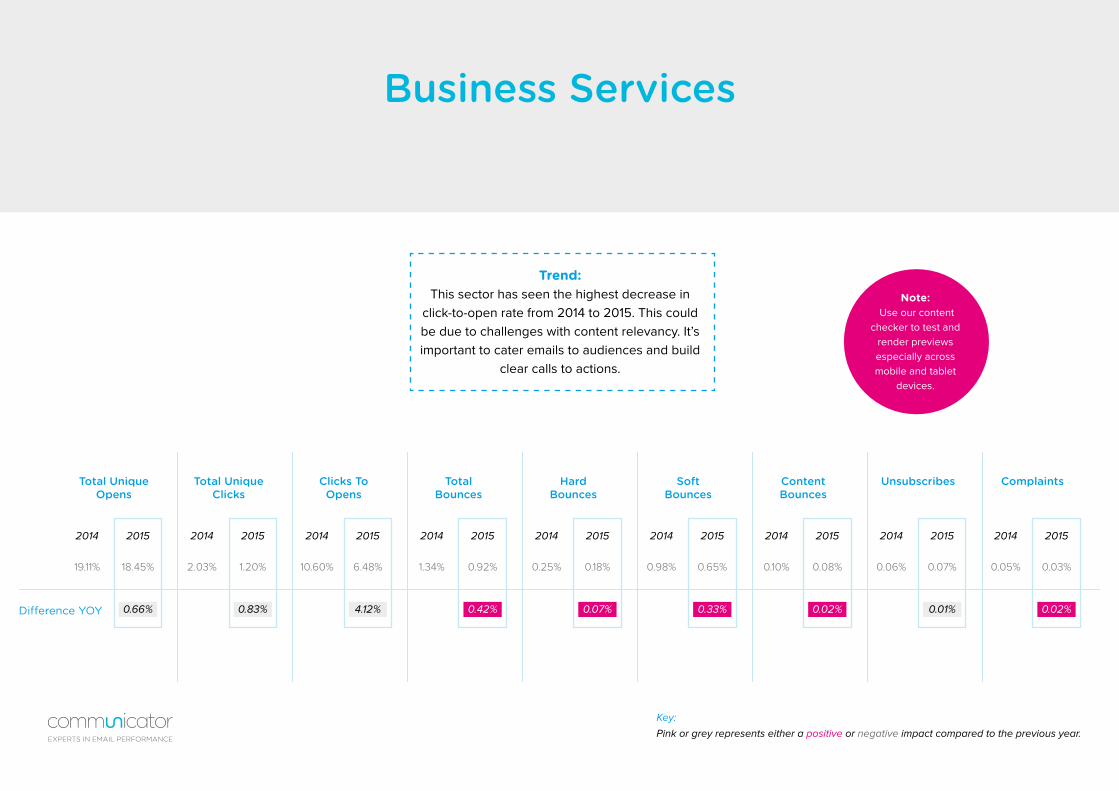
Business Services
Trend:This sector has seen the highest decrease in
click-to-open rate from 2014 to 2015. This could be due to challenges with content relevancy. It’s important to cater emails to audiences and build
clear calls to actions.
Difference YOY
Key:
Pink or grey represents either a positive or negative impact compared to the previous year.
Total Unique Opens
HardBounces
Clicks To Opens
Content Bounces
Total Unique Clicks
SoftBounces
TotalBounces
Unsubscribes Complaints
19.11% 0.25% 10.60% 0.10% 2.03% 0.98% 1.34% 0.06% 0.05% 18.45% 0.18%6.48% 0.08%1.20% 0.65%0.92% 0.07% 0.03%
2014 20142014 20142014 20142014 2014 20142015 20152015 20152015 20152015 2015 2015
0.66% 0.07%4.12% 0.02%0.83% 0.33%0.42% 0.01% 0.02%
Note: Use our content
checker to test and render previews especially across mobile and tablet
devices.
EXPERTS IN EMAIL PERFORMANCE

Charities, Trade Unions & Bodies
Difference YOY
Total Unique Opens
HardBounces
Clicks To Opens
Content Bounces
Total Unique Clicks
SoftBounces
TotalBounces
Unsubscribes Complaints
23.45% 0.30% 11.74% 0.16% 2.75% 0.30% 0.75% 0.12% 0.04% 23.01% 0.23%10.24% 0.26%2.36% 0.60%1.09% 0.45% 0.03%
2014 20142014 20142014 20142014 2014 20142015 20152015 20152015 20152015 2015 2015
0.44% 0.07%1.5% 0.1%0.39% 0.30%0.34% 0.33% 0.01%
Key:
Pink or grey represents either a positive or negative impact compared to the previous year.
Trend:This sector has sent more emails in 2015 yet
engagement in the form of opens and clicks has decreased. This suggests challenges with both competing in the inbox and content relevancy.
Note:Consider testing subject lines and content check email rendering in your
top email providers prior to sending.
EXPERTS IN EMAIL PERFORMANCE
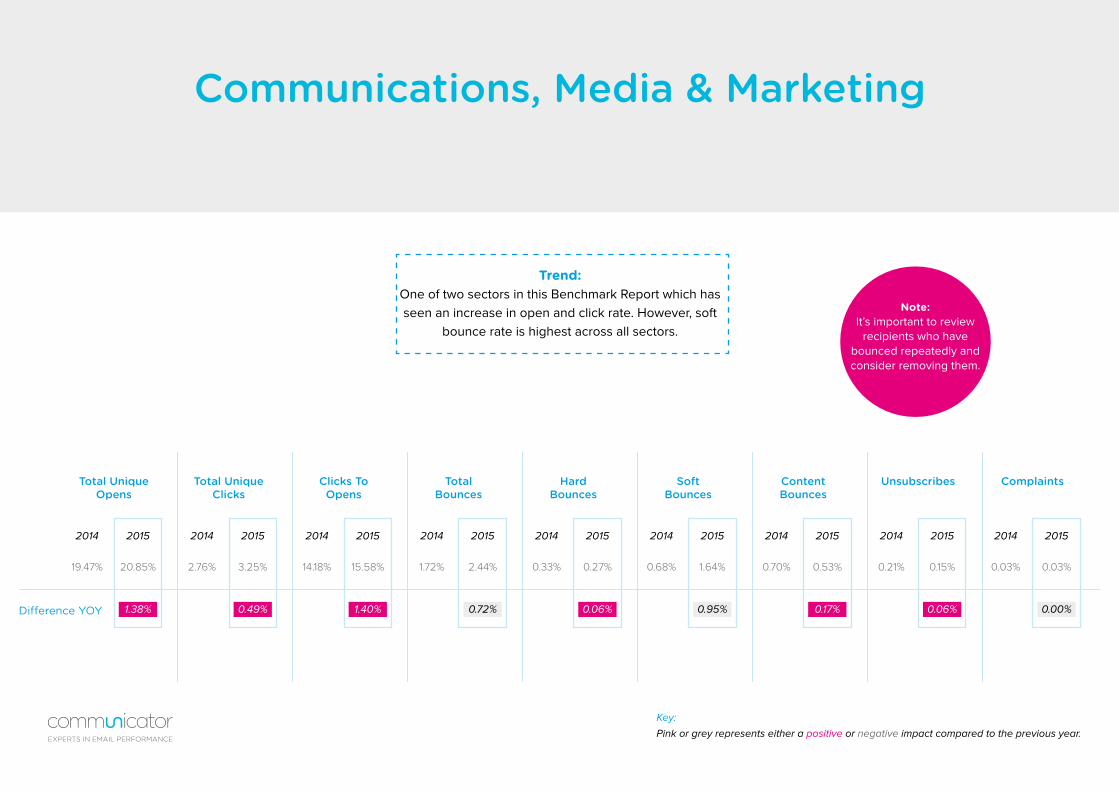
Communications, Media & Marketing
Difference YOY
Total Unique Opens
HardBounces
Clicks To Opens
Content Bounces
Total Unique Clicks
SoftBounces
TotalBounces
Unsubscribes Complaints
19.47% 0.33%14.18% 0.70% 2.76% 0.68% 1.72% 0.21% 0.03%20.85% 0.27%15.58% 0.53%3.25% 1.64%2.44% 0.15% 0.03%
2014 20142014 20142014 20142014 2014 20142015 20152015 20152015 20152015 2015 2015
1.38% 0.06%1.40% 0.17%0.49% 0.95%0.72% 0.06% 0.00%
Key:
Pink or grey represents either a positive or negative impact compared to the previous year.
Trend:One of two sectors in this Benchmark Report which has seen an increase in open and click rate. However, soft
bounce rate is highest across all sectors.
Note:It’s important to review
recipients who have bounced repeatedly and consider removing them.
EXPERTS IN EMAIL PERFORMANCE

Consumer & Retail
Difference YOY
Total Unique Opens
HardBounces
Clicks To Opens
Content Bounces
Total Unique Clicks
SoftBounces
TotalBounces
Unsubscribes Complaints
20.90% 0.11%15.45% 0.11% 3.23% 0.31% 0.53% 0.03% 0.04%20.54% 0.15%14.16% 0.14%2.91% 1.59%1.88% 0.03% 0.03%
2014 20142014 20142014 20142014 2014 20142015 20152015 20152015 20152015 2015 2015
0.36% 0.04%1.29% 0.03%0.32% 1.28%1.35% 0% 0.01%
Key:
Pink or grey represents either a positive or negative impact compared to the previous year.
Trend:Soft bounce rate is the second highest across all sectors in this Benchmark Report. Communicator
will repeatedly try and send the email to the specified address for up to 48 hours.
Note:It’s imperative to review
recipients bouncing repeatedly and consider
removing those who haven’t received your
emails.
EXPERTS IN EMAIL PERFORMANCE
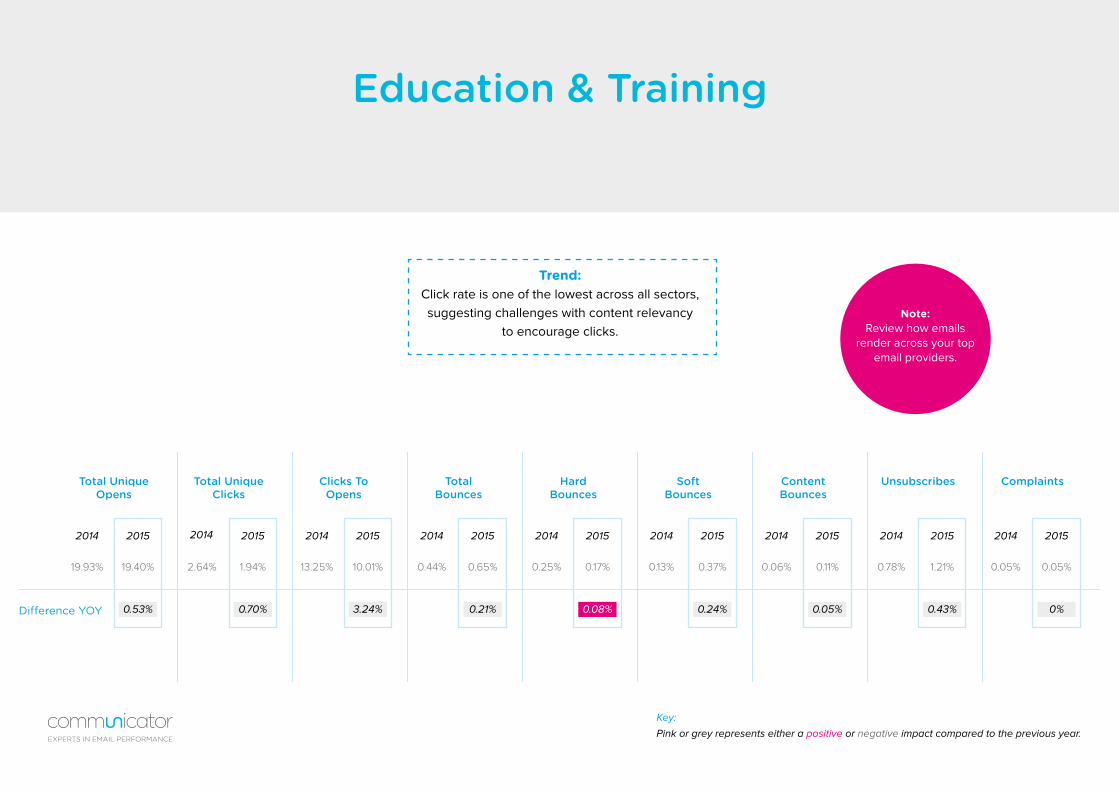
Education & Training
Difference YOY
Total Unique Opens
HardBounces
Clicks To Opens
Content Bounces
Total Unique Clicks
SoftBounces
TotalBounces
Unsubscribes Complaints
19.93% 0.25%13.25% 0.06% 2.64% 0.13% 0.44% 0.78% 0.05%19.40% 0.17%10.01% 0.11%1.94% 0.37%0.65% 1.21% 0.05%
2014 20142014 20142014 20142014 2014 20142015 20152015 20152015 20152015 2015 2015
0.53% 0.08%3.24% 0.05%0.70% 0.24%0.21% 0.43% 0%
Key:
Pink or grey represents either a positive or negative impact compared to the previous year.
Trend:Click rate is one of the lowest across all sectors, suggesting challenges with content relevancy
to encourage clicks.Note:
Review how emails render across your top
email providers.
EXPERTS IN EMAIL PERFORMANCE
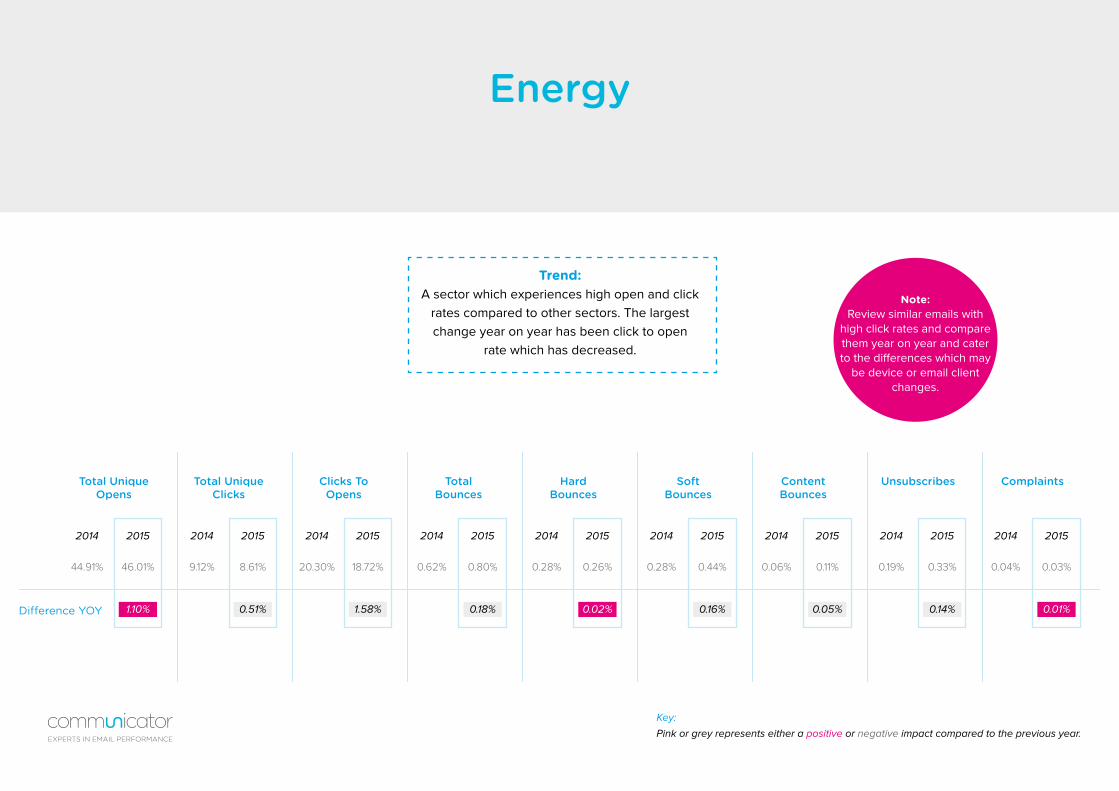
Energy
Difference YOY
Total Unique Opens
HardBounces
Clicks To Opens
Content Bounces
Total Unique Clicks
SoftBounces
TotalBounces
Unsubscribes Complaints
44.91% 0.28%20.30% 0.06% 9.12% 0.28% 0.62% 0.19% 0.04%46.01% 0.26%18.72% 0.11%8.61% 0.44%0.80% 0.33% 0.03%
2014 20142014 20142014 20142014 2014 20142015 20152015 20152015 20152015 2015 2015
1.10% 0.02%1.58% 0.05%0.51% 0.16%0.18% 0.14% 0.01%
Key:
Pink or grey represents either a positive or negative impact compared to the previous year.
Trend:A sector which experiences high open and click
rates compared to other sectors. The largest change year on year has been click to open
rate which has decreased.
Note:Review similar emails with
high click rates and compare them year on year and cater to the differences which may
be device or email client changes.
EXPERTS IN EMAIL PERFORMANCE
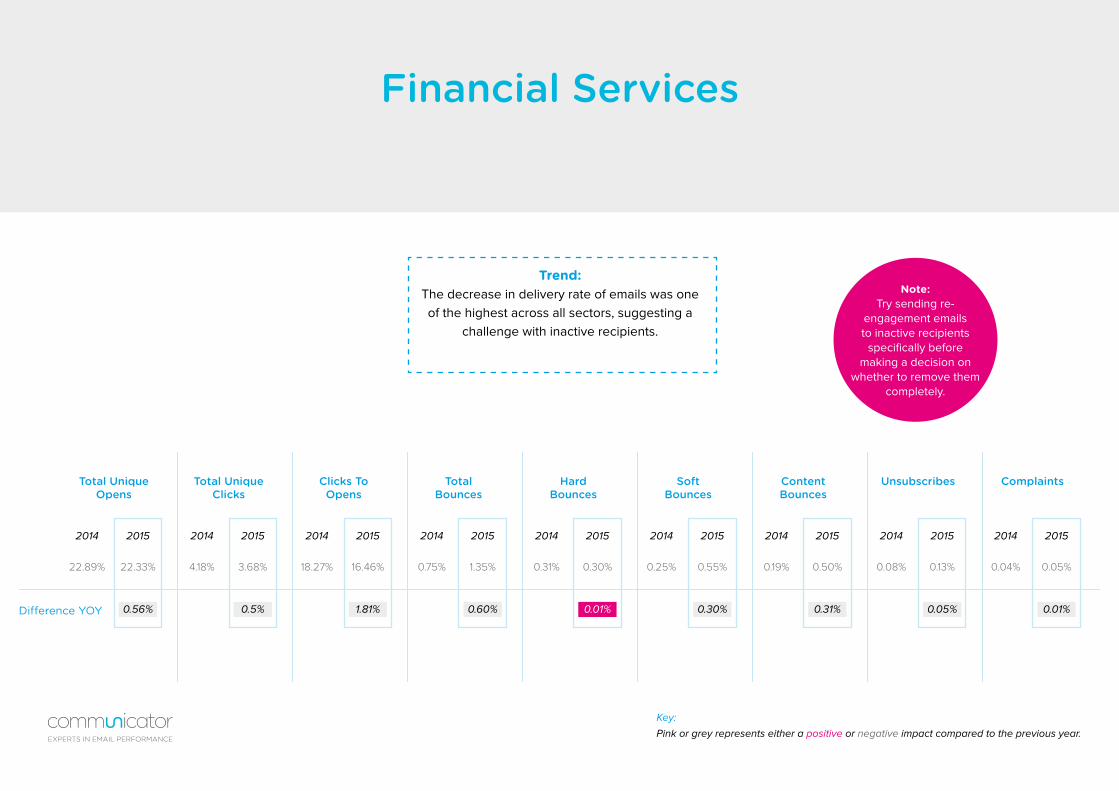
Financial Services
Difference YOY
Total Unique Opens
HardBounces
Clicks To Opens
Content Bounces
Total Unique Clicks
SoftBounces
TotalBounces
Unsubscribes Complaints
22.89% 0.31%18.27% 0.19% 4.18% 0.25% 0.75% 0.08% 0.04%22.33% 0.30%16.46% 0.50%3.68% 0.55%1.35% 0.13% 0.05%
2014 20142014 20142014 20142014 2014 20142015 20152015 20152015 20152015 2015 2015
0.56% 0.01%1.81% 0.31%0.5% 0.30%0.60% 0.05% 0.01%
Key:
Pink or grey represents either a positive or negative impact compared to the previous year.
Trend:The decrease in delivery rate of emails was one of the highest across all sectors, suggesting a
challenge with inactive recipients.
Note:Try sending re-
engagement emails to inactive recipients
specifically before making a decision on
whether to remove them completely.
EXPERTS IN EMAIL PERFORMANCE
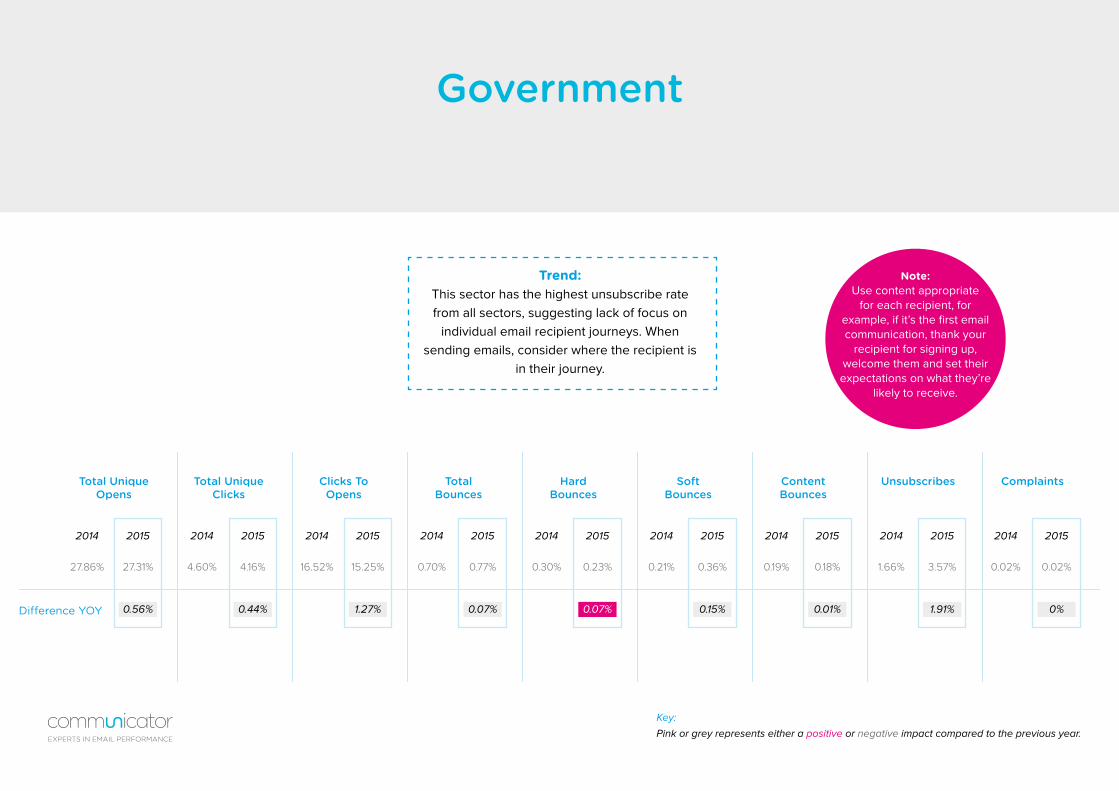
Government
Difference YOY
Total Unique Opens
HardBounces
Clicks To Opens
Content Bounces
Total Unique Clicks
SoftBounces
TotalBounces
Unsubscribes Complaints
27.86% 0.30%16.52% 0.19% 4.60% 0.21% 0.70% 1.66% 0.02%27.31% 0.23%15.25% 0.18%4.16% 0.36%0.77% 3.57% 0.02%
2014 20142014 20142014 20142014 2014 20142015 20152015 20152015 20152015 2015 2015
0.56% 0.07%1.27% 0.01%0.44% 0.15%0.07% 1.91% 0%
Key:
Pink or grey represents either a positive or negative impact compared to the previous year.
Trend:This sector has the highest unsubscribe rate from all sectors, suggesting lack of focus on
individual email recipient journeys. When sending emails, consider where the recipient is
in their journey.
Note:Use content appropriate
for each recipient, for example, if it’s the first email communication, thank your
recipient for signing up, welcome them and set their expectations on what they’re
likely to receive.
EXPERTS IN EMAIL PERFORMANCE
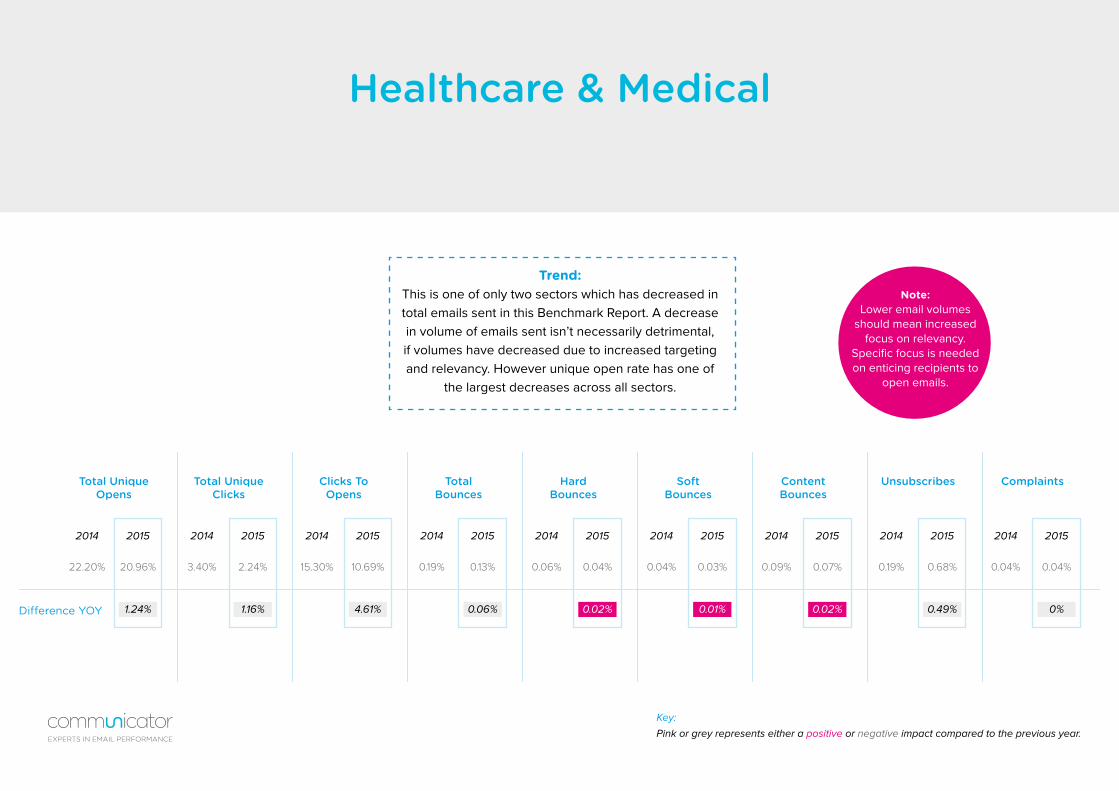
Healthcare & Medical
Difference YOY
Total Unique Opens
HardBounces
Clicks To Opens
Content Bounces
Total Unique Clicks
SoftBounces
TotalBounces
Unsubscribes Complaints
22.20% 0.06%15.30% 0.09% 3.40% 0.04% 0.19% 0.19% 0.04%20.96% 0.04%10.69% 0.07%2.24% 0.03%0.13% 0.68% 0.04%
2014 20142014 20142014 20142014 2014 20142015 20152015 20152015 20152015 2015 2015
1.24% 0.02%4.61% 0.02%1.16% 0.01%0.06% 0.49% 0%
Key:
Pink or grey represents either a positive or negative impact compared to the previous year.
Trend:This is one of only two sectors which has decreased in total emails sent in this Benchmark Report. A decrease in volume of emails sent isn’t necessarily detrimental, if volumes have decreased due to increased targeting and relevancy. However unique open rate has one of
the largest decreases across all sectors.
Note:Lower email volumes
should mean increased focus on relevancy.
Specific focus is needed on enticing recipients to
open emails.
EXPERTS IN EMAIL PERFORMANCE
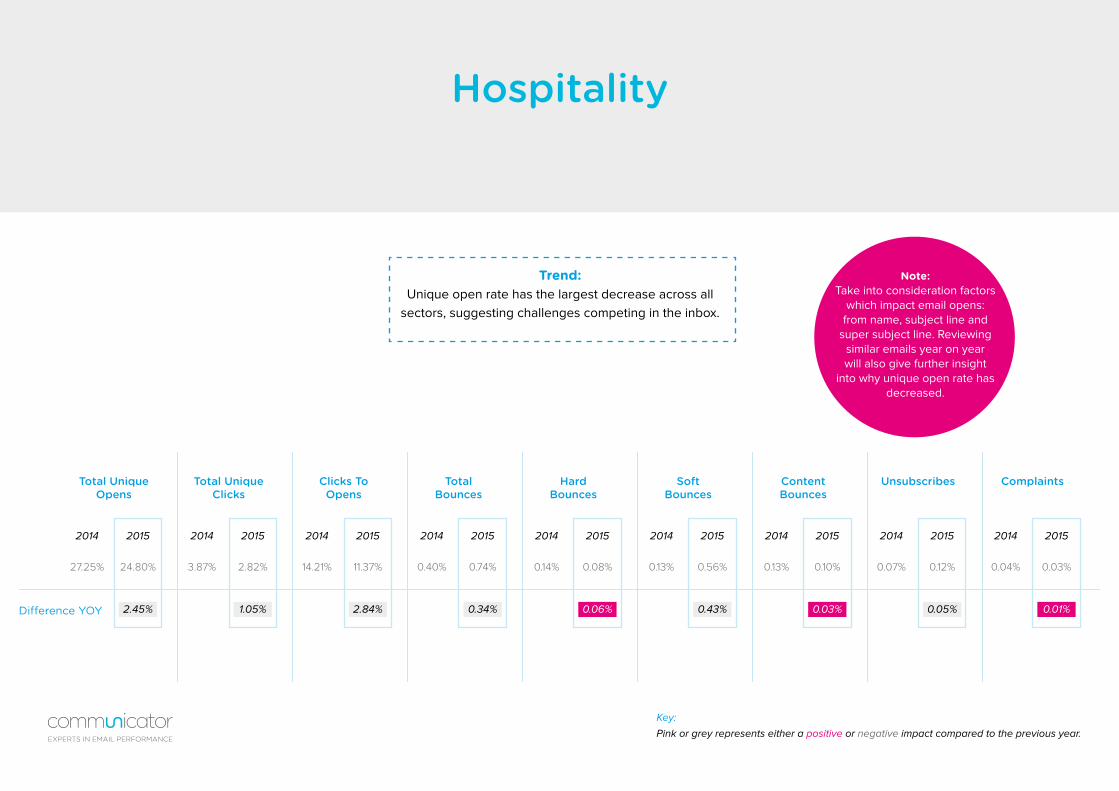
Hospitality
Difference YOY
Total Unique Opens
HardBounces
Clicks To Opens
Content Bounces
Total Unique Clicks
SoftBounces
TotalBounces
Unsubscribes Complaints
27.25% 0.14%14.21% 0.13% 3.87% 0.13% 0.40% 0.07% 0.04%24.80% 0.08%11.37% 0.10%2.82% 0.56%0.74% 0.12% 0.03%
2014 20142014 20142014 20142014 2014 20142015 20152015 20152015 20152015 2015 2015
2.45% 0.06%2.84% 0.03%1.05% 0.43%0.34% 0.05% 0.01%
Key:
Pink or grey represents either a positive or negative impact compared to the previous year.
Trend:Unique open rate has the largest decrease across all
sectors, suggesting challenges competing in the inbox.
Note:Take into consideration factors
which impact email opens: from name, subject line and
super subject line. Reviewing similar emails year on year will also give further insight
into why unique open rate has decreased.
EXPERTS IN EMAIL PERFORMANCE
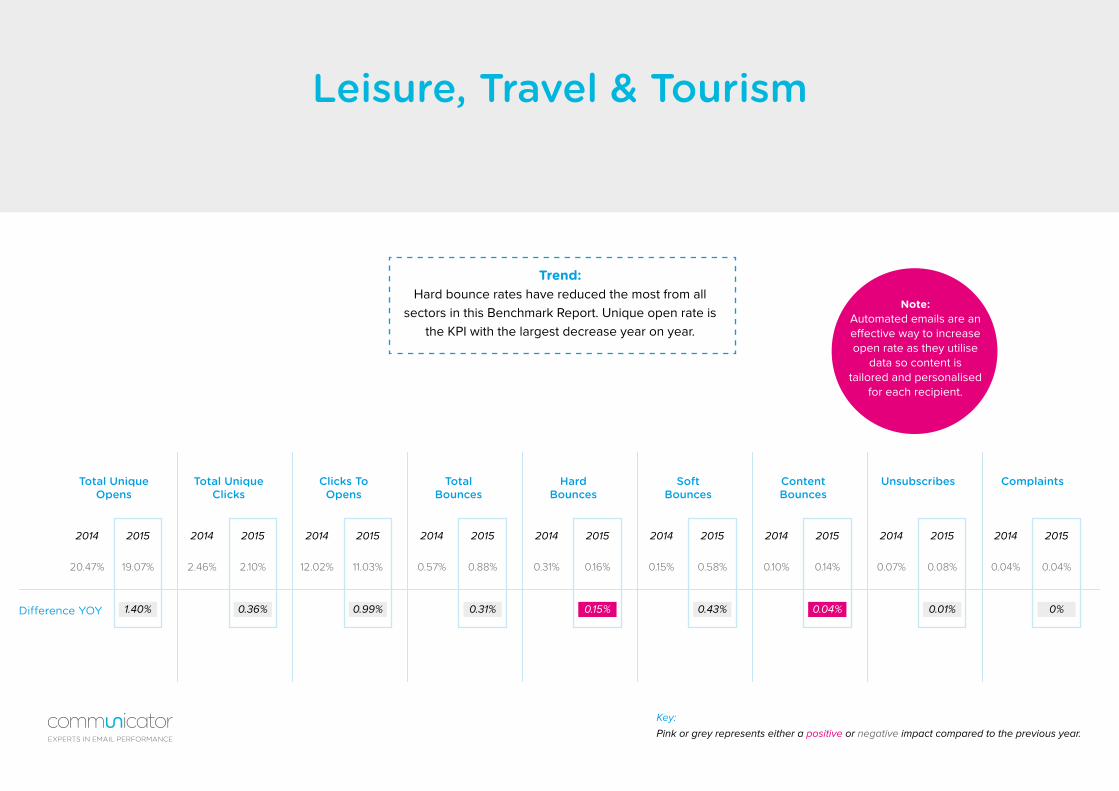
Leisure, Travel & Tourism
Difference YOY
Total Unique Opens
HardBounces
Clicks To Opens
Content Bounces
Total Unique Clicks
SoftBounces
TotalBounces
Unsubscribes Complaints
20.47% 0.31%12.02% 0.10% 2.46% 0.15% 0.57% 0.07% 0.04%19.07% 0.16%11.03% 0.14%2.10% 0.58%0.88% 0.08% 0.04%
2014 20142014 20142014 20142014 2014 20142015 20152015 20152015 20152015 2015 2015
1.40% 0.15%0.99% 0.04%0.36% 0.43%0.31% 0.01% 0%
Key:
Pink or grey represents either a positive or negative impact compared to the previous year.
Trend:Hard bounce rates have reduced the most from all
sectors in this Benchmark Report. Unique open rate is the KPI with the largest decrease year on year.
Note:Automated emails are an effective way to increase open rate as they utilise
data so content is tailored and personalised
for each recipient.
EXPERTS IN EMAIL PERFORMANCE
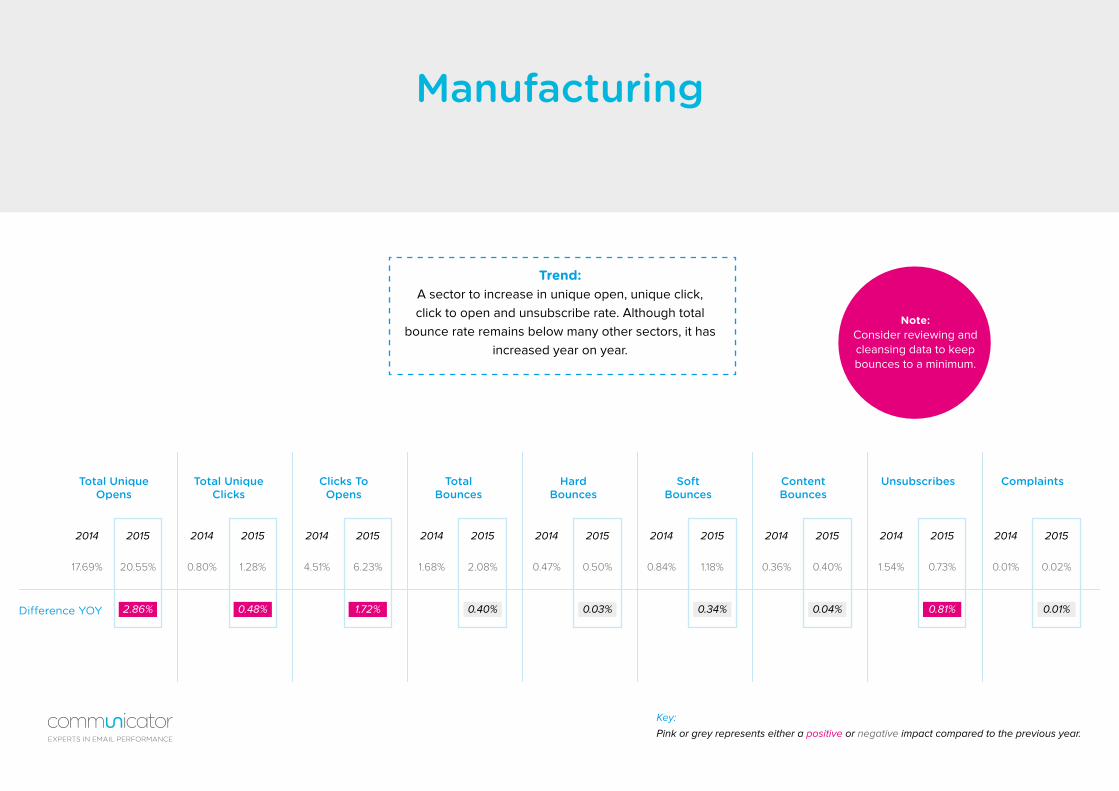
Manufacturing
Difference YOY
Total Unique Opens
HardBounces
Clicks To Opens
Content Bounces
Total Unique Clicks
SoftBounces
TotalBounces
Unsubscribes Complaints
17.69% 0.47%4.51% 0.36% 0.80% 0.84% 1.68% 1.54% 0.01%20.55% 0.50%6.23% 0.40%1.28% 1.18%2.08% 0.73% 0.02%
2014 20142014 20142014 20142014 2014 20142015 20152015 20152015 20152015 2015 2015
2.86% 0.03%1.72% 0.04%0.48% 0.34%0.40% 0.81% 0.01%
Key:
Pink or grey represents either a positive or negative impact compared to the previous year.
Trend:A sector to increase in unique open, unique click, click to open and unsubscribe rate. Although total
bounce rate remains below many other sectors, it has increased year on year.
Note:Consider reviewing and cleansing data to keep bounces to a minimum.
EXPERTS IN EMAIL PERFORMANCE

Sectors cover page?
Twitter: @CommCorpPhone: +44 (0) 844 870 8971Email: [email protected]: www.communicatorcorp.com
EXPERTS IN EMAIL PERFORMANCE