Embed Size (px)
Citation preview

© 2013 IBM Corporation
Usability AnalyticsGain deeper insight into customer intent across web and mobile with IBM Customer Analytics

Retail at a Glance
By 2016, 50% of all retail dollars spent in the U.S will be influenced digitally
2/3
of U.S. adults who encountered an issue left the site or visited a
competitor
32%
of those who had an issue contacted
customer support (increased operational
costs)
26%
of U.S. adults users purchased an item on
a tablet
1/3
of U.S. adults using retail sites or mobile apps experienced at
least one issue

Retailers are struggling to deliver a strong digital customer experience
Usability issues greatly impact customer experience
85% of visitors abandon a new site due to poor design - cPulse
62% of web shoppers gave up looking for the item they wanted to buy online - Zone Study
50% of web sales are lost because visitors can’t easily find content -Gartner Group
Only 51% of sites complied with simple web usability principles - - Forrester study of 20
major sites
Distribution Of 1,500 Website User Experience Review Scores
Fail Pass
Source: Forrester’s Website User Experience Reviews, November 1999 through January 2012
Few websites meet customer expectations

4
IBM ConfidentialJanuary 15, 2015
74% of businesses believe that user experience is key for improving sales conversions, and loyalty
– eConsultancy, 2013

Source: Gartner ,“Best Practices for Driving Business Value through Usability and User Experience”Published: 20 November 2012Source: Forrester Lessons Learned From 1,500 Website User Experience Reviews, March 2012
Business Value to Customers
Increase Revenue More orders per customer More repeat engagements More products per order Increase in Ad revenue
Reduce Costs Fewer support calls Fewer returns due to
mistakes or misperceptions
More efficient server use
Usability is the front line of shaping customer experience As companies continue to increase their digital business
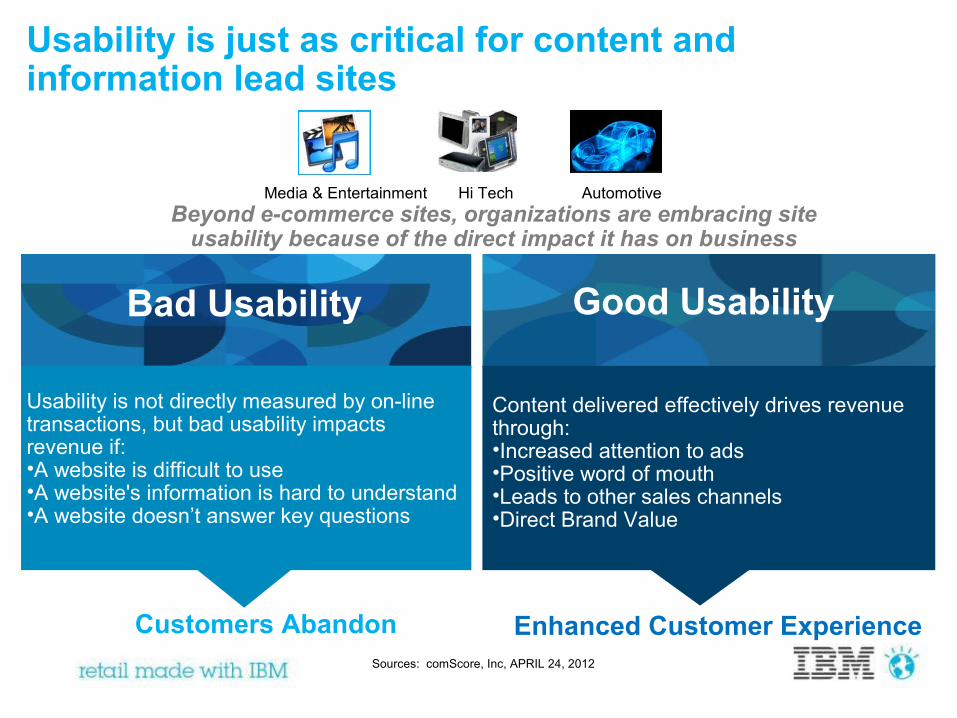
Usability is just as critical for content and information lead sites
Sources: comScore, Inc, APRIL 24, 2012
Beyond e-commerce sites, organizations are embracing site usability because of the direct impact it has on business
Media & Entertainment Hi Tech Automotive
Customers Abandon Enhanced Customer Experience
Bad Usability
Usability is not directly measured by on-line transactions, but bad usability impacts revenue if:•A website is difficult to use•A website's information is hard to understand•A website doesn’t answer key questions
Good Usability
Content delivered effectively drives revenue through:•Increased attention to ads•Positive word of mouth•Leads to other sales channels•Direct Brand Value

To get the complete picture of your customer’s experience, focus on intent and action.
CUSTOMER INTENT (Usability Analytics)
CUSTOMER ACTION(Transaction Analytics)
Is the content of the page designed effectively?
Are people able to find what they are looking for?
Are links and buttons in places where people would expect them to be?
Jump in error messages.
Repeating to the same screens over and over.
Starting the checkout process, but not successfully transacting.
Or paying a bill in on-line and not getting to the confirmation page.

Where do your promotions draw the most attention?
Analyzing Customer Intent:
When changing promotion placement, can you quantify changes in user attention with each move?
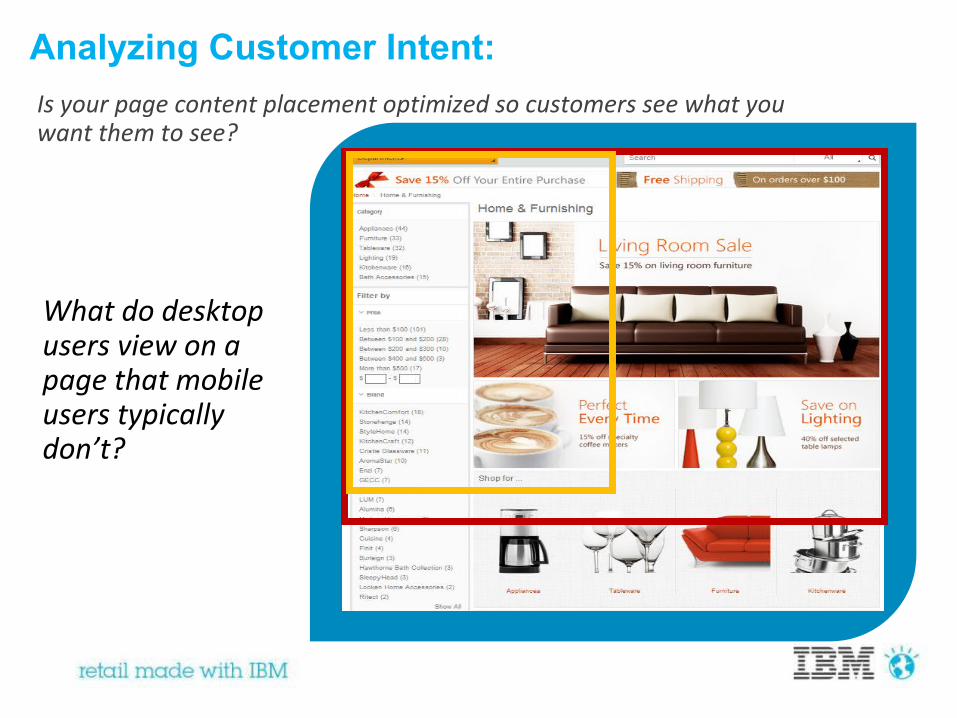
Is your page content placement optimized so customers see what you want them to see?
What do desktop users view on a page that mobile users typically don’t?
Analyzing Customer Intent:

Experience Your Customers

The Gap - No Visibility into Why Customers Succeed or Fail
But why did customers succeed or fail
on our site?
Performance Metrics
Server Logs
IT
Calls
Emails
SurveysCustomer
Service
Business Trends
Funnel Reports
Business

Filling the Gap: Requires Visibility Into the Actual Customer Experience
Performance Metrics
Server Logs
IT
Calls
Emails
SurveysCustomer
Service
Business Trends
Funnel Reports
Business
Tealeaf Captures Every Customer, Every Interaction, Every Time
ActionsActions
Interactions
Interactions
IssuesIssues

Every Digital Interaction is Documented; Every Digital Experience Becomes Quantifiable
Context

All interactionsAll interactions
All customer experience obstacles
All customer experience obstacles
14
All actionsAll actions
Tealeaf Captures Every Customer, Every Interaction, Every Time

Many industries use IBM Tealeaf for transactional and self service sites
44 of the Internet Retailer Top 100; 7 of the top 10 online retailers
8 of 10 of the Top Bank Holding Companies
9 of the 12 Largest P&C Insurance Companies in North America
10 of 12 of the most booked travel portals
50% of the top US airline carriers
All Major North American Wireless Providers

Determinewhat part of a page are users spending most of
their time
UnderstandWhat form fields cause customers struggle or drop off
IdentifyThe relative popularity and value of each link on a page
cxOverstat delivers actionable usability analytics
DiscoverWhere your visitors click and hover on a
page
cxOverstat enables companies to capture, segment, and visualize customer behavior across online and mobile sites in order to take intelligent actions that
enhance overall site usability.
16
Actionable Usability Analytics
SegmentUsability data by dimension for more
focused behavior analysis.
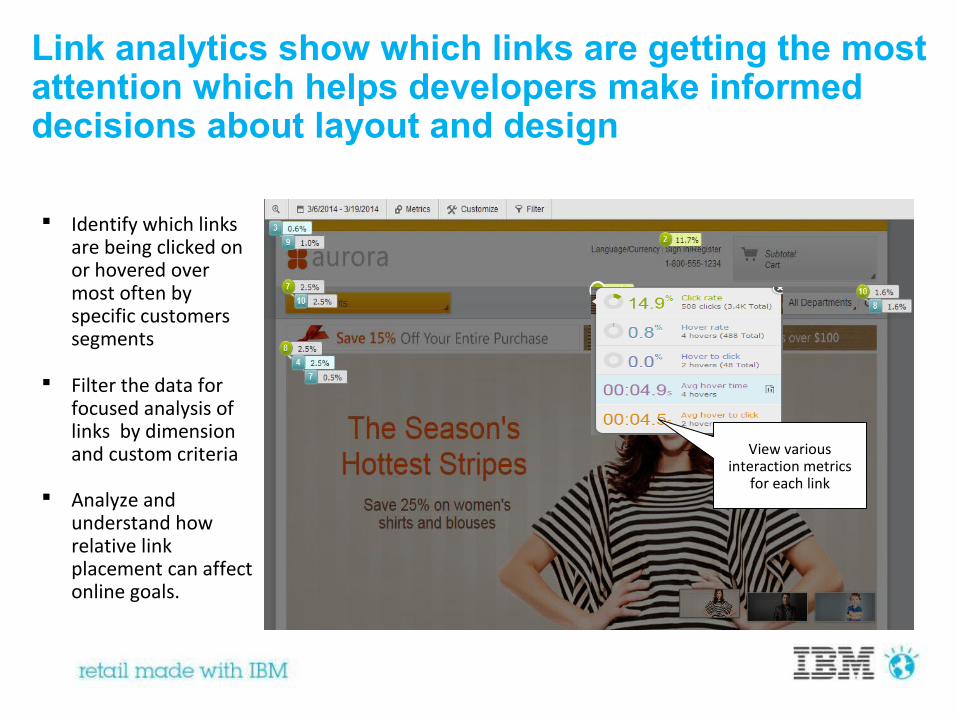
Link analytics show which links are getting the most attention which helps developers make informed decisions about layout and design
Identify which links are being clicked on or hovered over most often by specific customers segments
Filter the data for focused analysis of links by dimension and custom criteria
Analyze and understand how relative link placement can affect online goals.
View various interaction metrics
for each link

Click heat maps let you optimize the placement of key content enhancing your visitor’s experience
Identify the regions of a page where visitors have clicked or hovered whether its live links or static images
Drill down on specific areas where customers are clicking to more deeply analyze those user sessions and understand why
Uncover usability flaws that cause customers confusion and struggle.
Sub-Select:Drill down to specific data points
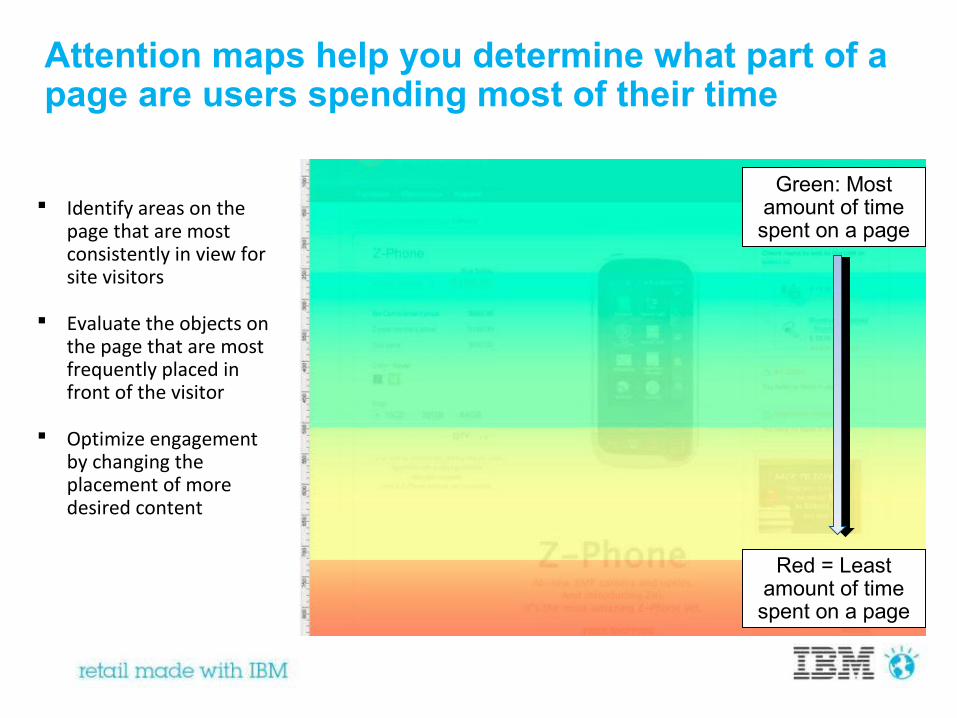
Attention maps help you determine what part of a page are users spending most of their time
Red = Least amount of time spent on a page
Green: Most amount of time spent on a page
Identify areas on the page that are most consistently in view for site visitors
Evaluate the objects on the page that are most frequently placed in front of the visitor
Optimize engagement by changing the placement of more desired content

See the percentage of users that drop off at each step, what percentage are completing the
form.
20
Evaluate the effectiveness of a form in capturing entered information and how well visitors are able to complete it.
Monitor dwell time on individual fields, which may be an indicator of customer
Understand drop-off rates if the form was not completed.
Form analytics help optimize each and every field to increase form conversion and completion rates

Segmentation and dimensioning analysis allow you to filter data and analyze the behavior of specific customer segments
Understand why different customer segments behave and react differently on a page.
Use filters to focus analysis on a specific criteria and activities to find what you’
Use goal based dimensions to segment events by actions occurring after the event takes place

Comparison Analytics
Compare how users are interacting differently across regions of a page
Segment results by different customer groups to understand the business impact
Drill down on specific areas to more deeply analyze those user sessions and understand why
Uncover usability patterns that cause customers confusion and struggle

Enhancing the cxOverstat Experience with Snapshots
cxOverstat allows marketing and merchandizing users to:
1. Capture the necessary pages for in-depth analysis2. Manage all the snapshots in the gallery3. Analyze content with overlays4. Collaborate across teams to improve usability experience

In-depth analysis with Snapshot Gallery
Improve conversion rates and optimize page flows by discovering sources of struggle down to specific form fields
Optimize landing pages by replaying the complete experience of specific users to understand why they clicked on unexpected links
Enhance placement of page content and calls to action for even dynamic, rich internet applications
Improve campaign performance by understanding why different segments of users behaved differently on any page
Business benefits of actionable usability analytics
Actionable Usability Analytics

Customer experience like you’ve never seen it before
Context makes usability analytics actionable• Get insight into why some customers behave differently: drill down from any usability
report to see the behavior of individual customers• See the differences in behavior for different segments of users: filter reports by any custom
dimension such gold vs. silver customers• Understand why one segment of customers behaves differently: custom dimensions & drill
down to replay delivers actionable context
Integral component for a complete CEM solution• Combine with broader CEM capabilities, such as replay, for identifying struggle hot spots,
correlating with VOC feedback & tracking CEM KPIs• Scalable, enterprise solution capable of supporting high-volume sites
Highly visual analysis for highly interactive sites• Analyze dynamic pages even if it uses JavaScript, AJAX etc.• Intuitive visualizations such as heat maps, attention maps, link and form analytics extend
user understanding of your site

You could visualize customer behavior in ways that allow for easy consumption and quantification of data so that you can take action to improve customer experience?
Leading enterprises are using Tealeaf cxOverstat to make website usability data clear, measurable, and actionableWhat if...
Top internet travel website did! Leading sports apparel manufacturer did!
Created a focused strategy for placement of imagery and animation by using heatmaps to see what is attracting the most attention.
Personalized site experience by using segmentation and dimensional analysis to understand how behavior differs across geos and customize sites
Improve conversion rates by using form analytics to understand cart abandonment and where struggles occur that cause customers to leave.
Improved conversion by using form analytics to understand where people are dropping and dwelling.
Optimized page content by using heatmaps maps to see where costumes are clicking, and paying attention
Better determined customer intent by using drill down capabilities to compare ratios of focused clicks across page elements.
IBM ExperienceOne helps you attract, delight and maximize the lifetime value of
customers by enriching the ways you engage with each of them