Embed Size (px)
Citation preview
How to Calculate Content Marketing ROI
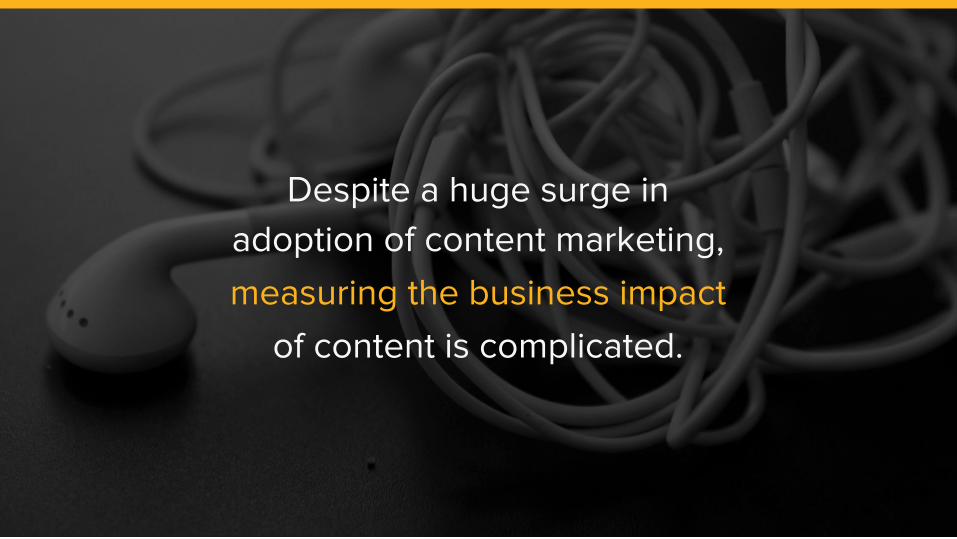
Despite a huge surge in
adoption of content marketing,
measuring the business impact
of content is complicated.
HOW DO I CALCULATE CONTENT MARKETING ROI?
Is the most common question we hear
from marketers struggling to build their
own business case internally.
“
”
Many are plagued by their inability to measure
the effectiveness of their content initiatives...
but they’re measuring too narrowly...
and vanity metrics such as “likes” and “views”
aren’t enough on their own merit.
Marketers need to be able to measure
things that have a quantifiable value that
they can take to the bank.
In this guide, we’ll map out how to
calculate the impact of content across the business
and the recommended metrics to benchmark your
content initiatives.

TABLE OF CONTENTS
BUILD THE BUSINESS CASE
FIND THE BUDGET
MEASURE THE BUSINESS CASE
BRAND AWARENESS
BRAND HEALTH
CONVERSIONS YOU NEVER WOULD HAVE REACHED
PART 1 BUILD THE BUSINESS CASE
All marketing spend should be tied to
quantifiable results the sales team and
executives can understand.
Knowing the costs and
ROI of other marketing
departments will also
help benchmark your content
marketing program and see
how to stack up
in comparison.

If you’re not sure what metrics to ask for, here are some to get you started:
Conversion rate
Average deal size
Marketing-generated pipeline
Marketing-generated opportunities
Marketing-generated deals
Marketing-generated revenue
Average cost per lead
Customer acquisition cost
Marketing % of customer acquisition cost
Time to payback customer acquisition cost
Cost per registration (content or events)
Cost per sale
PART 2 FIND THE BUDGET

Sometimes it can be difficult for companies
to carve out sufficient budget to fund new content
marketing programs.

But we can find this budget if
we look in the right places.

But we can find this budget if
we look in the right places.
(which is probably not here)
First, we need to have a solid understanding
of your organization’s current content costs
and utilization.
Every organization creates content, so start with calculating those content costs.
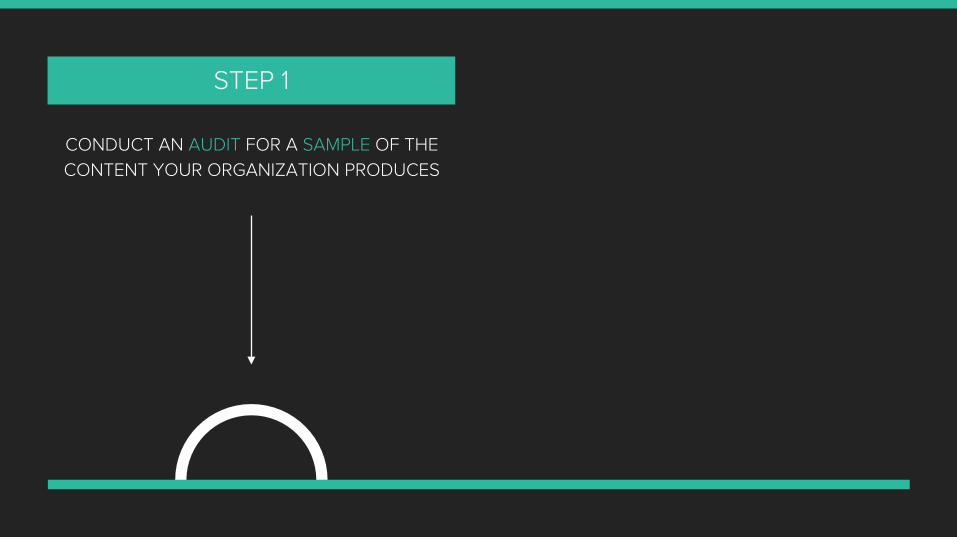
STEP 1
CONDUCT AN AUDIT FOR A SAMPLE OF THE
CONTENT YOUR ORGANIZATION PRODUCES

CONDUCT AN AUDIT FOR A SAMPLE OF THE
CONTENT YOUR ORGANIZATION PRODUCES
STEP 1
APPLY THE AVERAGE COSTS IN ORDER TO GAIN
A SENSE FOR THE SIZE OF THE PROBLEM
STEP 2
Next, we need to understand how much of your content actually gets used.
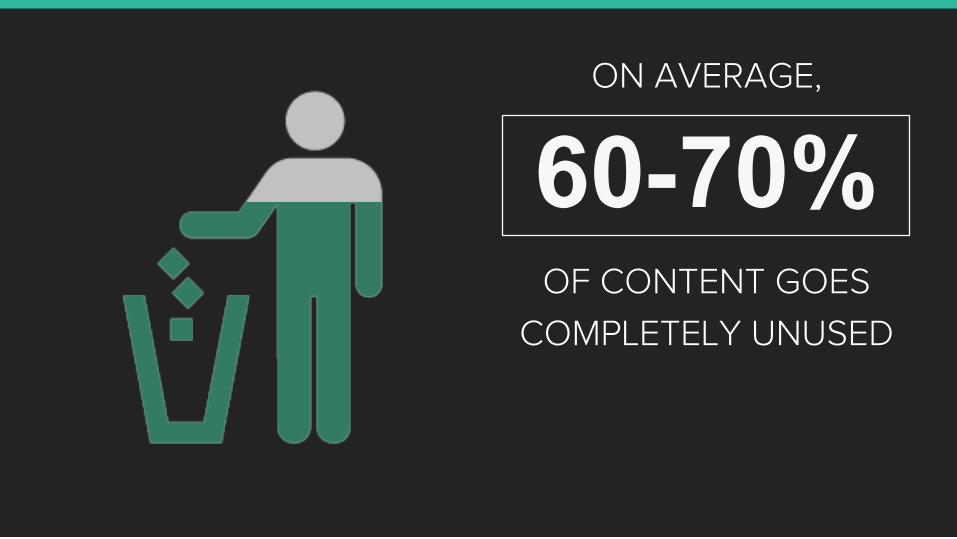
60-70% OF CONTENT GOES
COMPLETELY UNUSED
ON AVERAGE,
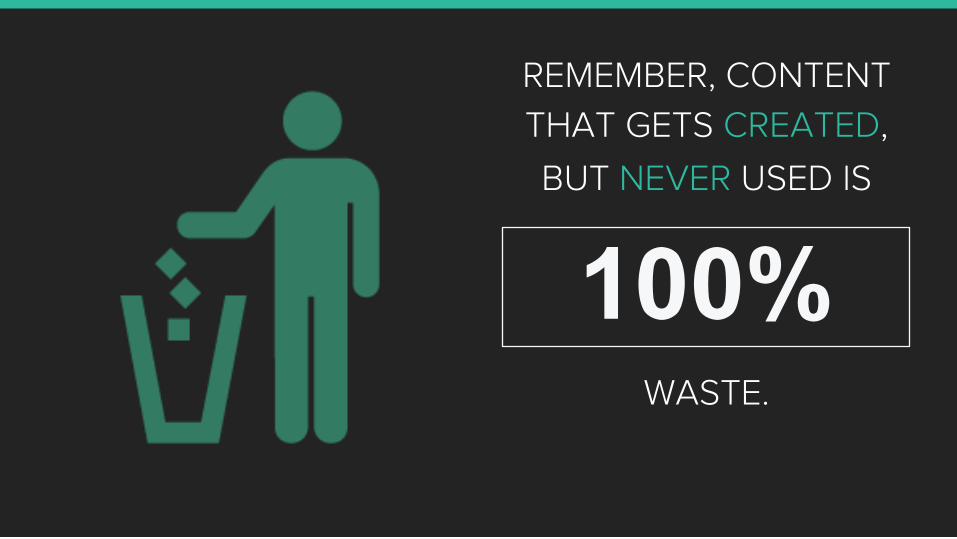
REMEMBER, CONTENT
THAT GETS CREATED,
BUT NEVER USED IS
WASTE.
100%

(That’s a lot of waste)
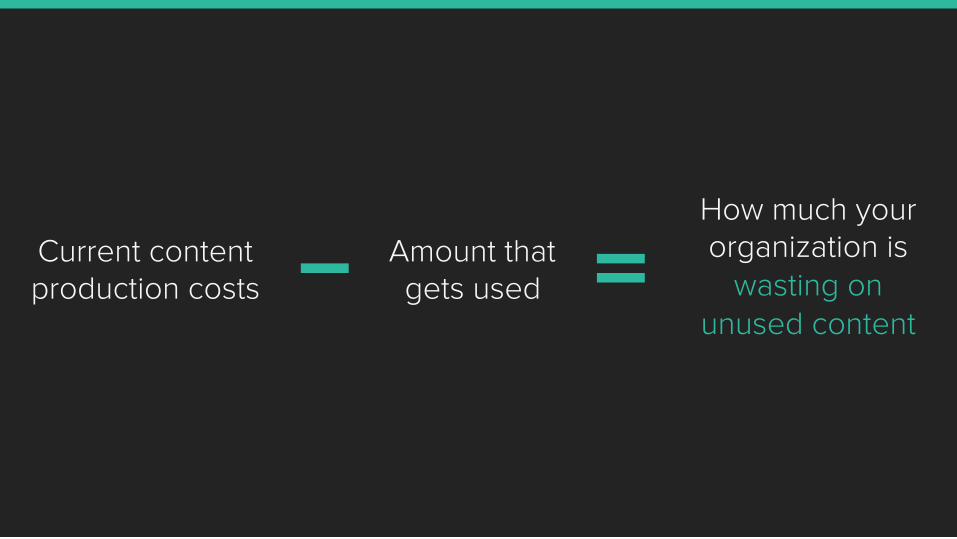
How much your organization is
wasting on unused content
Amount that gets used
Current content production costs
A planned content marketing strategy would provide a platform to share, reuse and repurpose that unused content in order to grow brand awareness, improve
brand health and drive conversions.
Next, we need to look at opportunity costs
from under-performing digital assets

We know customers are
tuning out advertising…
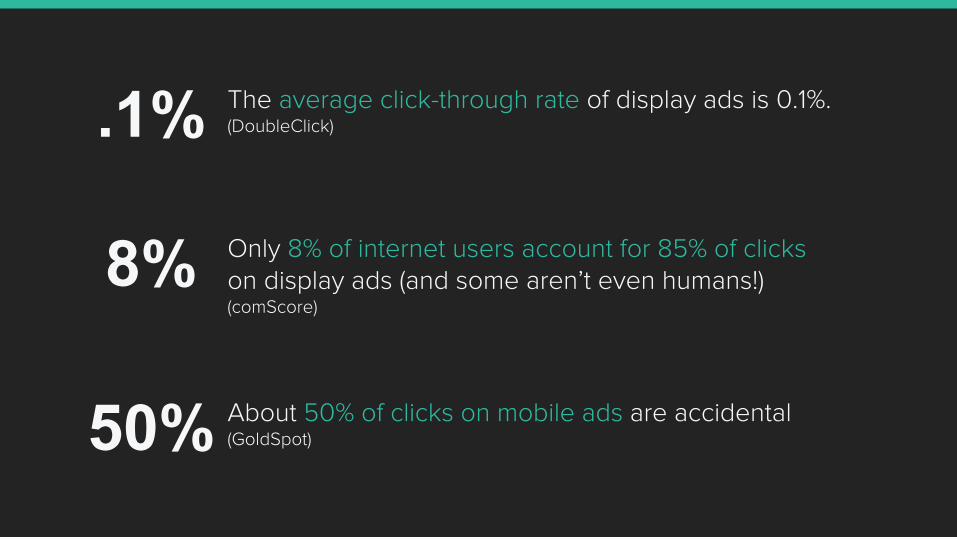
The average click-through rate of display ads is 0.1%. (DoubleClick) .1%
8% Only 8% of internet users account for 85% of clicks on display ads (and some aren’t even humans!) (comScore)
50% About 50% of clicks on mobile ads are accidental (GoldSpot)
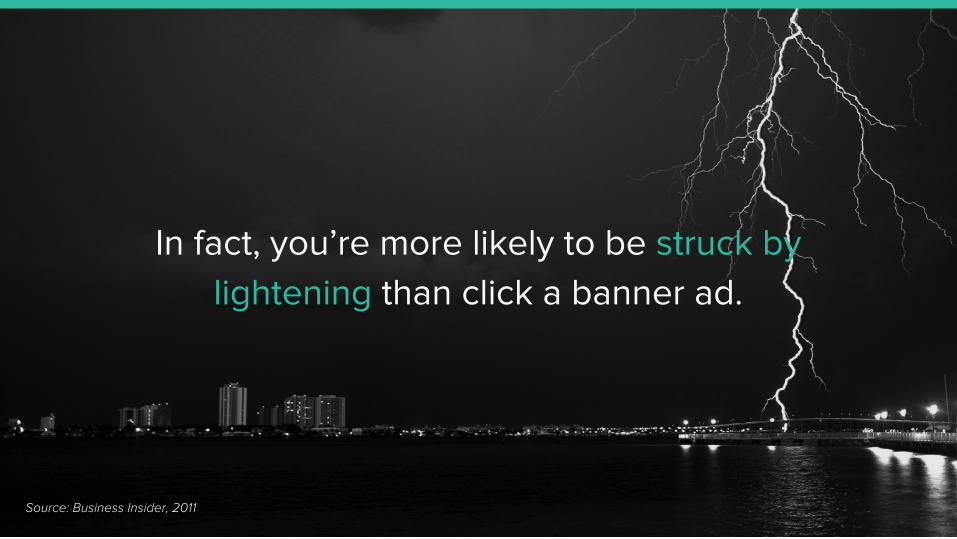
In fact, you’re more likely to be struck by
lightening than click a banner ad.
Source: Business Insider, 2011
Asking for a small percentage of a larger advertising budget for short-lived campaigns is a good place to
start looking for budget donations.

Finally, approach budgeted teams with a partnership opportunity.
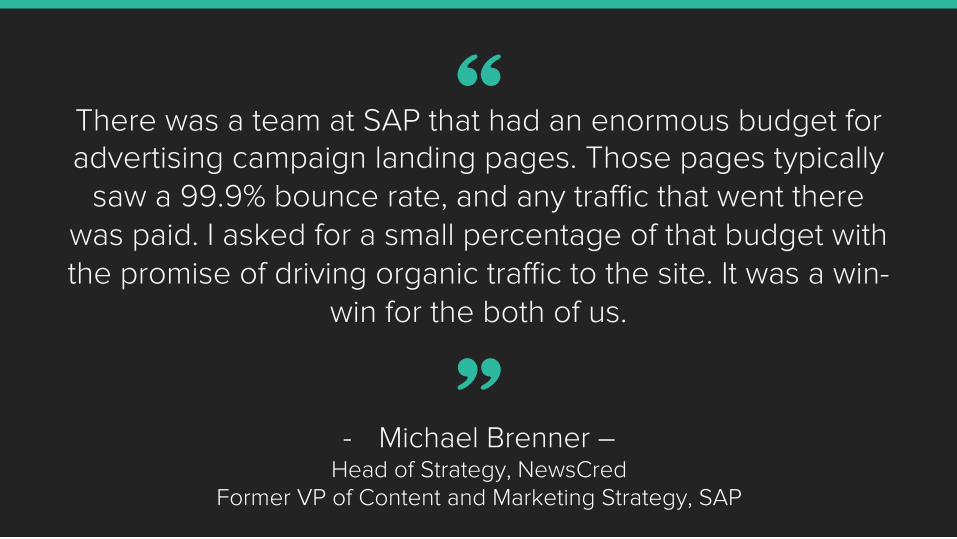
There was a team at SAP that had an enormous budget for advertising campaign landing pages. Those pages typically
saw a 99.9% bounce rate, and any traffic that went there was paid. I asked for a small percentage of that budget with the promise of driving organic traffic to the site. It was a win-
win for the both of us.
”
“
- Michael Brenner – Head of Strategy, NewsCred
Former VP of Content and Marketing Strategy, SAP

PART 3 MEASURE THE BUSINESS CASE
BRAND AWARENESS BRAND HEALTH CONVERSIONS

PART 3 WE CAN DO THIS A FEW DIFFERENT WAYS
BRAND AWARENESS BRAND HEALTH CONVERSIONS
MEASURE THE BUSINESS CASE
BRAND AWARENESS BRAND HEALTH CONVERSIONS
BRAND AWARENESS
BUSINESS CASE
1
In other words, how many of your
early-stage prospects are finding their way
to your company website?
BRAND AWARENESS BRAND HEALTH CONVERSIONS
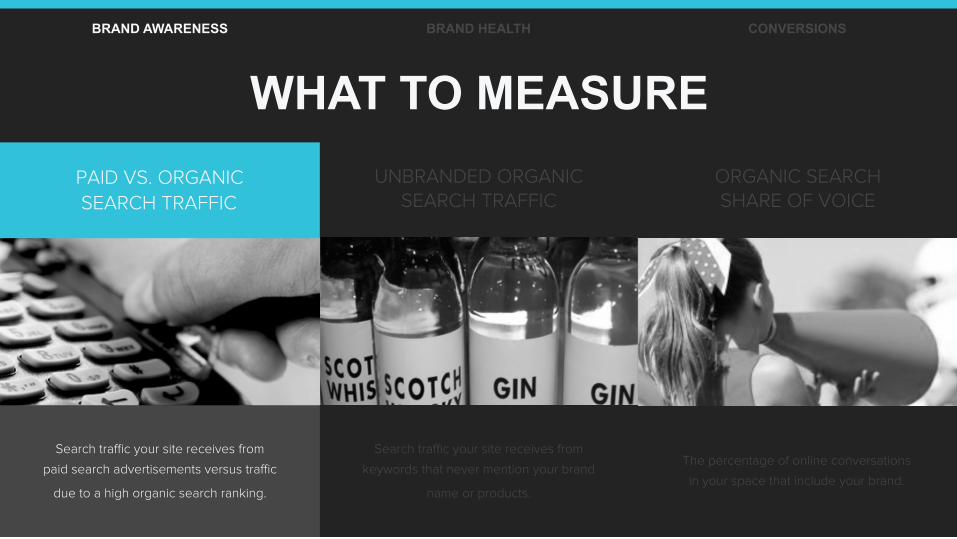
Search traffic your site receives from
paid search advertisements versus traffic
due to a high organic search ranking.
BRAND AWARENESS BRAND HEALTH CONVERSIONS
WHAT TO MEASURE PAID VS. ORGANIC SEARCH TRAFFIC
UNBRANDED ORGANIC SEARCH TRAFFIC
ORGANIC SEARCH SHARE OF VOICE
Search traffic your site receives from
keywords that never mention your brand
name or products.
The percentage of online conversations
in your space that include your brand.

Search traffic your site receives from
keywords that never mention your brand
name or products.
BRAND AWARENESS BRAND HEALTH CONVERSIONS
WHAT TO MEASURE PAID VS. ORGANIC SEARCH TRAFFIC
UNBRANDED ORGANIC SEARCH TRAFFIC
ORGANIC SEARCH SHARE OF VOICE
The percentage of online conversations
in your space that include your brand.
Search traffic your site receives from
paid search advertisements versus traffic
due to a high organic search ranking.

The percentage of online conversations
in your space that include your brand.
BRAND AWARENESS BRAND HEALTH CONVERSIONS
WHAT TO MEASURE PAID VS. ORGANIC SEARCH TRAFFIC
UNBRANDED ORGANIC SEARCH TRAFFIC
ORGANIC SEARCH SHARE OF VOICE
Search traffic your site receives from
keywords that never mention your brand
name or products.
Search traffic your site receives from
paid search advertisements versus traffic
due to a high organic search ranking.

BRAND AWARENESS BRAND HEALTH CONVERSIONS
HOW TO CALCULATE THE VALUE OF:
PAID VS. ORGANIC SEARCH TRAFFIC

Content marketing allows you to gain
additional reach, engagement and conversion
without having to pay for it.
BRAND AWARENESS BRAND HEALTH CONVERSIONS
Content marketing allows you to gain
additional reach, engagement and conversion
without having to pay for it.
You can literally earn your audience’s
attention vs. buying it.
BRAND AWARENESS BRAND HEALTH CONVERSIONS

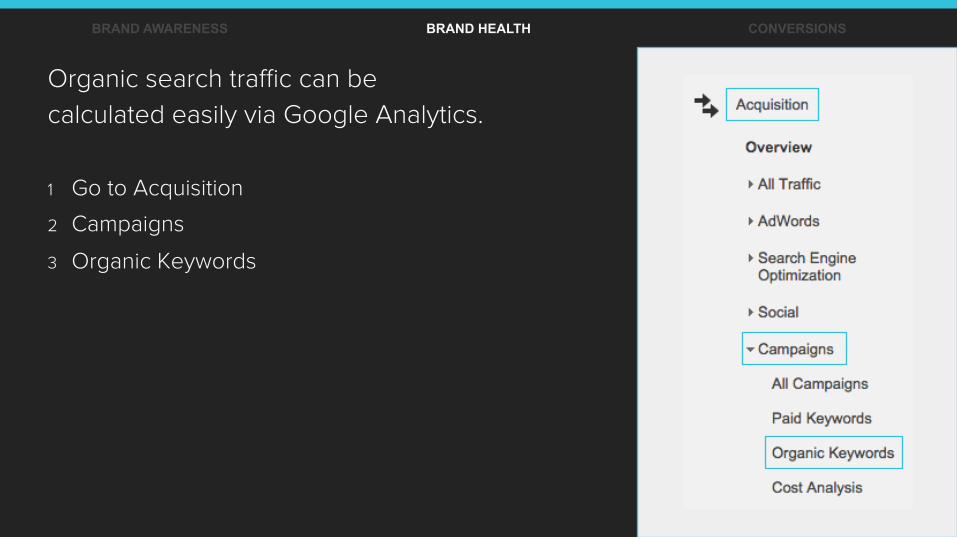
Organic search traffic can be
calculated easily via Google Analytics.
BRAND AWARENESS BRAND HEALTH CONVERSIONS
1 Go to Acquisition
2 Campaigns
3 Organic Keywords

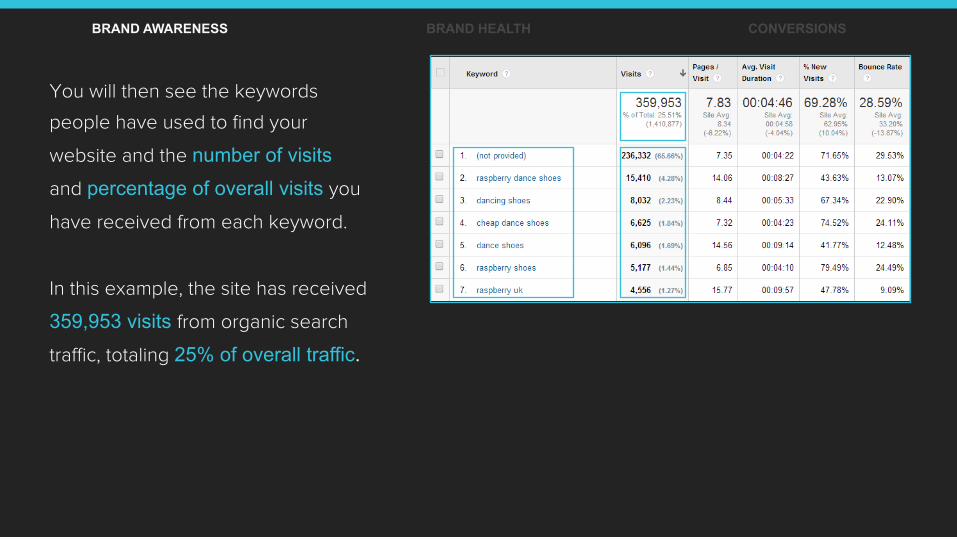
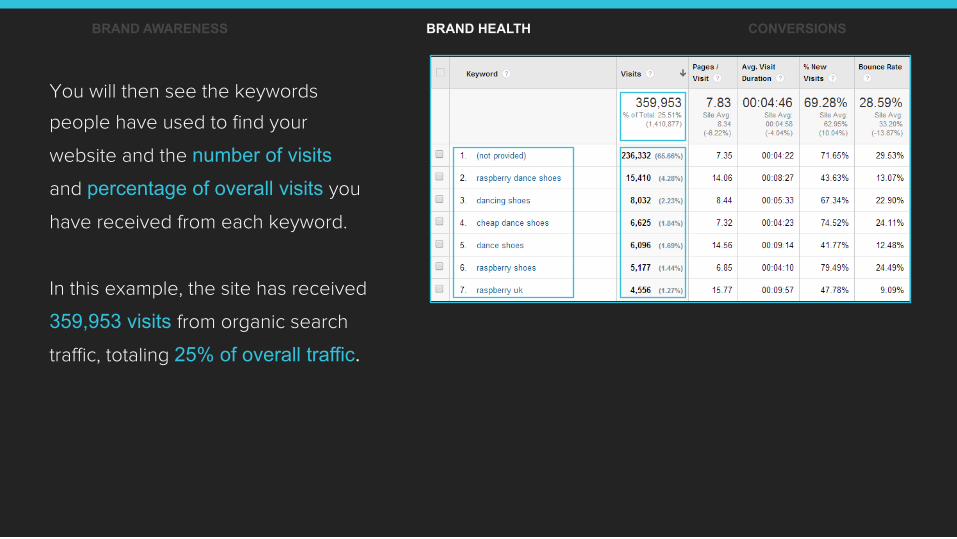
You will then see the keywords
people have used to find your
website and the number of visits
and percentage of overall visits you
have received from each keyword.
BRAND AWARENESS BRAND HEALTH CONVERSIONS
You will then see the keywords
people have used to find your
website and the number of visits
and percentage of overall visits you
have received from each keyword.
In this example, the site has received
359,953 visits from organic search
traffic, totaling 25% of overall traffic.
BRAND AWARENESS BRAND HEALTH CONVERSIONS
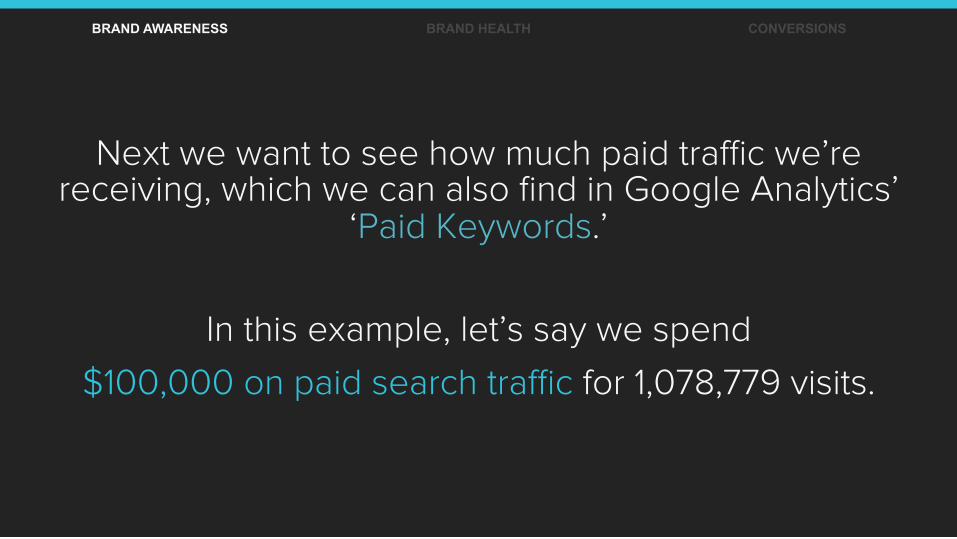
Next we want to see how much paid traffic we’re receiving, which we can also find in Google Analytics’
‘Paid Keywords.’
In this example, let’s say we spend
$100,000 on paid search traffic for 1,078,779 visits.
BRAND AWARENESS BRAND HEALTH CONVERSIONS
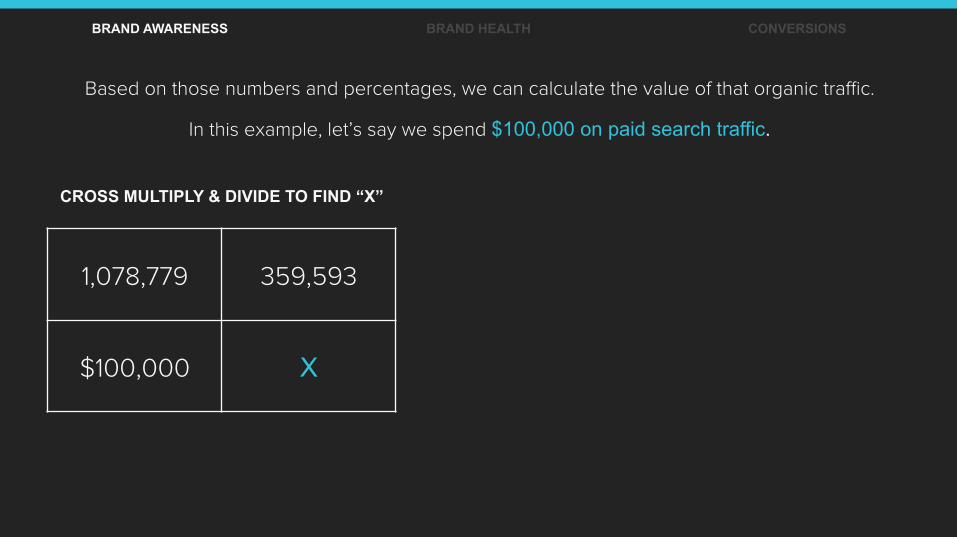
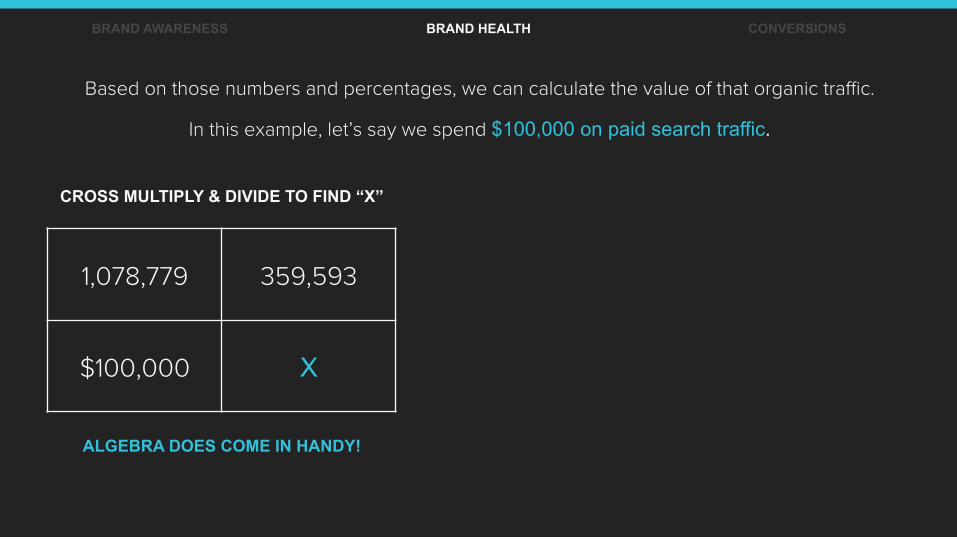
Based on those numbers and percentages, we can calculate the value of that organic traffic.
In this example, let’s say we spend $100,000 on paid search traffic.
1,078,779 359,593
$100,000 X
CROSS MULTIPLY & DIVIDE TO FIND “X”
BRAND AWARENESS BRAND HEALTH CONVERSIONS
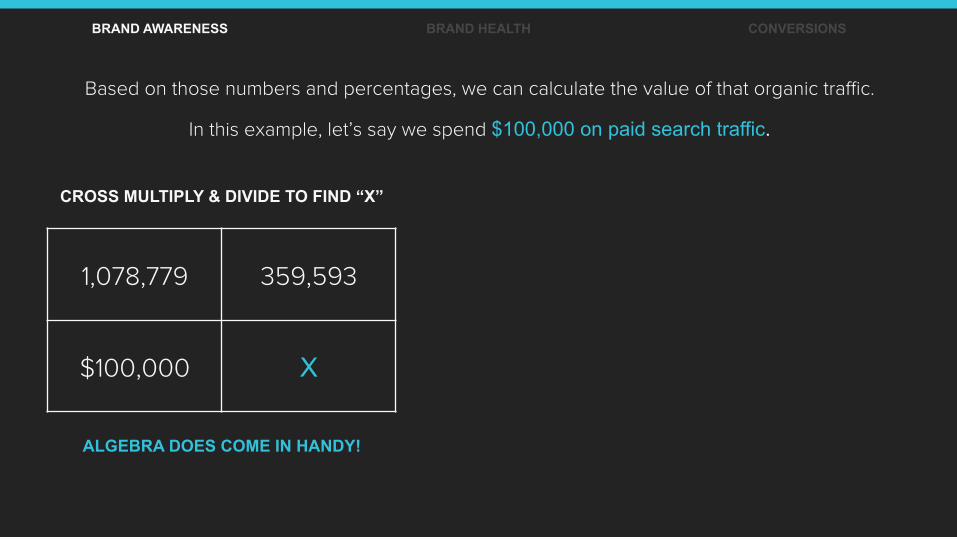
Based on those numbers and percentages, we can calculate the value of that organic traffic.
In this example, let’s say we spend $100,000 on paid search traffic.
1,078,779 359,593
$100,000 X
CROSS MULTIPLY & DIVIDE TO FIND “X”
BRAND AWARENESS BRAND HEALTH CONVERSIONS
ALGEBRA DOES COME IN HANDY!
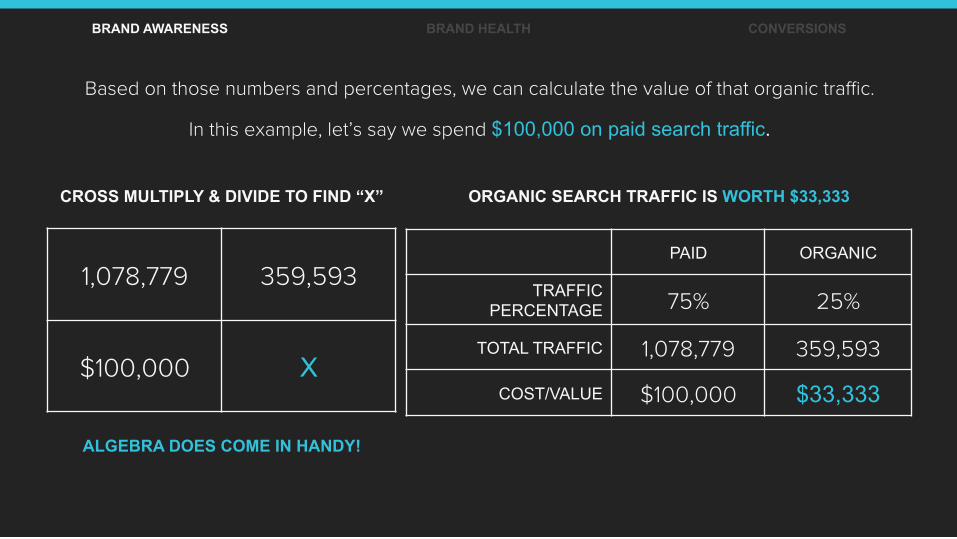
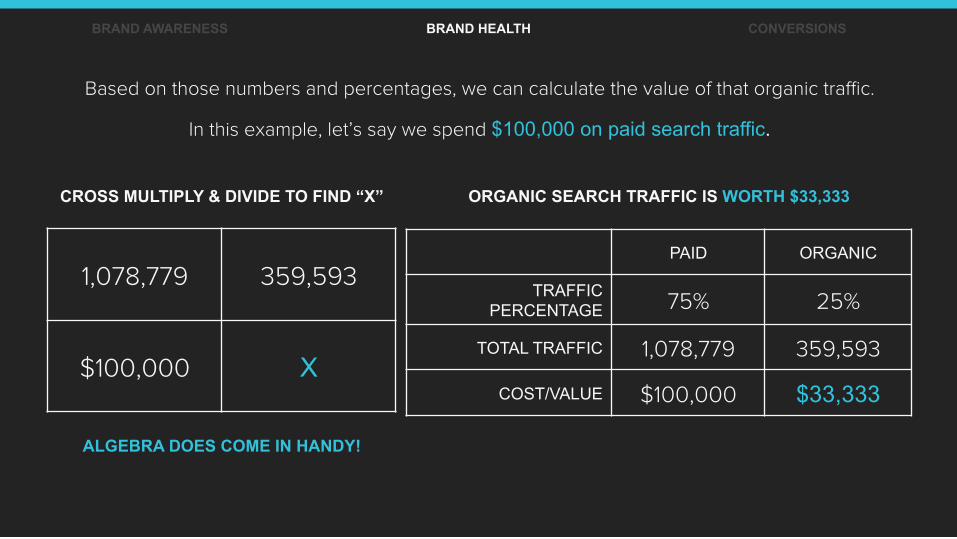
Based on those numbers and percentages, we can calculate the value of that organic traffic.
In this example, let’s say we spend $100,000 on paid search traffic.
1,078,779 359,593
$100,000 X
CROSS MULTIPLY & DIVIDE TO FIND “X”
BRAND AWARENESS BRAND HEALTH CONVERSIONS
ALGEBRA DOES COME IN HANDY!
PAID ORGANIC
TRAFFIC PERCENTAGE 75% 25%
TOTAL TRAFFIC 1,078,779 359,593
COST/VALUE $100,000 $33,333
ORGANIC SEARCH TRAFFIC IS WORTH $33,333
BRAND AWARENESS BRAND HEALTH CONVERSIONS
HOW TO CALCULATE THE VALUE OF:
UNBRANDED ORGANIC SEARCH TRAFFIC
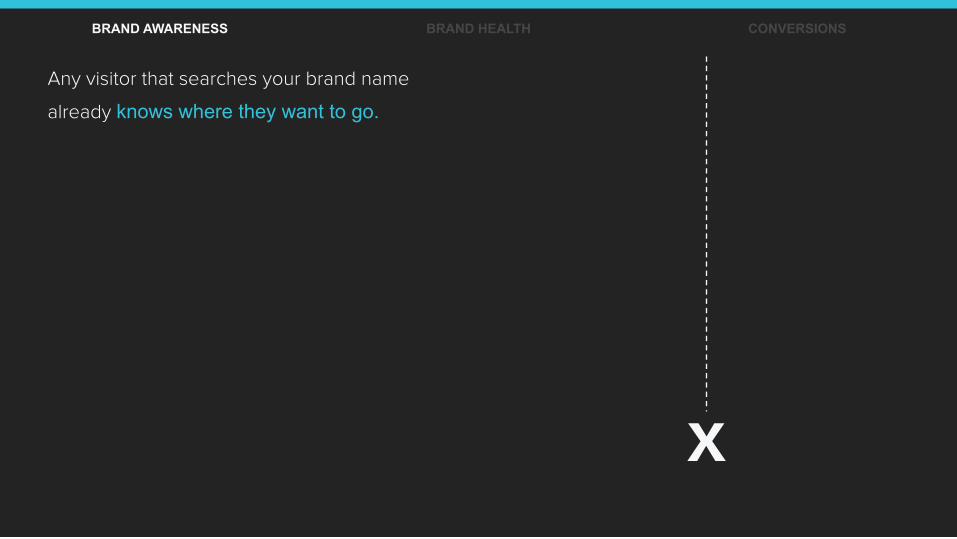
Any visitor that searches your brand name
already knows where they want to go.
BRAND AWARENESS BRAND HEALTH CONVERSIONS
X

Unbranded organic search traffic is important
to calculate because we want to know about
the people who didn’t know where they would
end up.
BRAND AWARENESS BRAND HEALTH CONVERSIONS
?
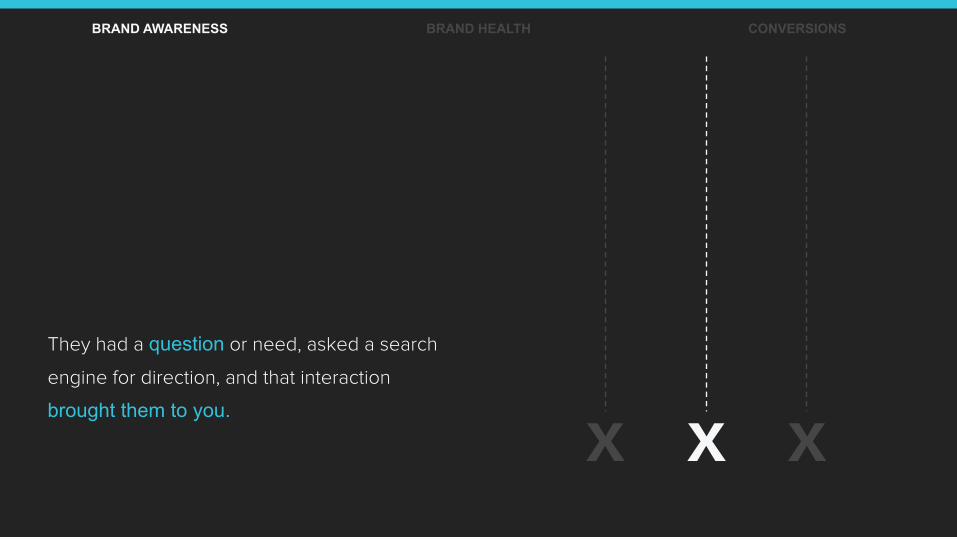
They had a question or need, asked a search
engine for direction, and that interaction
brought them to you.
BRAND AWARENESS BRAND HEALTH CONVERSIONS
X X X
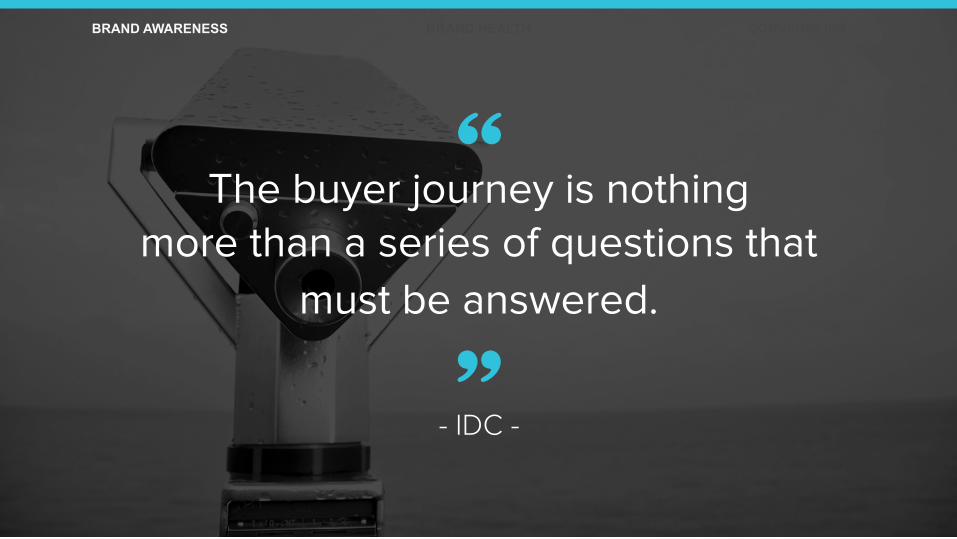
“
The buyer journey is nothing more than a series of questions that
must be answered.
- IDC -
”
BRAND AWARENESS BRAND HEALTH CONVERSIONS
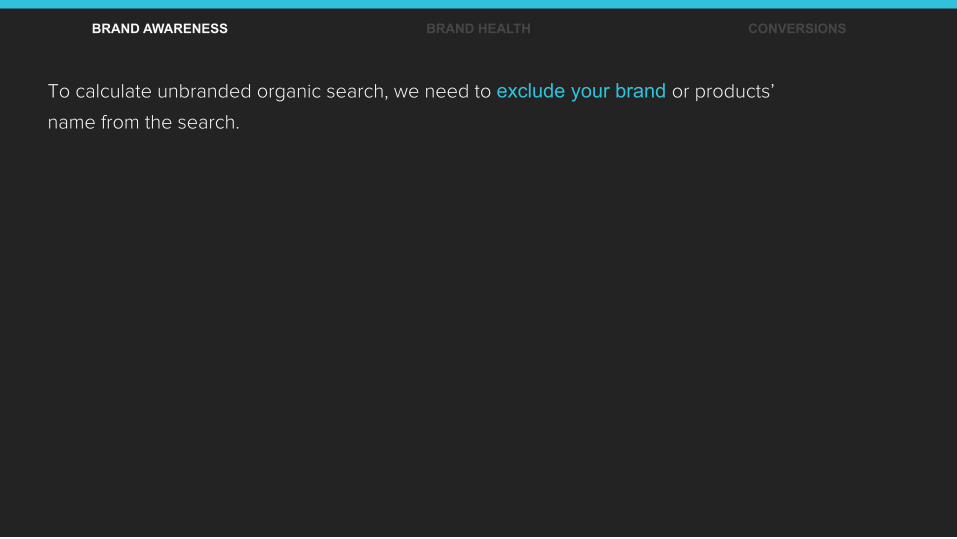
To calculate unbranded organic search, we need to exclude your brand or products’
name from the search.
BRAND AWARENESS BRAND HEALTH CONVERSIONS
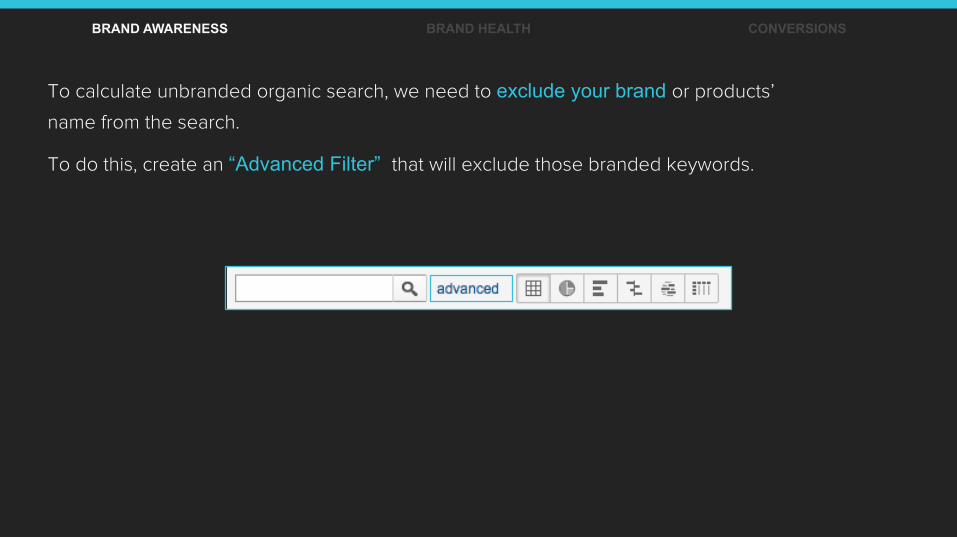
To calculate unbranded organic search, we need to exclude your brand or products’
name from the search. To do this, create an “Advanced Filter” that will exclude those branded keywords.
BRAND AWARENESS BRAND HEALTH CONVERSIONS
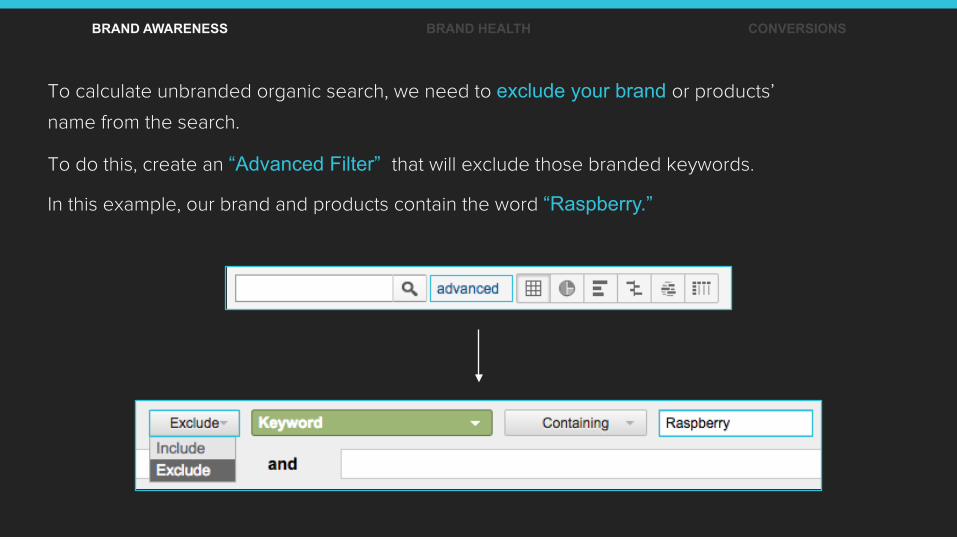
To calculate unbranded organic search, we need to exclude your brand or products’
name from the search. To do this, create an “Advanced Filter” that will exclude those branded keywords. In this example, our brand and products contain the word “Raspberry.”
BRAND AWARENESS BRAND HEALTH CONVERSIONS
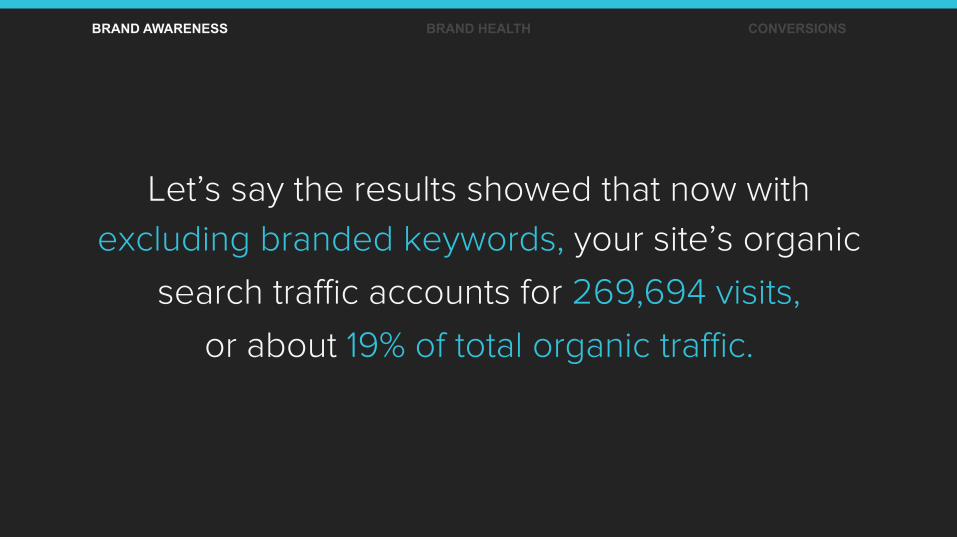
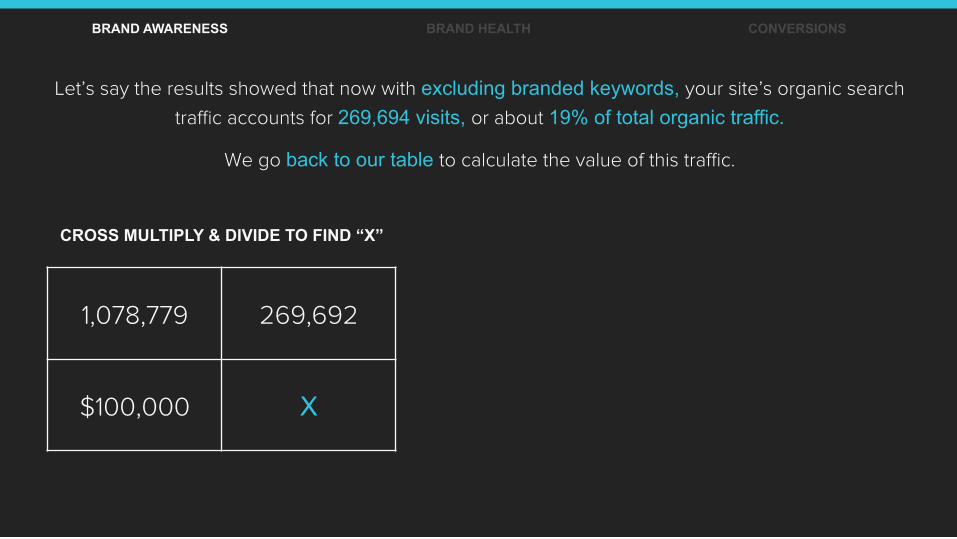
Let’s say the results showed that now with
excluding branded keywords, your site’s organic
search traffic accounts for 269,694 visits,
or about 19% of total organic traffic.
BRAND AWARENESS BRAND HEALTH CONVERSIONS
Let’s say the results showed that now with excluding branded keywords, your site’s organic search
traffic accounts for 269,694 visits, or about 19% of total organic traffic.
We go back to our table to calculate the value of this traffic.
1,078,779 269,692
$100,000 X
CROSS MULTIPLY & DIVIDE TO FIND “X”
BRAND AWARENESS BRAND HEALTH CONVERSIONS
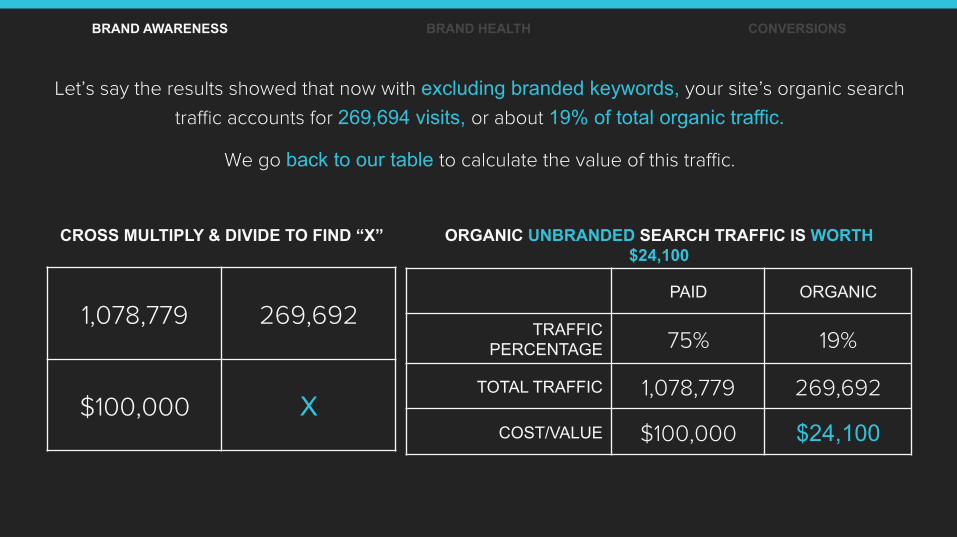
PAID ORGANIC
TRAFFIC PERCENTAGE 75% 19%
TOTAL TRAFFIC 1,078,779 269,692
COST/VALUE $100,000 $24,100
ORGANIC UNBRANDED SEARCH TRAFFIC IS WORTH $24,100
BRAND AWARENESS BRAND HEALTH CONVERSIONS
HOW TO CALCUALTE THE VALUE OF:
ORGANIC SEARCH SHARE OF VOICE
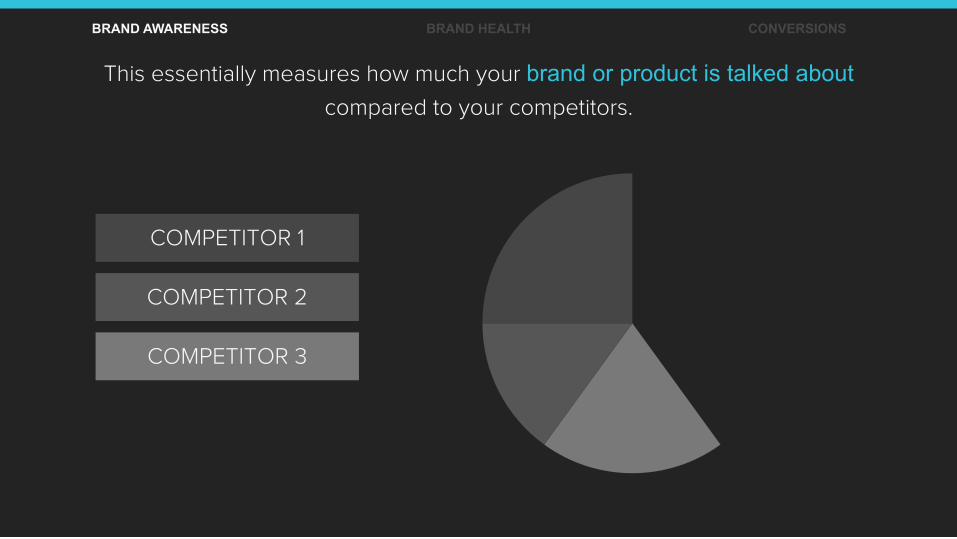
This essentially measures how much your brand or product is talked about compared to your competitors.
BRAND AWARENESS BRAND HEALTH CONVERSIONS
COMPETITOR 2
COMPETITOR 3
COMPETITOR 1

This essentially measures how much your brand or product is talked about compared to your competitors.
BRAND AWARENESS BRAND HEALTH CONVERSIONS
COMPETITOR 2
COMPETITOR 3
COMPETITOR 1
YOU
First you want to choose a group of words
based around your brand’s product or service.
BRAND AWARENESS BRAND HEALTH CONVERSIONS

When choosing your words, be sure to stay within a common theme. In this example, we’ll use a dance brand.
Source: Moz, How to Calculate Share of Voice for Organic Search
BRAND AWARENESS BRAND HEALTH CONVERSIONS
Keywords:
• Dance Shoes
• Dancing Shoes
• Cheap Dance Shoes
• Affordable Dance Shoes
• Ballet Shoes

In general, it’s better for your
SEO strategy to focus on a specific topic.
BRAND AWARENESS BRAND HEALTH CONVERSIONS
Think narrow and deep,
instead of broad and shallow.
BRAND AWARENESS BRAND HEALTH CONVERSIONS

Next, choose your competition.
Who do you want to compare yourself against?
BRAND AWARENESS BRAND HEALTH CONVERSIONS
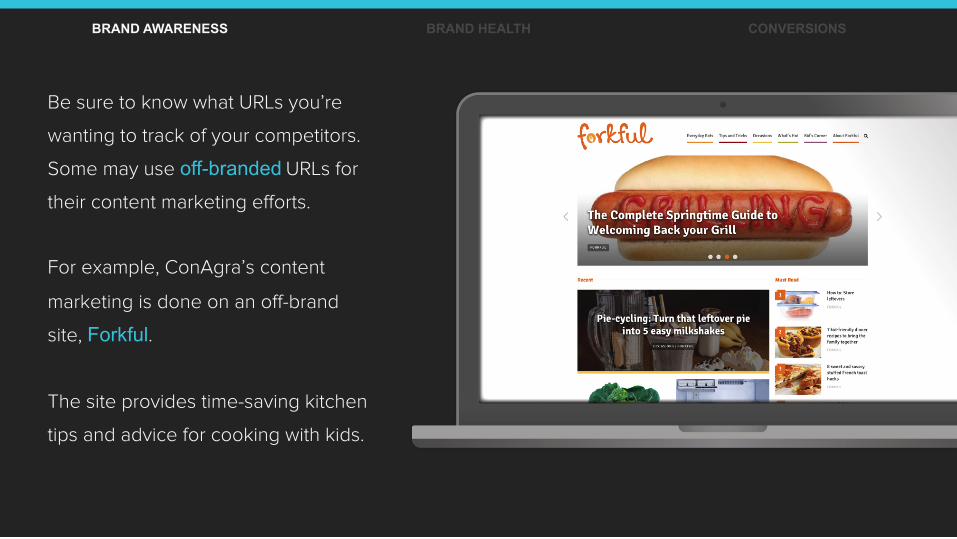
Be sure to know what URLs you’re
wanting to track of your competitors.
Some may use off-branded URLs for
their content marketing efforts.
For example, ConAgra’s content
marketing is done on an off-brand
site, Forkful.
The site provides time-saving kitchen
tips and advice for cooking with kids.
BRAND AWARENESS BRAND HEALTH CONVERSIONS
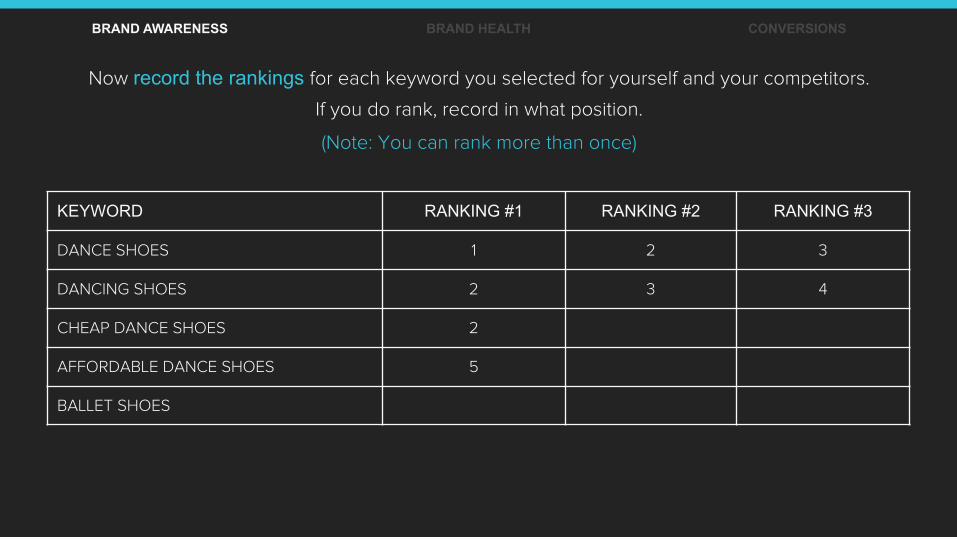
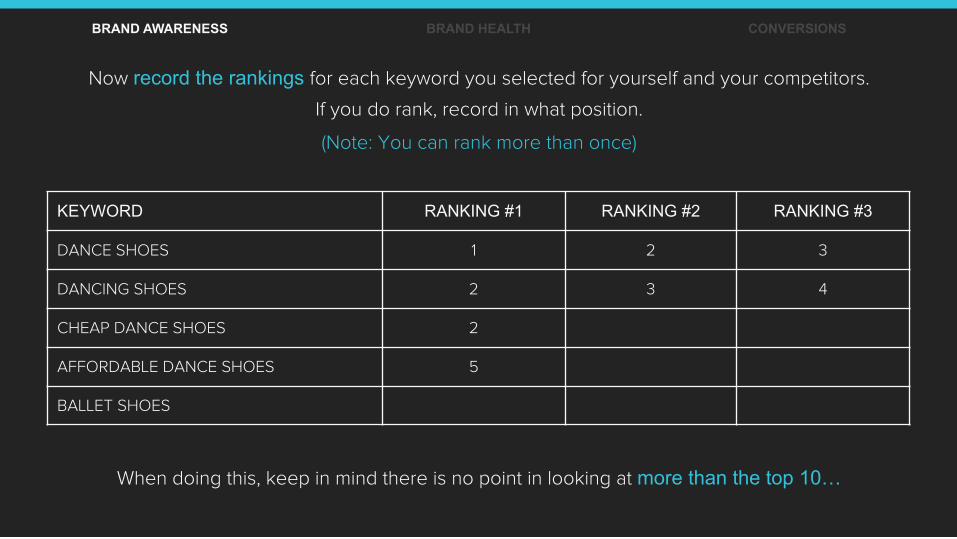
Now record the rankings for each keyword you selected for yourself and your competitors.
If you do rank, record in what position.
(Note: You can rank more than once)
KEYWORD RANKING #1 RANKING #2 RANKING #3
DANCE SHOES 1 2 3
DANCING SHOES 2 3 4
CHEAP DANCE SHOES 2
AFFORDABLE DANCE SHOES 5
BALLET SHOES
BRAND AWARENESS BRAND HEALTH CONVERSIONS
Now record the rankings for each keyword you selected for yourself and your competitors.
If you do rank, record in what position.
(Note: You can rank more than once)
KEYWORD RANKING #1 RANKING #2 RANKING #3
DANCE SHOES 1 2 3
DANCING SHOES 2 3 4
CHEAP DANCE SHOES 2
AFFORDABLE DANCE SHOES 5
BALLET SHOES
When doing this, keep in mind there is no point in looking at more than the top 10…
BRAND AWARENESS BRAND HEALTH CONVERSIONS
…because only 2% of users travel to
the 2nd page of Google.
Source: Eyetools Inc.
BRAND AWARENESS BRAND HEALTH CONVERSIONS
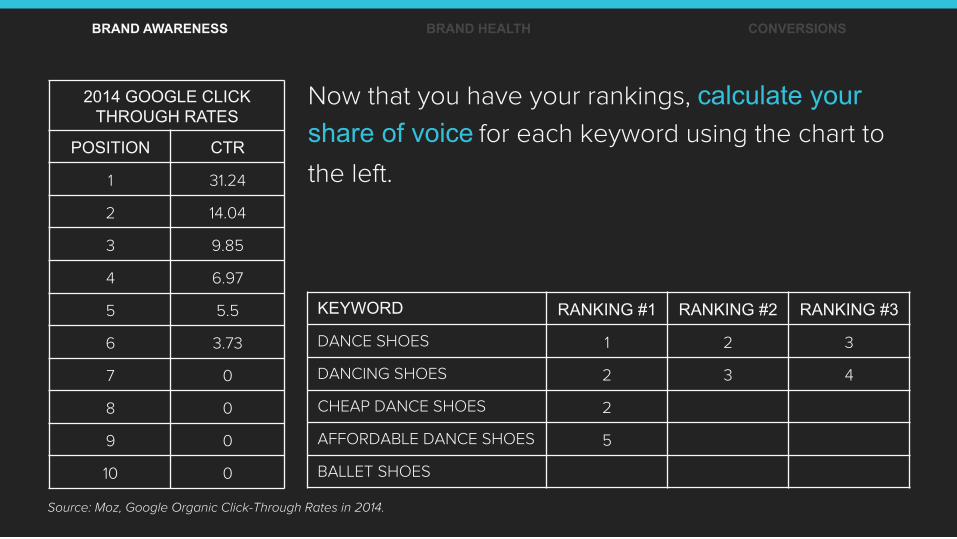
2014 GOOGLE CLICK THROUGH RATES
POSITION CTR
1 31.24
2 14.04
3 9.85
4 6.97
5 5.5
6 3.73
7 0
8 0
9 0
10 0
Source: Moz, Google Organic Click-Through Rates in 2014.
Now that you have your rankings, calculate your share of voice for each keyword using the chart to
the left.
KEYWORD RANKING #1 RANKING #2 RANKING #3
DANCE SHOES 1 2 3
DANCING SHOES 2 3 4
CHEAP DANCE SHOES 2
AFFORDABLE DANCE SHOES 5
BALLET SHOES
BRAND AWARENESS BRAND HEALTH CONVERSIONS
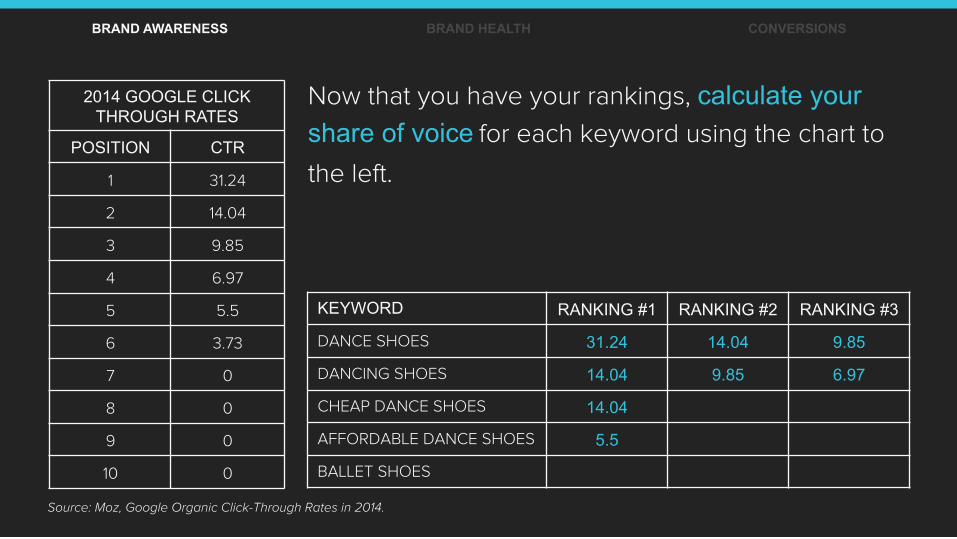
2014 GOOGLE CLICK THROUGH RATES
POSITION CTR
1 31.24
2 14.04
3 9.85
4 6.97
5 5.5
6 3.73
7 0
8 0
9 0
10 0
Source: Moz, Google Organic Click-Through Rates in 2014.
Now that you have your rankings, calculate your share of voice for each keyword using the chart to
the left.
KEYWORD RANKING #1 RANKING #2 RANKING #3
DANCE SHOES 31.24 14.04 9.85
DANCING SHOES 14.04 9.85 6.97
CHEAP DANCE SHOES 14.04
AFFORDABLE DANCE SHOES 5.5
BALLET SHOES
BRAND AWARENESS BRAND HEALTH CONVERSIONS
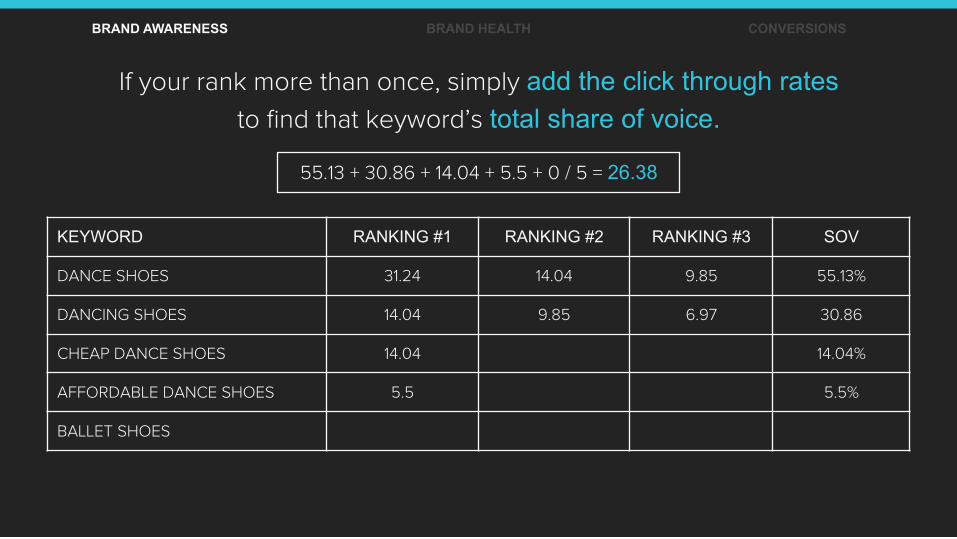
If your rank more than once, simply add the click through rates
to find that keyword’s total share of voice.
KEYWORD RANKING #1 RANKING #2 RANKING #3 SOV
DANCE SHOES 31.24 14.04 9.85 55.13%
DANCING SHOES 14.04 9.85 6.97 30.86
CHEAP DANCE SHOES 14.04 14.04%
AFFORDABLE DANCE SHOES 5.5 5.5%
BALLET SHOES
55.13 + 30.86 + 14.04 + 5.5 + 0 / 5 = 26.38
BRAND AWARENESS BRAND HEALTH CONVERSIONS
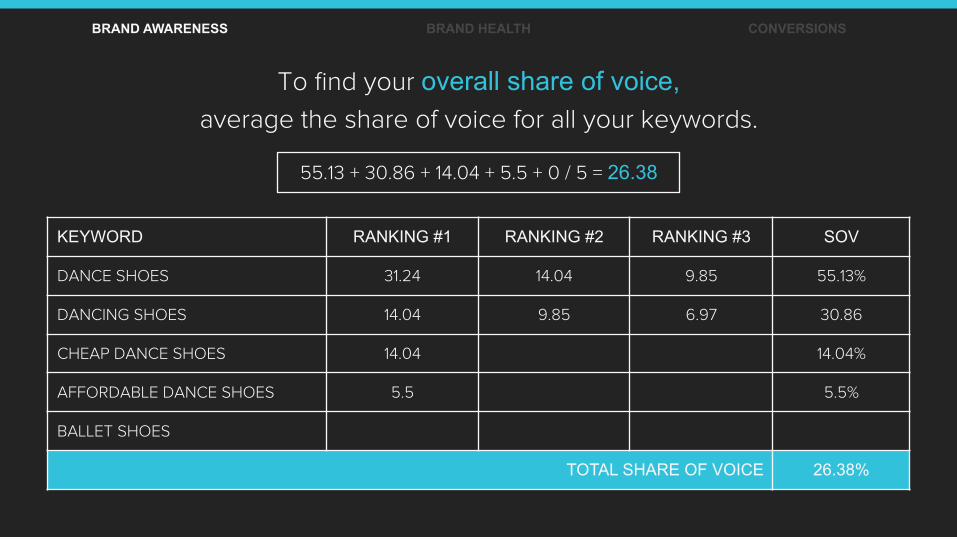
To find your overall share of voice, average the share of voice for all your keywords.
KEYWORD RANKING #1 RANKING #2 RANKING #3 SOV
DANCE SHOES 31.24 14.04 9.85 55.13%
DANCING SHOES 14.04 9.85 6.97 30.86
CHEAP DANCE SHOES 14.04 14.04%
AFFORDABLE DANCE SHOES 5.5 5.5%
BALLET SHOES
TOTAL SHARE OF VOICE 26.38%
55.13 + 30.86 + 14.04 + 5.5 + 0 / 5 = 26.38
BRAND AWARENESS BRAND HEALTH CONVERSIONS

If there’s a gap between your market share
and your share of voice, that means your competition
is wooing your prospects before you!
BRAND AWARENESS BRAND HEALTH CONVERSIONS
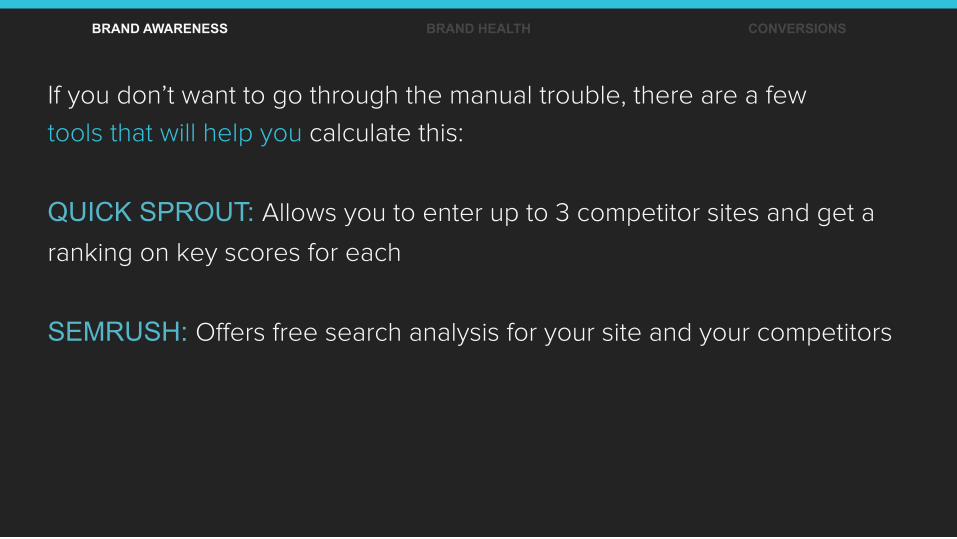
If you don’t want to go through the manual trouble, there are a few
tools that will help you calculate this:
QUICK SPROUT: Allows you to enter up to 3 competitor sites and get a
ranking on key scores for each
SEMRUSH: Offers free search analysis for your site and your competitors
BRAND AWARENESS BRAND HEALTH CONVERSIONS
BRAND AWARENESS BRAND HEALTH CONVERSIONS
BRAND HEALTH
BUSINESS CASE
2
If you’re like most
brands, you probably
promote yourself too much.
BRAND AWARENESS BRAND HEALTH CONVERSIONS

(and we tune you out)
BRAND AWARENESS BRAND HEALTH CONVERSIONS
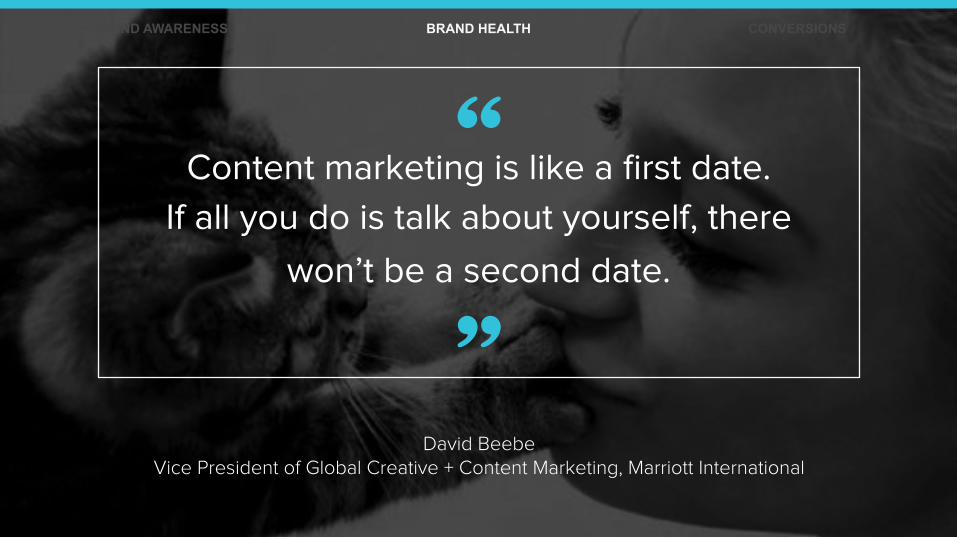
David Beebe Vice President of Global Creative + Content Marketing, Marriott International
Content marketing is like a first date.
If all you do is talk about yourself, there
won’t be a second date.
”
“ BRAND AWARENESS BRAND HEALTH CONVERSIONS

BRAND AWARENESS BRAND HEALTH CONVERSIONS
LET PEOPLE GET TO… 1 KNOW YOUR BRAND
BRAND AWARENESS BRAND HEALTH CONVERSIONS
LET PEOPLE GET TO… 1 KNOW YOUR BRAND
2 LIKE YOUR BRAND

LET PEOPLE GET TO… 1 KNOW YOUR BRAND
2 LIKE YOUR BRAND
3 TRUST YOUR BRAND ENOUGH TO BUY FROM YOU
BRAND AWARENESS BRAND HEALTH CONVERSIONS
Brand health measures how your
digital audience feels about you.
BRAND AWARENESS BRAND HEALTH CONVERSIONS

The percentage of
visitors who enter your
site and then leave,
rather than continuing
to view other pages.
BRAND AWARENESS BRAND HEALTH CONVERSIONS
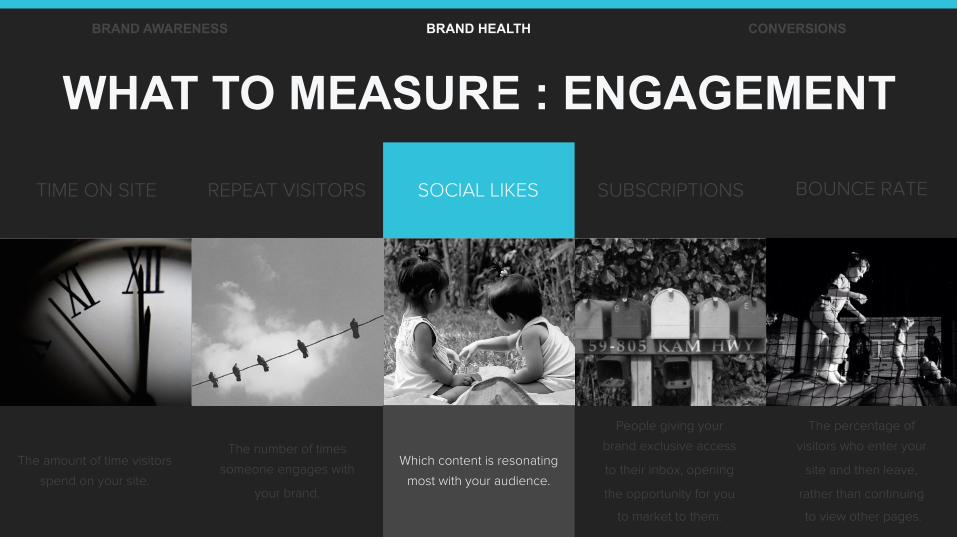
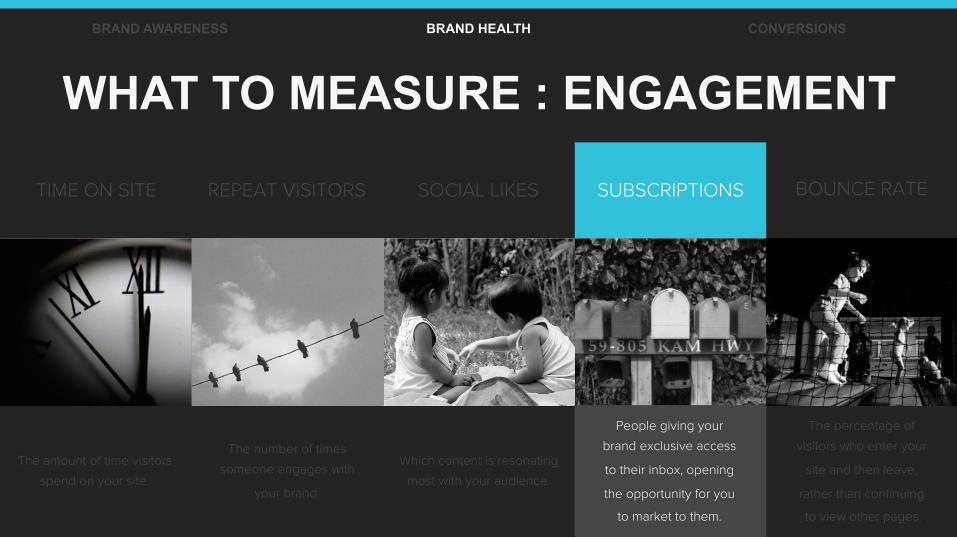
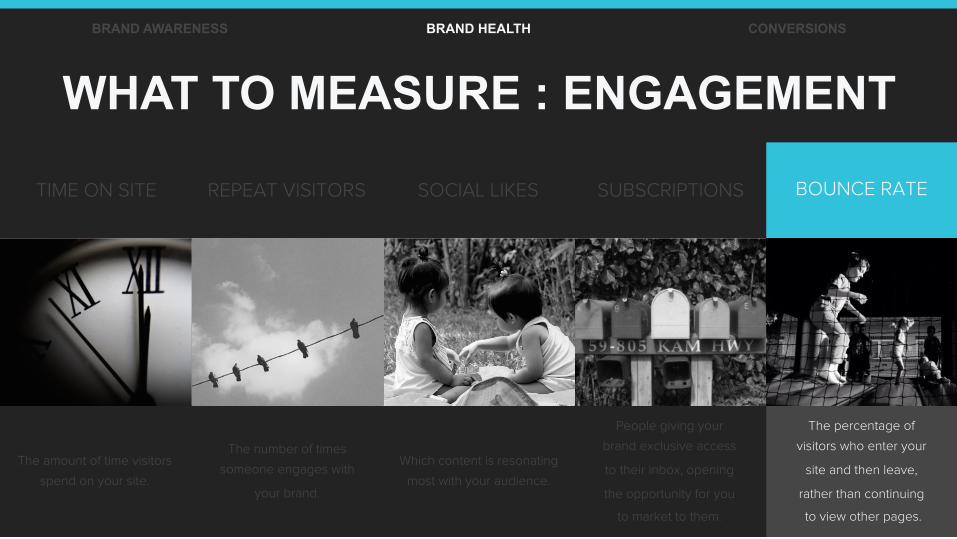
WHAT TO MEASURE : ENGAGEMENT
TIME ON SITE BOUNCE RATE
The amount of time visitors
spend on your site.
REPEAT VISITORS SOCIAL LIKES SUBSCRIPTIONS
The number of times
someone engages with
your brand.
Which content is resonating
most with your audience.
People giving your
brand exclusive access
to their inbox, opening
the opportunity for you
to market to them.
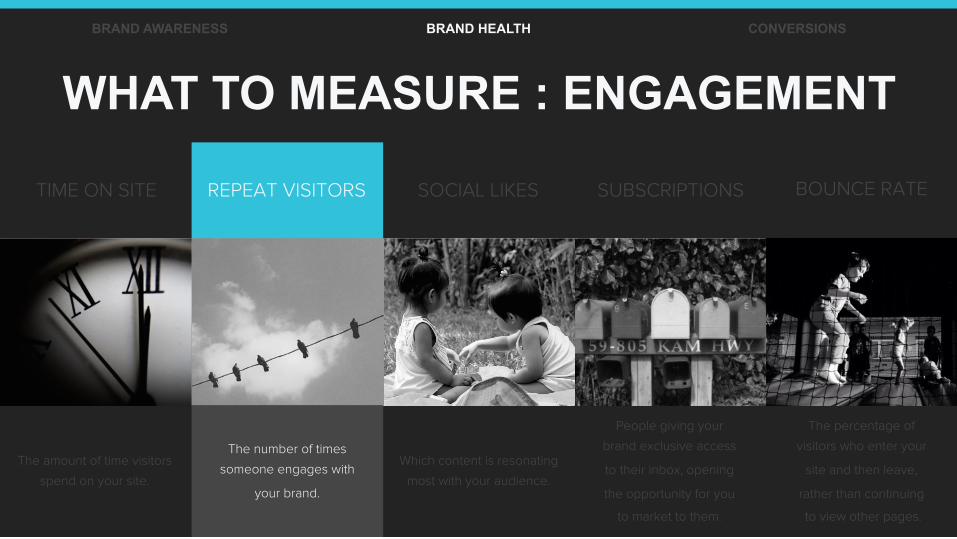
The percentage of
visitors who enter your
site and then leave,
rather than continuing
to view other pages.
WHAT TO MEASURE : ENGAGEMENT
TIME ON SITE BOUNCE RATE
The amount of time visitors
spend on your site.
REPEAT VISITORS SOCIAL LIKES SUBSCRIPTIONS
The number of times
someone engages with
your brand.
Which content is resonating
most with your audience.
People giving your
brand exclusive access
to their inbox, opening
the opportunity for you
to market to them.
BRAND AWARENESS BRAND HEALTH CONVERSIONS
What “they” say about you.
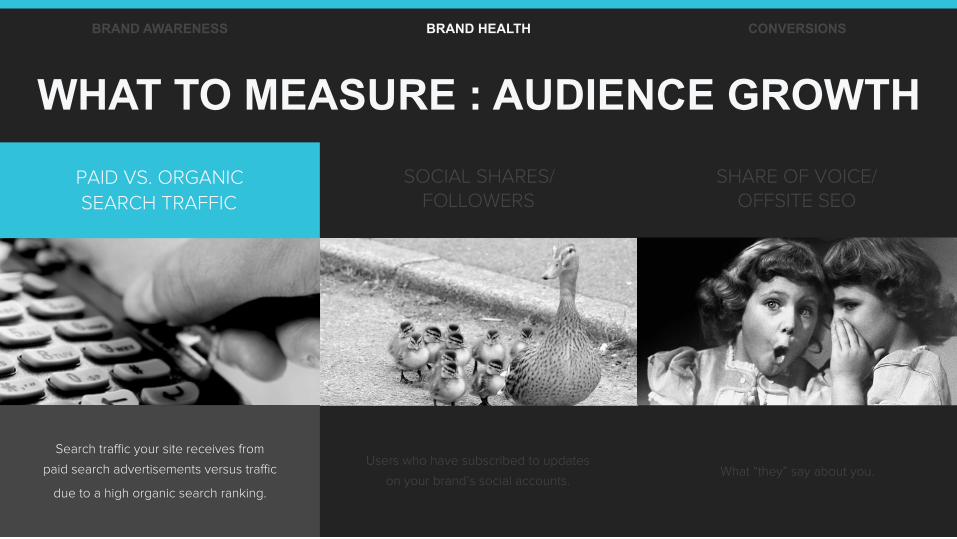
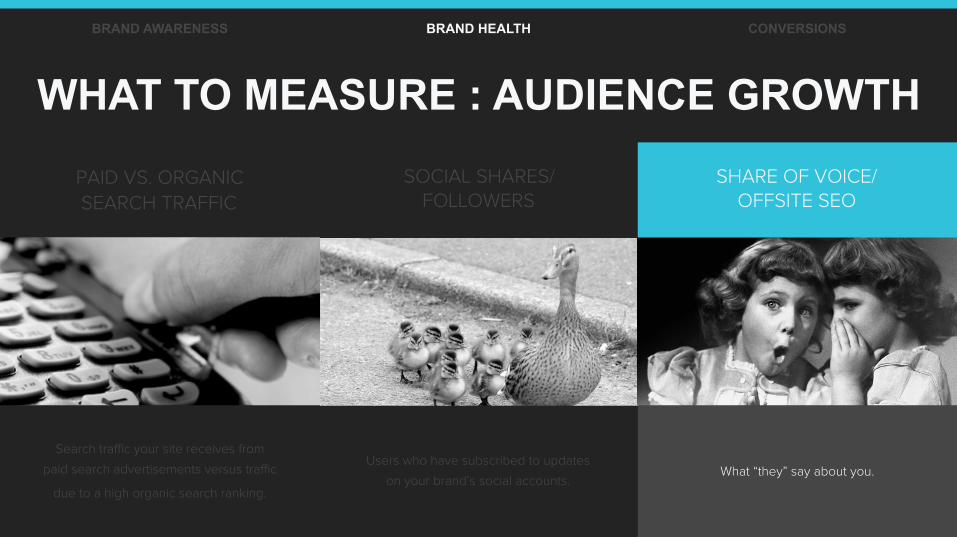
WHAT TO MEASURE : AUDIENCE GROWTH
PAID VS. ORGANIC SEARCH TRAFFIC
SOCIAL SHARES/ FOLLOWERS
SHARE OF VOICE/ OFFSITE SEO
Users who have subscribed to updates
on your brand’s social accounts.
Search traffic your site receives from
paid search advertisements versus traffic
due to a high organic search ranking.
BRAND AWARENESS BRAND HEALTH CONVERSIONS

What “they” say about you.
WHAT TO MEASURE : AUDIENCE GROWTH
PAID VS. ORGANIC SEARCH TRAFFIC
SOCIAL SHARES/ FOLLOWERS
SHARE OF VOICE/ OFFSITE SEO
Users who have subscribed to updates
on your brand’s social accounts.
Search traffic your site receives from
paid search advertisements versus traffic
due to a high organic search ranking.
BRAND AWARENESS BRAND HEALTH CONVERSIONS
BRAND AWARENESS BRAND HEALTH CONVERSIONS
HOW TO CALCULATE THE VALUE OF:
TIME ON SITE
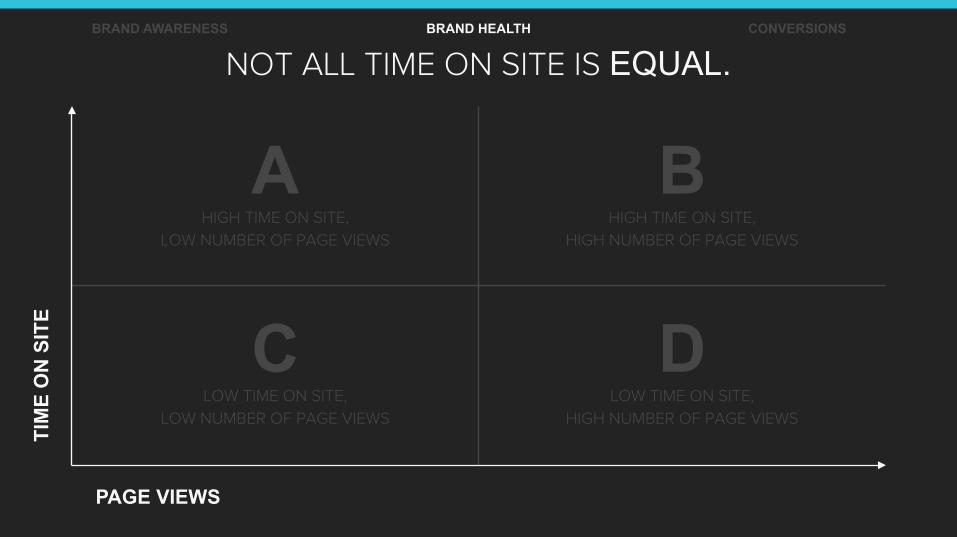
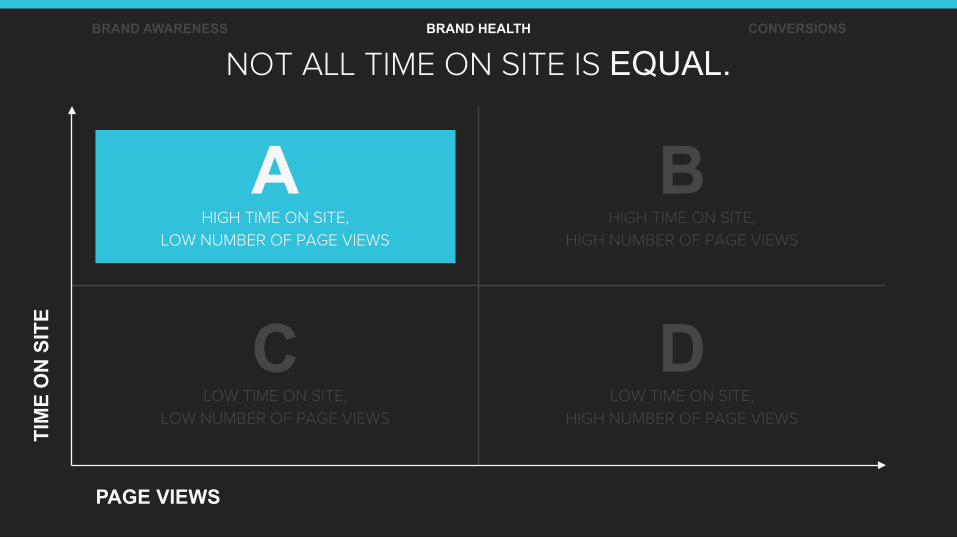
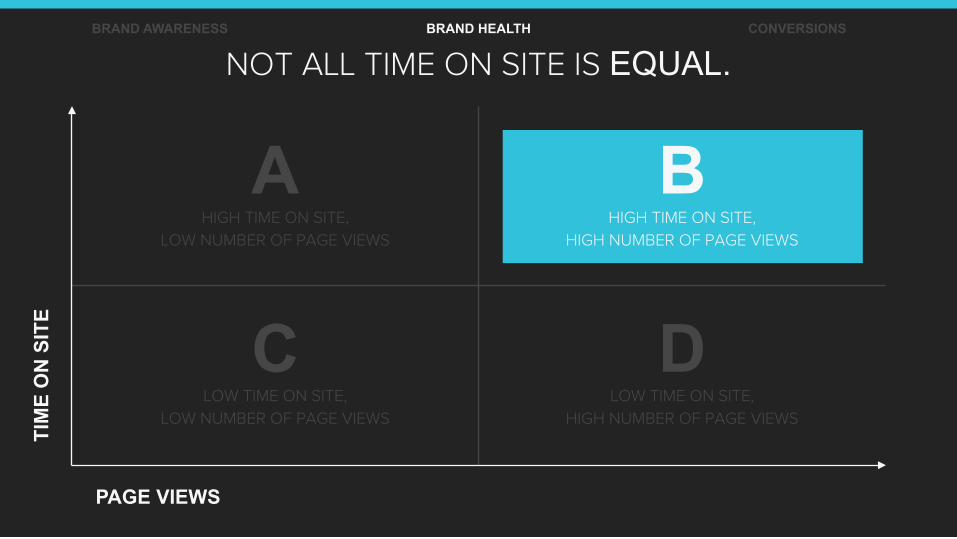
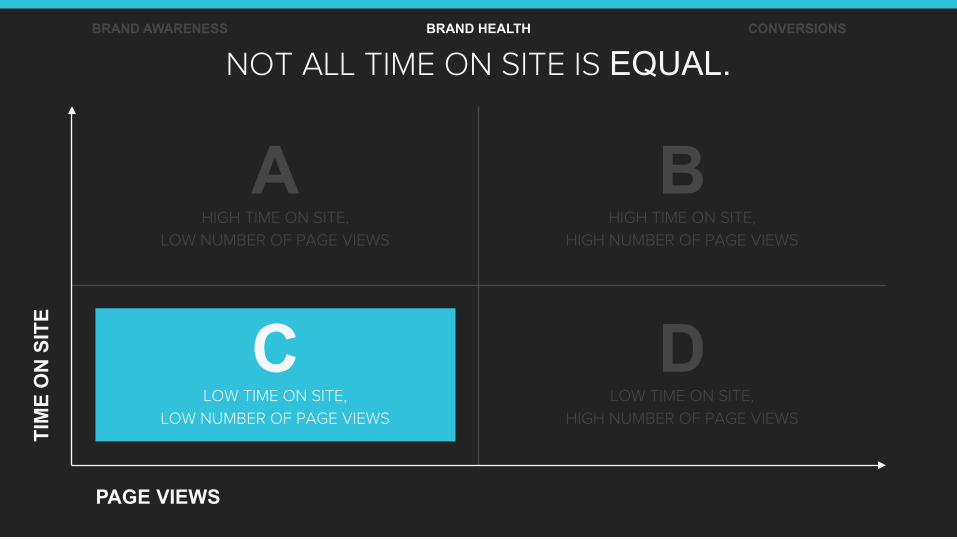
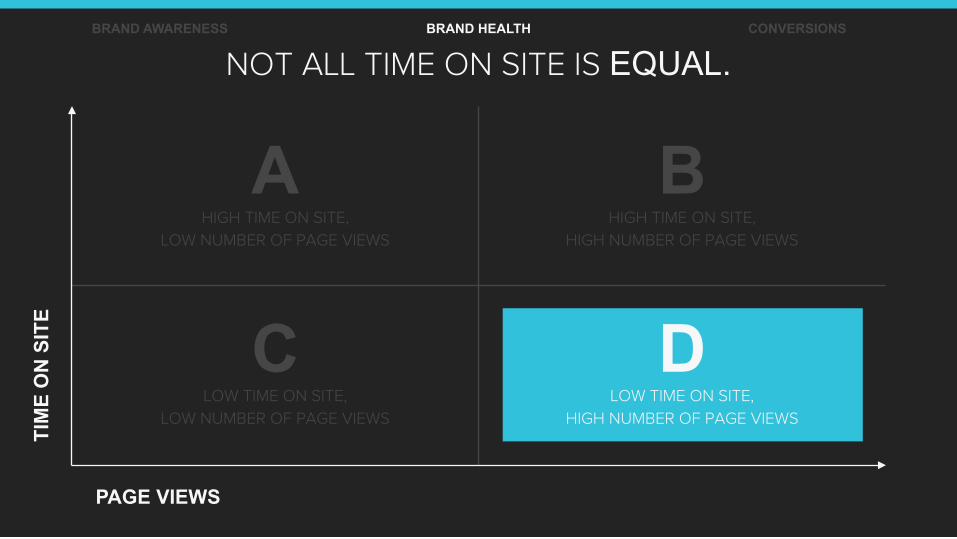
NOT ALL TIME ON SITE IS EQUAL. TI
ME
ON
SIT
E
PAGE VIEWS
BRAND AWARENESS BRAND HEALTH CONVERSIONS
A HIGH TIME ON SITE,
LOW NUMBER OF PAGE VIEWS
B HIGH TIME ON SITE,
HIGH NUMBER OF PAGE VIEWS
C LOW TIME ON SITE,
LOW NUMBER OF PAGE VIEWS
D LOW TIME ON SITE,
HIGH NUMBER OF PAGE VIEWS
NOT ALL TIME ON SITE IS EQUAL. TI
ME
ON
SIT
E
PAGE VIEWS
BRAND AWARENESS BRAND HEALTH CONVERSIONS
A HIGH TIME ON SITE,
LOW NUMBER OF PAGE VIEWS
B HIGH TIME ON SITE,
HIGH NUMBER OF PAGE VIEWS
C LOW TIME ON SITE,
LOW NUMBER OF PAGE VIEWS
D LOW TIME ON SITE,
HIGH NUMBER OF PAGE VIEWS

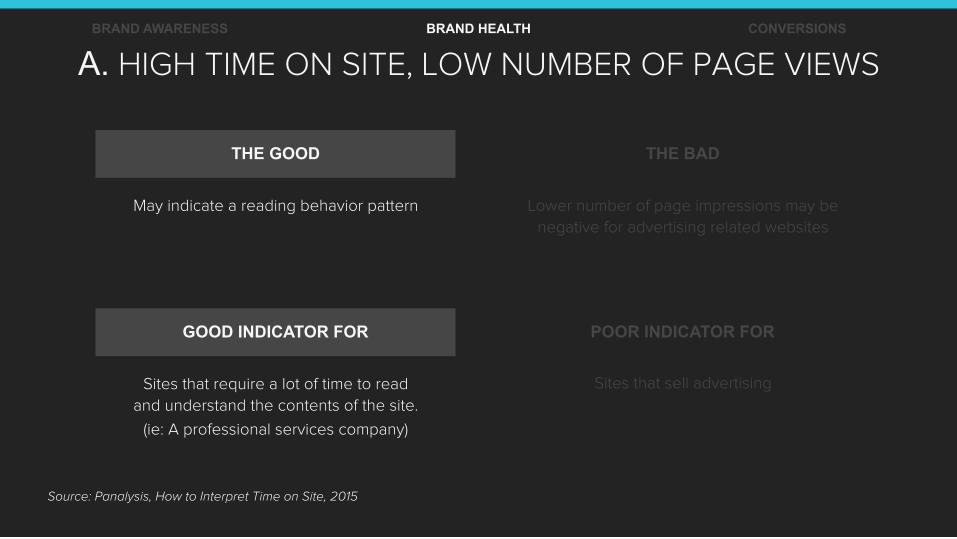
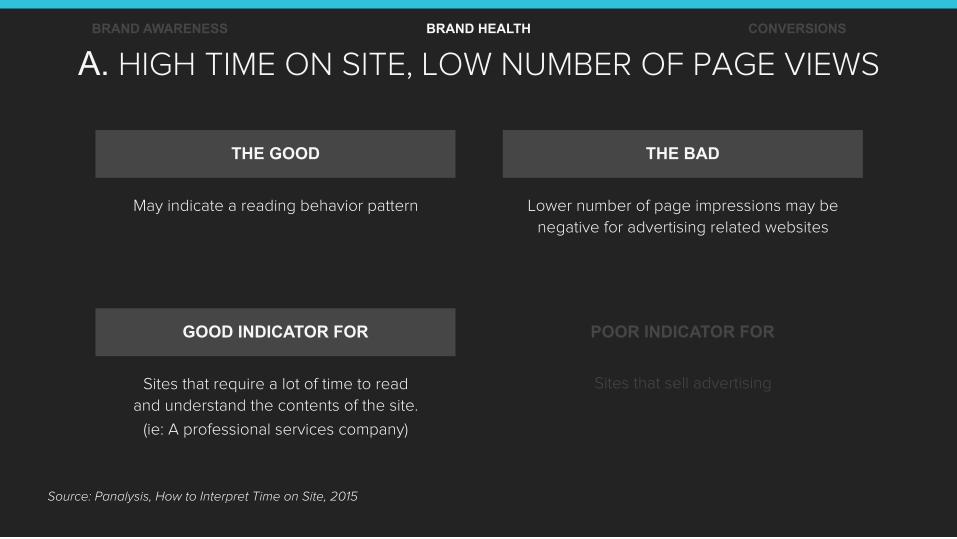
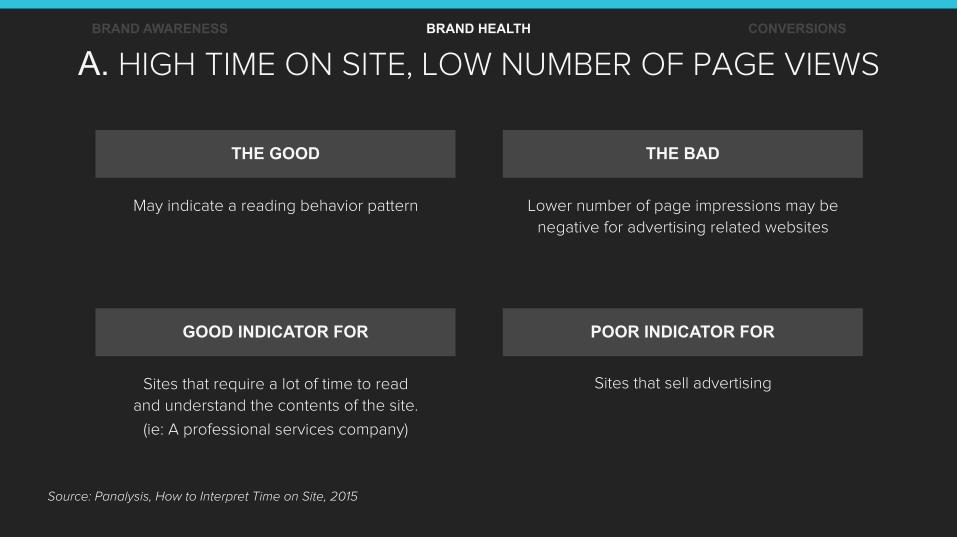
A. HIGH TIME ON SITE, LOW NUMBER OF PAGE VIEWS BRAND AWARENESS BRAND HEALTH CONVERSIONS
THE GOOD THE BAD
GOOD INDICATOR FOR POOR INDICATOR FOR
May indicate a reading behavior pattern Lower number of page impressions may be negative for advertising related websites
Source: Panalysis, How to Interpret Time on Site, 2015
Sites that require a lot of time to read and understand the contents of the site.
(ie: A professional services company)
Sites that sell advertising
NOT ALL TIME ON SITE IS EQUAL. TI
ME
ON
SIT
E
PAGE VIEWS
BRAND AWARENESS BRAND HEALTH CONVERSIONS
A HIGH TIME ON SITE,
LOW NUMBER OF PAGE VIEWS
B HIGH TIME ON SITE,
HIGH NUMBER OF PAGE VIEWS
C LOW TIME ON SITE,
LOW NUMBER OF PAGE VIEWS
D LOW TIME ON SITE,
HIGH NUMBER OF PAGE VIEWS
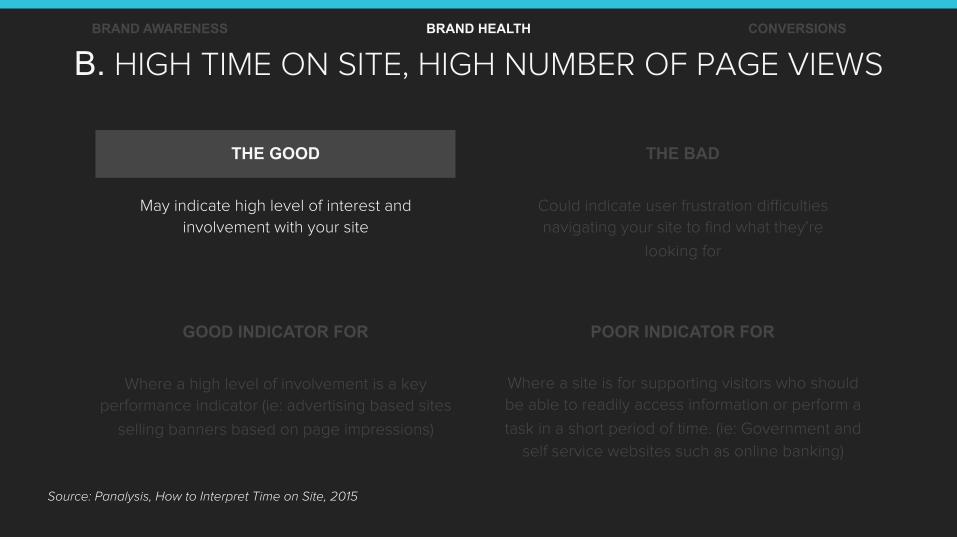
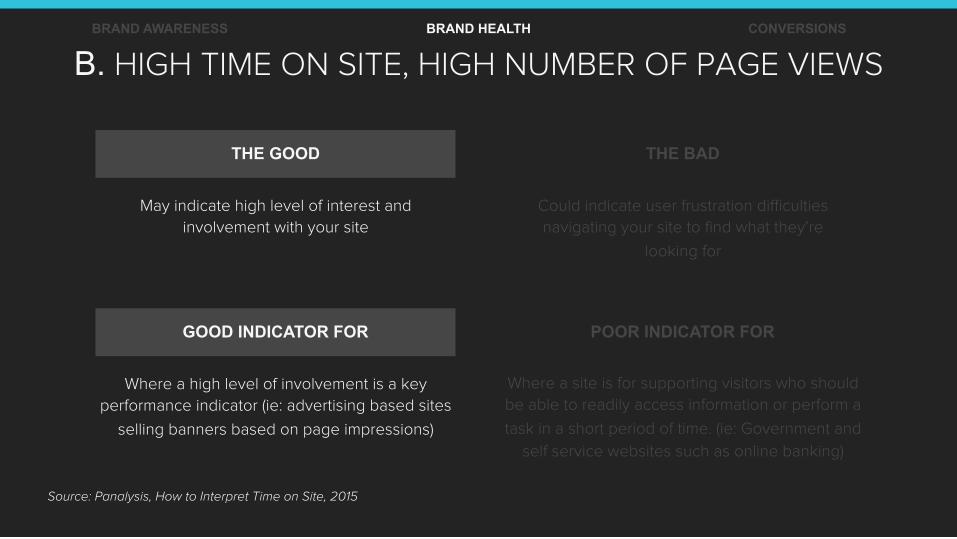
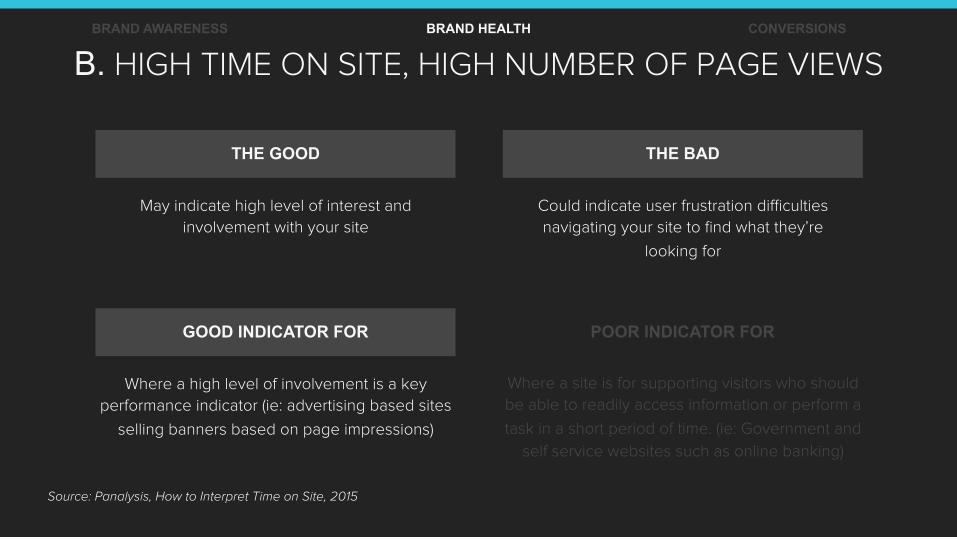
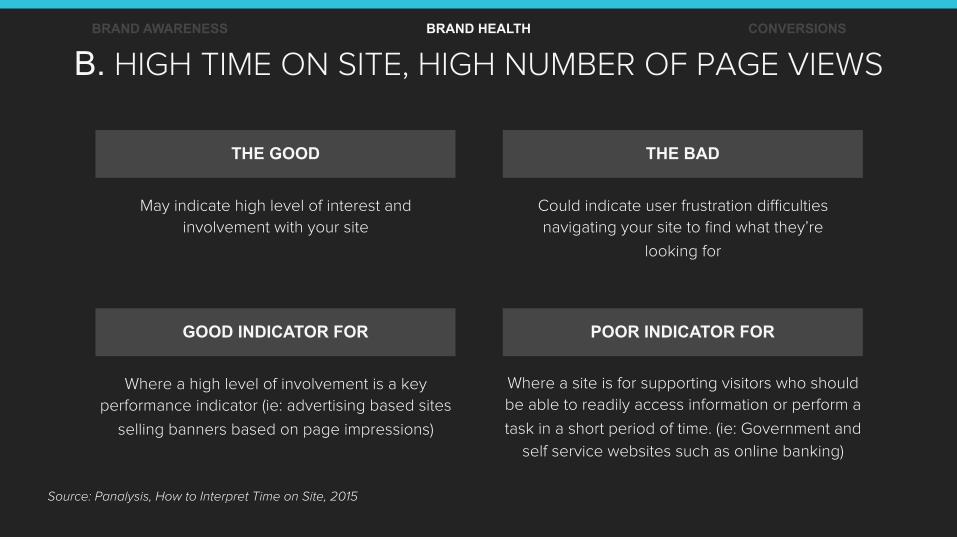
B. HIGH TIME ON SITE, HIGH NUMBER OF PAGE VIEWS BRAND AWARENESS BRAND HEALTH CONVERSIONS
THE GOOD THE BAD
GOOD INDICATOR FOR POOR INDICATOR FOR
May indicate high level of interest and involvement with your site
Could indicate user frustration difficulties navigating your site to find what they’re
looking for
Source: Panalysis, How to Interpret Time on Site, 2015
Where a high level of involvement is a key performance indicator (ie: advertising based sites
selling banners based on page impressions)
Where a site is for supporting visitors who should be able to readily access information or perform a
task in a short period of time. (ie: Government and
self service websites such as online banking)
NOT ALL TIME ON SITE IS EQUAL. TI
ME
ON
SIT
E
PAGE VIEWS
BRAND AWARENESS BRAND HEALTH CONVERSIONS
A HIGH TIME ON SITE,
LOW NUMBER OF PAGE VIEWS
B HIGH TIME ON SITE,
HIGH NUMBER OF PAGE VIEWS
C LOW TIME ON SITE,
LOW NUMBER OF PAGE VIEWS
D LOW TIME ON SITE,
HIGH NUMBER OF PAGE VIEWS
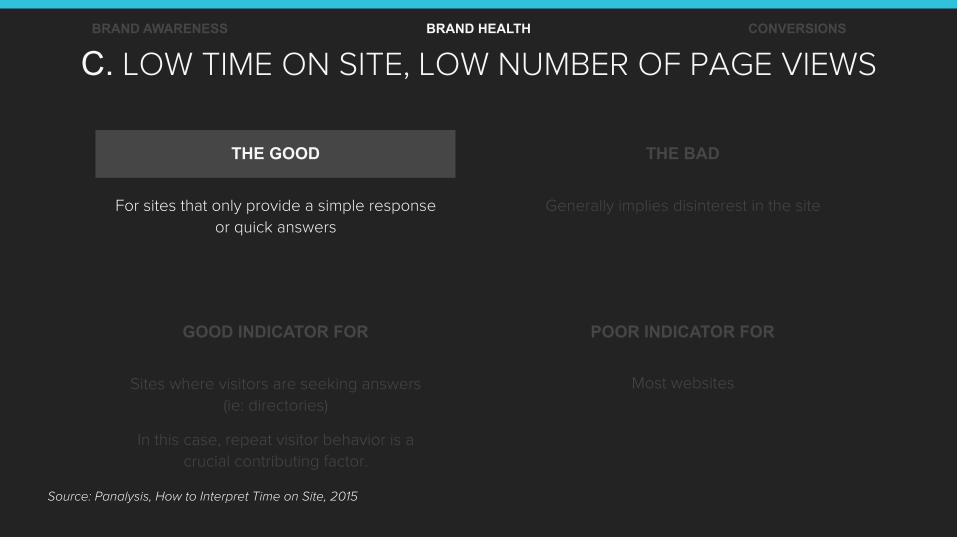
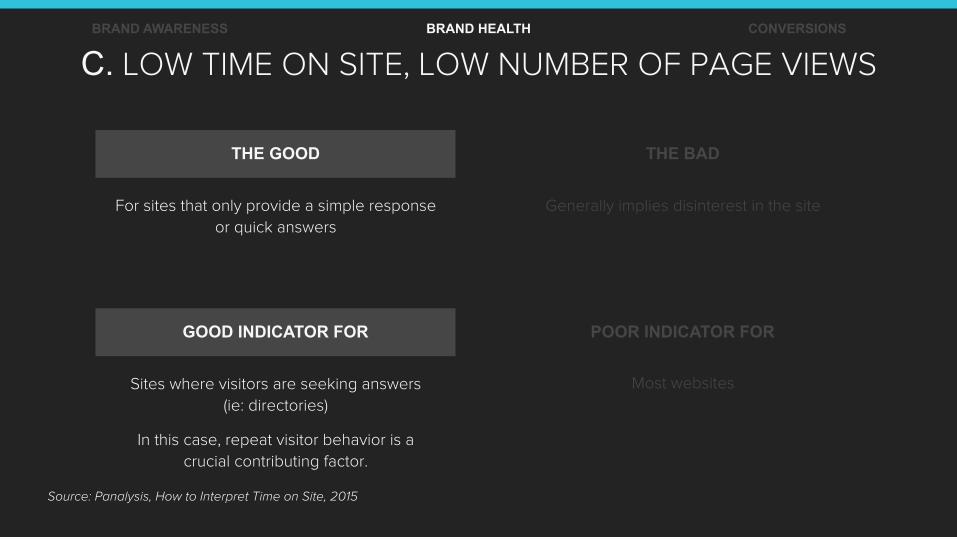
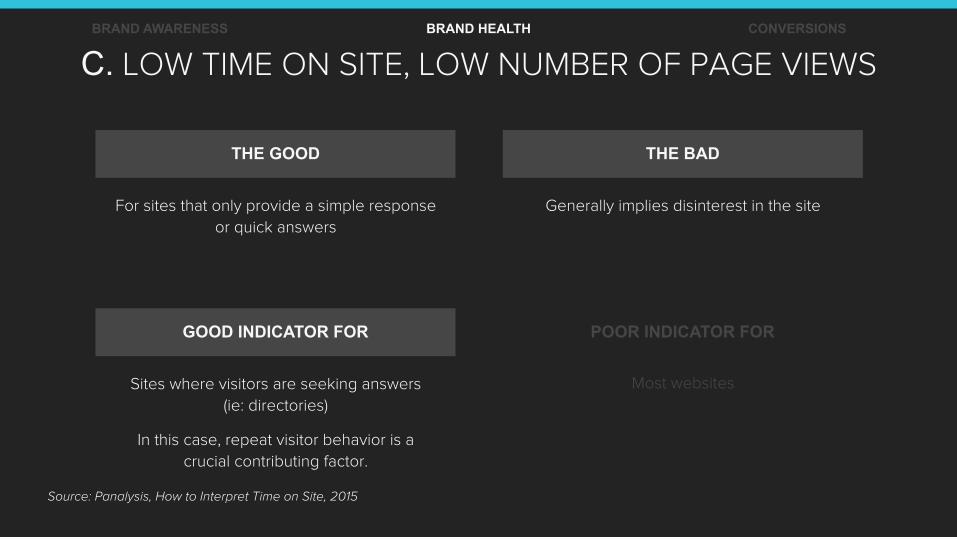
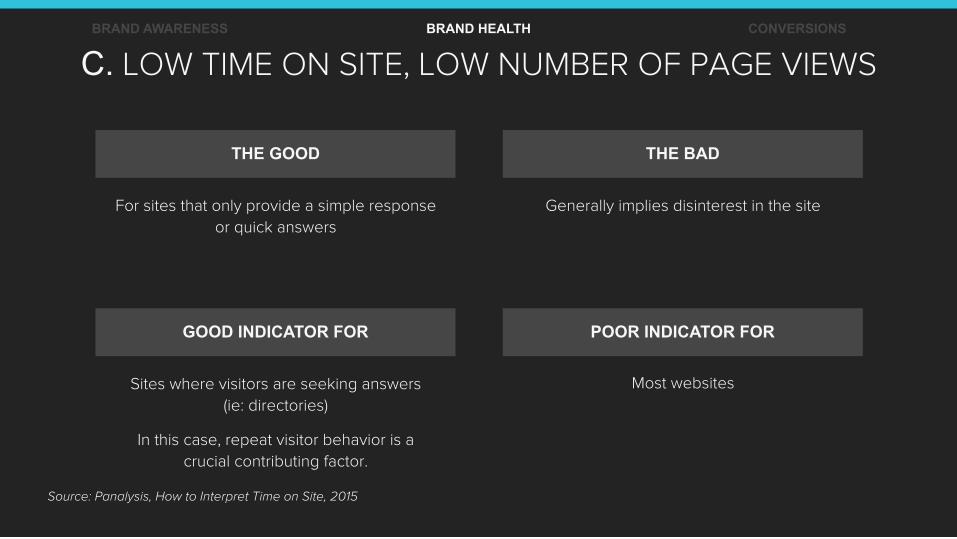
C. LOW TIME ON SITE, LOW NUMBER OF PAGE VIEWS BRAND AWARENESS BRAND HEALTH CONVERSIONS
THE GOOD THE BAD
GOOD INDICATOR FOR POOR INDICATOR FOR
For sites that only provide a simple response or quick answers
Generally implies disinterest in the site
Source: Panalysis, How to Interpret Time on Site, 2015
Sites where visitors are seeking answers (ie: directories)
In this case, repeat visitor behavior is a
crucial contributing factor.
Most websites
NOT ALL TIME ON SITE IS EQUAL. TI
ME
ON
SIT
E
PAGE VIEWS
BRAND AWARENESS BRAND HEALTH CONVERSIONS
A HIGH TIME ON SITE,
LOW NUMBER OF PAGE VIEWS
B HIGH TIME ON SITE,
HIGH NUMBER OF PAGE VIEWS
C LOW TIME ON SITE,
LOW NUMBER OF PAGE VIEWS
D LOW TIME ON SITE,
HIGH NUMBER OF PAGE VIEWS

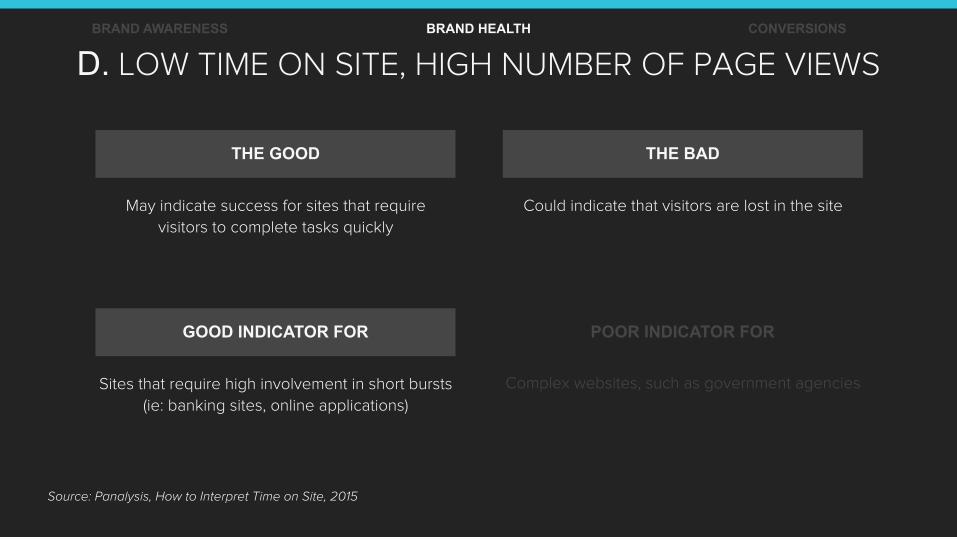
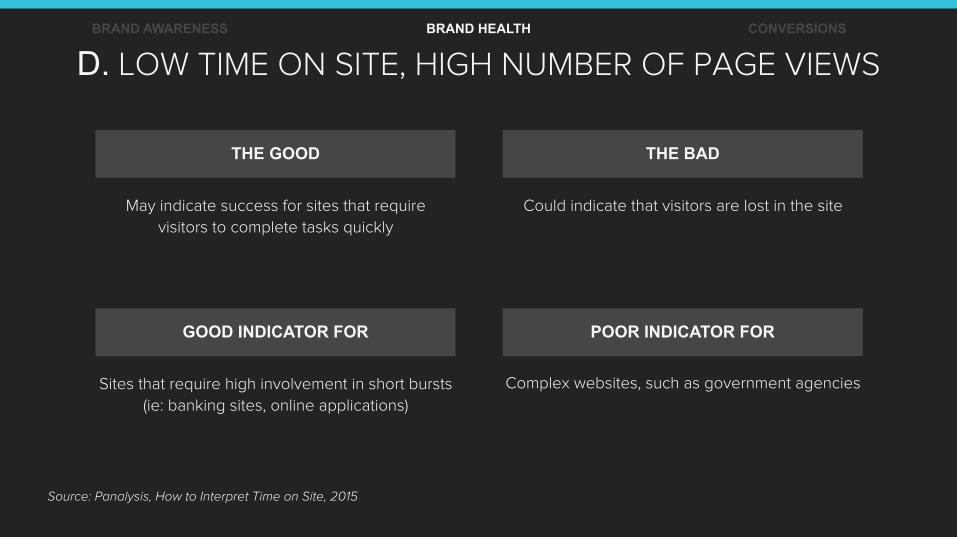
D. LOW TIME ON SITE, HIGH NUMBER OF PAGE VIEWS BRAND AWARENESS BRAND HEALTH CONVERSIONS
THE GOOD THE BAD
GOOD INDICATOR FOR POOR INDICATOR FOR
May indicate success for sites that require visitors to complete tasks quickly
Could indicate that visitors are lost in the site
Source: Panalysis, How to Interpret Time on Site, 2015
Sites that require high involvement in short bursts (ie: banking sites, online applications)
Complex websites, such as government agencies
When determining your time on site goals,
it’s important to keep in mind why someone
is going to your site.
BRAND AWARENESS BRAND HEALTH CONVERSIONS
BRAND AWARENESS BRAND HEALTH CONVERSIONS
HOW TO CALCUALTE THE VALUE OF:
REPEAT VISITORS
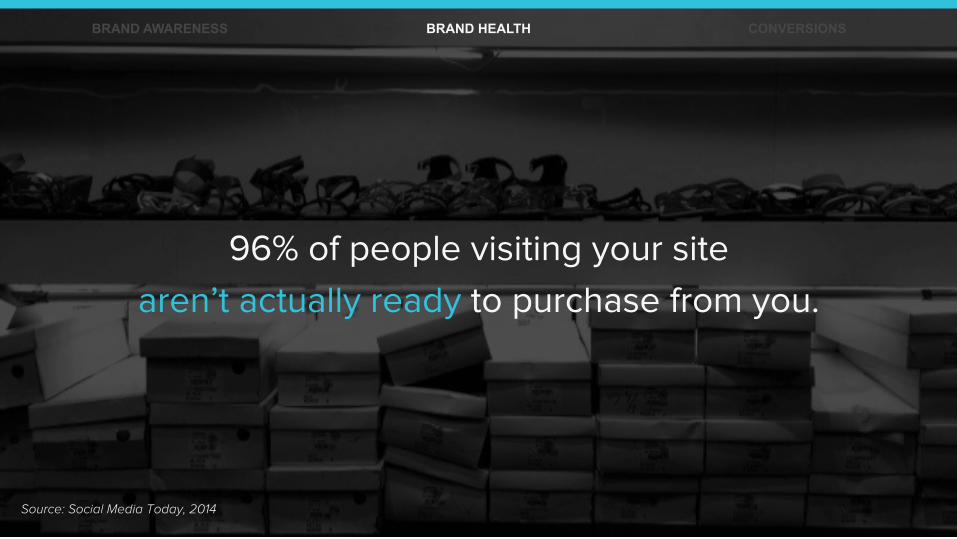
96% of people visiting your site
aren’t actually ready to purchase from you.
Source: Social Media Today, 2014
BRAND AWARENESS BRAND HEALTH CONVERSIONS
So you need to think of other ways to bring
prospects back to your site so that when they are
ready to purchase, they choose you.
BRAND AWARENESS BRAND HEALTH CONVERSIONS
Source: Inc, 2 Web Metrics You Should be Watching All the Time, 2014
If your ultimate goal is to sell a product or
service, you're much more likely to sell to visitors
who come back time after time.
BRAND AWARENESS BRAND HEALTH CONVERSIONS
Source: Inc, 2 Web Metrics You Should be Watching All the Time, 2014
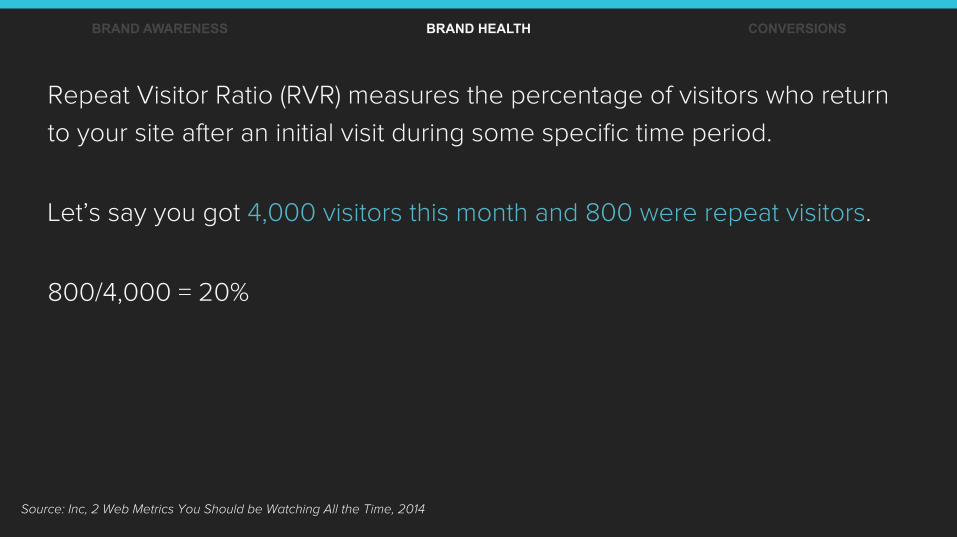
Repeat Visitor Ratio (RVR) measures the percentage of visitors who return
to your site after an initial visit during some specific time period.
Let’s say you got 4,000 visitors this month and 800 were repeat visitors.
800/4,000 = 20%
BRAND AWARENESS BRAND HEALTH CONVERSIONS
Source: Inc, 2 Web Metrics You Should be Watching All the Time, 2014
RVR is great way to determine whether you are successfully engaging your
site visitors.
New visitors are fine, but repeat visitors are great since once you "have" a
new reader you don't have to spend time and money attracting that
reader--your content is sufficient. So the higher your RVR the better your
website must be at engaging the average new visitor.
BRAND AWARENESS BRAND HEALTH CONVERSIONS

To put a monetary value on RVR, we need to
look at the average amount you’re spending
in advertising to drive net new traffic.
BRAND AWARENESS BRAND HEALTH CONVERSIONS
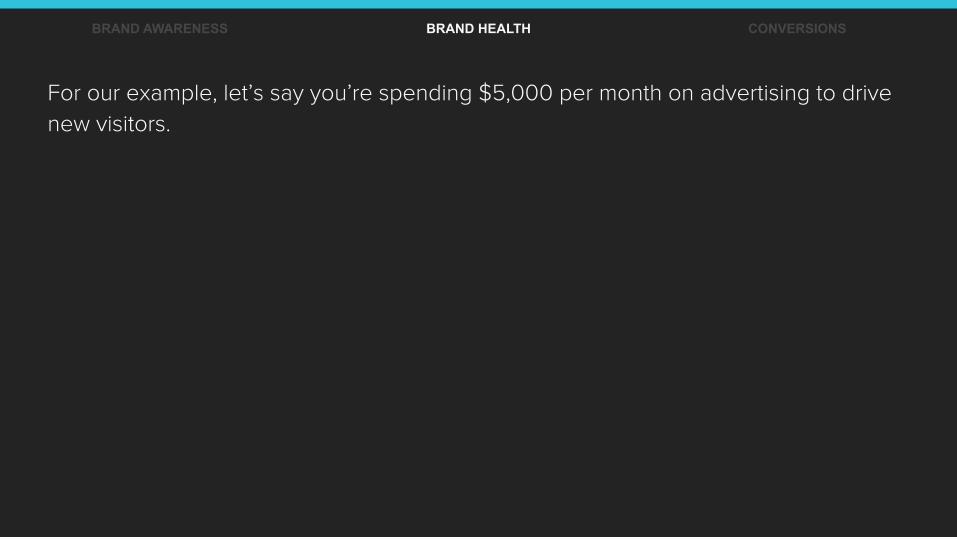
For our example, let’s say you’re spending $5,000 per month on advertising to drive
new visitors.
BRAND AWARENESS BRAND HEALTH CONVERSIONS
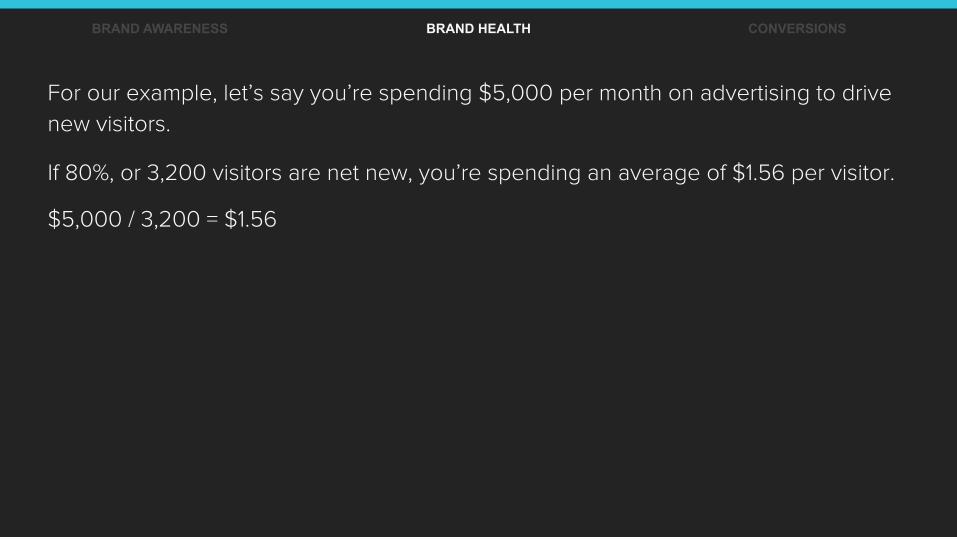
For our example, let’s say you’re spending $5,000 per month on advertising to drive
new visitors. If 80%, or 3,200 visitors are net new, you’re spending an average of $1.56 per visitor. $5,000 / 3,200 = $1.56
BRAND AWARENESS BRAND HEALTH CONVERSIONS
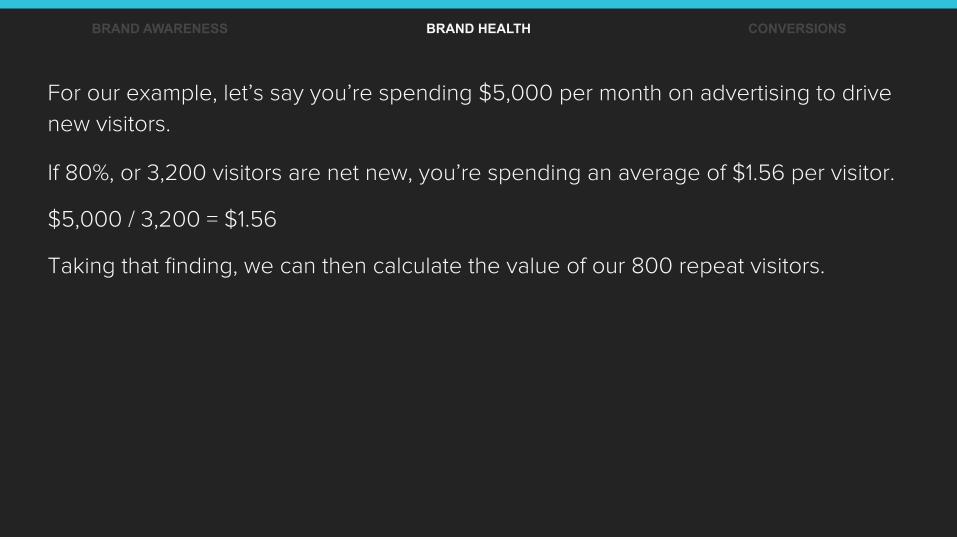
For our example, let’s say you’re spending $5,000 per month on advertising to drive
new visitors. If 80%, or 3,200 visitors are net new, you’re spending an average of $1.56 per visitor. $5,000 / 3,200 = $1.56 Taking that finding, we can then calculate the value of our 800 repeat visitors.
BRAND AWARENESS BRAND HEALTH CONVERSIONS
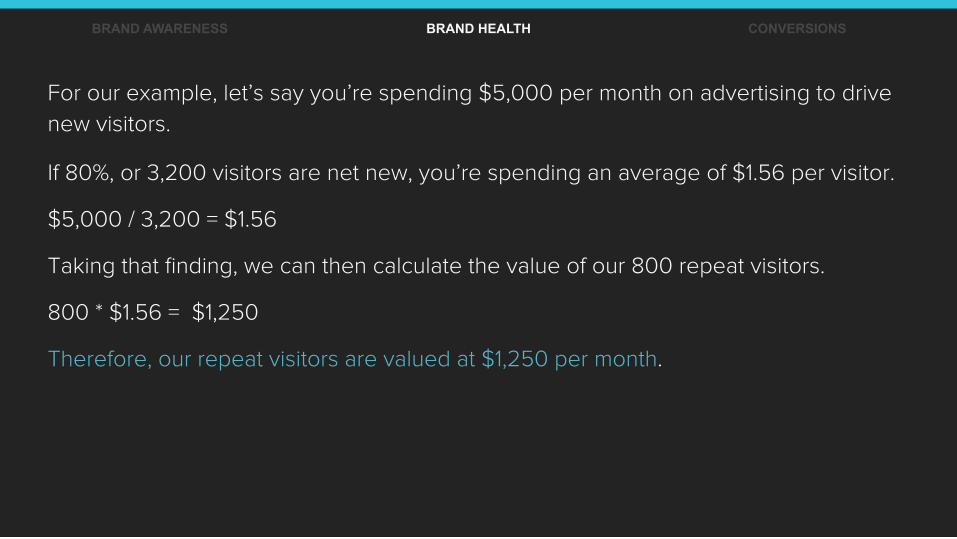
For our example, let’s say you’re spending $5,000 per month on advertising to drive
new visitors. If 80%, or 3,200 visitors are net new, you’re spending an average of $1.56 per visitor. $5,000 / 3,200 = $1.56 Taking that finding, we can then calculate the value of our 800 repeat visitors. 800 * $1.56 = $1,250 Therefore, our repeat visitors are valued at $1,250 per month.
BRAND AWARENESS BRAND HEALTH CONVERSIONS
How do you improve your RVR?
BRAND AWARENESS BRAND HEALTH CONVERSIONS
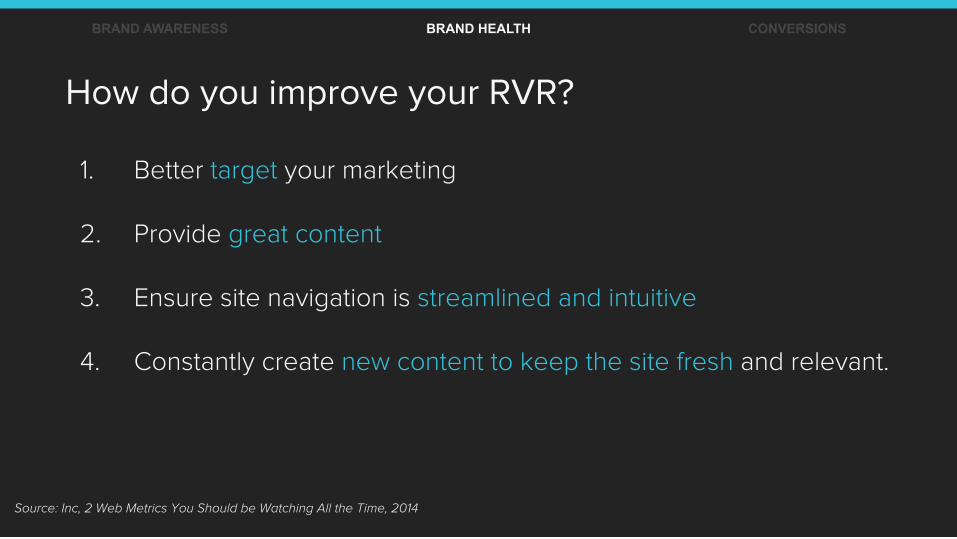
1. Better target your marketing 2. Provide great content 3. Ensure site navigation is streamlined and intuitive 4. Constantly create new content to keep the site fresh and relevant.
BRAND AWARENESS BRAND HEALTH CONVERSIONS
Source: Inc, 2 Web Metrics You Should be Watching All the Time, 2014
How do you improve your RVR?
Don’t forget that while you want to increase the
percentage of repeat visitors, you also want to
increase the total number of visitors…
BRAND AWARENESS BRAND HEALTH CONVERSIONS
Don’t forget that while you want to increase the
percentage of repeat visitors, you also want to
increase the total number of visitors…
Otherwise you’ll be preaching to the same choir.
BRAND AWARENESS BRAND HEALTH CONVERSIONS
BRAND AWARENESS BRAND HEALTH CONVERSIONS
HOW TO CALCULATE THE VALUE OF:
SOCIAL LIKES
Social “likes” are a light indicator
for whether or not your audience is
resonating with your content.
BRAND AWARENESS BRAND HEALTH CONVERSIONS
While many have tried, it is difficult to assess
real value in a like. However, it is important to track
social shares over time to ensure your content is
reaching baseline or increasing
level of engagement.
BRAND AWARENESS BRAND HEALTH CONVERSIONS
BRAND AWARENESS BRAND HEALTH CONVERSIONS
HOW TO CALCULATE THE VALUE OF:
SUBSCRIPTIONS
Source: AMEX Open Forum, What’s Your Email List Worth (In Actual Dollars)?, 2013
Your email list is an asset,
and should be valued as such.
BRAND AWARENESS BRAND HEALTH CONVERSIONS
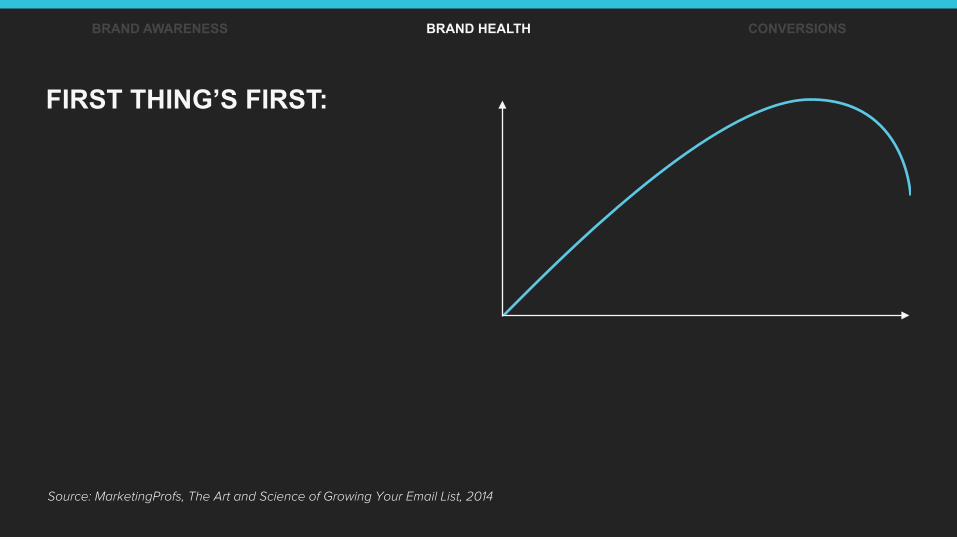
Source: MarketingProfs, The Art and Science of Growing Your Email List, 2014
BRAND AWARENESS BRAND HEALTH CONVERSIONS
FIRST THING’S FIRST:
Source: MarketingProfs, The Art and Science of Growing Your Email List, 2014
BRAND AWARENESS BRAND HEALTH CONVERSIONS
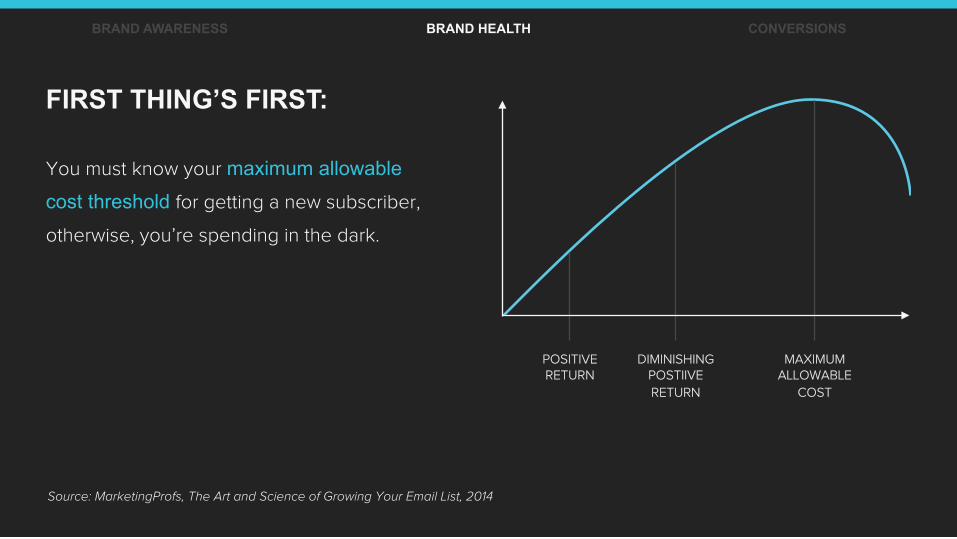
POSITIVE RETURN
DIMINISHING POSTIIVE RETURN
MAXIMUM ALLOWABLE
COST
FIRST THING’S FIRST: You must know your maximum allowable
cost threshold for getting a new subscriber,
otherwise, you’re spending in the dark.
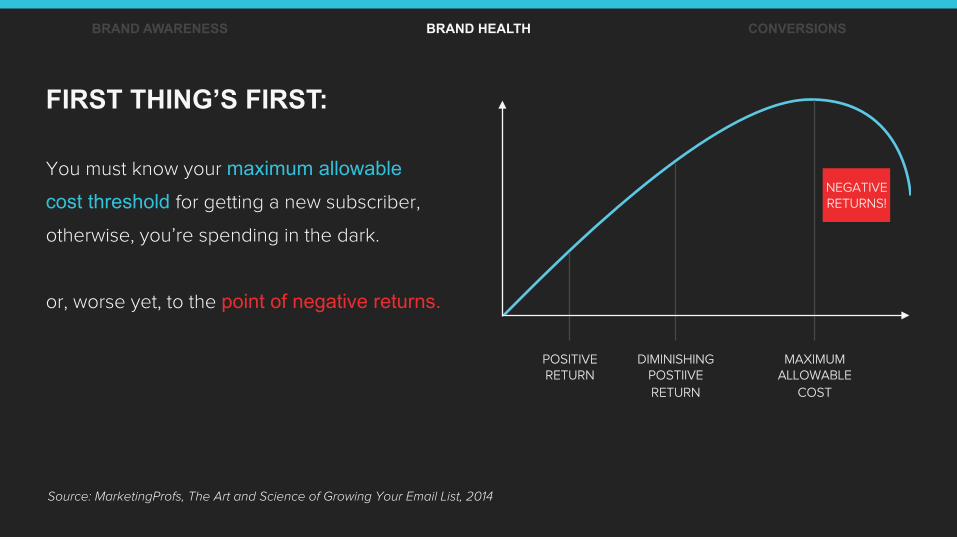
NEGATIVE RETURNS!
Source: MarketingProfs, The Art and Science of Growing Your Email List, 2014
FIRST THING’S FIRST: You must know your maximum allowable
cost threshold for getting a new subscriber,
otherwise, you’re spending in the dark.
or, worse yet, to the point of negative returns.
BRAND AWARENESS BRAND HEALTH CONVERSIONS
POSITIVE RETURN
DIMINISHING POSTIIVE RETURN
MAXIMUM ALLOWABLE
COST

Knowing your cost to obtain a new list member is the only way to determine how much you can actually afford to invest in growing your list sign-up…
Source: MarketingProfs, The Art and Science of Growing Your Email List, 2014
BRAND AWARENESS BRAND HEALTH CONVERSIONS
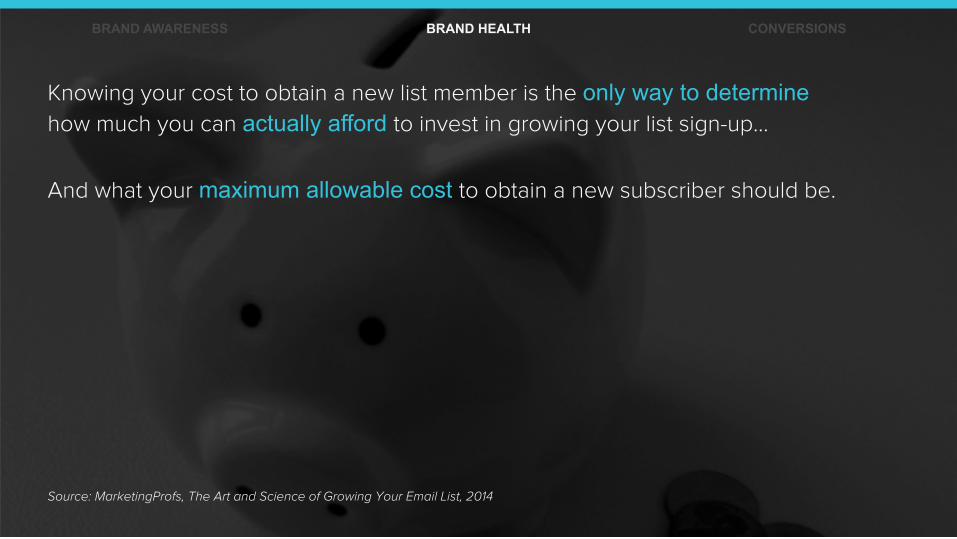
Knowing your cost to obtain a new list member is the only way to determine how much you can actually afford to invest in growing your list sign-up…
And what your maximum allowable cost to obtain a new subscriber should be.
Source: MarketingProfs, The Art and Science of Growing Your Email List, 2014
BRAND AWARENESS BRAND HEALTH CONVERSIONS
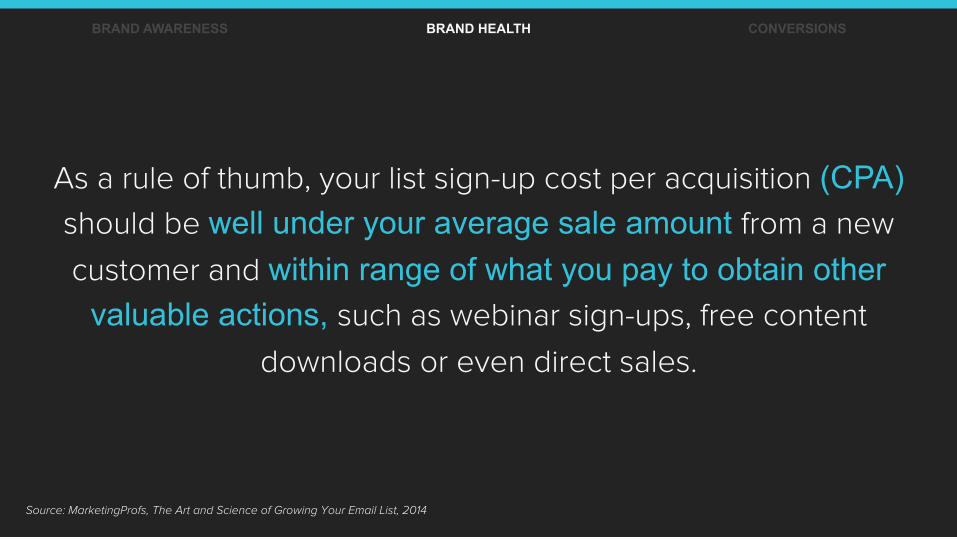
As a rule of thumb, your list sign-up cost per acquisition (CPA) should be well under your average sale amount from a new
customer and within range of what you pay to obtain other valuable actions, such as webinar sign-ups, free content
downloads or even direct sales.
Source: MarketingProfs, The Art and Science of Growing Your Email List, 2014
BRAND AWARENESS BRAND HEALTH CONVERSIONS
Source: MarketingProfs, The Art and Science of Growing Your Email List, 2014
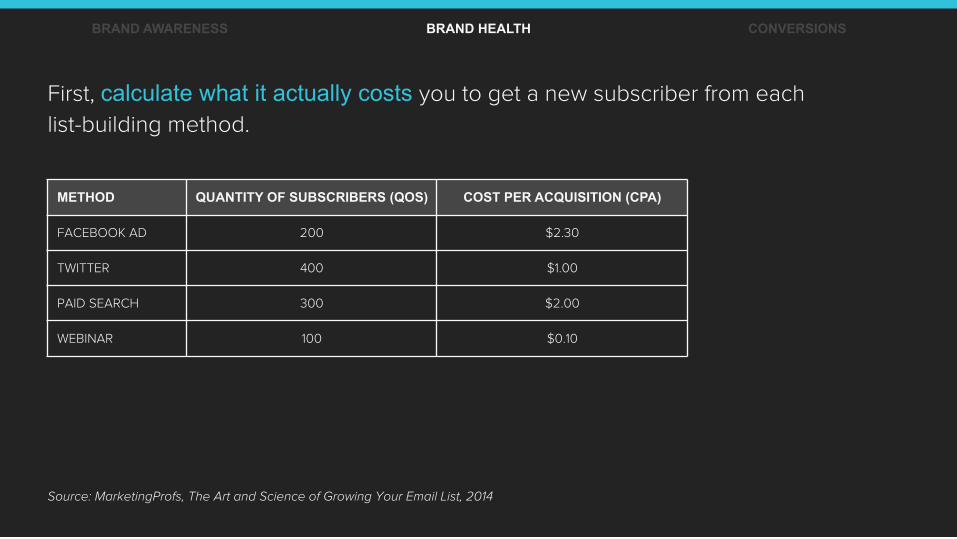
METHOD QUANTITY OF SUBSCRIBERS (QOS) COST PER ACQUISITION (CPA)
FACEBOOK AD 200 $2.30
TWITTER 400 $1.00
PAID SEARCH 300 $2.00
WEBINAR 100 $0.10
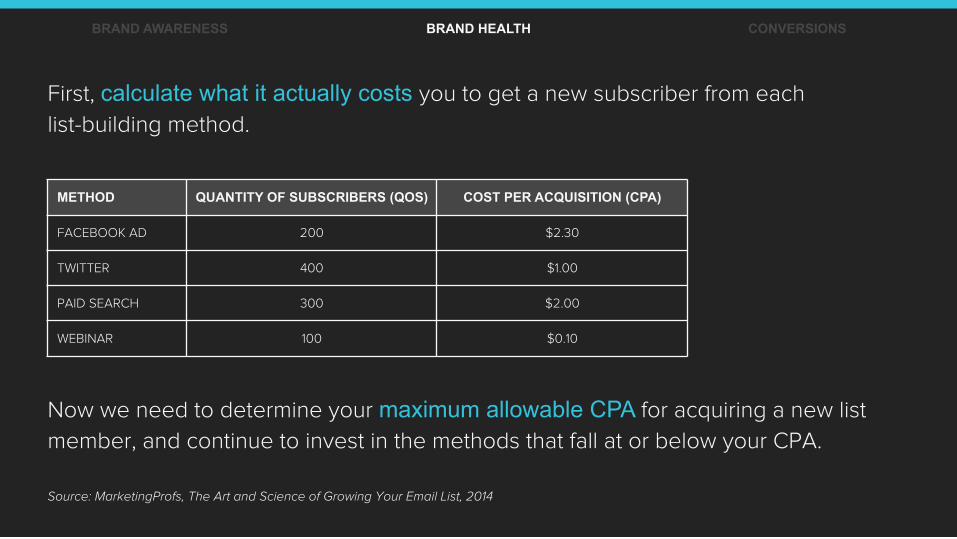
First, calculate what it actually costs you to get a new subscriber from each
list-building method.
BRAND AWARENESS BRAND HEALTH CONVERSIONS
Source: MarketingProfs, The Art and Science of Growing Your Email List, 2014
Now we need to determine your maximum allowable CPA for acquiring a new list
member, and continue to invest in the methods that fall at or below your CPA.
First, calculate what it actually costs you to get a new subscriber from each
list-building method.
BRAND AWARENESS BRAND HEALTH CONVERSIONS
METHOD QUANTITY OF SUBSCRIBERS (QOS) COST PER ACQUISITION (CPA)
FACEBOOK AD 200 $2.30
TWITTER 400 $1.00
PAID SEARCH 300 $2.00
WEBINAR 100 $0.10
BRAND AWARENESS BRAND HEALTH CONVERSIONS
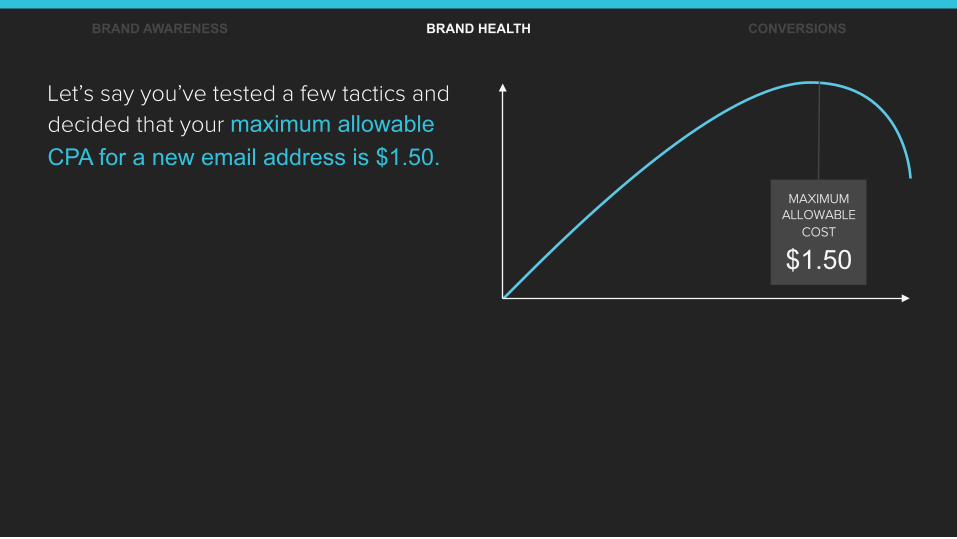
Let’s say you’ve tested a few tactics and
decided that your maximum allowable CPA for a new email address is $1.50.
MAXIMUM ALLOWABLE
COST
$1.50

BRAND AWARENESS BRAND HEALTH CONVERSIONS
METHOD QUANTITY OF SUBSCRIBERS (QOS) COST PER ACQUISITION (CPA)
FACEBOOK AD 200 $2.30
TWITTER 400 $1.00
PAID SEARCH 300 $2.00
WEBINAR 100 $0.10
Moving forward, you’ll want to continue pursuing all methods
costing $1.50 or less.
BRAND AWARENESS BRAND HEALTH CONVERSIONS
METHOD QUANTITY OF SUBSCRIBERS (QOS)
COST PER ACQUISITION (CPA)
UNSUBSCRIBE RATE (UR)
AVERAGE SALE VALUE (ASV)
FACEBOOK AD 200 $2.30 30% $100
TWITTER 400 $1.00 5% $100
PAID SEARCH 300 $2.00 15% $150
WEBINAR 100 $0.10 5% $200
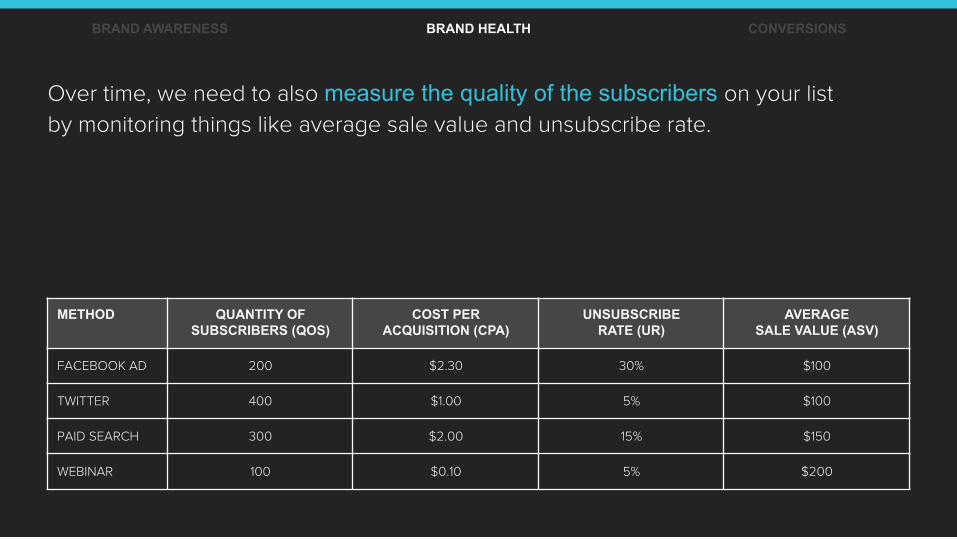
Over time, we need to also measure the quality of the subscribers on your list
by monitoring things like average sale value and unsubscribe rate.
BRAND AWARENESS BRAND HEALTH CONVERSIONS
METHOD QUANTITY OF SUBSCRIBERS (QOS)
COST PER ACQUISITION (CPA)
UNSUBSCRIBE RATE (UR)
AVERAGE SALE VALUE (ASV)
FACEBOOK AD 200 $2.30 30% $100
TWITTER 400 $1.00 5% $100
PAID SEARCH 300 $2.00 15% $150
WEBINAR 100 $0.10 5% $200
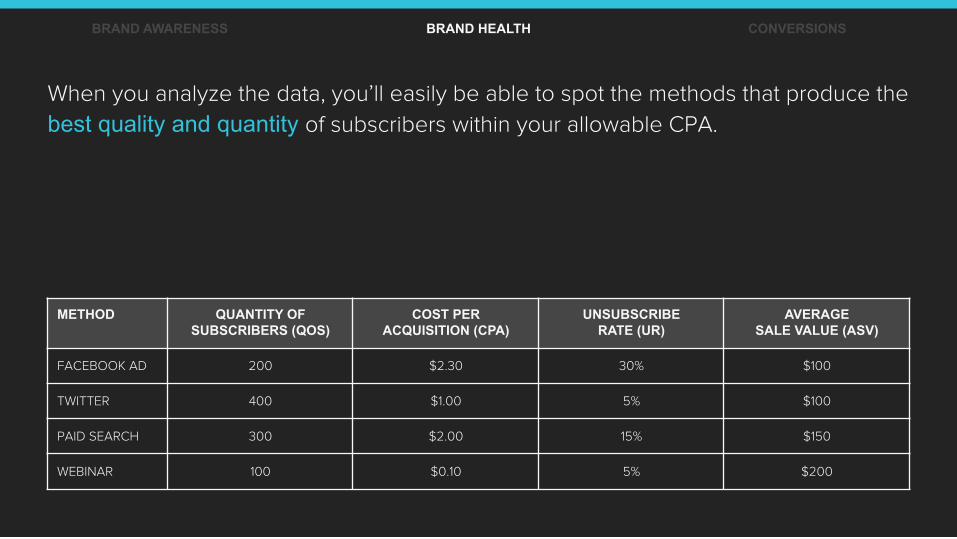
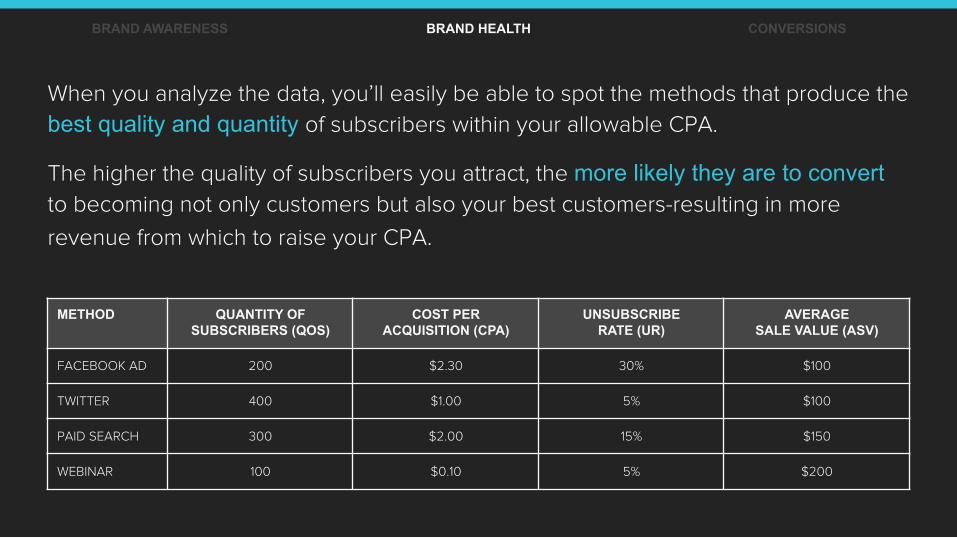
When you analyze the data, you’ll easily be able to spot the methods that produce the
best quality and quantity of subscribers within your allowable CPA.
BRAND AWARENESS BRAND HEALTH CONVERSIONS
METHOD QUANTITY OF SUBSCRIBERS (QOS)
COST PER ACQUISITION (CPA)
UNSUBSCRIBE RATE (UR)
AVERAGE SALE VALUE (ASV)
FACEBOOK AD 200 $2.30 30% $100
TWITTER 400 $1.00 5% $100
PAID SEARCH 300 $2.00 15% $150
WEBINAR 100 $0.10 5% $200
When you analyze the data, you’ll easily be able to spot the methods that produce the
best quality and quantity of subscribers within your allowable CPA. The higher the quality of subscribers you attract, the more likely they are to convert to becoming not only customers but also your best customers-resulting in more
revenue from which to raise your CPA.
BRAND AWARENESS BRAND HEALTH CONVERSIONS
METHOD QUANTITY OF SUBSCRIBERS (QOS)
COST PER ACQUISITION (CPA)
UNSUBSCRIBE RATE (UR)
AVERAGE SALE VALUE (ASV)
FACEBOOK AD 200 $2.30 30% $100
TWITTER 400 $1.00 5% $100
PAID SEARCH 300 $2.00 15% $150
WEBINAR 100 $0.10 5% $200
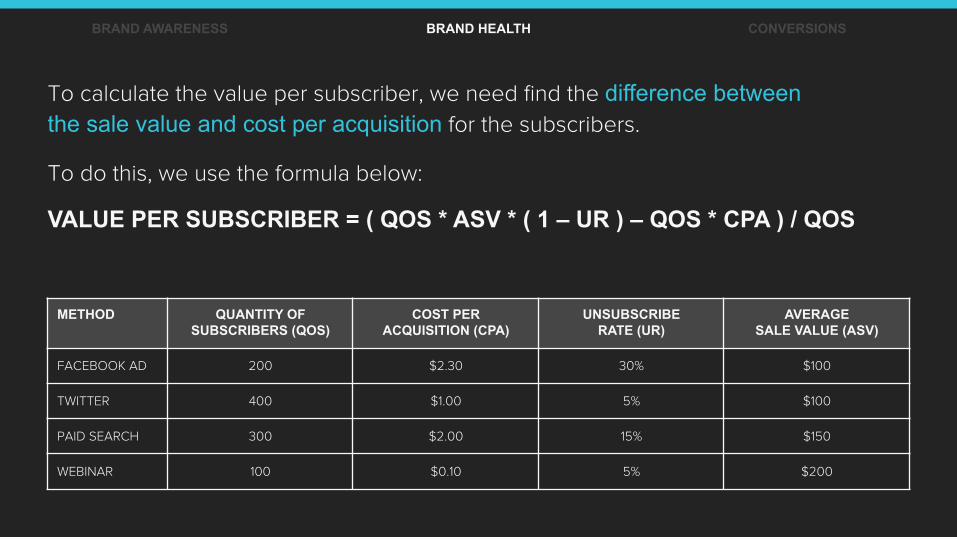
To calculate the value per subscriber, we need find the difference between the sale value and cost per acquisition for the subscribers. To do this, we use the formula below: VALUE PER SUBSCRIBER = ( QOS * ASV * ( 1 – UR ) – QOS * CPA ) / QOS
BRAND AWARENESS BRAND HEALTH CONVERSIONS BRAND AWARENESS BRAND HEALTH CONVERSIONS
METHOD QUANTITY OF SUBSCRIBERS
(QOS)
COST PER ACQUISITION
(CPA)
UNSUBSCRIBE RATE (UR)
AVERAGE SALE VALUE
(ASV)
TOTAL VALUE
(TV)
VALUE PER SUBSCRIBER
(VPS)
FACEBOOK AD 200 $2.30 30% $100 $13,540 $67.70
TWITTER 400 $1.00 5% $100 $37,600 $94
PAID SEARCH 300 $2.00 15% $150 $37,650 $125.50
WEBINAR 100 $0.10 5% $200 $18,990 $189.90
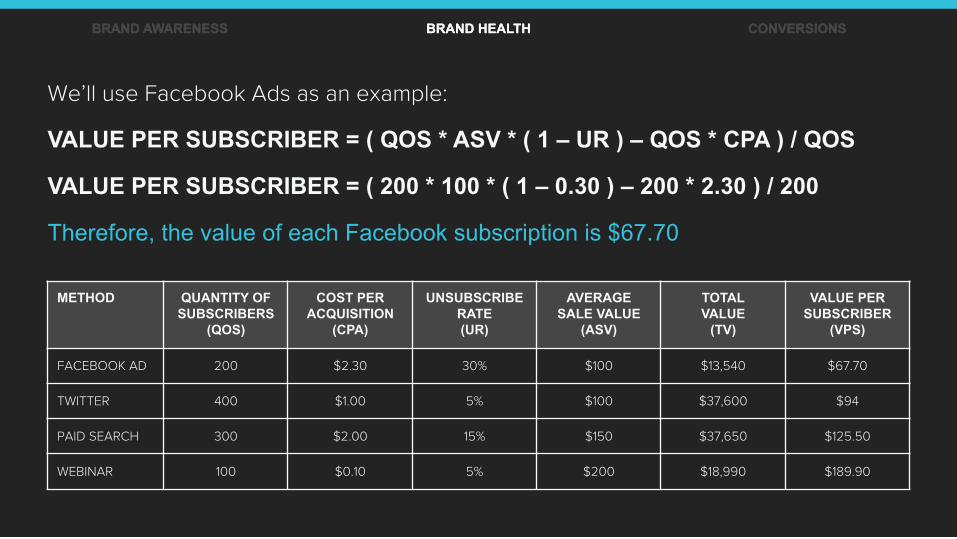
We’ll use Facebook Ads as an example: VALUE PER SUBSCRIBER = ( QOS * ASV * ( 1 – UR ) – QOS * CPA ) / QOS VALUE PER SUBSCRIBER = ( 200 * 100 * ( 1 – 0.30 ) – 200 * 2.30 ) / 200 Therefore, the value of each Facebook subscription is $67.70
BRAND AWARENESS BRAND HEALTH CONVERSIONS
METHOD QUANTITY OF SUBSCRIBERS
(QOS)
COST PER ACQUISITION
(CPA)
UNSUBSCRIBE RATE (UR)
AVERAGE SALE VALUE
(ASV)
TOTAL VALUE
(TV)
VALUE PER SUBSCRIBER
(VPS)
FACEBOOK AD 200 $2.30 30% $100 $13,540 $67.70
TWITTER 400 $1.00 5% $100 $37,600 $94
PAID SEARCH 300 $2.00 15% $150 $37,650 $125.50
WEBINAR 100 $0.10 5% $200 $18,990 $189.90
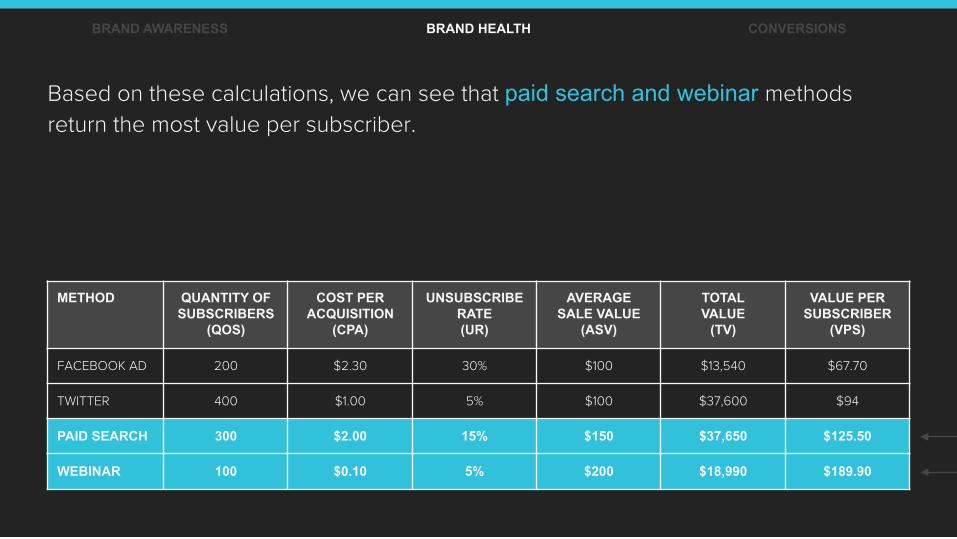
Based on these calculations, we can see that paid search and webinar methods
return the most value per subscriber.
BRAND AWARENESS BRAND HEALTH CONVERSIONS
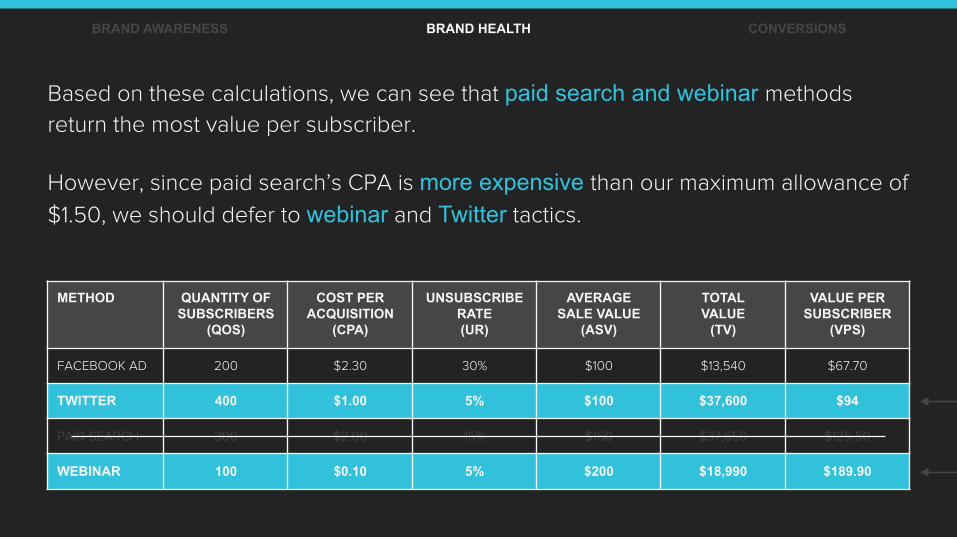
Based on these calculations, we can see that paid search and webinar methods
return the most value per subscriber.
However, since paid search’s CPA is more expensive than our maximum allowance of
$1.50, we should defer to webinar and Twitter tactics.
METHOD QUANTITY OF SUBSCRIBERS
(QOS)
COST PER ACQUISITION
(CPA)
UNSUBSCRIBE RATE (UR)
AVERAGE SALE VALUE
(ASV)
TOTAL VALUE
(TV)
VALUE PER SUBSCRIBER
(VPS)
FACEBOOK AD 200 $2.30 30% $100 $13,540 $67.70
TWITTER 400 $1.00 5% $100 $37,600 $94
PAID SEARCH 300 $2.00 15% $150 $37,650 $125.50
WEBINAR 100 $0.10 5% $200 $18,990 $189.90

BRAND AWARENESS BRAND HEALTH CONVERSIONS
HOW TO CALCULATE THE VALUE OF:
BOUNCE RATE

Your site’s bounce rate is a metric that
indicates the percentage of people who land on
one of your web pages and then leave without
clicking anywhere else on your site.
BRAND AWARENESS BRAND HEALTH CONVERSIONS
Source: Hubspot, How to Decrease Your Website’s Bounce Rate, 2014
BRAND AWARENESS BRAND HEALTH CONVERSIONS
A high bounce rate is a reason for concern since it indicates that your website visitors
aren’t looking for more content on your site, clicking on calls-to-action, or converting
into contacts.
A high bounce rate is a reason for concern since it indicates that your website visitors
aren’t looking for more content on your site, clicking on calls-to-action, or converting
into contacts. Since attracting and converting visitors into qualified leads is the main objective for
content marketing, this is an important metric to measure and improve.
Source: Hubspot, How to Decrease Your Website’s Bounce Rate, 2014
BRAND AWARENESS BRAND HEALTH CONVERSIONS
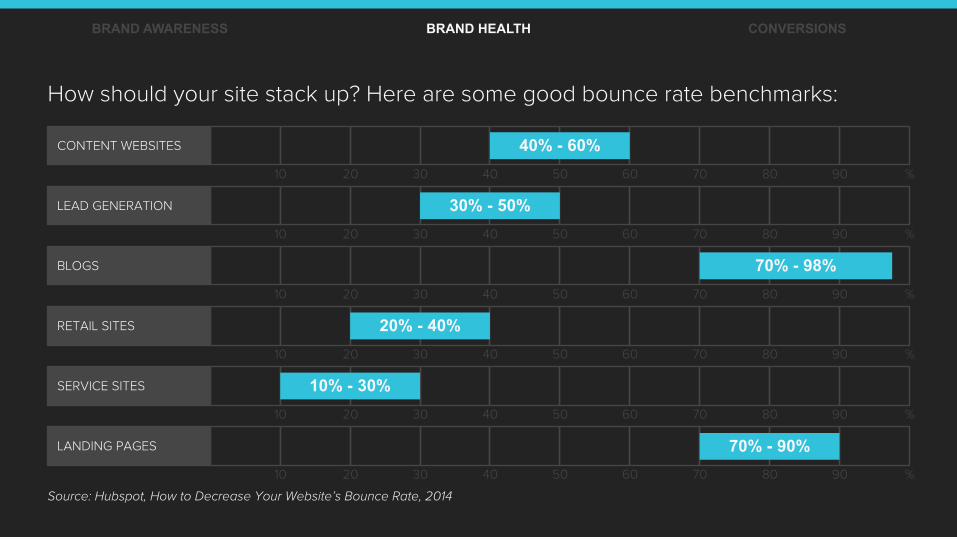
How should your site stack up? Here are some good bounce rate benchmarks:
Source: Hubspot, How to Decrease Your Website’s Bounce Rate, 2014
BRAND AWARENESS BRAND HEALTH CONVERSIONS
CONTENT WEBSITES
10 20 30 40 50 60 70 80 90 %
LEAD GENERATION
10 20 30 40 50 60 70 80 90 %
BLOGS
10 20 30 40 50 60 70 80 90 %
RETAIL SITES
10 20 30 40 50 60 70 80 90 %
SERVICE SITES
10 20 30 40 50 60 70 80 90 %
LANDING PAGES
10 20 30 40 50 60 70 80 90 %
40% - 60%
30% - 50%
20% - 40%
10% - 30%
70% - 90%
70% - 98%
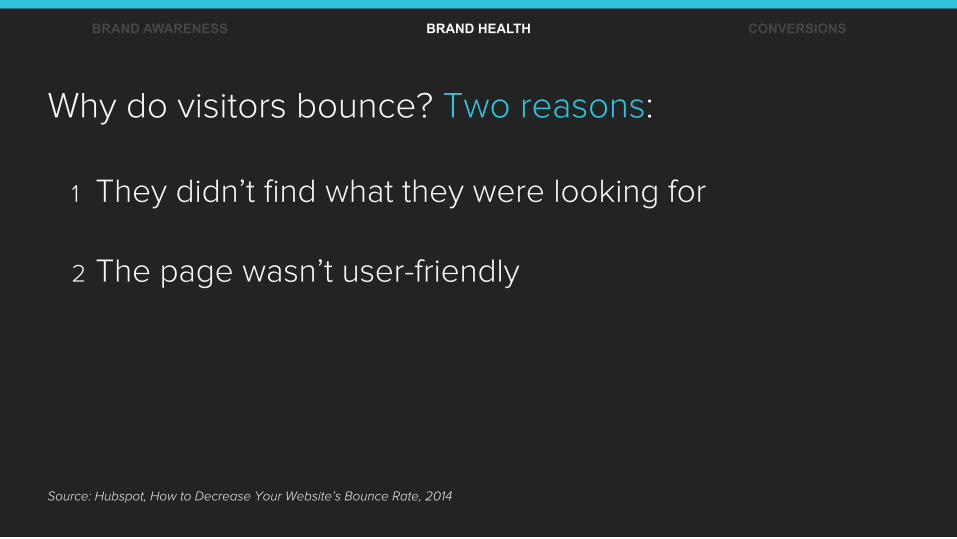
Why do visitors bounce? Two reasons:
1 They didn’t find what they were looking for 2 The page wasn’t user-friendly
BRAND AWARENESS BRAND HEALTH CONVERSIONS
Source: Hubspot, How to Decrease Your Website’s Bounce Rate, 2014
So what can you do to
improve your site’s bounce rate?
BRAND AWARENESS BRAND HEALTH CONVERSIONS
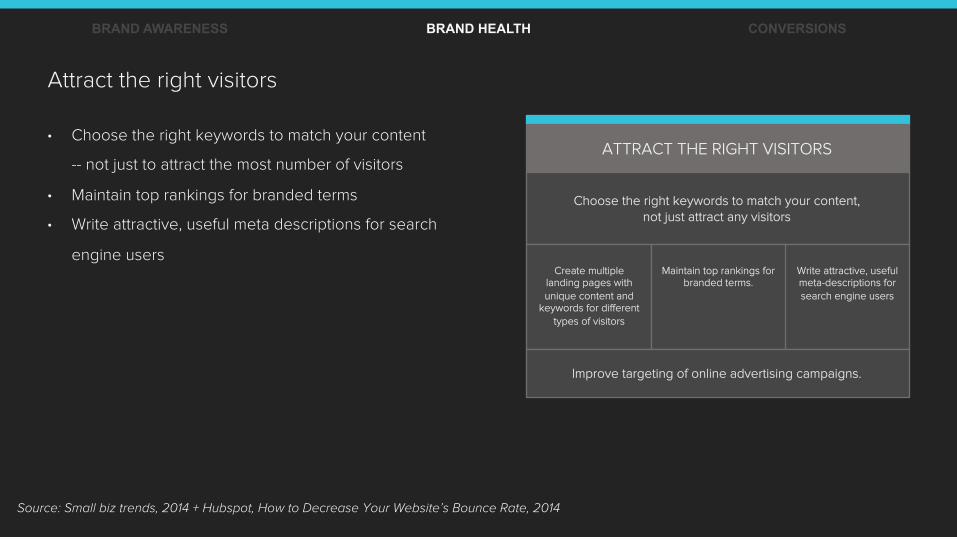
Attract the right visitors
• Choose the right keywords to match your content
-- not just to attract the most number of visitors
• Maintain top rankings for branded terms
• Write attractive, useful meta descriptions for search
engine users
BRAND AWARENESS BRAND HEALTH CONVERSIONS
ATTRACT THE RIGHT VISITORS
Choose the right keywords to match your content, not just attract any visitors
Create multiple landing pages with unique content and
keywords for different types of visitors
Write attractive, useful meta-descriptions for search engine users
Maintain top rankings for branded terms.
Improve targeting of online advertising campaigns.
Source: Small biz trends, 2014 + Hubspot, How to Decrease Your Website’s Bounce Rate, 2014
BRAND AWARENESS BRAND HEALTH CONVERSIONS
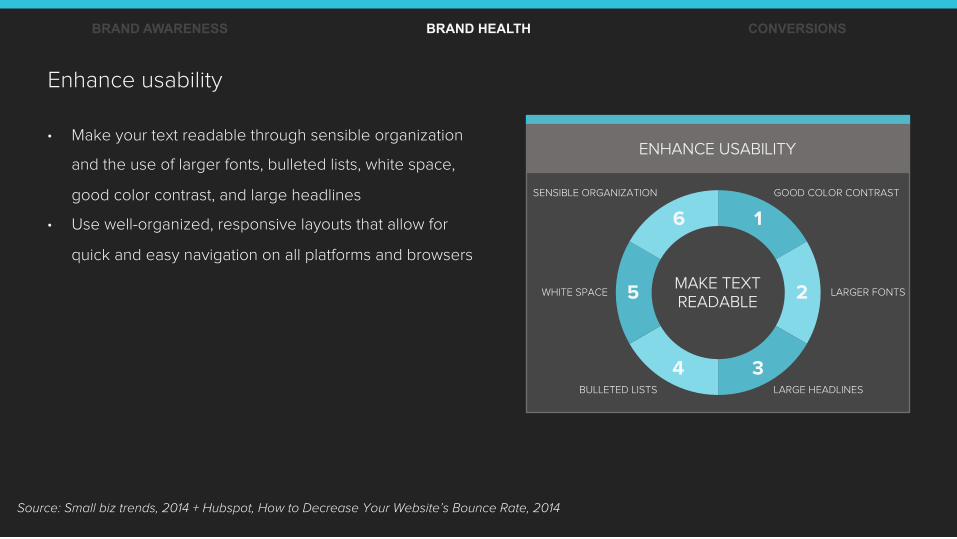
Enhance usability
• Make your text readable through sensible organization
and the use of larger fonts, bulleted lists, white space,
good color contrast, and large headlines
• Use well-organized, responsive layouts that allow for
quick and easy navigation on all platforms and browsers
ENHANCE USABILITY
1 6
3 4
2 5
GOOD COLOR CONTRAST
LARGE HEADLINES
SENSIBLE ORGANIZATION
BULLETED LISTS
LARGER FONTS WHITE SPACE MAKE TEXT READABLE
Source: Small biz trends, 2014 + Hubspot, How to Decrease Your Website’s Bounce Rate, 2014

BRAND AWARENESS BRAND HEALTH CONVERSIONS
Source: Small biz trends, 2014 + Hubspot, How to Decrease Your Website’s Bounce Rate, 2014
Use a good layout
• Quick navigation
• Easy to find search
• Content in sections
• Responsive layout for multiple platforms and browsers
USE GOOD LAYOUT
Responsive layout for multiple platforms and browsers 17.4% of views from mobile devices
EASY TO FIND SEARCH
QUICK NAVIGATION
CONTENT IN SECTIONS
BRAND AWARENESS BRAND HEALTH CONVERSIONS
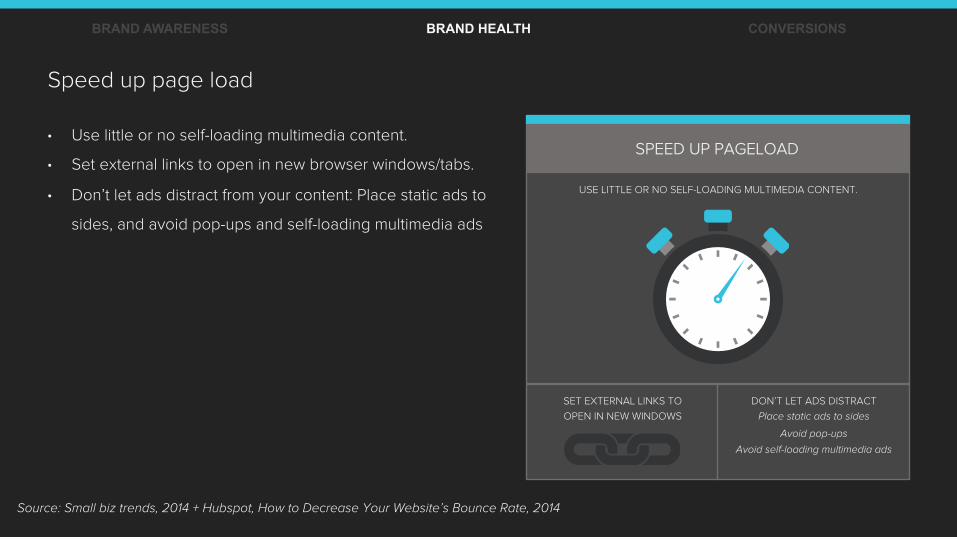
Speed up page load
• Use little or no self-loading multimedia content.
• Set external links to open in new browser windows/tabs.
• Don’t let ads distract from your content: Place static ads to
sides, and avoid pop-ups and self-loading multimedia ads
SPEED UP PAGELOAD
USE LITTLE OR NO SELF-LOADING MULTIMEDIA CONTENT.
SET EXTERNAL LINKS TO
OPEN IN NEW WINDOWS
DON’T LET ADS DISTRACT
Place static ads to sides
Avoid pop-ups
Avoid self-loading multimedia ads
Source: Small biz trends, 2014 + Hubspot, How to Decrease Your Website’s Bounce Rate, 2014
BRAND AWARENESS BRAND HEALTH CONVERSIONS
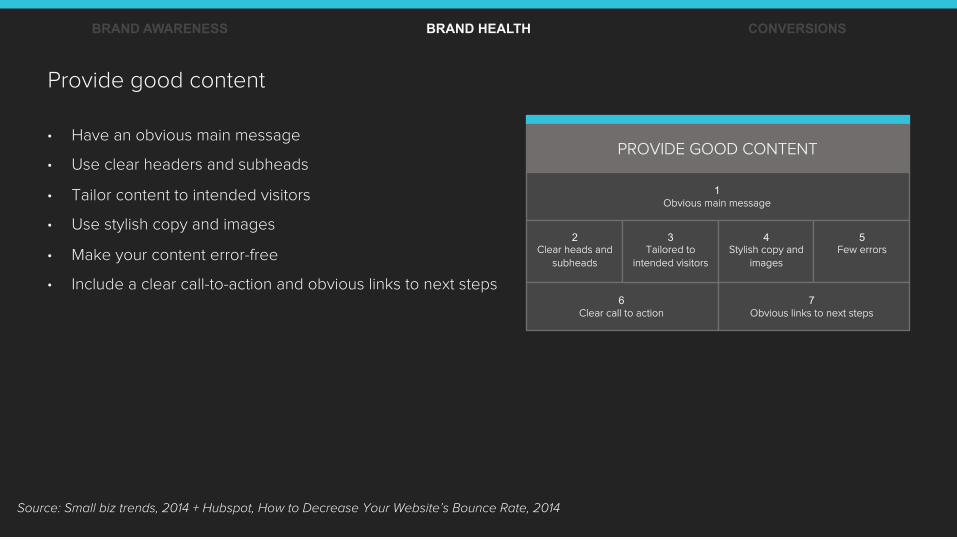
Provide good content
• Have an obvious main message
• Use clear headers and subheads
• Tailor content to intended visitors
• Use stylish copy and images
• Make your content error-free
• Include a clear call-to-action and obvious links to next steps
PROVIDE GOOD CONTENT
1 Obvious main message
2 Clear heads and
subheads
6 Clear call to action
3 Tailored to
intended visitors
4 Stylish copy and
images
5 Few errors
7 Obvious links to next steps
Source: Small biz trends, 2014 + Hubspot, How to Decrease Your Website’s Bounce Rate, 2014
BRAND AWARENESS BRAND HEALTH CONVERSIONS
HOW TO CALCULATE THE VALUE OF:
PAID VS. ORGANIC SEARCH TRAFFIC
Content marketing allows you to gain
additional reach, engagement and conversion
without having to pay for it.
BRAND AWARENESS BRAND HEALTH CONVERSIONS
Content marketing allows you to gain
additional reach, engagement and conversion
without having to pay for it.
You can literally earn your audience’s
attention vs. buying it.
BRAND AWARENESS BRAND HEALTH CONVERSIONS
Organic search traffic can be
calculated easily via Google Analytics.
1 Go to Acquisition
2 Campaigns
3 Organic Keywords
BRAND AWARENESS BRAND HEALTH CONVERSIONS

You will then see the keywords
people have used to find your
website and the number of visits
and percentage of overall visits you
have received from each keyword.
BRAND AWARENESS BRAND HEALTH CONVERSIONS
You will then see the keywords
people have used to find your
website and the number of visits
and percentage of overall visits you
have received from each keyword.
In this example, the site has received
359,953 visits from organic search
traffic, totaling 25% of overall traffic.
BRAND AWARENESS BRAND HEALTH CONVERSIONS

Next we want to see how much paid traffic we’re receiving, which we can also find in Google Analytics’
‘Paid Keywords.’
In this example, let’s say we spend
$100,000 on paid search traffic for 1,078,779 visits.
BRAND AWARENESS BRAND HEALTH CONVERSIONS

Based on those numbers and percentages, we can calculate the value of that organic traffic.
In this example, let’s say we spend $100,000 on paid search traffic.
1,078,779 359,593
$100,000 X
CROSS MULTIPLY & DIVIDE TO FIND “X”
BRAND AWARENESS BRAND HEALTH CONVERSIONS
Based on those numbers and percentages, we can calculate the value of that organic traffic.
In this example, let’s say we spend $100,000 on paid search traffic.
1,078,779 359,593
$100,000 X
CROSS MULTIPLY & DIVIDE TO FIND “X”
ALGEBRA DOES COME IN HANDY!
BRAND AWARENESS BRAND HEALTH CONVERSIONS
Based on those numbers and percentages, we can calculate the value of that organic traffic.
In this example, let’s say we spend $100,000 on paid search traffic.
1,078,779 359,593
$100,000 X
CROSS MULTIPLY & DIVIDE TO FIND “X”
ALGEBRA DOES COME IN HANDY!
PAID ORGANIC
TRAFFIC PERCENTAGE 75% 25%
TOTAL TRAFFIC 1,078,779 359,593
COST/VALUE $100,000 $33,333
ORGANIC SEARCH TRAFFIC IS WORTH $33,333
BRAND AWARENESS BRAND HEALTH CONVERSIONS
BRAND AWARENESS BRAND HEALTH CONVERSIONS
HOW TO CALCULATE THE VALUE OF:
SOCIAL SHARES + FOLLOWERS
While social shares can be seen as an
engagement metric, but should be quantified
as a free source of distribution and reach.
BRAND AWARENESS BRAND HEALTH CONVERSIONS
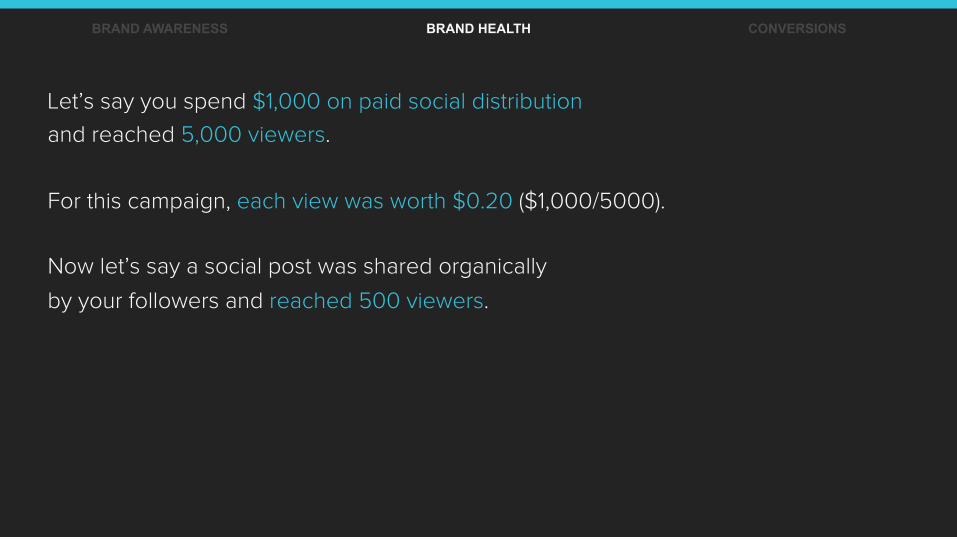
Let’s say you spend $1,000 on paid social distribution
and reached 5,000 viewers.
BRAND AWARENESS BRAND HEALTH CONVERSIONS
BRAND AWARENESS BRAND HEALTH CONVERSIONS
Let’s say you spend $1,000 on paid social distribution
and reached 5,000 viewers.
For this campaign, each view was worth $0.20 ($1,000/5000).
BRAND AWARENESS BRAND HEALTH CONVERSIONS
Let’s say you spend $1,000 on paid social distribution
and reached 5,000 viewers.
For this campaign, each view was worth $0.20 ($1,000/5000).
Now let’s say a social post was shared organically
by your followers and reached 500 viewers.
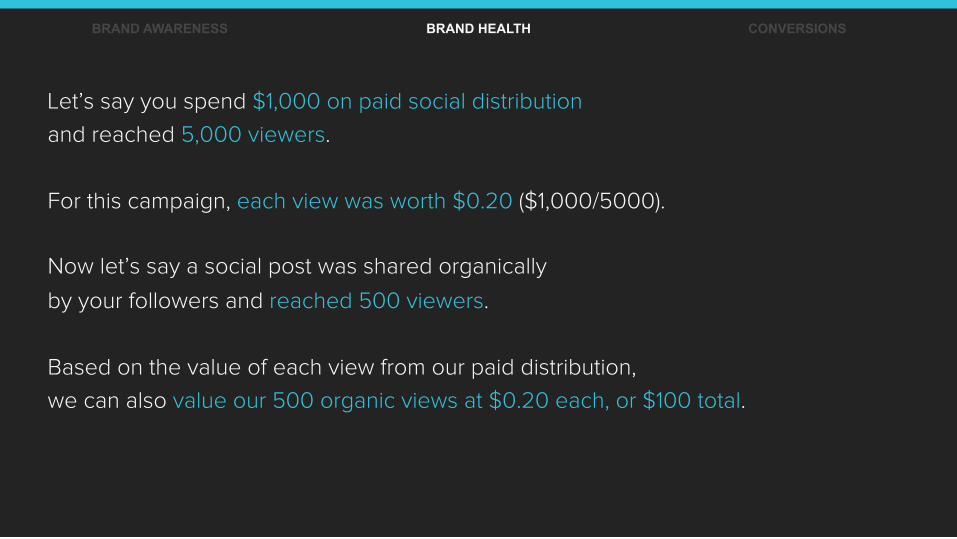
Let’s say you spend $1,000 on paid social distribution
and reached 5,000 viewers.
For this campaign, each view was worth $0.20 ($1,000/5000).
Now let’s say a social post was shared organically
by your followers and reached 500 viewers.
Based on the value of each view from our paid distribution,
we can also value our 500 organic views at $0.20 each, or $100 total.
BRAND AWARENESS BRAND HEALTH CONVERSIONS
Brands should also track if their social follower growth positively correlates with their total
number of shares.
If it does, this would indicate that your organic social shares are reaching the right audience
for your brand.
BRAND AWARENESS BRAND HEALTH CONVERSIONS

BRAND AWARENESS BRAND HEALTH CONVERSIONS
HOW TO CALCUALTE THE VALUE OF:
SHARE OF VOICE/OFFSITE SEO

Google has stated that it uses more than
200 factors to rank a web page, but which are
the most important?
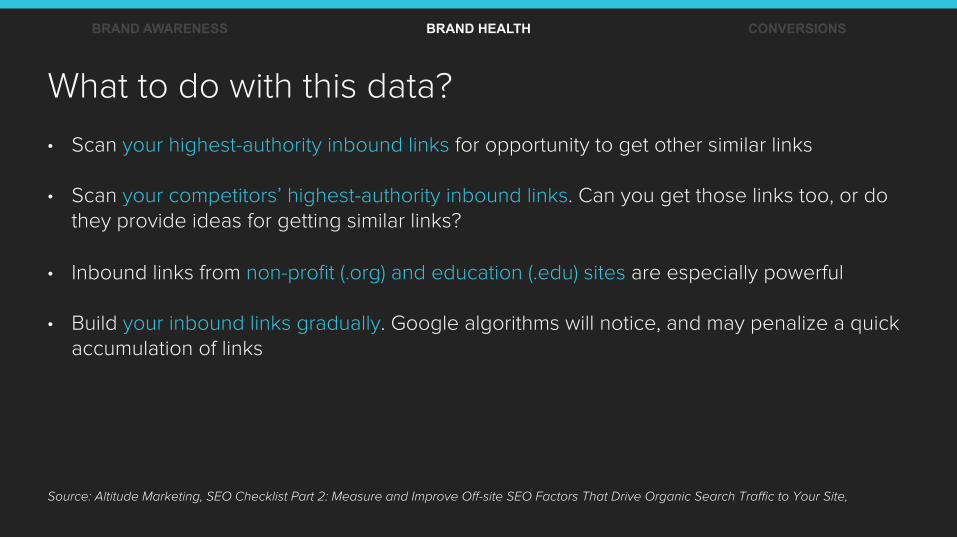
Source: Altitude Marketing, SEO Checklist Part 2: Measure and Improve Off-site SEO Factors That Drive Organic Search Traffic to Your Site,
BRAND AWARENESS BRAND HEALTH CONVERSIONS
There is one thing virtually all SEO experts agree
upon: The number and quality of links coming into
your site is near the top of the list.
BRAND AWARENESS BRAND HEALTH CONVERSIONS
Source: Altitude Marketing, SEO Checklist Part 2: Measure and Improve Off-site SEO Factors That Drive Organic Search Traffic to Your Site,
So how can you measure your off-site SEO?
BRAND AWARENESS BRAND HEALTH CONVERSIONS
Source: Altitude Marketing, SEO Checklist Part 2: Measure and Improve Off-site SEO Factors That Drive Organic Search Traffic to Your Site,
So how can you measure your off-site SEO?
• Measure your inbound links and their value. An easy way to do this is by plugging your site URL into Open Site Explorer. (https://moz.com/researchtools/ose/)
• With this tool, you can see all inbound links, see your top-linked pages, sort by linking domains, see the anchor text other sites use to link to you.
• Do the same with your competitors’ sites and compare
BRAND AWARENESS BRAND HEALTH CONVERSIONS
Source: Altitude Marketing, SEO Checklist Part 2: Measure and Improve Off-site SEO Factors That Drive Organic Search Traffic to Your Site,
BRAND AWARENESS BRAND HEALTH CONVERSIONS
Source: Altitude Marketing, SEO Checklist Part 2: Measure and Improve Off-site SEO Factors That Drive Organic Search Traffic to Your Site,
What to do with this data?
BRAND AWARENESS BRAND HEALTH CONVERSIONS
Source: Altitude Marketing, SEO Checklist Part 2: Measure and Improve Off-site SEO Factors That Drive Organic Search Traffic to Your Site,
What to do with this data?
• Scan your highest-authority inbound links for opportunity to get other similar links
BRAND AWARENESS BRAND HEALTH CONVERSIONS
Source: Altitude Marketing, SEO Checklist Part 2: Measure and Improve Off-site SEO Factors That Drive Organic Search Traffic to Your Site,
What to do with this data?
• Scan your highest-authority inbound links for opportunity to get other similar links
• Scan your competitors’ highest-authority inbound links. Can you get those links too, or do they provide ideas for getting similar links?
• Inbound links from non-profit (.org) and education (.edu) sites are especially powerful
• Build your inbound links gradually. Google algorithms will notice, and may penalize a quick accumulation of links
BRAND AWARENESS BRAND HEALTH CONVERSIONS
CONVERSIONS YOU NEVER WOULD HAVE REACHED
BUSINESS CASE
3
These are prospects who became customers
because of either helpful, useful and/or
entertaining content you provided them.
BRAND AWARENESS BRAND HEALTH CONVERSIONS
BRAND AWARENESS BRAND HEALTH CONVERSIONS
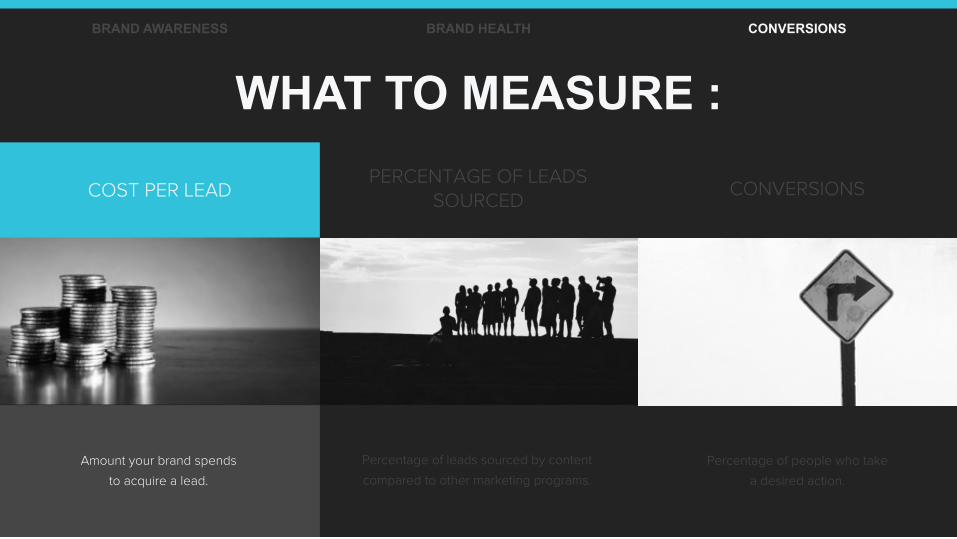
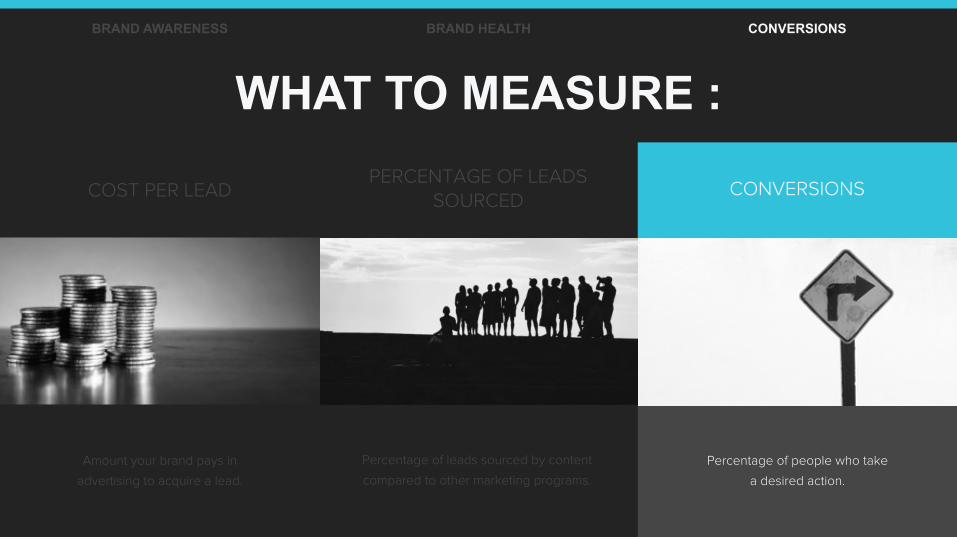
Percentage of people who take
a desired action.
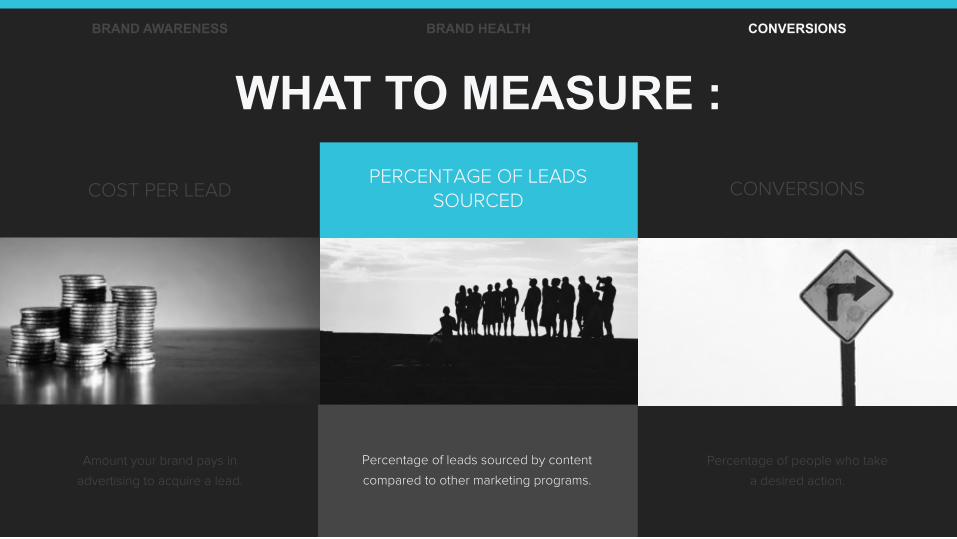
WHAT TO MEASURE :
COST PER LEAD PERCENTAGE OF LEADS
SOURCED CONVERSIONS
Amount your brand spends
to acquire a lead.
Percentage of leads sourced by content
compared to other marketing programs.
BRAND AWARENESS BRAND HEALTH CONVERSIONS
Percentage of people who take
a desired action.
WHAT TO MEASURE :
COST PER LEAD PERCENTAGE OF LEADS
SOURCED CONVERSIONS
Amount your brand pays in
advertising to acquire a lead.
Percentage of leads sourced by content
compared to other marketing programs.
BRAND AWARENESS BRAND HEALTH CONVERSIONS
Percentage of people who take
a desired action.
WHAT TO MEASURE :
COST PER LEAD PERCENTAGE OF LEADS
SOURCED CONVERSIONS
Amount your brand pays in
advertising to acquire a lead.
Percentage of leads sourced by content
compared to other marketing programs.
BRAND AWARENESS BRAND HEALTH CONVERSIONS
HOW TO CALCULATE THE VALUE OF:
COST PER LEAD
Calculating content marketing’s cost
per lead is crucial in order to benchmark your
program’s effectiveness against
other marketing programs.
BRAND AWARENESS BRAND HEALTH CONVERSIONS
Determining this is quite simple. To begin,
we need to know the costs accrued to create
and distribute the content.
BRAND AWARENESS BRAND HEALTH CONVERSIONS
CONTENT ACTIVITY COST
ROI Guide Creation $3,000
ROI Guide Sponsored Email $10,000
Strategy Guide Creation $3,000
Strategy Guide Sponsored Webinar $20,000
BRAND AWARENESS BRAND HEALTH CONVERSIONS
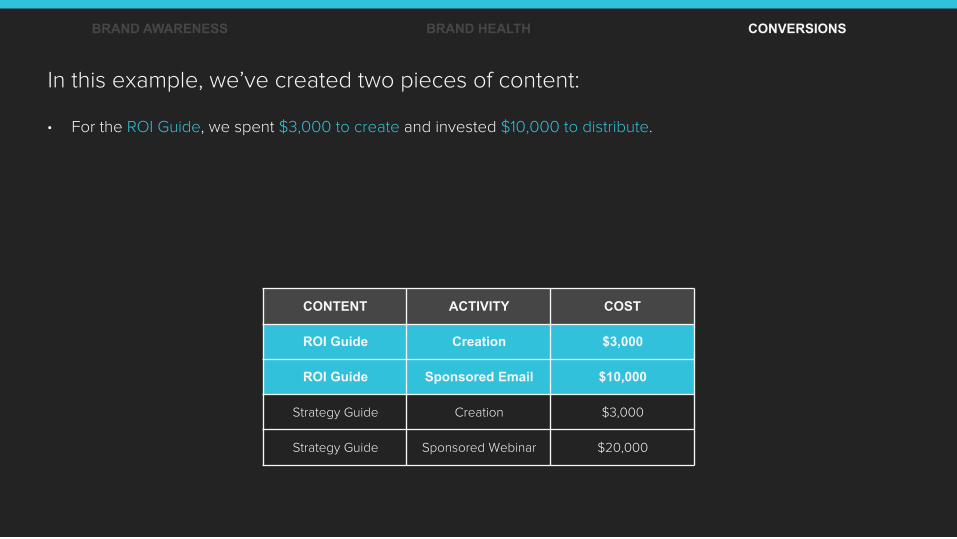
In this example, we’ve created two pieces of content:
• For the ROI Guide, we spent $3,000 to create and invested $10,000 to distribute.

CONTENT ACTIVITY COST
ROI Guide Creation $3,000
ROI Guide Sponsored Email $10,000
Strategy Guide Creation $3,000
Strategy Guide Sponsored Webinar $20,000
BRAND AWARENESS BRAND HEALTH CONVERSIONS
In this example, we’ve created two pieces of content:
• For the ROI Guide, we spent $3,000 to create and invested $10,000 to distribute.
• For the Strategy Guide we also spent $3,000 to create, but spent $20,000 to distribute.
• Combining these costs, we can see that the ROI Guide cost us $13,000 and the Strategy Guide cost us $23,000.
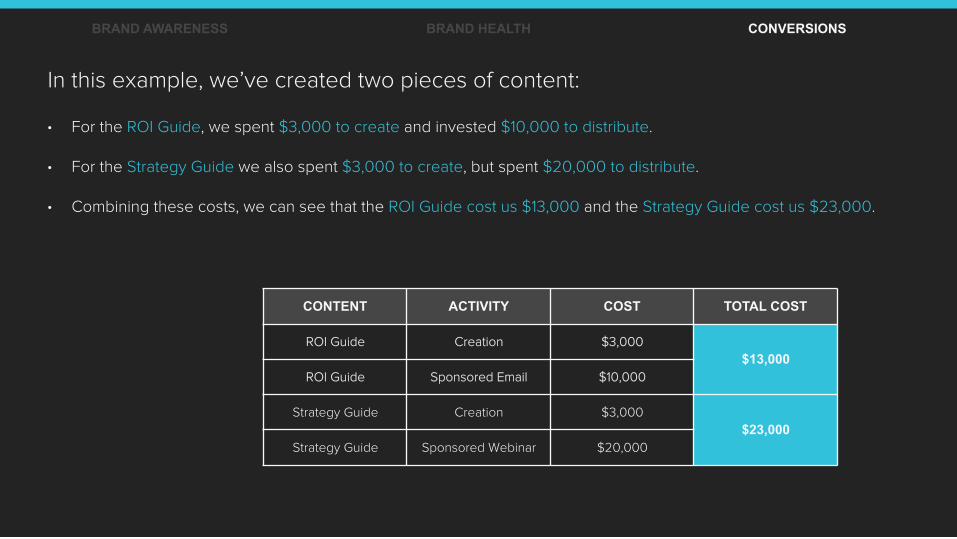
CONTENT ACTIVITY COST TOTAL COST
ROI Guide Creation $3,000 $13,000
ROI Guide Sponsored Email $10,000
Strategy Guide Creation $3,000 $23,000
Strategy Guide Sponsored Webinar $20,000
BRAND AWARENESS BRAND HEALTH CONVERSIONS
In this example, we’ve created two pieces of content:
• For the ROI Guide, we spent $3,000 to create and invested $10,000 to distribute.
• For the Strategy Guide we also spent $3,000 to create, but spent $20,000 to distribute.
• Combining these costs, we can see that the ROI Guide cost us $13,000 and the Strategy Guide cost us $23,000.

BRAND AWARENESS BRAND HEALTH CONVERSIONS
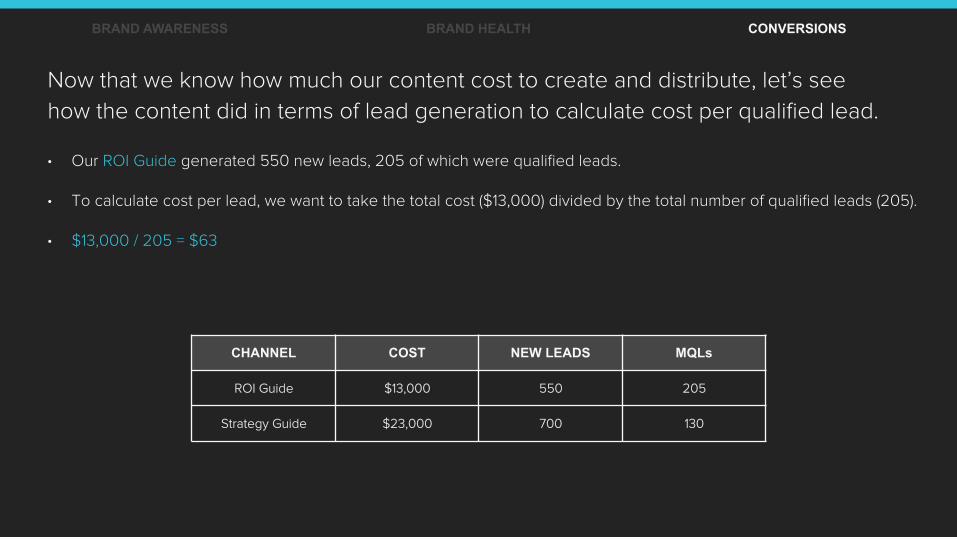
Now that we know how much our content cost to create and distribute, let’s see
how the content did in terms of lead generation to calculate cost per qualified lead.

BRAND AWARENESS BRAND HEALTH CONVERSIONS
CHANNEL COST NEW LEADS MQLs
ROI Guide $13,000 550 205
Strategy Guide $23,000 700 130
Now that we know how much our content cost to create and distribute, let’s see
how the content did in terms of lead generation to calculate cost per qualified lead.
• Our ROI Guide generated 550 new leads, 205 of which were qualified leads.
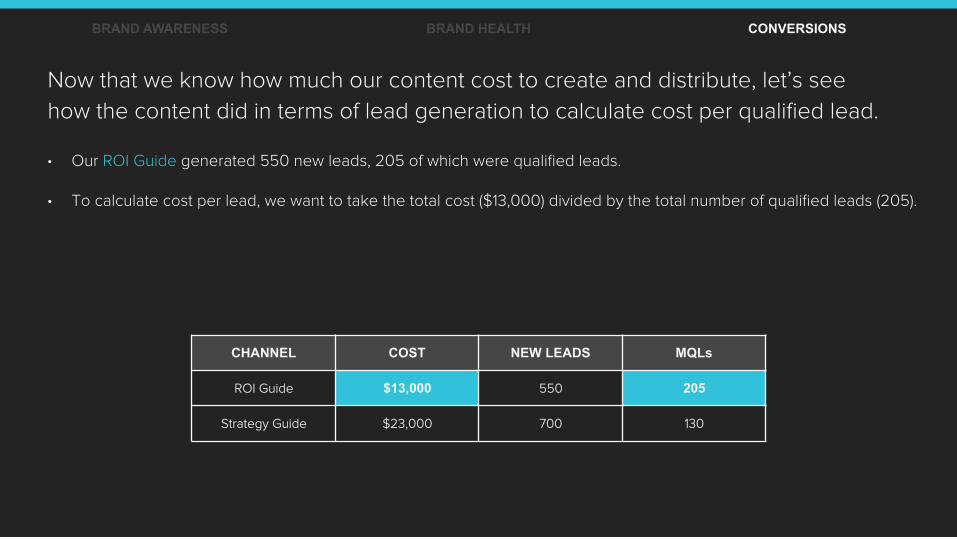
• To calculate cost per lead, we want to take the total cost ($13,000) divided by the total number of qualified leads (205).
BRAND AWARENESS BRAND HEALTH CONVERSIONS
CHANNEL COST NEW LEADS MQLs
ROI Guide $13,000 550 205
Strategy Guide $23,000 700 130
Now that we know how much our content cost to create and distribute, let’s see
how the content did in terms of lead generation to calculate cost per qualified lead.
• Our ROI Guide generated 550 new leads, 205 of which were qualified leads.
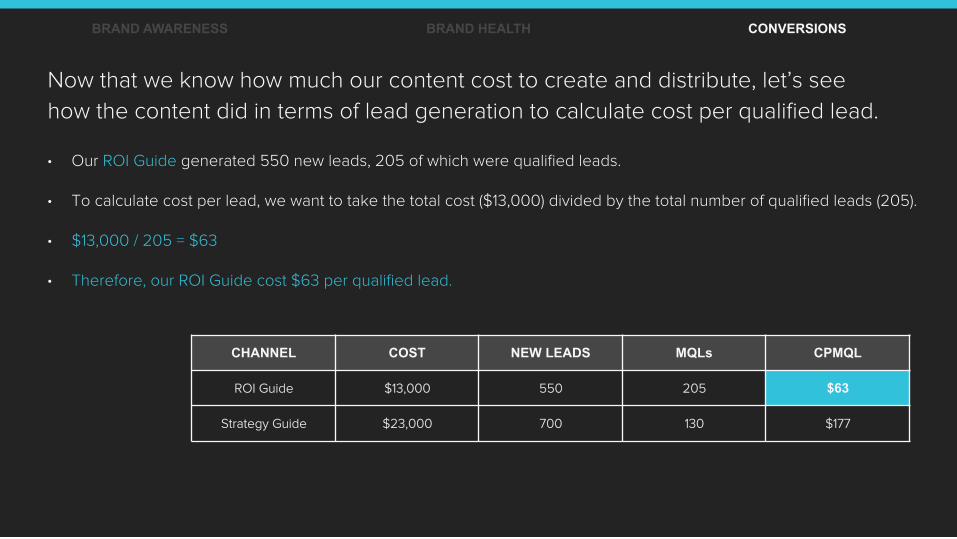
• To calculate cost per lead, we want to take the total cost ($13,000) divided by the total number of qualified leads (205). • $13,000 / 205 = $63
BRAND AWARENESS BRAND HEALTH CONVERSIONS
CHANNEL COST NEW LEADS MQLs CPMQL
ROI Guide $13,000 550 205 $63
Strategy Guide $23,000 700 130 $177
Now that we know how much our content cost to create and distribute, let’s see
how the content did in terms of lead generation to calculate cost per qualified lead.
• Our ROI Guide generated 550 new leads, 205 of which were qualified leads.
• To calculate cost per lead, we want to take the total cost ($13,000) divided by the total number of qualified leads (205). • $13,000 / 205 = $63
• Therefore, our ROI Guide cost $63 per qualified lead.
BRAND AWARENESS BRAND HEALTH CONVERSIONS
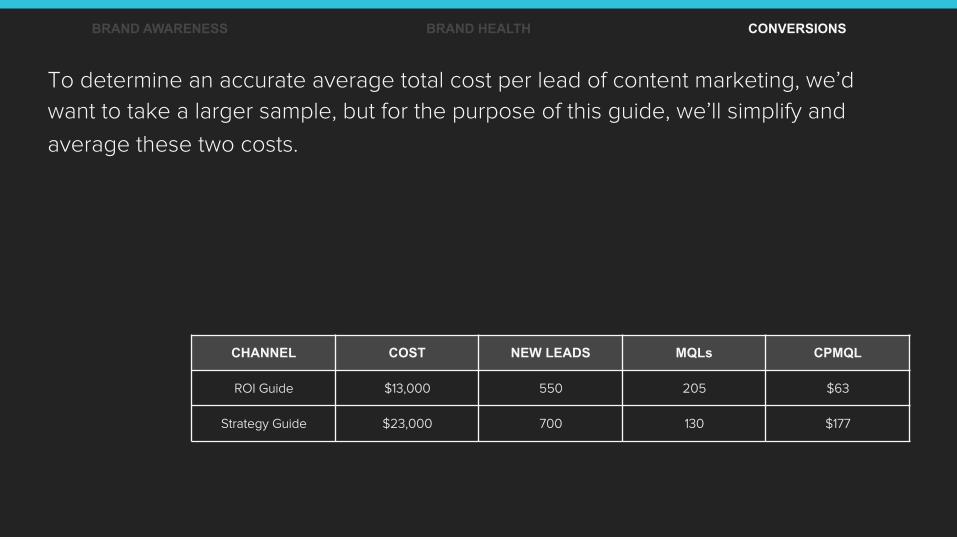
CHANNEL COST NEW LEADS MQLs CPMQL
ROI Guide $13,000 550 205 $63
Strategy Guide $23,000 700 130 $177
To determine an accurate average total cost per lead of content marketing, we’d
want to take a larger sample, but for the purpose of this guide, we’ll simplify and
average these two costs.
BRAND AWARENESS BRAND HEALTH CONVERSIONS
CHANNEL COST NEW LEADS MQLs CPMQL
ROI Guide $13,000 550 205 $63
Strategy Guide $23,000 700 130 $177
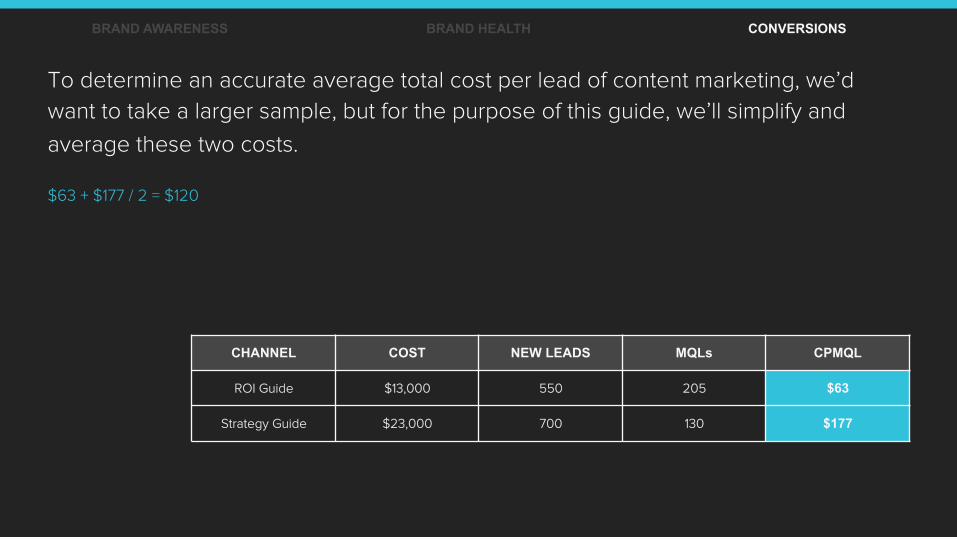
To determine an accurate average total cost per lead of content marketing, we’d
want to take a larger sample, but for the purpose of this guide, we’ll simplify and
average these two costs.
$63 + $177 / 2 = $120

BRAND AWARENESS BRAND HEALTH CONVERSIONS
CHANNEL COST NEW LEADS MQLs CPMQL
ROI Guide $13,000 550 205 $63
Strategy Guide $23,000 700 130 $177
To determine an accurate average total cost per lead of content marketing, we’d
want to take a larger sample, but for the purpose of this guide, we’ll simplify and
average these two costs.
$63 + $177 / 2 = $120
Therefore our average total cost per lead for content marketing is $120.
BRAND AWARENESS BRAND HEALTH CONVERSIONS
HOW TO CALCULATE THE VALUE OF:
PERCENTAGE OF LEADS SOURCED
In order to determine the
percentage of leads from content marketing,
we first need to gather total number of leads
sourced from other marketing programs.
BRAND AWARENESS BRAND HEALTH CONVERSIONS
BRAND AWARENESS BRAND HEALTH CONVERSIONS
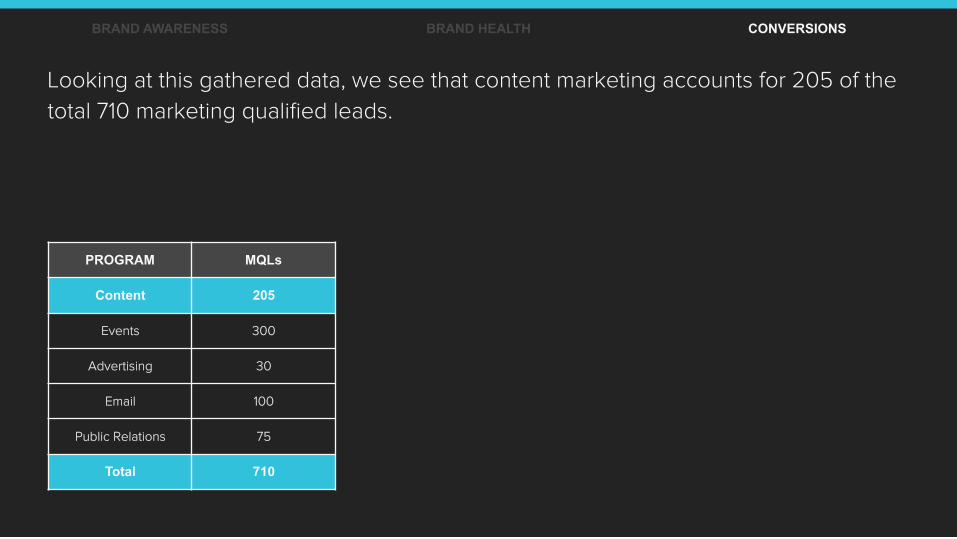
Looking at this gathered data, we see that content marketing accounts for 205 of the
total 710 marketing qualified leads.
PROGRAM MQLs
Content 205
Events 300
Advertising 30
Email 100
Public Relations 75
Total 710
BRAND AWARENESS BRAND HEALTH CONVERSIONS
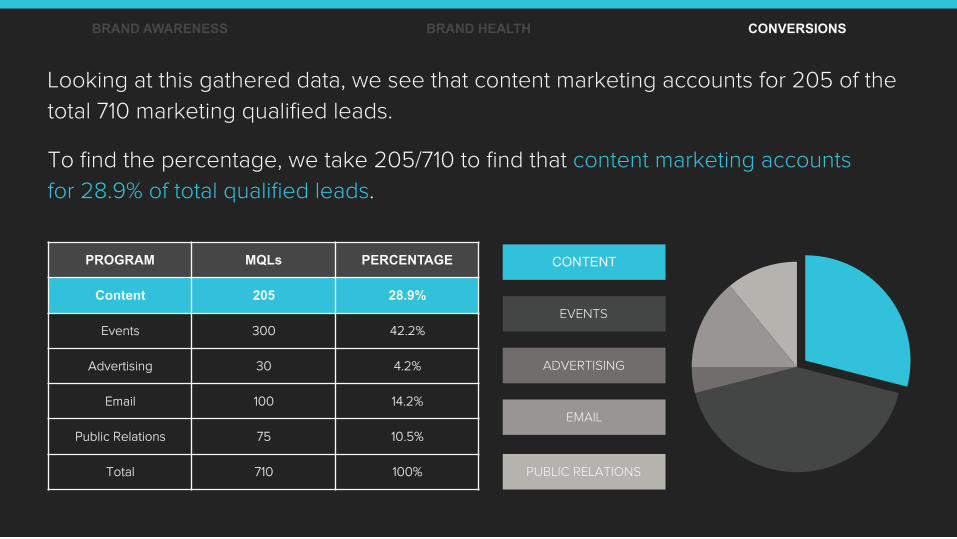
Looking at this gathered data, we see that content marketing accounts for 205 of the
total 710 marketing qualified leads. To find the percentage, we take 205/710 to find that content marketing accounts
for 28.9% of total qualified leads.
PROGRAM MQLs PERCENTAGE
Content 205 28.9%
Events 300 42.2%
Advertising 30 4.2%
Email 100 14.2%
Public Relations 75 10.5%
Total 710 100%
EVENTS
ADVERTISING
CONTENT
PUBLIC RELATIONS
BRAND AWARENESS BRAND HEALTH CONVERSIONS
HOW TO CALCULATE THE VALUE OF:
CONVERSIONS

Finally, to determine the actual revenue
sourced by content marketing, we need
to look at conversions.
BRAND AWARENESS BRAND HEALTH CONVERSIONS
BRAND AWARENESS BRAND HEALTH CONVERSIONS
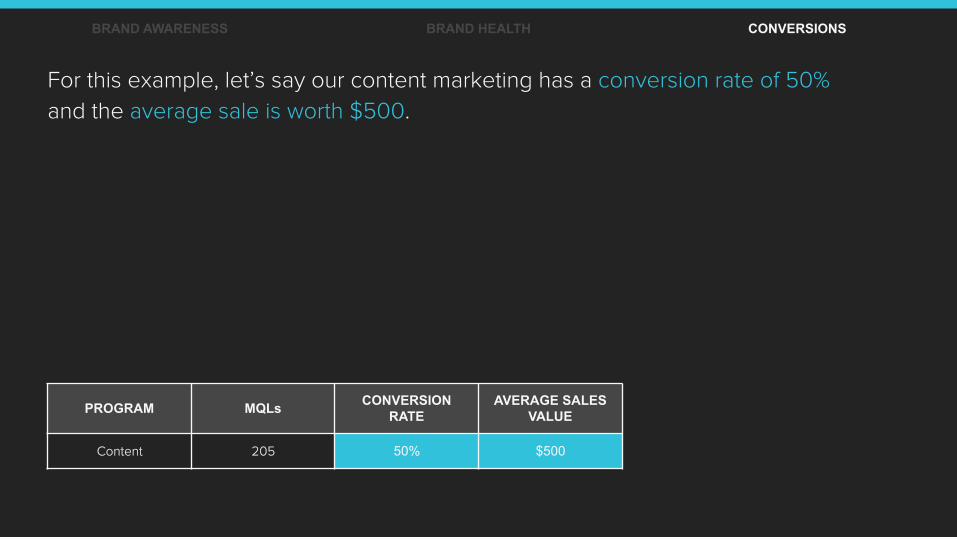
PROGRAM MQLs CONVERSION RATE
AVERAGE SALES VALUE
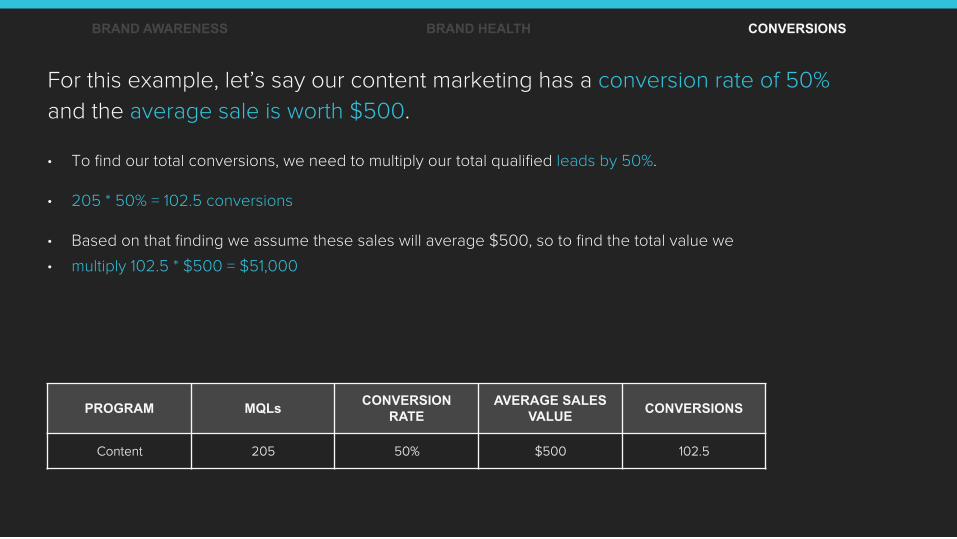
Content 205 50% $500
For this example, let’s say our content marketing has a conversion rate of 50%
and the average sale is worth $500.
BRAND AWARENESS BRAND HEALTH CONVERSIONS
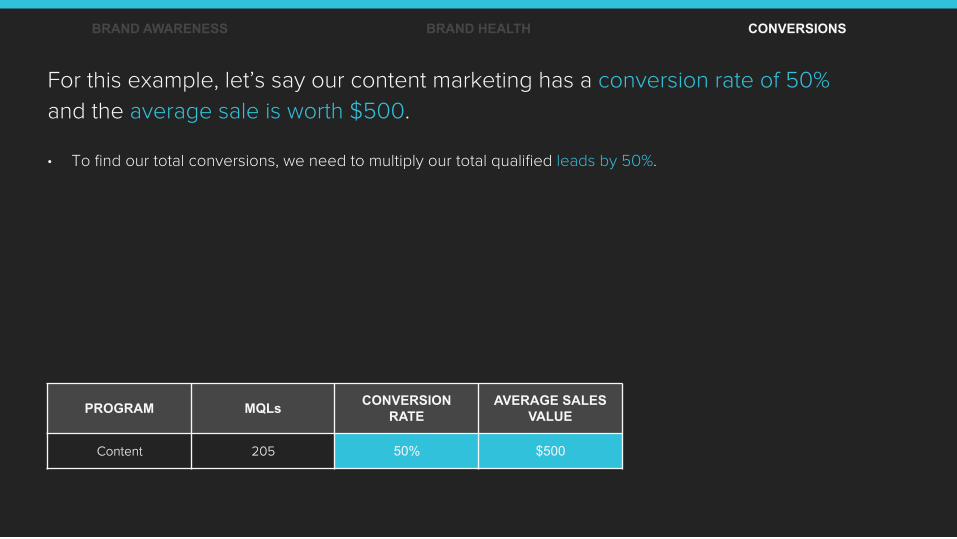
PROGRAM MQLs CONVERSION RATE
AVERAGE SALES VALUE
Content 205 50% $500
For this example, let’s say our content marketing has a conversion rate of 50%
and the average sale is worth $500.
• To find our total conversions, we need to multiply our total qualified leads by 50%.
BRAND AWARENESS BRAND HEALTH CONVERSIONS
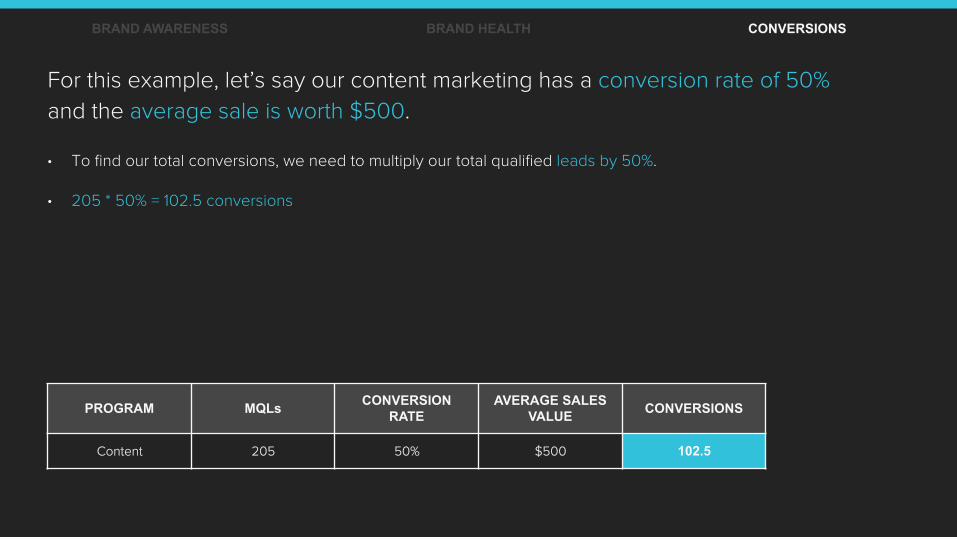
PROGRAM MQLs CONVERSION RATE
AVERAGE SALES VALUE CONVERSIONS
Content 205 50% $500 102.5
For this example, let’s say our content marketing has a conversion rate of 50%
and the average sale is worth $500.
• To find our total conversions, we need to multiply our total qualified leads by 50%.
• 205 * 50% = 102.5 conversions
BRAND AWARENESS BRAND HEALTH CONVERSIONS
PROGRAM MQLs CONVERSION RATE
AVERAGE SALES VALUE CONVERSIONS
Content 205 50% $500 102.5
For this example, let’s say our content marketing has a conversion rate of 50%
and the average sale is worth $500.
• To find our total conversions, we need to multiply our total qualified leads by 50%.
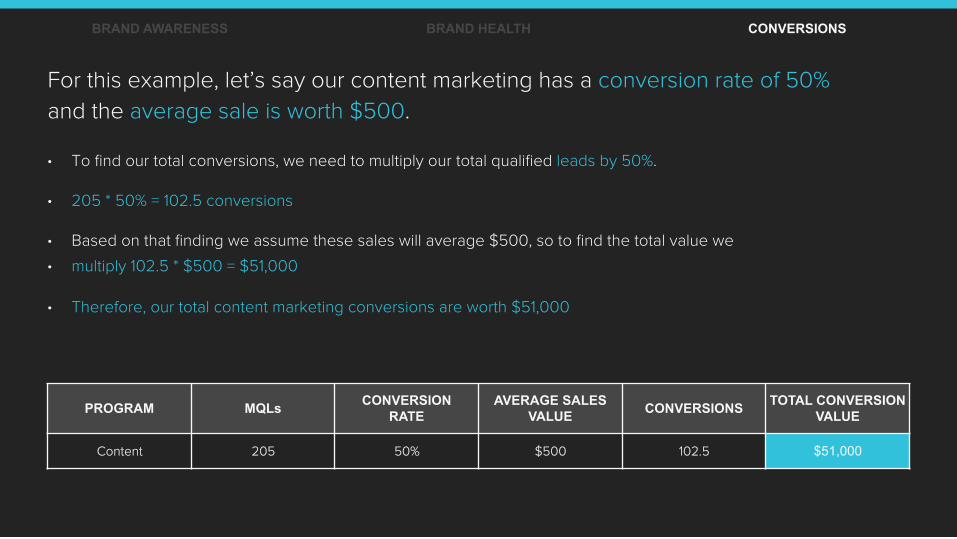
• 205 * 50% = 102.5 conversions • Based on that finding we assume these sales will average $500, so to find the total value we
• multiply 102.5 * $500 = $51,000
BRAND AWARENESS BRAND HEALTH CONVERSIONS
PROGRAM MQLs CONVERSION RATE
AVERAGE SALES VALUE CONVERSIONS TOTAL CONVERSION
VALUE
Content 205 50% $500 102.5 $51,000
For this example, let’s say our content marketing has a conversion rate of 50%
and the average sale is worth $500.
• To find our total conversions, we need to multiply our total qualified leads by 50%.
• 205 * 50% = 102.5 conversions • Based on that finding we assume these sales will average $500, so to find the total value we
• multiply 102.5 * $500 = $51,000
• Therefore, our total content marketing conversions are worth $51,000
WANT TO LEARN MORE?
Our team of strategists can help your brand build a marketing growth engine. From ongoing support and
program management, to customized strategy sessions and workshops, we’ll set your brand up for success.
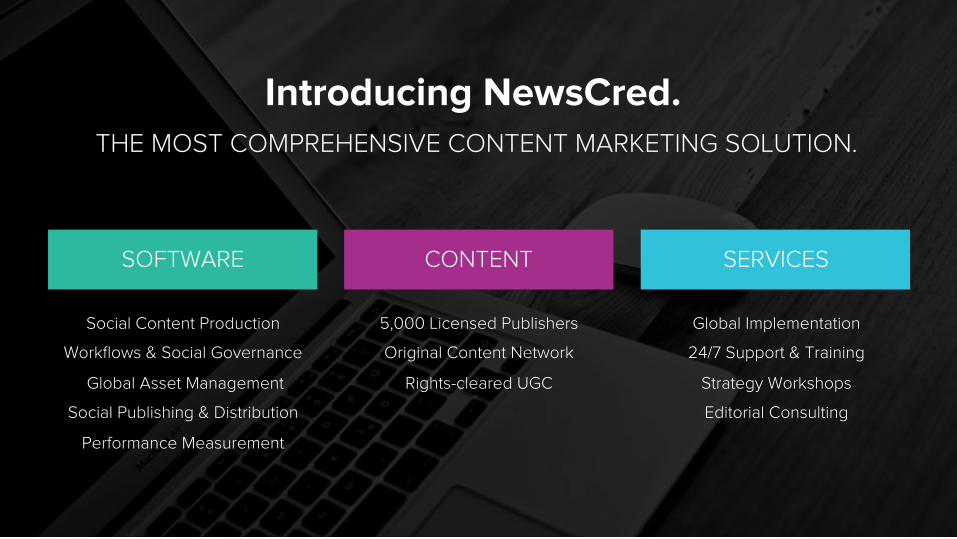
Introducing NewsCred. THE MOST COMPREHENSIVE CONTENT MARKETING SOLUTION.
SOFTWARE SERVICES CONTENT
Social Content Production
Workflows & Social Governance
Global Asset Management
Social Publishing & Distribution
Performance Measurement
Global Implementation
24/7 Support & Training
Strategy Workshops
Editorial Consulting
5,000 Licensed Publishers
Original Content Network
Rights-cleared UGC

Get in touch! [email protected]