Embed Size (px)
DESCRIPTION
Mobile Forum Mexico. Nov 2014
Citation preview
#AdReaction
Connecting with
Mexican
Consumers in 2014James Galpin,
Head of Media & Digital, LATAM
AdReaction 2014
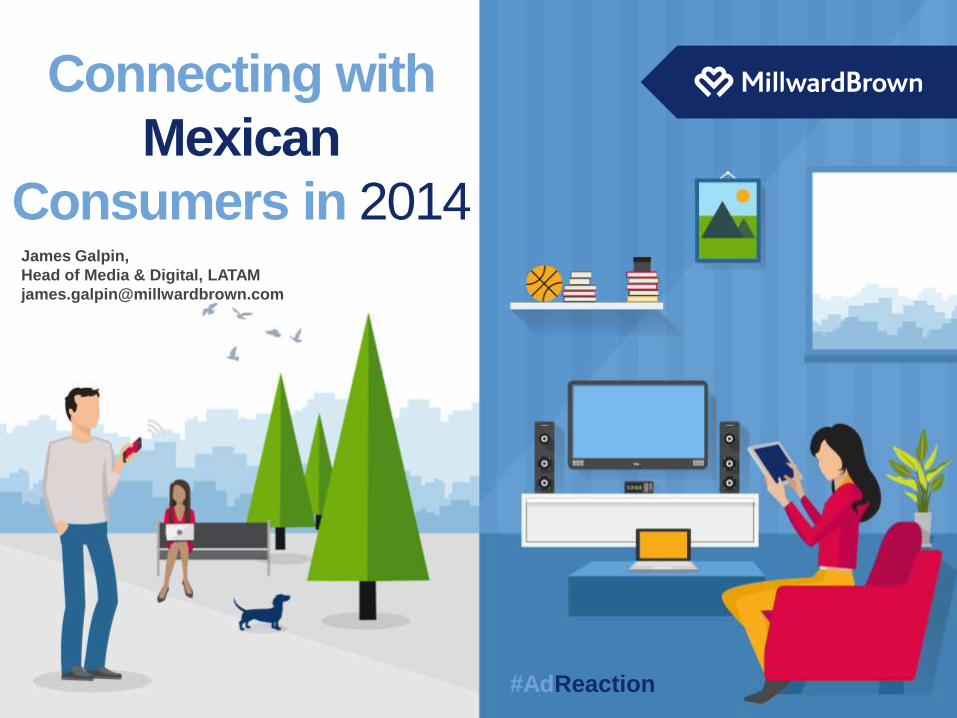
ALREADY ALMOST 50% OF MEXICAN 16-45 YEAR OLDS USE SMARTPHONES
2
62
65
65
68
72
75
76
81
81
85
Italia
Francia
Alemania
China
USA
Canadá
ArabiaSaudita
España
Australia
UK
15
17
18
25
33
40
42
44
47
47
48
53
India
Perú
Indonesia
Vietnam
Brasil
Turquía
Japón
Argentina
Sudáfrica
Tailandia
México
Rusia
Smartphone penetration
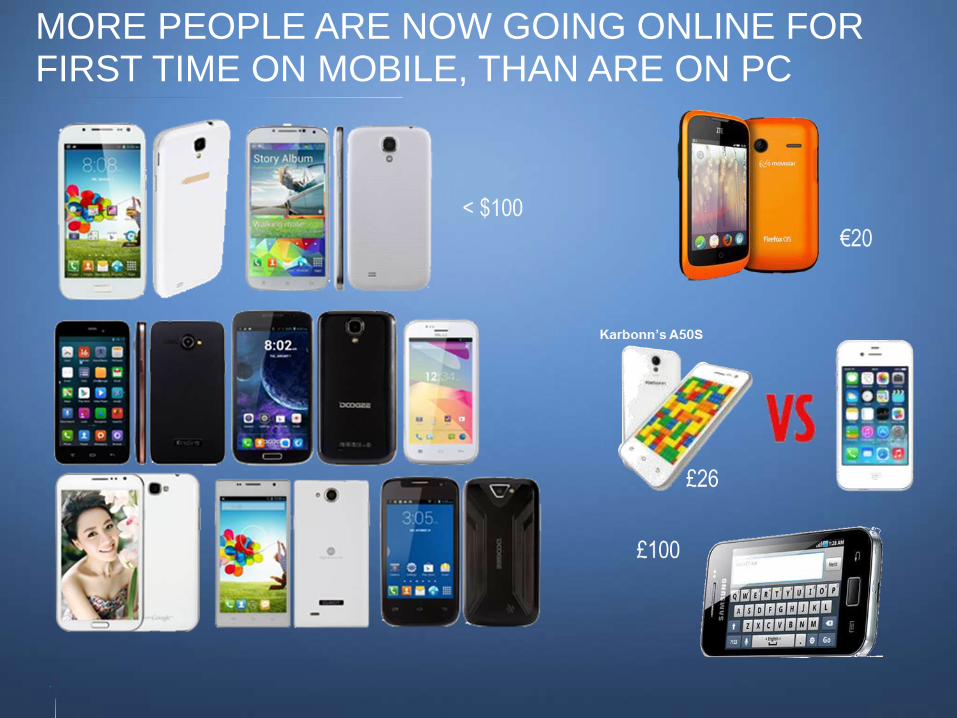
MORE PEOPLE ARE NOW GOING ONLINE FOR FIRST TIME ON MOBILE, THAN ARE ON PC
The Mexican consumer is
moving to smartphone
connectivity very fast
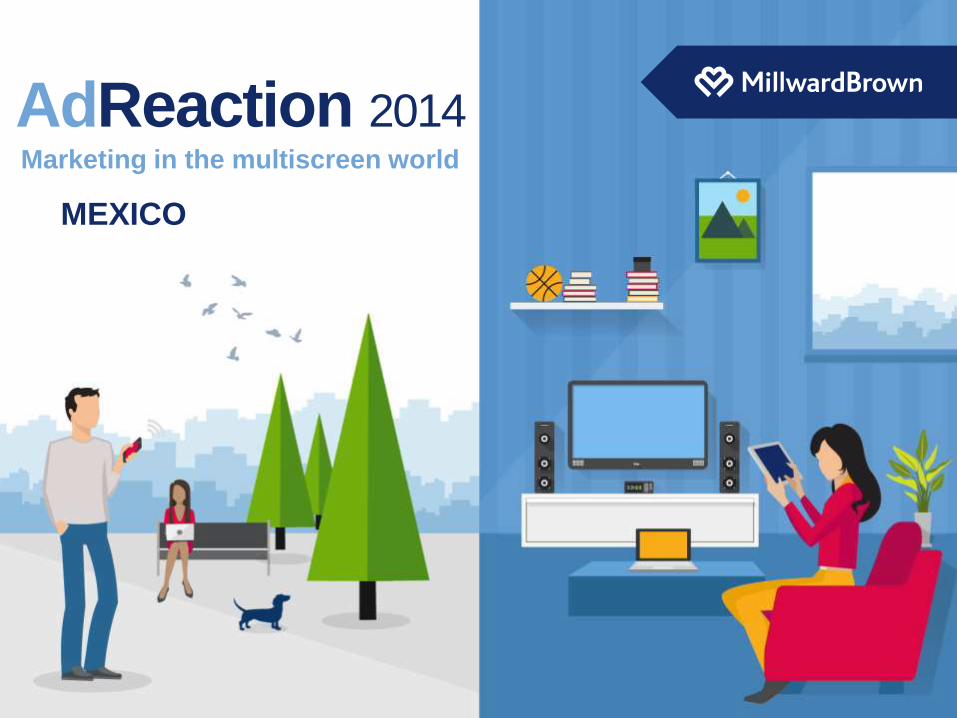
Marketing in the multiscreen world
AdReaction 2014
MEXICO
HOW MUCH & WHEN ARE SCREENS USED IN MEXICO?
AdReaction 2014
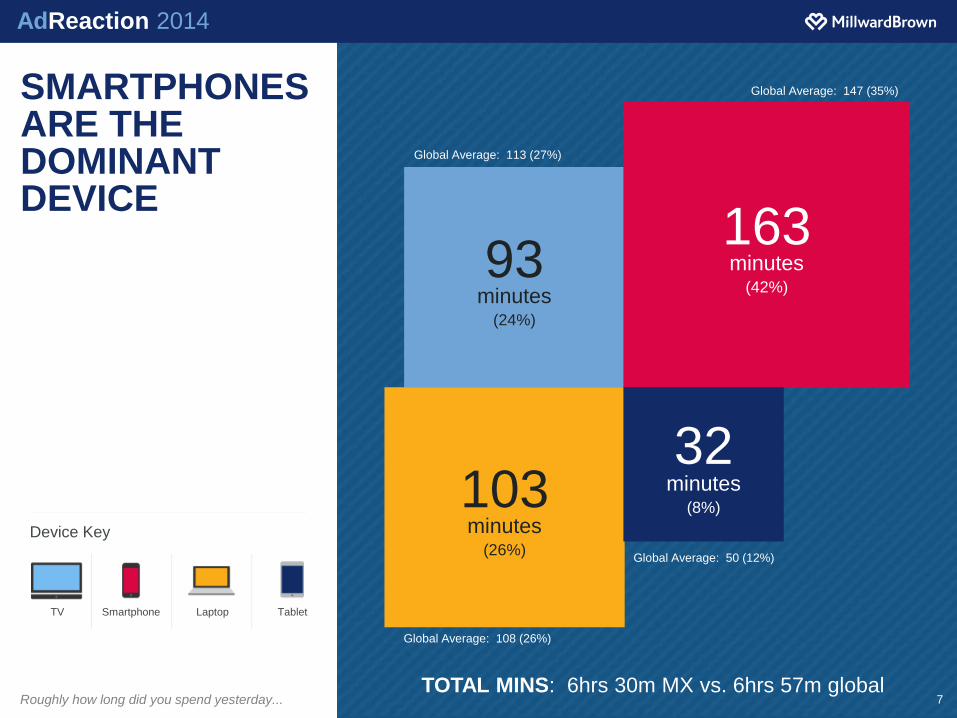
SMARTPHONES ARE THE DOMINANT DEVICE
Roughly how long did you spend yesterday... 7
TV Smartphone Laptop Tablet
Device Key
93minutes
(24%)
163minutes
(42%)
103minutes
(26%)
32minutes
(8%)
Global Average: 113 (27%)
Global Average: 108 (26%)
Global Average: 50 (12%)
Global Average: 147 (35%)
TOTAL MINS: 6hrs 30m MX vs. 6hrs 57m global
AdReaction 2014
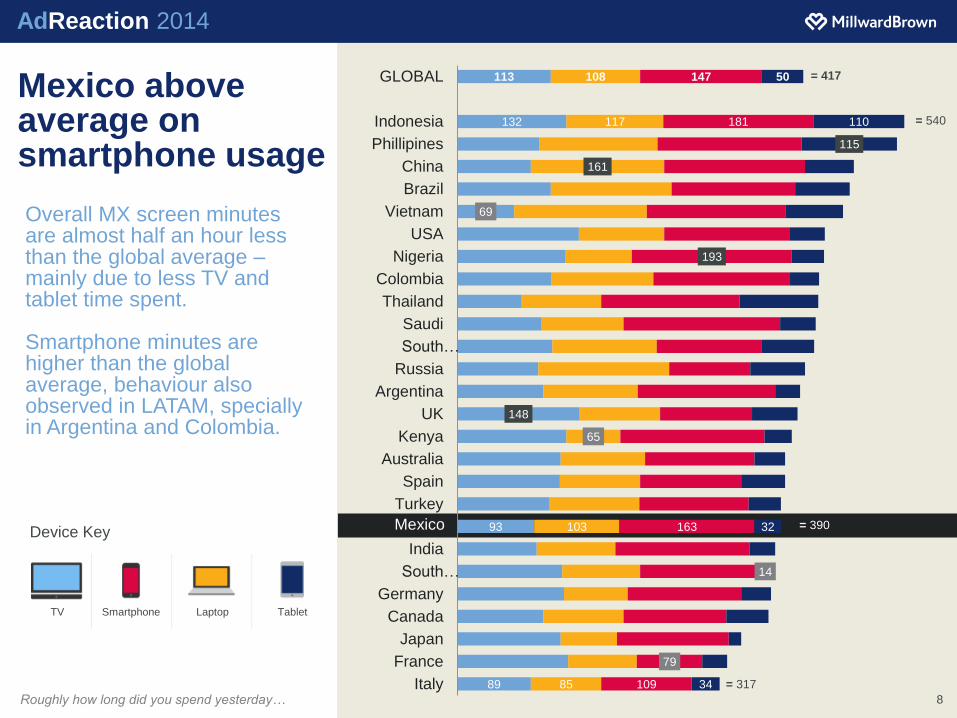
Mexico above average on smartphone usage
Overall MX screen minutes are almost half an hour less than the global average –mainly due to less TV and tablet time spent.
Smartphone minutes are higher than the global average, behaviour also observed in LATAM, specially in Argentina and Colombia.
Roughly how long did you spend yesterday… 8
TV Smartphone Laptop Tablet
Device Key
= 417
= 390
= 540
= 31789
93
148
69
132
113
85
103
65
161
117
108
109
79
163
193
181
147
34
14
32
115
110
50
Italy
France
Japan
Canada
Germany
South…
India
Mexico
Turkey
Spain
Australia
Kenya
UK
Argentina
Russia
South…
Saudi
Thailand
Colombia
Nigeria
USA
Vietnam
Brazil
China
Phillipines
Indonesia
GLOBAL
Mexico
AdReaction 2014
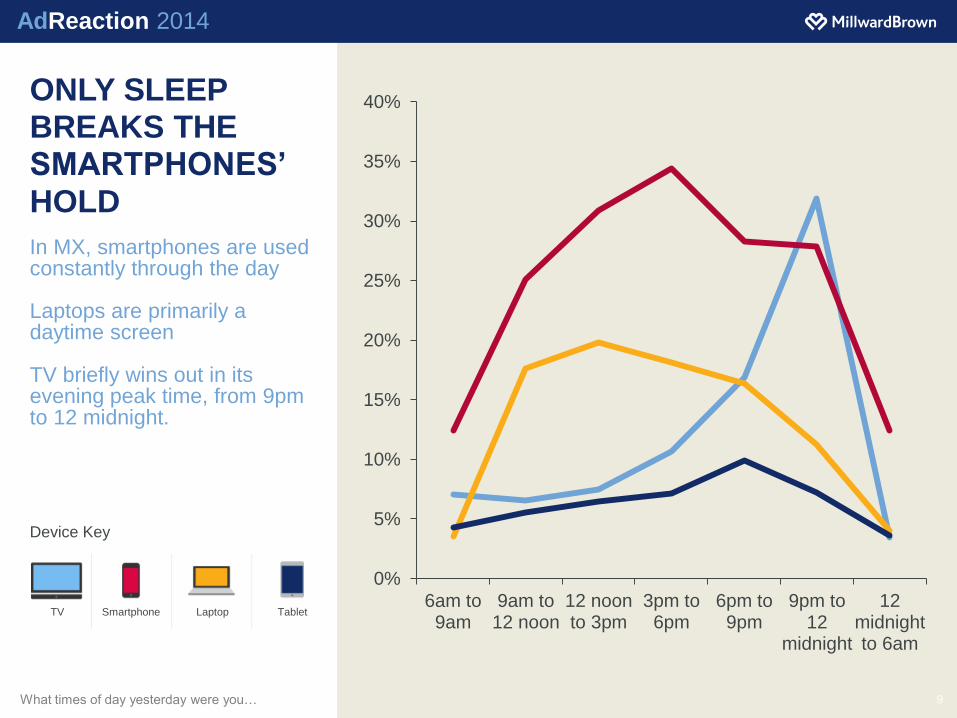
In MX, smartphones are used constantly through the day
Laptops are primarily a daytime screen
TV briefly wins out in its evening peak time, from 9pm to 12 midnight.
What times of day yesterday were you… 9
0%
5%
10%
15%
20%
25%
30%
35%
40%
6am to9am
9am to12 noon
12 noonto 3pm
3pm to6pm
6pm to9pm
9pm to12
midnight
12midnightto 6am
TV Smartphone Laptop Tablet
Device Key
ONLY SLEEP BREAKS THE SMARTPHONES’ HOLD
AdReaction 2014
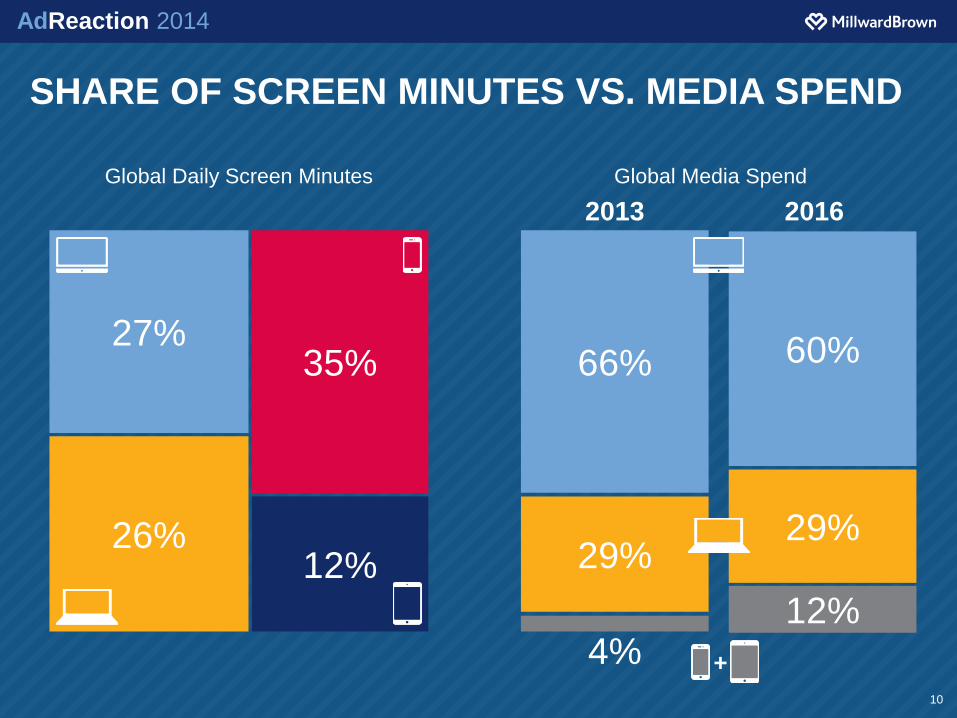
SHARE OF SCREEN MINUTES VS. MEDIA SPEND
10
Global Daily Screen Minutes
27%
12%26%
35%
12%
29%
60%
2016
66%
29%
4%
Global Media Spend
2013
+
When are the peak times for digital /
online marketing communications?
Which connected device is used most
then?
So which device gives brands the best
chance to reach consumers at the right
moment?
HOW ARE SCREENS USED?

AdReaction 2014
AT THE SAME TIME
AT DIFFERENT
POINTS IN TIME
PEOPLE NOW ROUTINELY USE CONNECTED DEVICES WHILE WATCHING TV
Of their 6.5 hours screen consumption, 105 minutes is simultaneous consumption of another digital screen while watching TV.
Simultaneous: At the same time as you were
watching TV yesterday, how much time did you also
spend using the Internet
13
SHIFTING
180’
63%
SIMULTANEOUS
105’
37%
TOTAL MINS: 390 MX vs. 417 global
NET MINS: 285 MX vs. 308 global
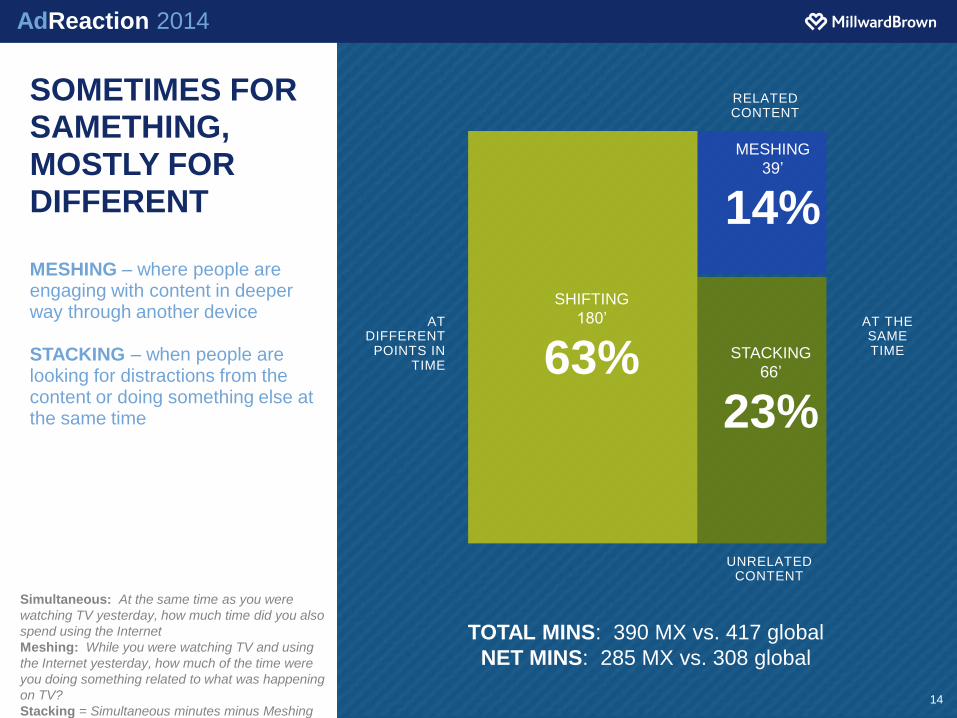
AdReaction 2014
RELATED CONTENT
UNRELATED CONTENT
AT THE SAME TIME
AT DIFFERENT
POINTS IN TIME
Simultaneous: At the same time as you were
watching TV yesterday, how much time did you also
spend using the Internet
Meshing: While you were watching TV and using
the Internet yesterday, how much of the time were
you doing something related to what was happening
on TV?
Stacking = Simultaneous minutes minus Meshing
minutes
14
SHIFTING
180’
63% STACKING
66’
23%
TOTAL MINS: 390 MX vs. 417 global
NET MINS: 285 MX vs. 308 global
MESHING
39’
14%
SOMETIMES FOR SAMETHING, MOSTLY FOR DIFFERENT
MESHING – where people are engaging with content in deeper way through another device
STACKING – when people are looking for distractions from the content or doing something else at the same time
AdReaction 2014
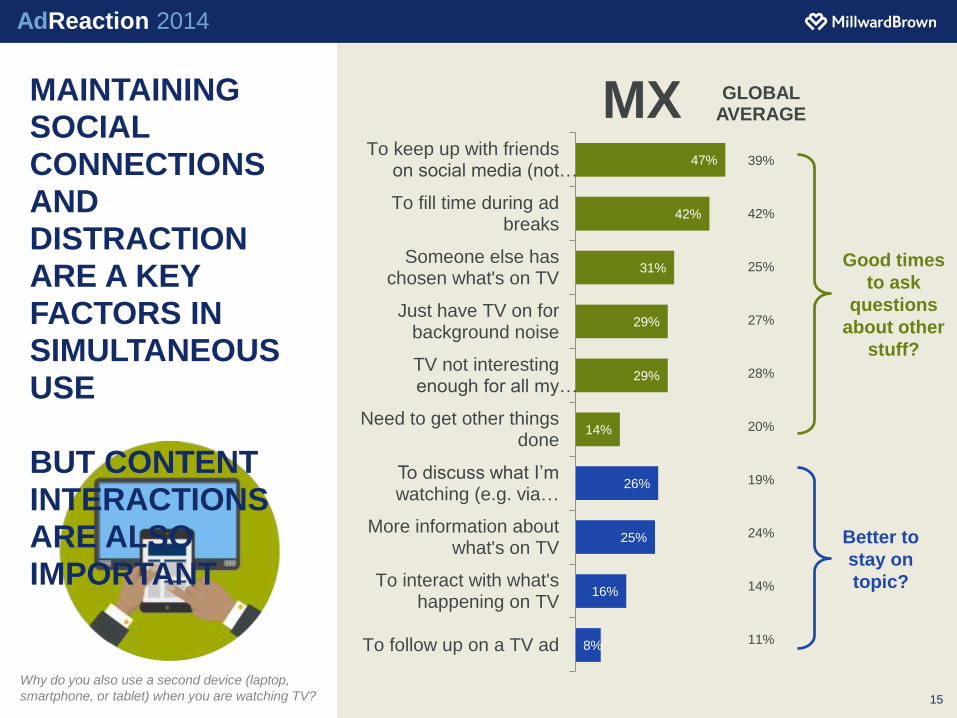
8%
16%
25%
26%
14%
29%
29%
31%
42%
47%
To follow up on a TV ad
To interact with what'shappening on TV
More information aboutwhat's on TV
To discuss what I’m watching (e.g. via …
Need to get other thingsdone
TV not interestingenough for all my…
Just have TV on forbackground noise
Someone else haschosen what's on TV
To fill time during adbreaks
To keep up with friendson social media (not…
MAINTAINING SOCIAL CONNECTIONS AND DISTRACTION ARE A KEY FACTORS IN SIMULTANEOUS USE
BUT CONTENT INTERACTIONS ARE ALSO IMPORTANT
Why do you also use a second device (laptop,
smartphone, or tablet) when you are watching TV? 15
MX GLOBAL AVERAGE
39%
42%
25%
27%
28%
20%
19%
24%
14%
11%
Good times
to ask
questions
about other
stuff?
Better to
stay on
topic?
AdReaction 2014
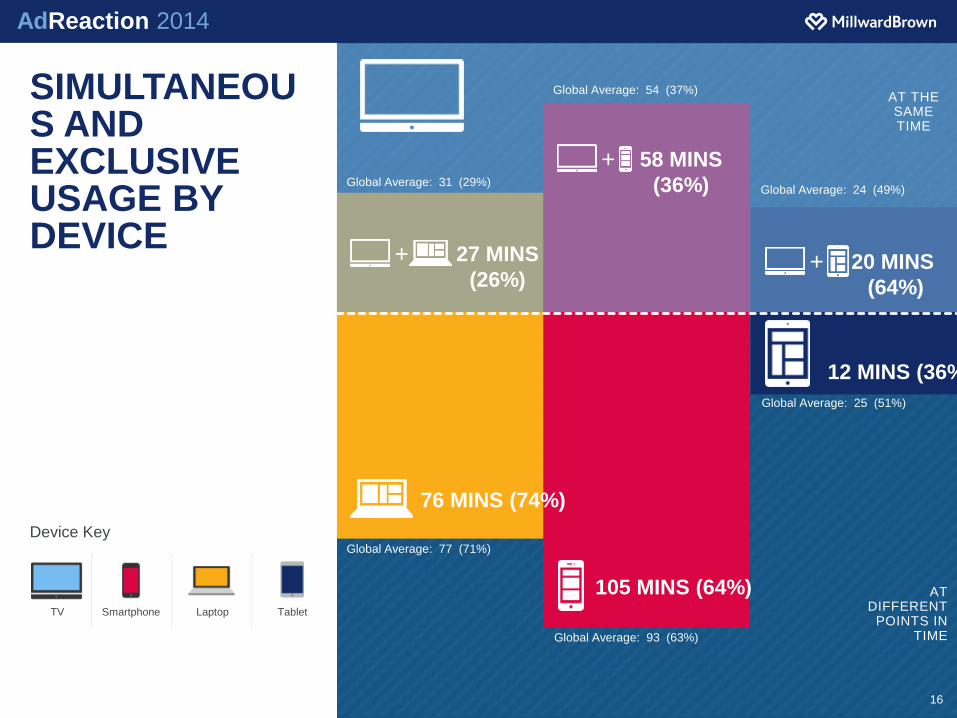
SIMULTANEOUS AND EXCLUSIVE USAGE BY DEVICE
16
TV Smartphone Laptop Tablet
Device Key
+ 27 MINS
(26%)
+ 58 MINS
(36%)
+ 20 MINS
(64%)
76 MINS (74%)
105 MINS (64%)
12 MINS (36%)
Global Average: 77 (71%)
Global Average: 31 (29%)
Global Average: 93 (63%)
Global Average: 25 (51%)
Global Average: 24 (49%)
Global Average: 54 (37%)AT THE SAME TIME
AT DIFFERENT
POINTS IN TIME
AdReaction 2014
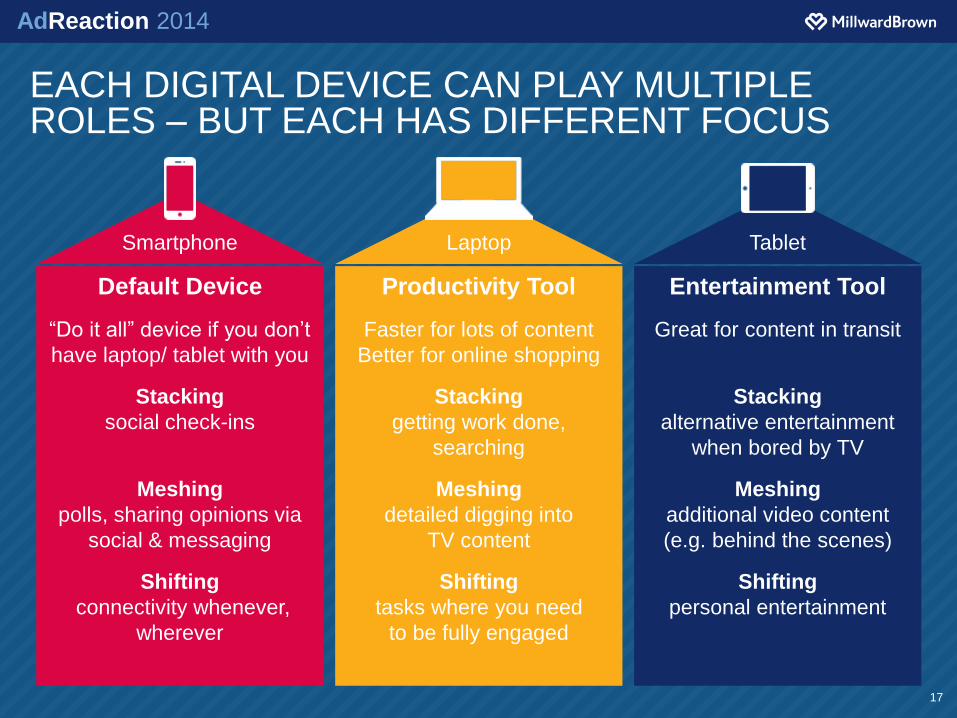
EACH DIGITAL DEVICE CAN PLAY MULTIPLE ROLES – BUT EACH HAS DIFFERENT FOCUS
17
Entertainment Tool
Great for content in transit
Stacking
alternative entertainment
when bored by TV
Meshing
additional video content
(e.g. behind the scenes)
Shifting
personal entertainment
Productivity Tool
Faster for lots of content
Better for online shopping
Stacking
getting work done,
searching
Meshing
detailed digging into
TV content
Shifting
tasks where you need
to be fully engaged
Default Device
“Do it all” device if you don’t
have laptop/ tablet with you
Stacking
social check-ins
Meshing
polls, sharing opinions via
social & messaging
Shifting
connectivity whenever,
wherever
Smartphone Laptop Tablet
AdReaction 2014
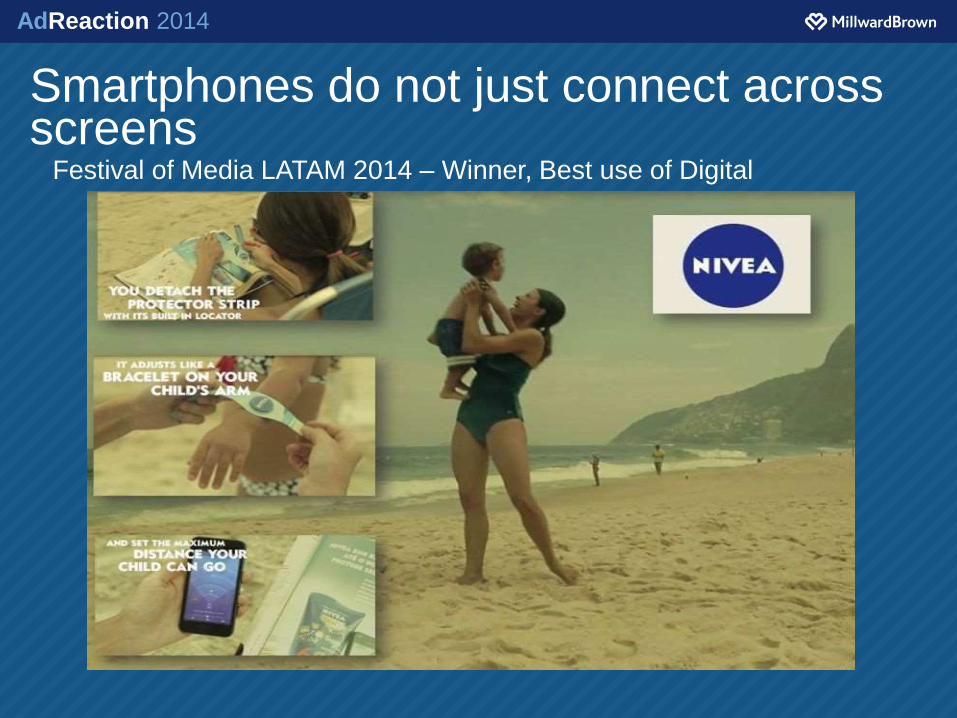
Smartphones do not just connect across screens
Festival of Media LATAM 2014 – Winner, Best use of Digital
AdReaction 2014
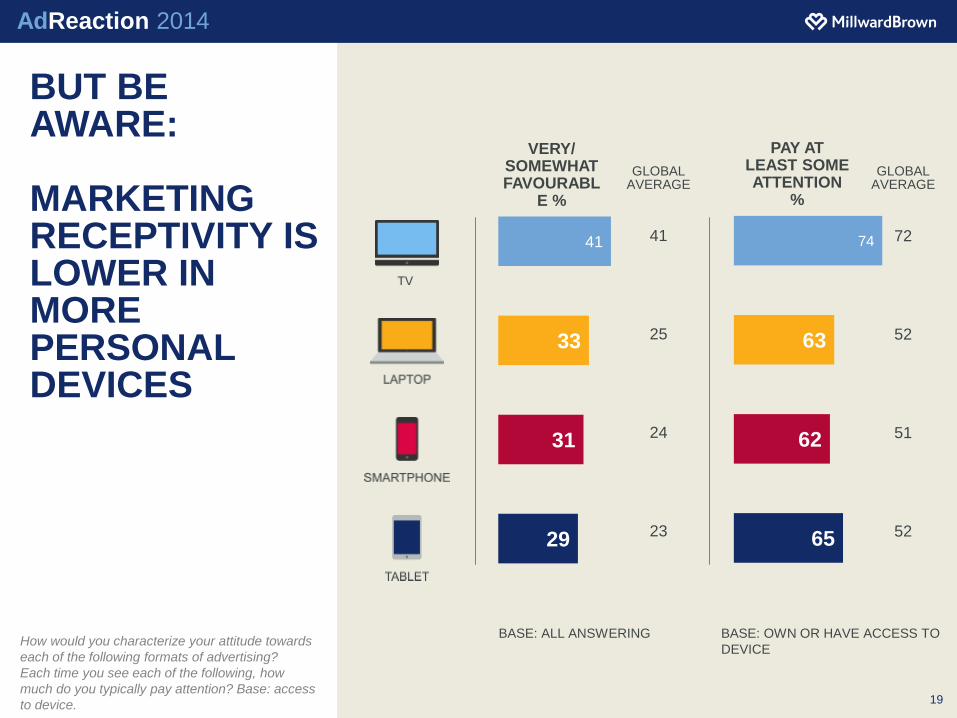
BUT BE AWARE:
MARKETING RECEPTIVITY IS LOWER IN MORE PERSONAL DEVICES
How would you characterize your attitude towards
each of the following formats of advertising?
Each time you see each of the following, how
much do you typically pay attention? Base: access
to device. 19
29
31
33
41
VERY/ SOMEWHAT FAVOURABL
E %
65
62
63
74
PAY AT LEAST SOME ATTENTION
%
41
25
24
23
GLOBAL AVERAGE
72
52
51
52
GLOBAL AVERAGE
BASE: ALL ANSWERING BASE: OWN OR HAVE ACCESS TO
DEVICE
Smartphones are becoming the
connective tissue between all consumer
touchpoints
They are allowing the analog to become
digital
Mobile connectivity offers Brands many
new opportunities to engage with and
build relationships with people
But personal devices are just that.
Personal. Marketers must not be too
intrusive or invasive.

HOW TO MEASURE MOBILE CAMPAIGN EFFECTIVENESS?
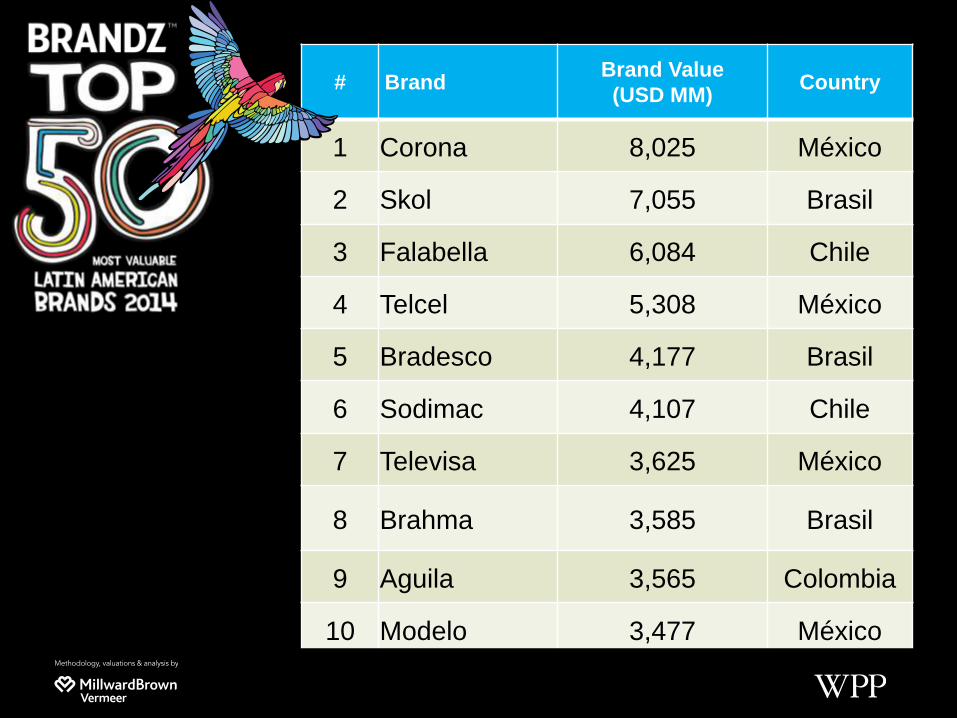
# BrandBrand Value
(USD MM)Country
1 Corona 8,025 México
2 Skol 7,055 Brasil
3 Falabella 6,084 Chile
4 Telcel 5,308 México
5 Bradesco 4,177 Brasil
6 Sodimac 4,107 Chile
7 Televisa 3,625 México
8 Brahma 3,585 Brasil
9 Aguila 3,565 Colombia
10 Modelo 3,477 México
* Concentra valores de Modelo Especial, Negra Modelo y Modelo Light. 23
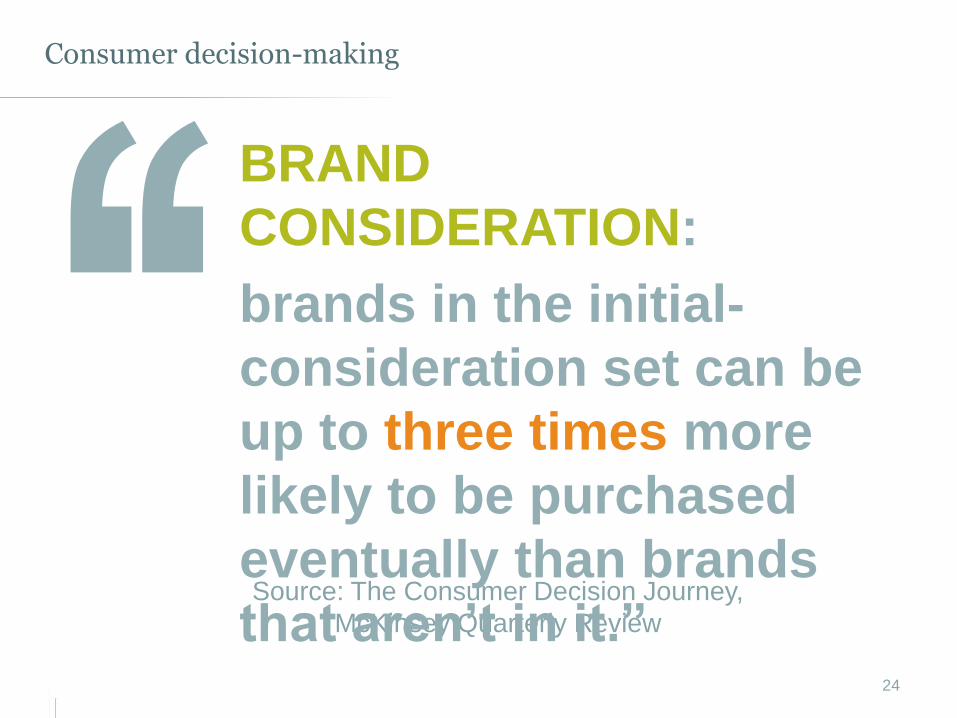
Consumer decision-making
Source: The Consumer Decision Journey,
McKinsey Quarterly Review
24
BRAND
CONSIDERATION:
brands in the initial-
consideration set can be
up to three times more
likely to be purchased
eventually than brands
that aren’t in it.”
O c t o b e r 5 , 2 0 1 4 8 : 1 4 p m
G o o g l e u p b e a t o v e r b r a n d a d v e r t i s i n g t o o l s
G o o g l e h a s c l a i m e d p r o m i s i n g e a r l y r e s u l t s f r o m i t s l a t e s t a t t e m p t t o d r a w b r a n d a d v e r t i s e r s , f o l l o w i n g y e a r s o f d i s a p p o i n t m e n t o v e r t h e s l o w g r o w t h o f b r a n d e d d i s p l a y a n d v i d e o a d s t o m a t c h i t s s e a r c h b u s i n e s s .
25
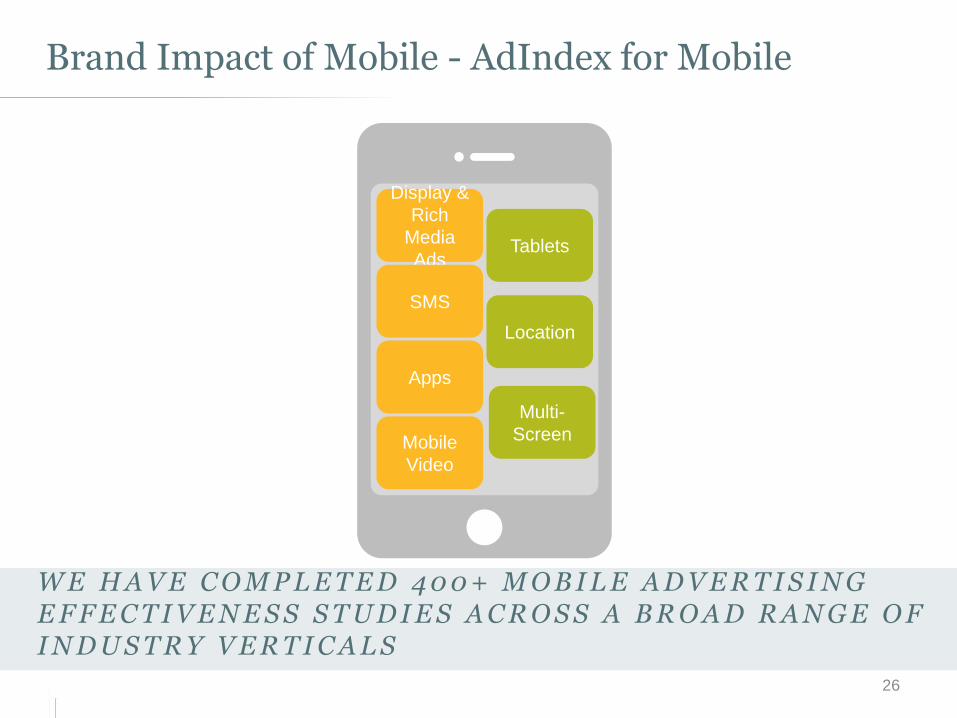
Brand Impact of Mobile - AdIndex for Mobile
26
W E H A V E C O M P L E T E D 4 0 0 + M O B I L E A D V E R T I S I N G E F F E C T I V E N E S S S T U D I E S A C R O S S A B R O A D R A N G E O F I N D U S T R Y V E R T I C A L S
Tablets
Location
Multi-
Screen
Display &
Rich
Media
Ads
SMS
Apps
Mobile
Video
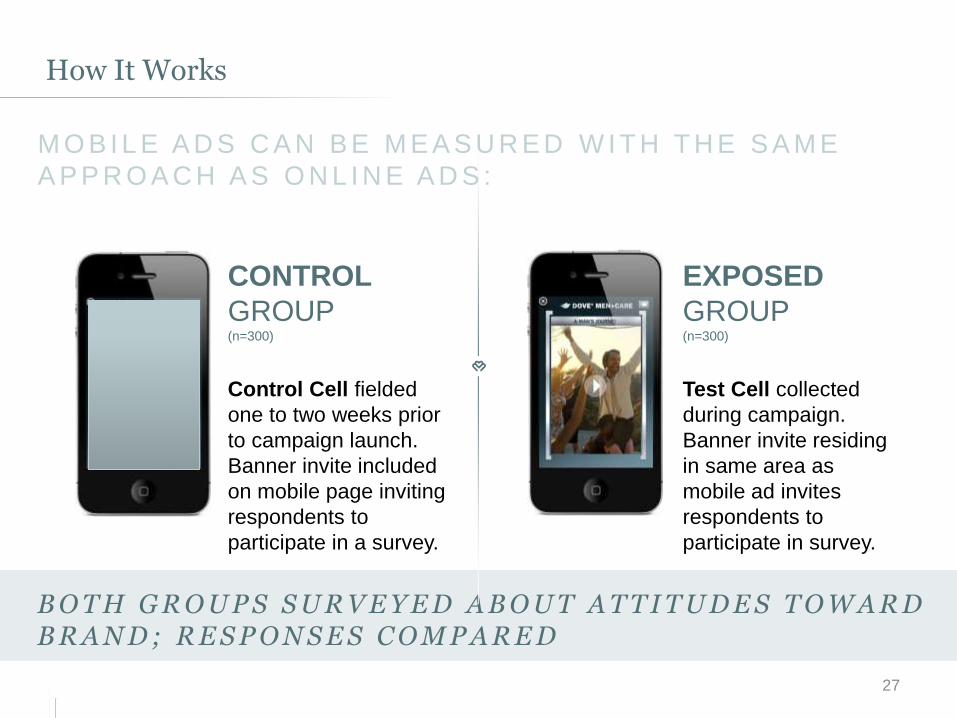
How It Works
27
B O T H G R O U P S S U R V E Y E D A B O U T A T T I T U D E S T O W A R D B R A N D ; R E S P O N S E S C O M P A R E D
M O B I L E A D S C A N B E M E A S U R E D W I T H T H E S A M E
A P P R O A C H A S O N L I N E A D S :
CONTROL
GROUP(n=300)
Control Cell fielded
one to two weeks prior
to campaign launch.
Banner invite included
on mobile page inviting
respondents to
participate in a survey.
EXPOSED
GROUP(n=300)
Test Cell collected
during campaign.
Banner invite residing
in same area as
mobile ad invites
respondents to
participate in survey.
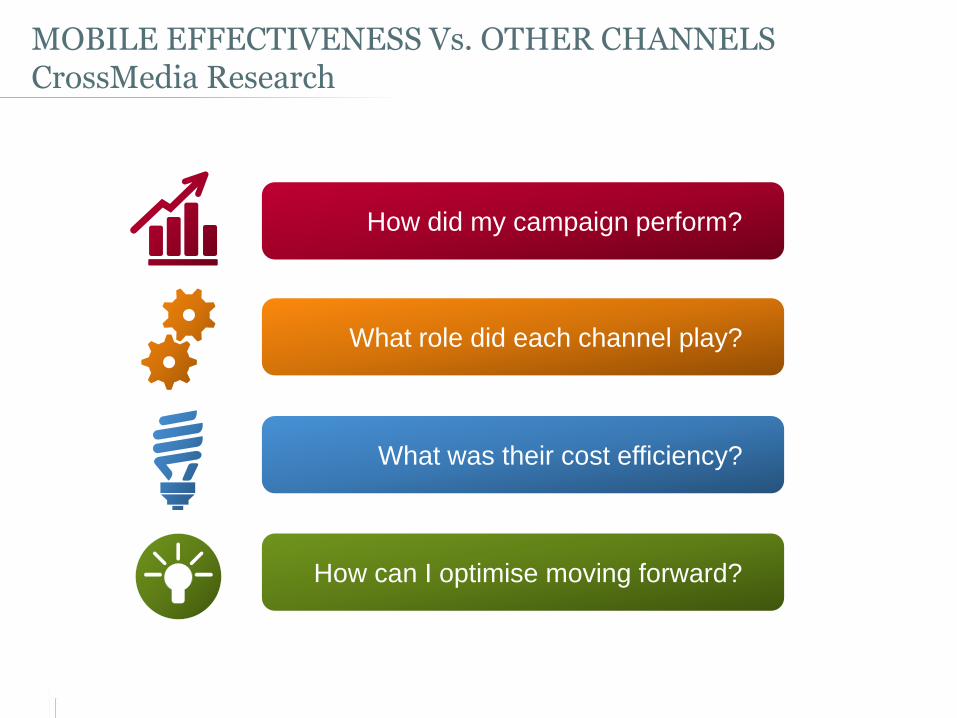
MOBILE EFFECTIVENESS Vs. OTHER CHANNELSCrossMedia Research
28
How can I optimise moving forward?
What was their cost efficiency?
What role did each channel play?
How did my campaign perform?
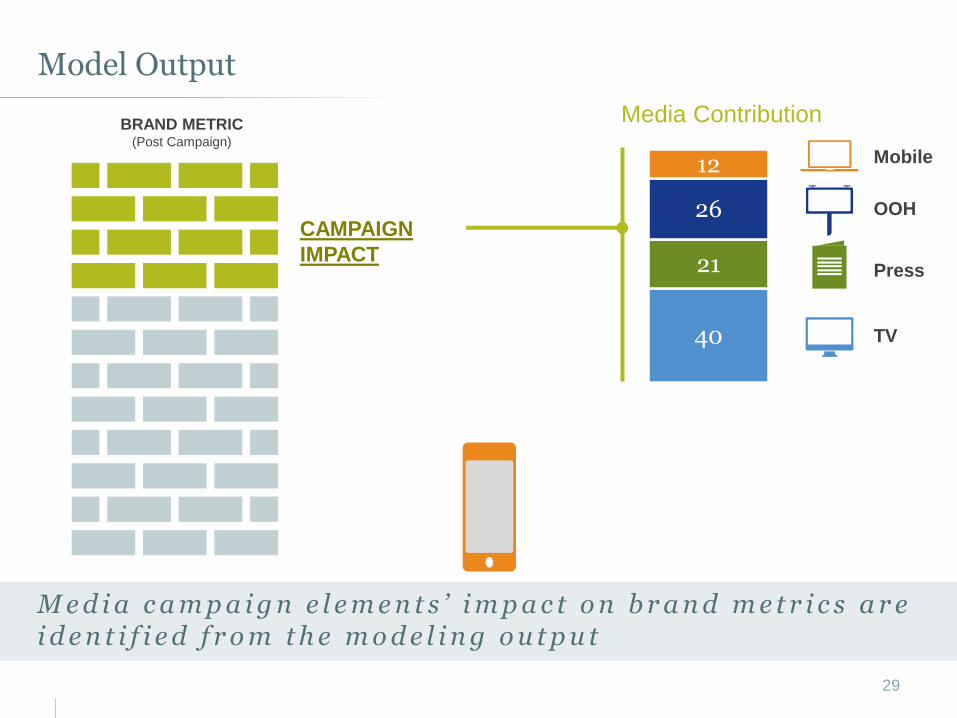
40
21
26
12
Model Output
29
M e d i a c a m p a i g n e l e m e n t s ’ i m p a c t o n b r a n d m e t r i c s a r e i d e n t i f i e d f r o m t h e m o d e l i n g o u t p u t
Media Contribution
Mobile
OOH
Press
TV
CAMPAIGN
IMPACT
BRAND METRIC(Post Campaign)
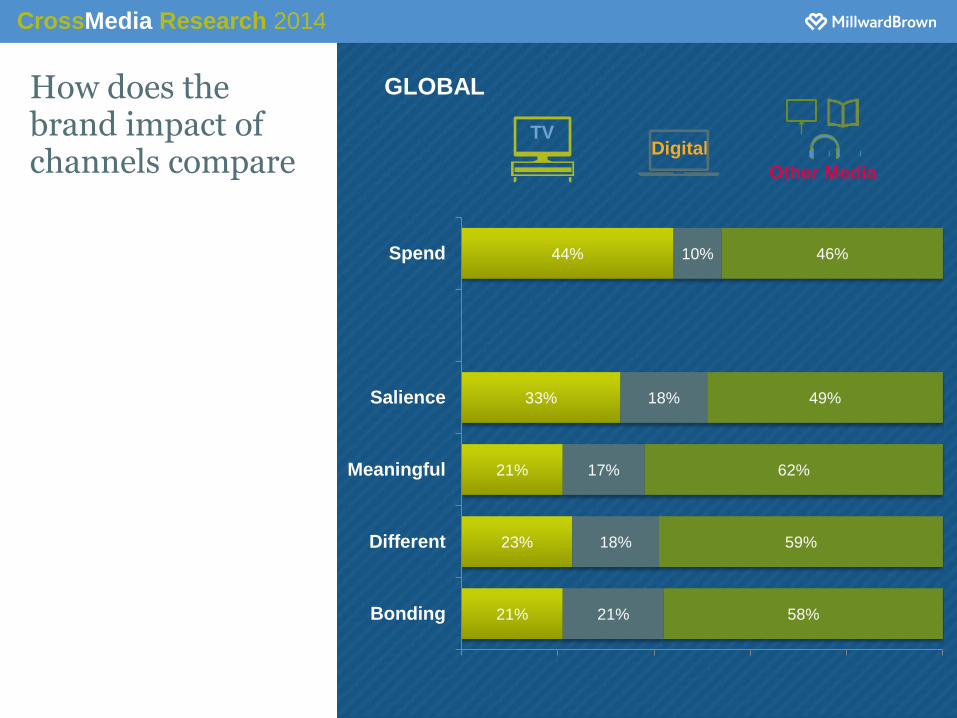
How does the brand impact of channels compare
DigitalTV
GLOBAL
21%
23%
21%
33%
44%
21%
18%
17%
18%
10%
58%
59%
62%
49%
46%
Bonding
Different
Meaningful
Salience
Spend
Other Media
CrossMedia Research 2014
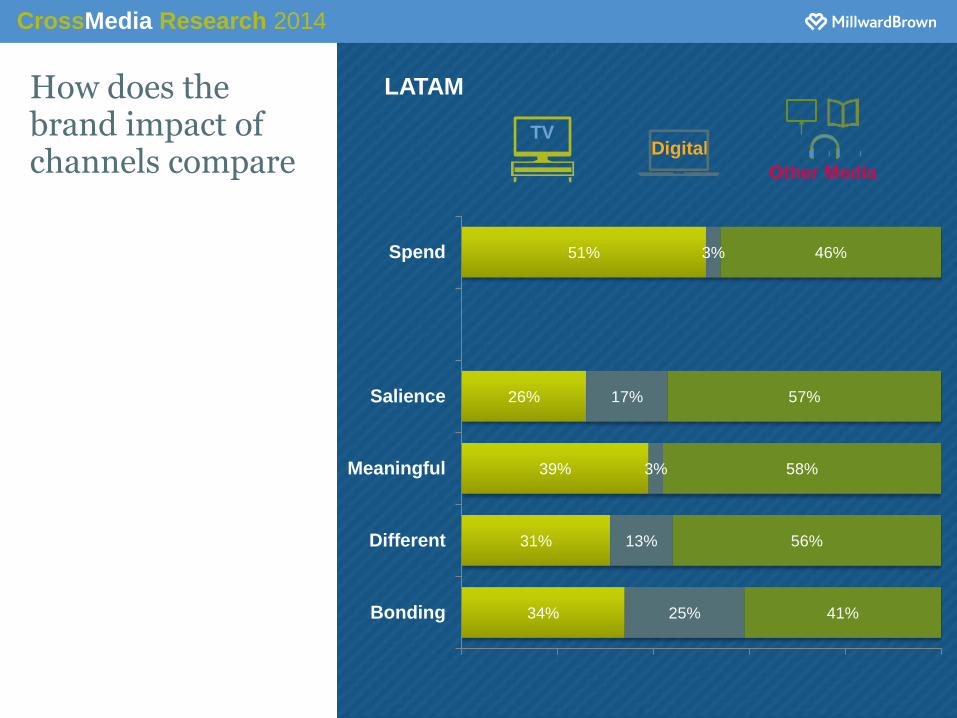
How does the brand impact of channels compare
DigitalTV
LATAM
34%
31%
39%
26%
51%
25%
13%
3%
17%
3%
41%
56%
58%
57%
46%
Bonding
Different
Meaningful
Salience
Spend
Other Media
CrossMedia Research 2014

WHAT SHOULD BRANDS DO?
AdReaction 2014
• The key to consumer interaction and
information exchange is now personal
mobile devices,
• Core consumer segments are going
mobile fast
• Brand Marketers need to follow them if
they wish to effectively grow their
brands in future
• But must test and learn more to
maximize impact and ROI of mobile
investments
#AdReaction
Thank you
James Galpin,
Head of Media & Digital, LATAM
www.millwardbrown.com/AdReaction
www.millwardbrown.com/BrandZ