Embed Size (px)
Citation preview
From Segments to Fragments Conflicting economic signals and their
implications for marketers
Presentation to CIM Spring Conference
Paul Flatters
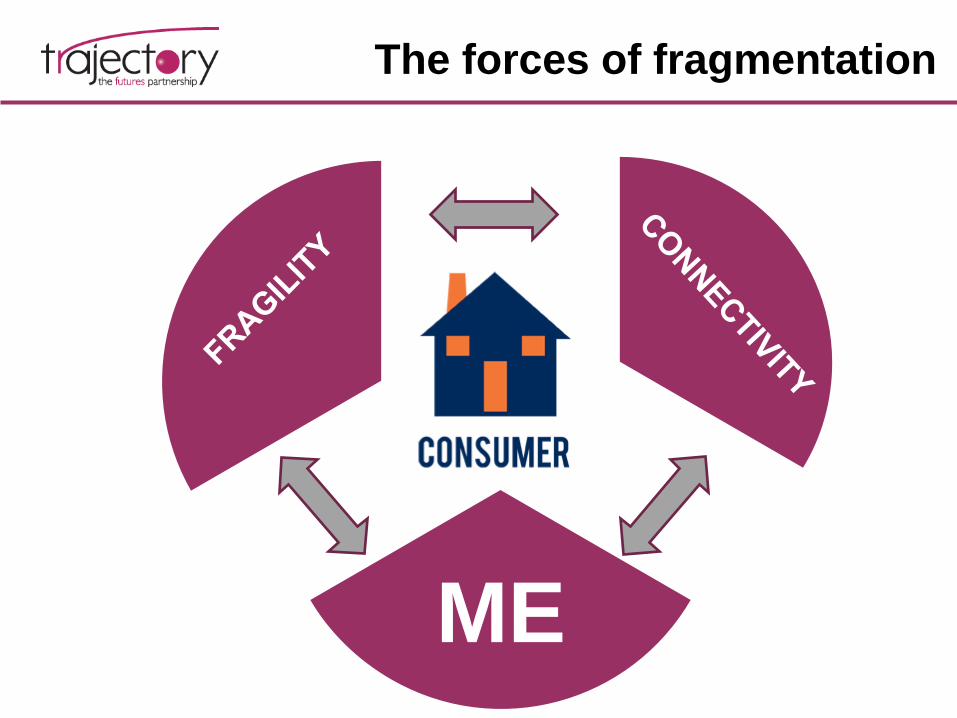
The forces of fragmentation
ME
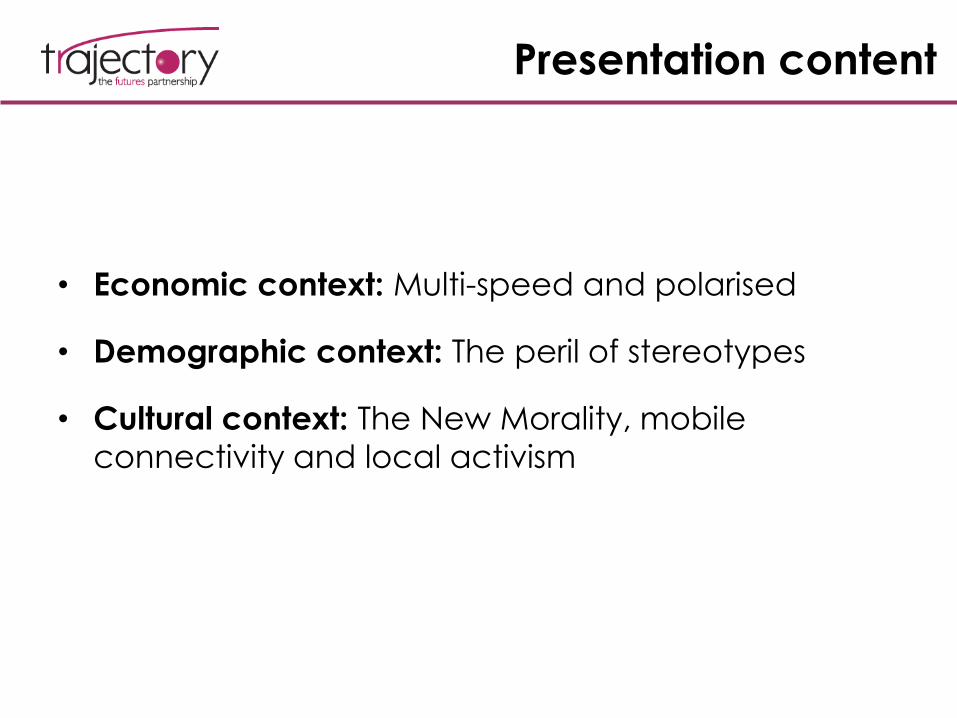
Presentation content
• Economic context: Multi-speed and polarised
• Demographic context: The peril of stereotypes
• Cultural context: The New Morality, mobile
connectivity and local activism
ECONOMIC CONTEXT: MULTI-
SPEED AND POLARISED
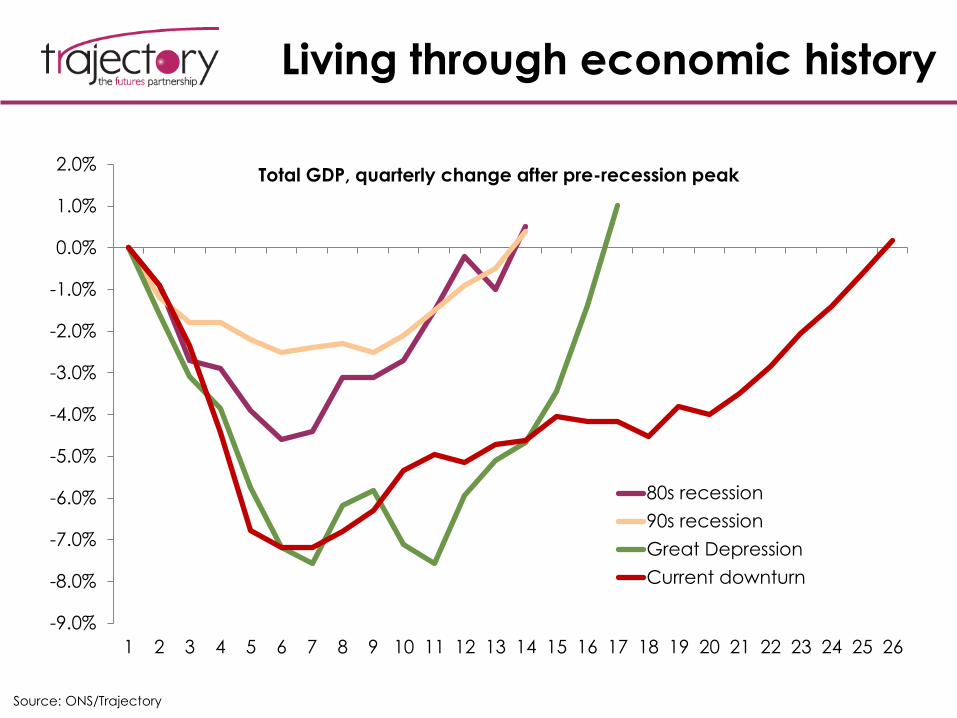
Living through economic history
-9.0%
-8.0%
-7.0%
-6.0%
-5.0%
-4.0%
-3.0%
-2.0%
-1.0%
0.0%
1.0%
2.0%
1 2 3 4 5 6 7 8 9 10 11 12 13 14 15 16 17 18 19 20 21 22 23 24 25 26
Total GDP, quarterly change after pre-recession peak
80s recession
90s recession
Great Depression
Current downturn
Source: ONS/Trajectory
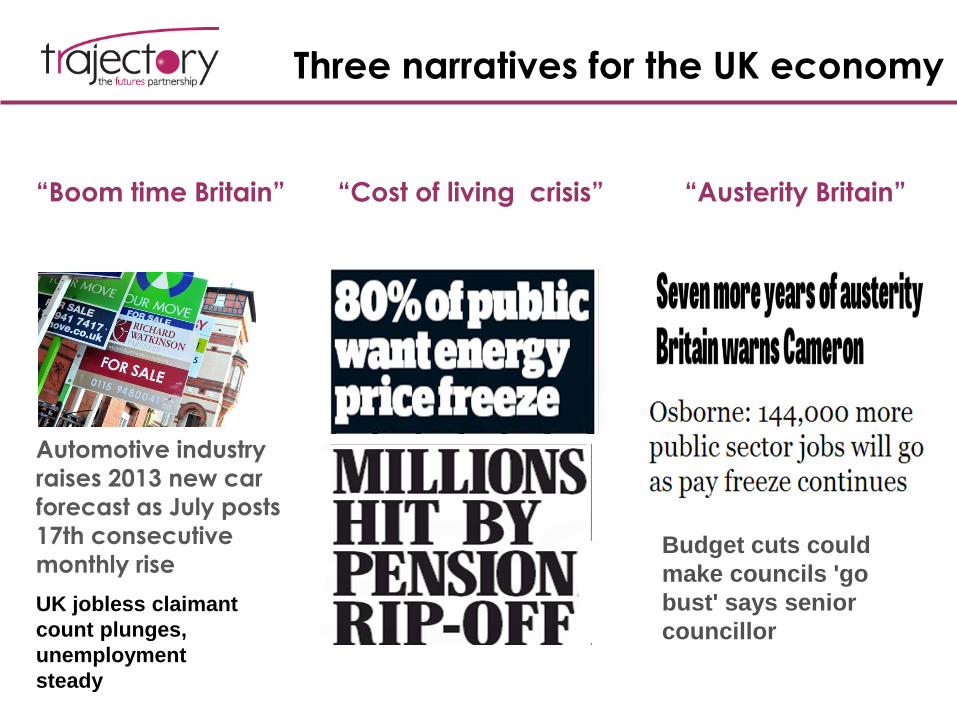
Three narratives for the UK economy
“Boom time Britain”
Automotive industry
raises 2013 new car
forecast as July posts
17th consecutive
monthly rise
UK jobless claimant
count plunges,
unemployment
steady
“Cost of living crisis” “Austerity Britain”
Budget cuts could
make councils 'go
bust' says senior
councillor
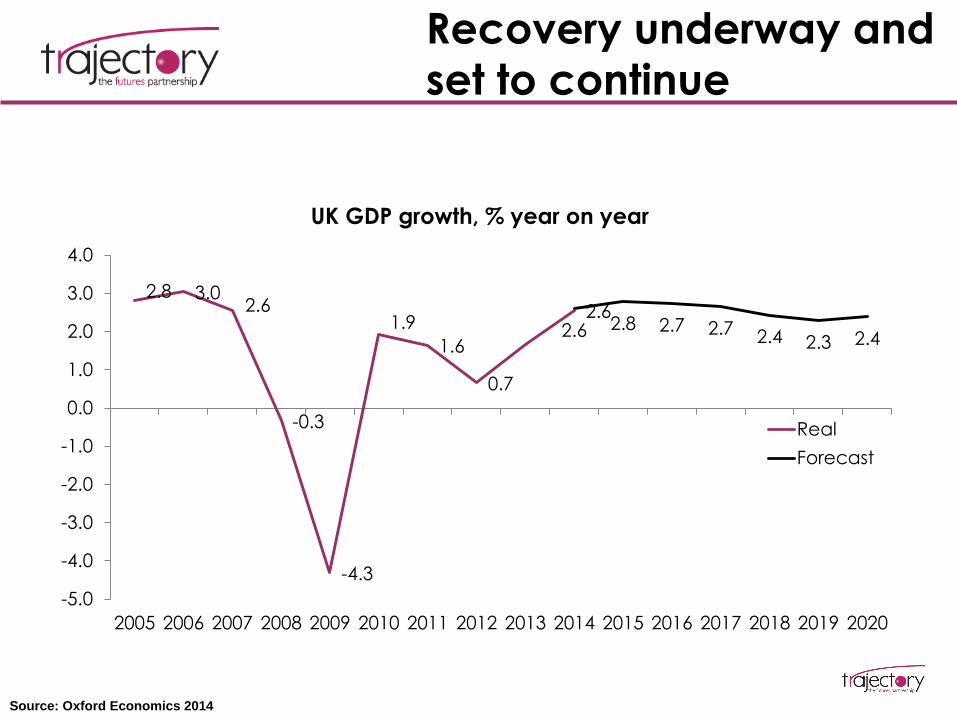
2.8 3.0 2.6
-0.3
-4.3
1.9
1.6
0.7
2.6 2.6 2.8 2.7 2.7 2.4 2.3 2.4
-5.0
-4.0
-3.0
-2.0
-1.0
0.0
1.0
2.0
3.0
4.0
2005 2006 2007 2008 2009 2010 2011 2012 2013 2014 2015 2016 2017 2018 2019 2020
UK GDP growth, % year on year
Real
Forecast
Source: Oxford Economics 2014
Recovery underway and
set to continue
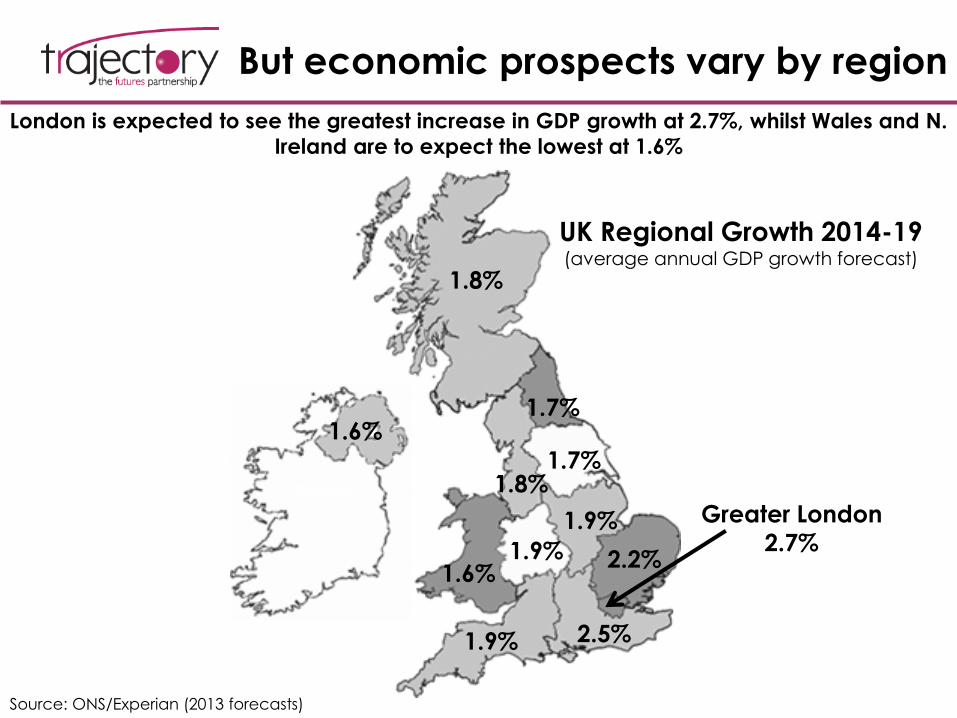
But economic prospects vary by region
Greater London
2.7%
1.8%
1.6%
1.6%
1.7%
1.8% 1.7%
1.9%
1.9%
2.2%
1.9% 2.5%
UK Regional Growth 2014-19 (average annual GDP growth forecast)
Source: ONS/Experian (2013 forecasts)
London is expected to see the greatest increase in GDP growth at 2.7%, whilst Wales and N.
Ireland are to expect the lowest at 1.6%
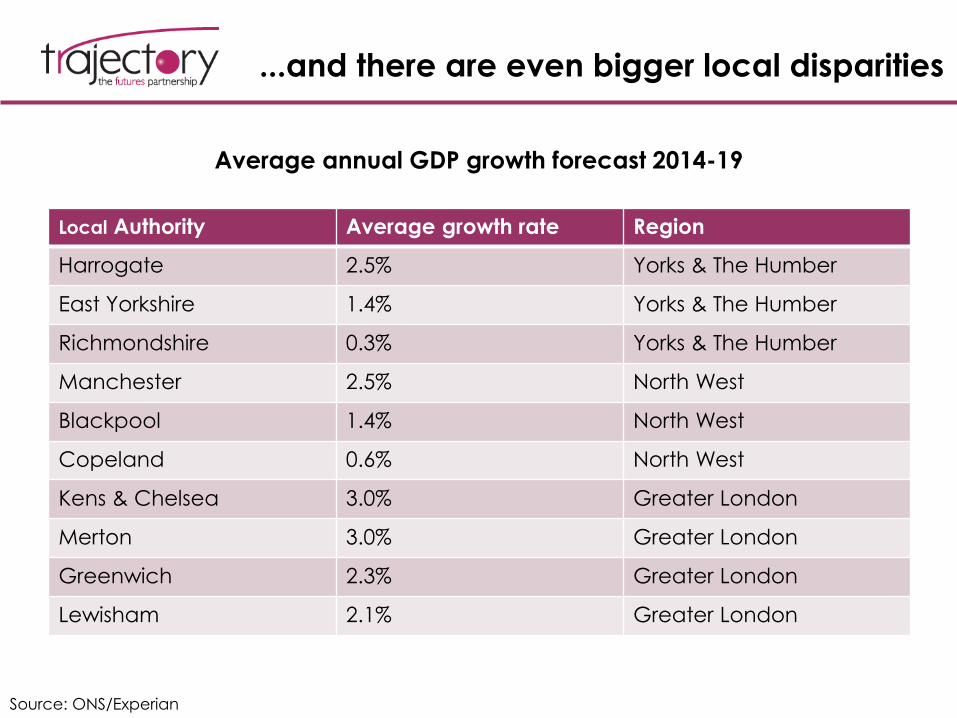
...and there are even bigger local disparities
Local Authority Average growth rate Region
Harrogate 2.5% Yorks & The Humber
East Yorkshire 1.4% Yorks & The Humber
Richmondshire 0.3% Yorks & The Humber
Manchester 2.5% North West
Blackpool 1.4% North West
Copeland 0.6% North West
Kens & Chelsea 3.0% Greater London
Merton 3.0% Greater London
Greenwich 2.3% Greater London
Lewisham 2.1% Greater London
Average annual GDP growth forecast 2014-19
Source: ONS/Experian
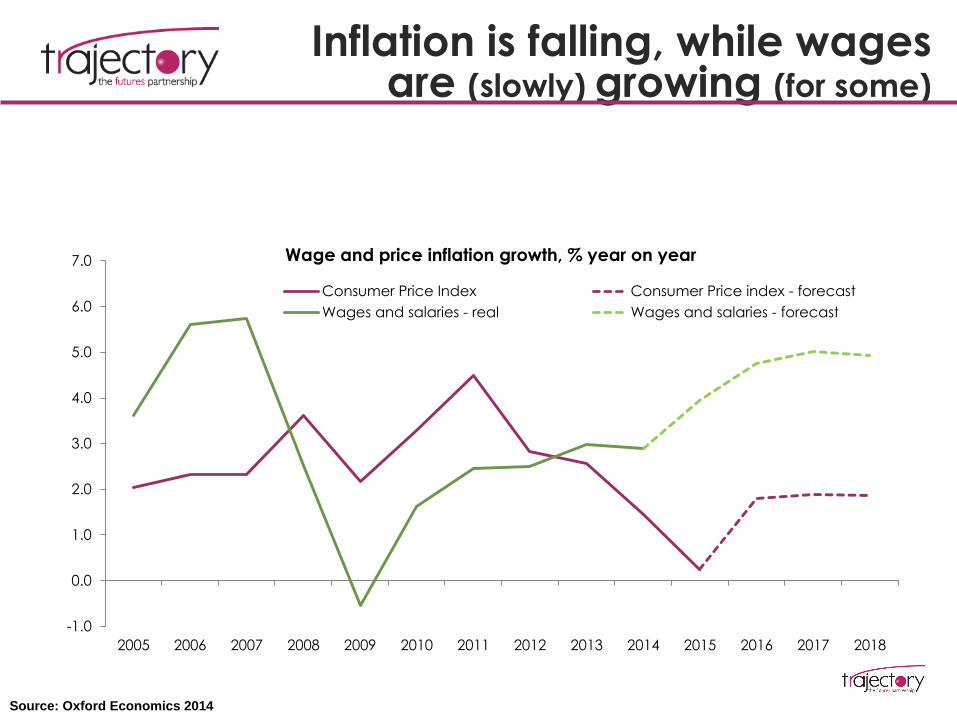
-1.0
0.0
1.0
2.0
3.0
4.0
5.0
6.0
7.0
2005 2006 2007 2008 2009 2010 2011 2012 2013 2014 2015 2016 2017 2018
Wage and price inflation growth, % year on year
Consumer Price Index Consumer Price index - forecast
Wages and salaries - real Wages and salaries - forecast
Inflation is falling, while wages are (slowly) growing (for some)
Source: Oxford Economics 2014
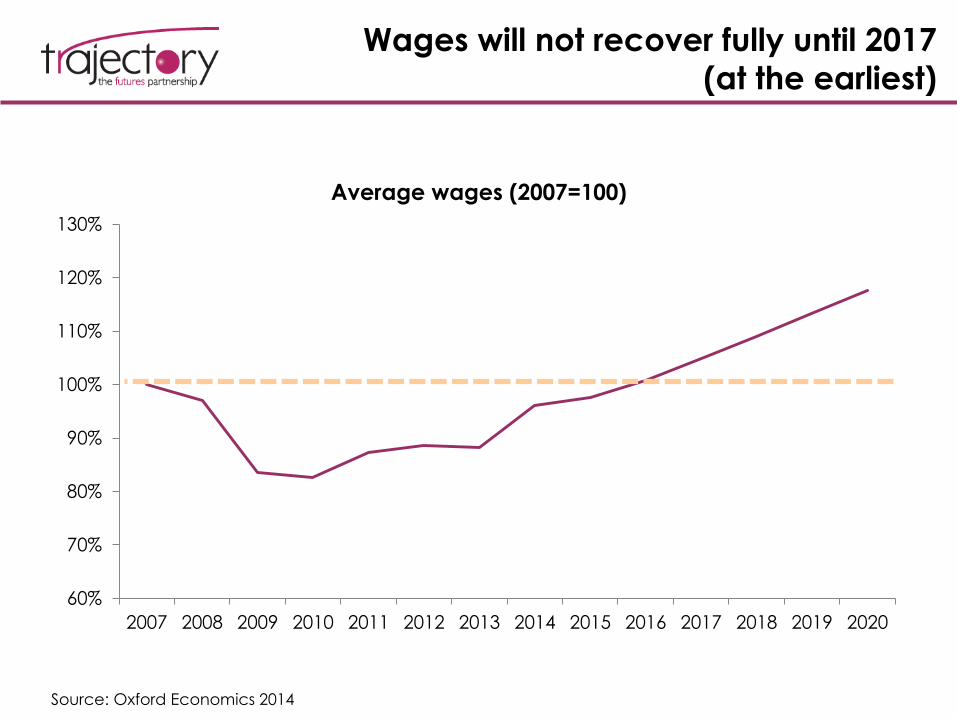
Wages will not recover fully until 2017
(at the earliest)
60%
70%
80%
90%
100%
110%
120%
130%
2007 2008 2009 2010 2011 2012 2013 2014 2015 2016 2017 2018 2019 2020
Average wages (2007=100)
Source: Oxford Economics 2014
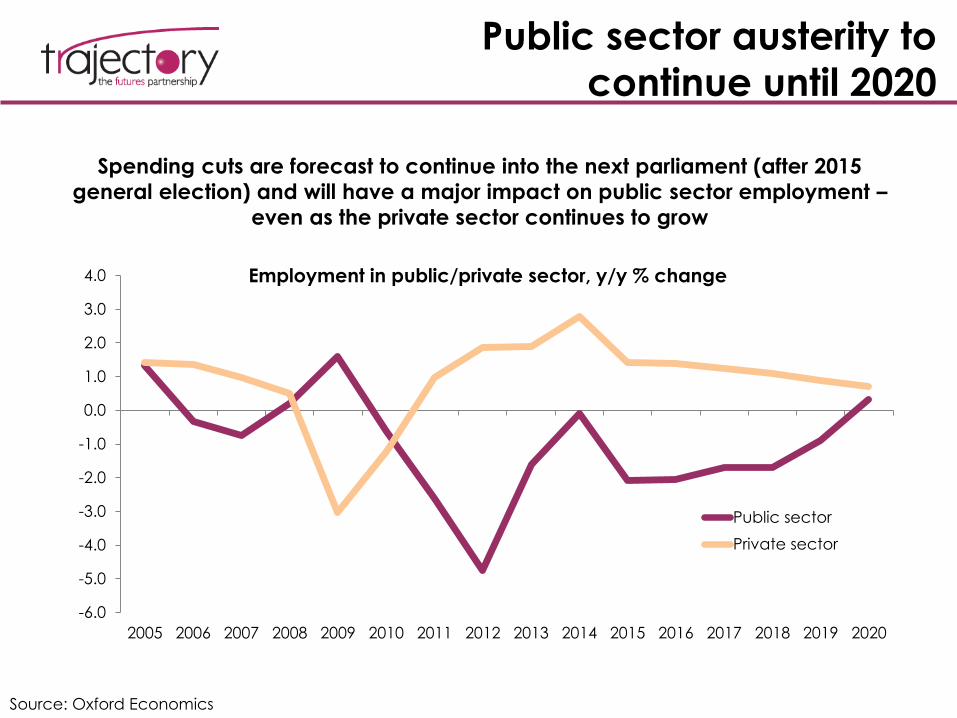
Public sector austerity to
continue until 2020
-6.0
-5.0
-4.0
-3.0
-2.0
-1.0
0.0
1.0
2.0
3.0
4.0
2005 2006 2007 2008 2009 2010 2011 2012 2013 2014 2015 2016 2017 2018 2019 2020
Employment in public/private sector, y/y % change
Public sector
Private sector
Spending cuts are forecast to continue into the next parliament (after 2015
general election) and will have a major impact on public sector employment –
even as the private sector continues to grow
Source: Oxford Economics
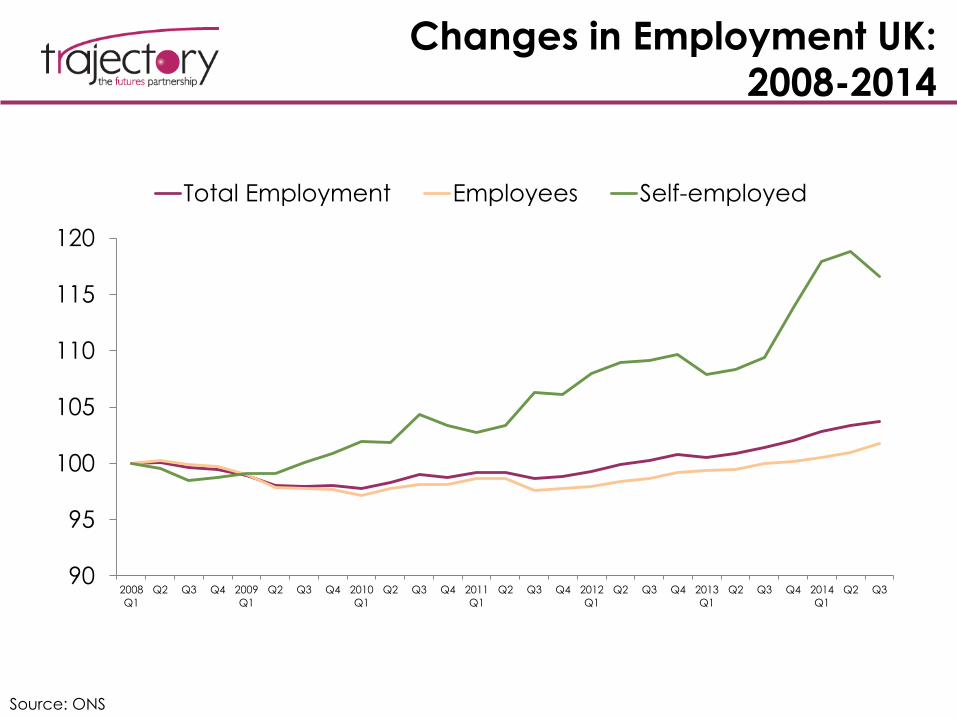
Changes in Employment UK:
2008-2014
90
95
100
105
110
115
120
2008
Q1
Q2 Q3 Q4 2009
Q1
Q2 Q3 Q4 2010
Q1
Q2 Q3 Q4 2011
Q1
Q2 Q3 Q4 2012
Q1
Q2 Q3 Q4 2013
Q1
Q2 Q3 Q4 2014
Q1
Q2 Q3
Total Employment Employees Self-employed
Source: ONS
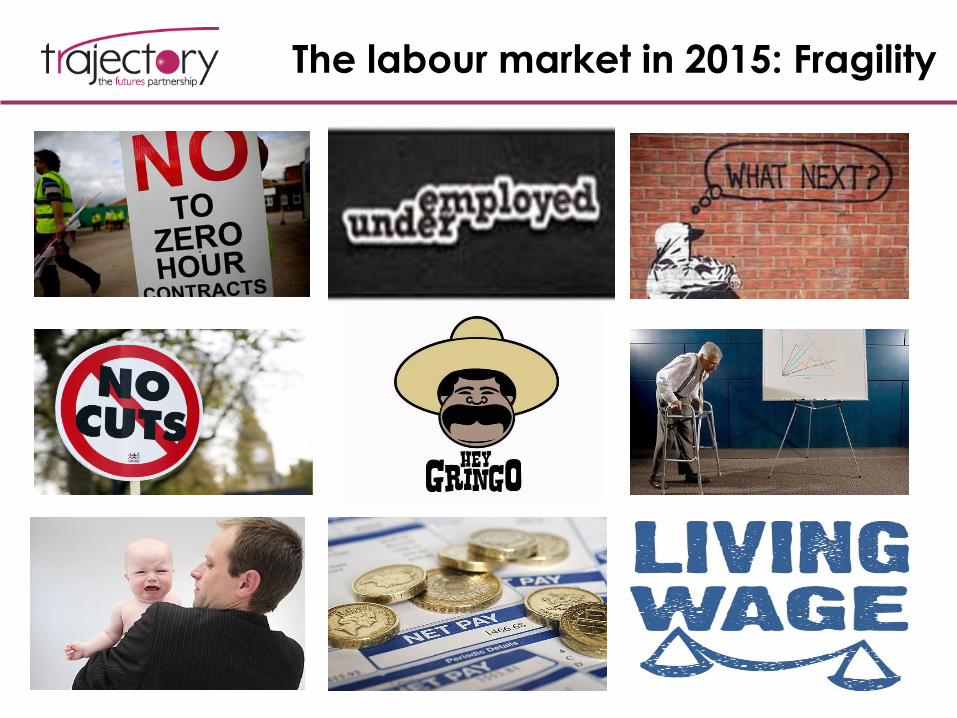
The labour market in 2015: Fragility
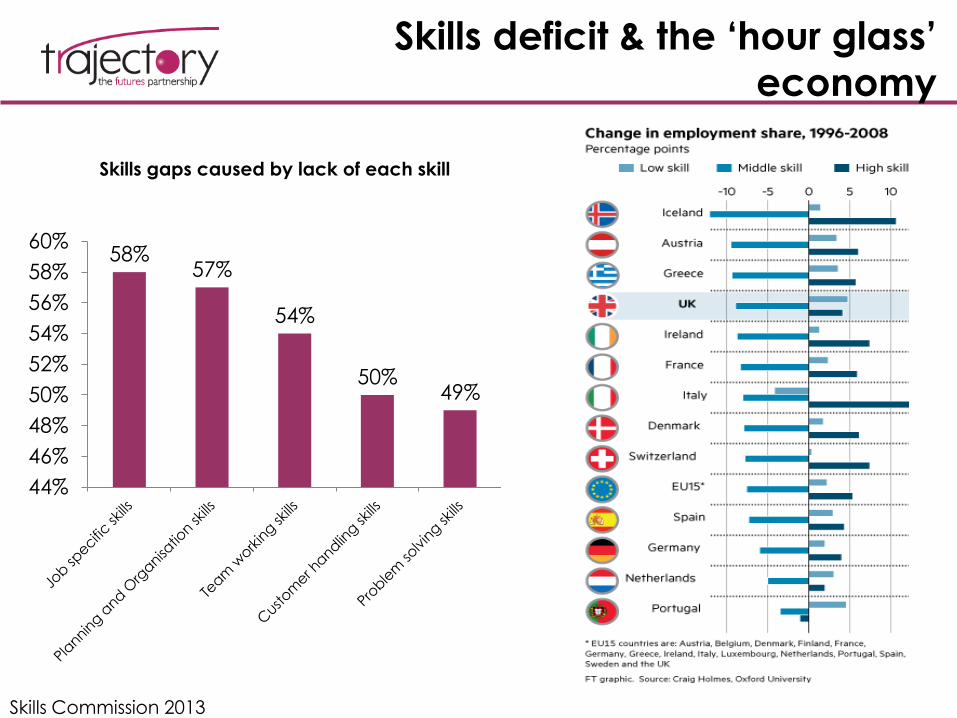
Skills deficit & the ‘hour glass’
economy
58% 57%
54%
50% 49%
44%
46%
48%
50%
52%
54%
56%
58%
60%
Skills gaps caused by lack of each skill
Skills Commission 2013
DEMOGRAPHIC CONTEXT
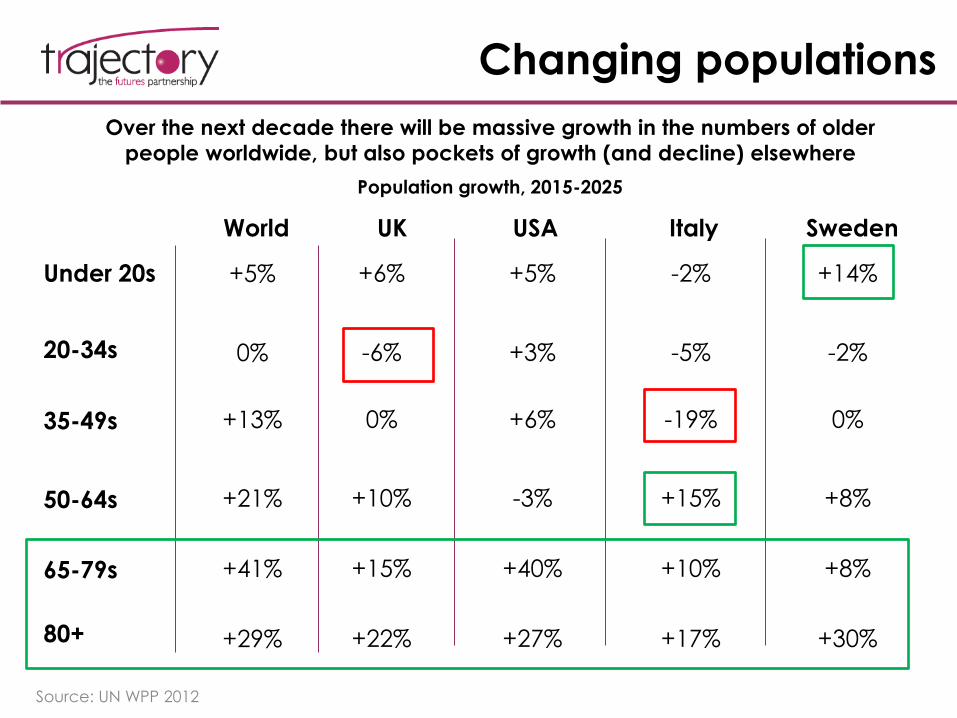
Changing populations
Over the next decade there will be massive growth in the numbers of older
people worldwide, but also pockets of growth (and decline) elsewhere
65-79s +41%
80+ +29%
Under 20s +5%
20-34s 0%
35-49s +13%
50-64s +21%
+15%
+22%
+6%
-6%
0%
+10%
+40%
+27%
+5%
+3%
+6%
-3%
+10%
+17%
-2%
-5%
-19%
+15%
+8%
+30%
+14%
-2%
0%
+8%
World UK USA Italy Sweden
Population growth, 2015-2025
Source: UN WPP 2012
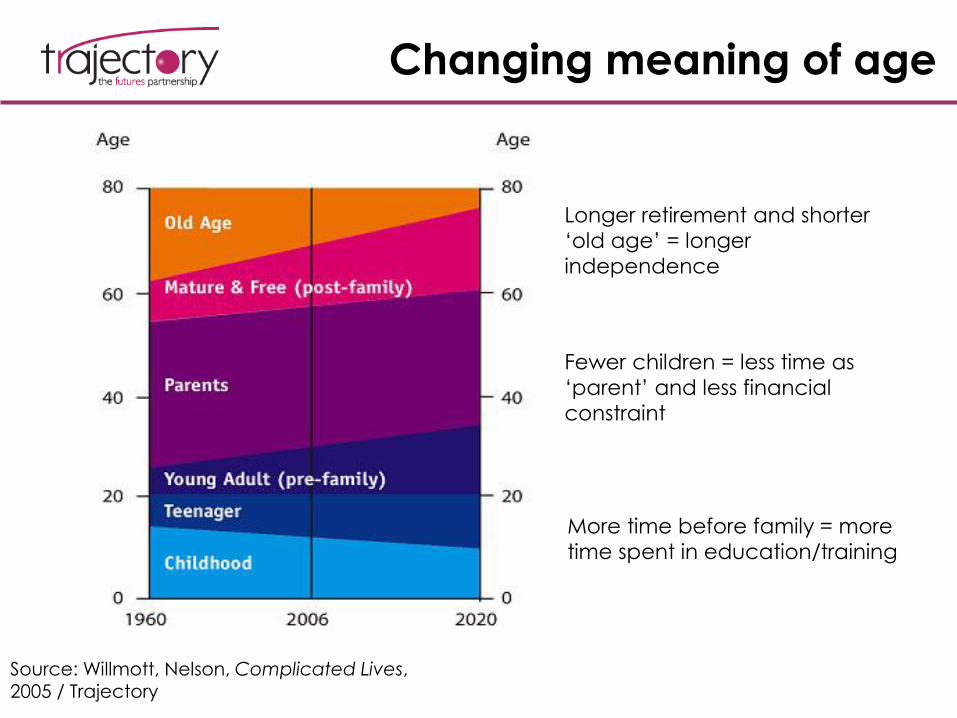
Changing meaning of age
Source: Willmott, Nelson, Complicated Lives, 2005 / Trajectory
More time before family = more
time spent in education/training
Fewer children = less time as
‘parent’ and less financial
constraint
Longer retirement and shorter
‘old age’ = longer
independence
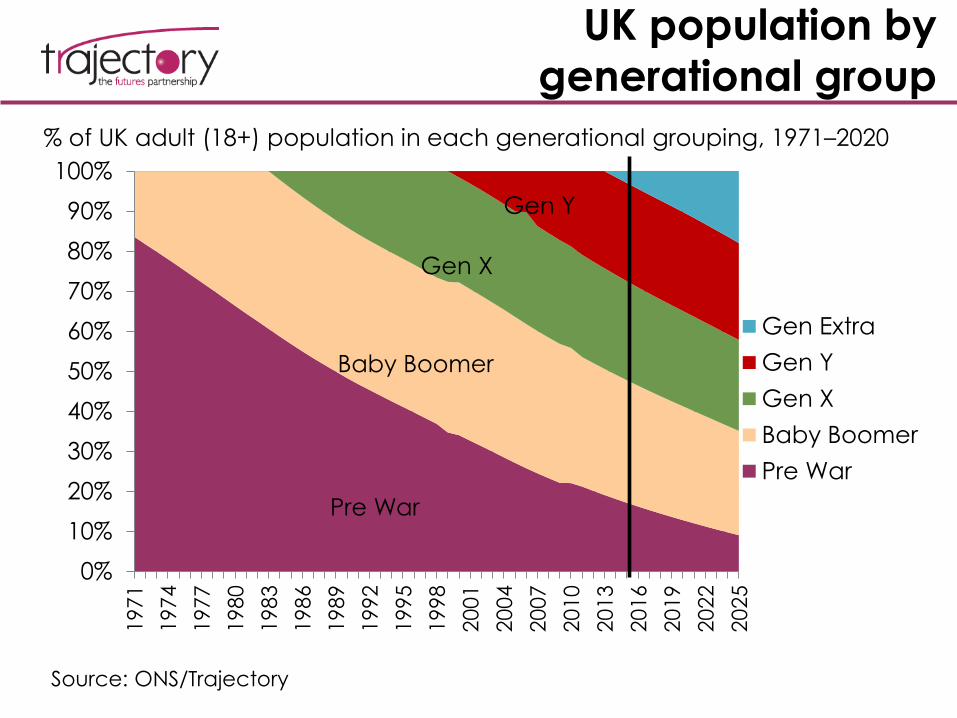
UK population by
generational group
0%
10%
20%
30%
40%
50%
60%
70%
80%
90%
100%
19
71
19
74
19
77
19
80
19
83
19
86
19
89
19
92
19
95
19
98
20
01
20
04
20
07
20
10
20
13
20
16
20
19
20
22
20
25
Gen Extra
Gen Y
Gen X
Baby Boomer
Pre War
Pre War
Baby Boomer
Gen X
Gen Y
% of UK adult (18+) population in each generational grouping, 1971–2020
Source: ONS/Trajectory
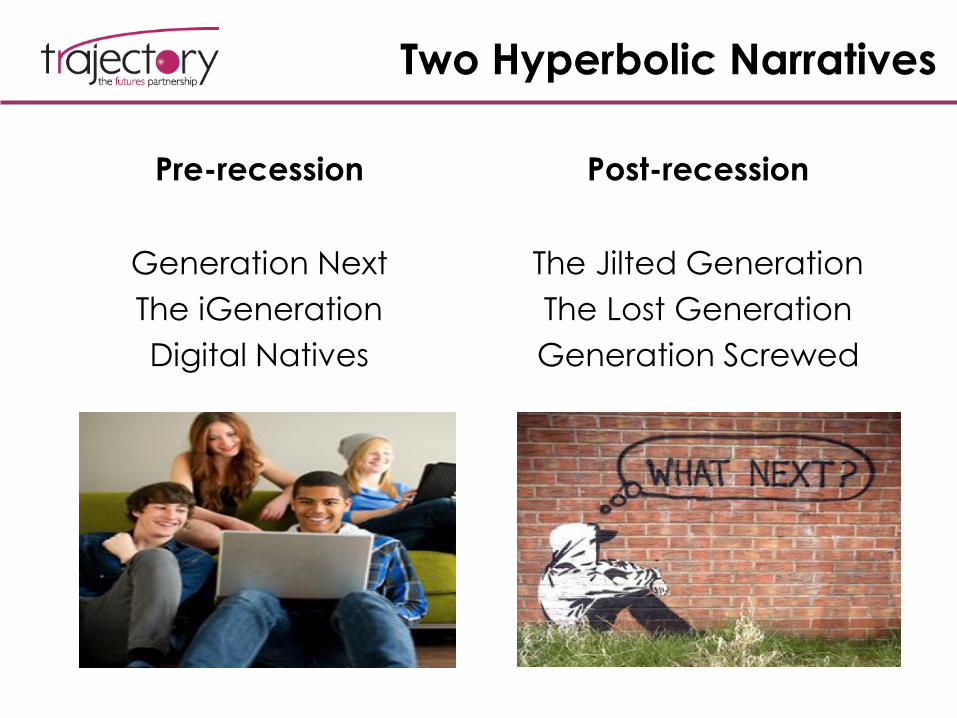
Two Hyperbolic Narratives
Pre-recession
Generation Next
The iGeneration
Digital Natives
Post-recession
The Jilted Generation
The Lost Generation
Generation Screwed
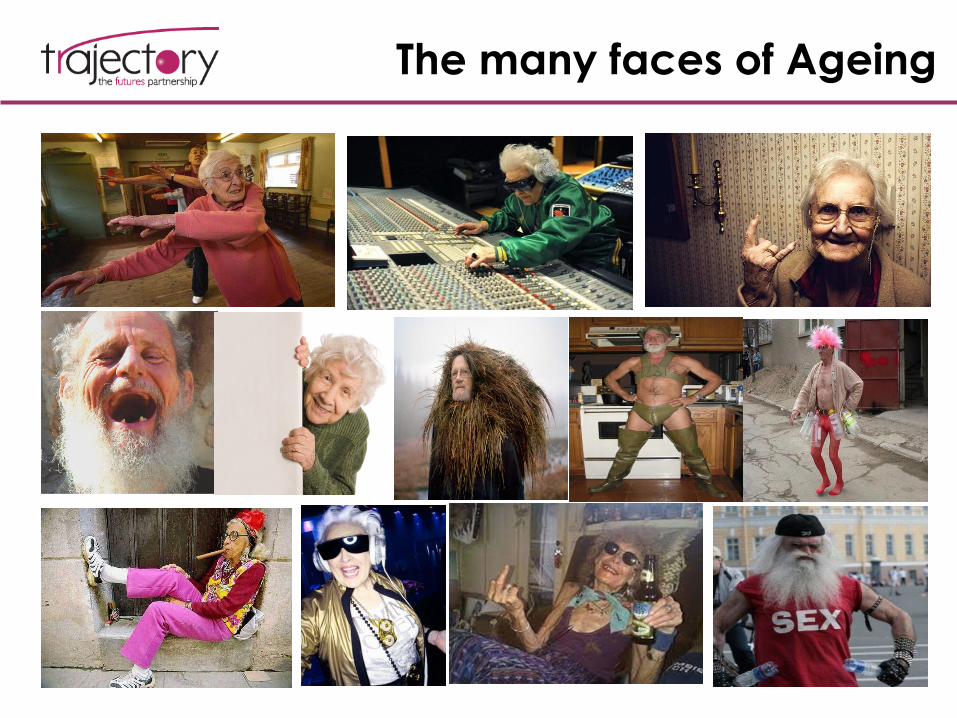
The many faces of Ageing
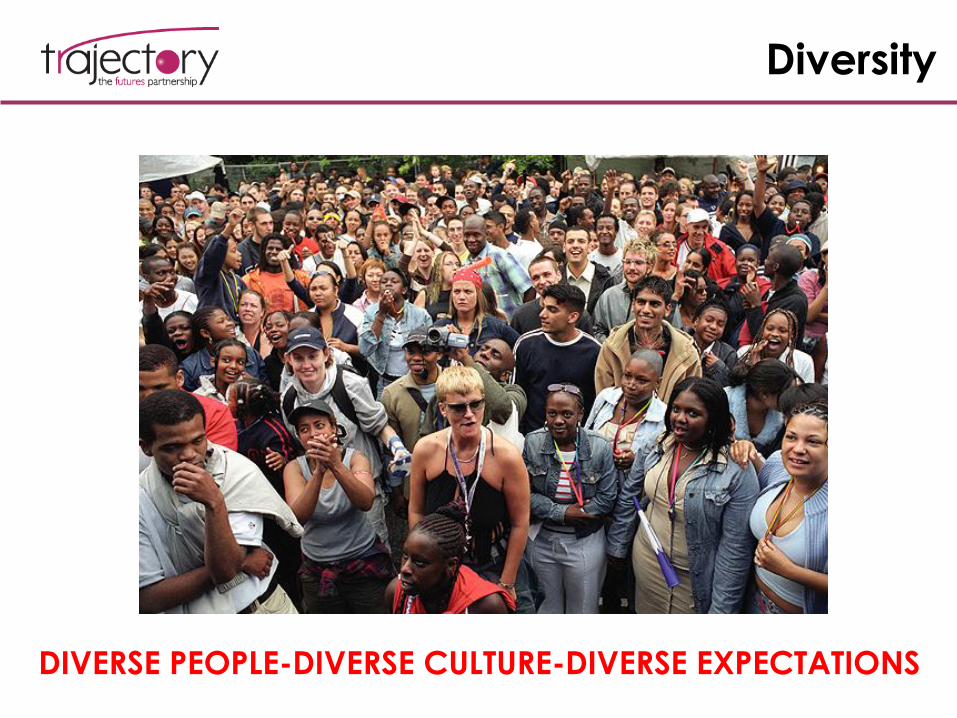
Diversity
DIVERSE PEOPLE-DIVERSE CULTURE-DIVERSE EXPECTATIONS
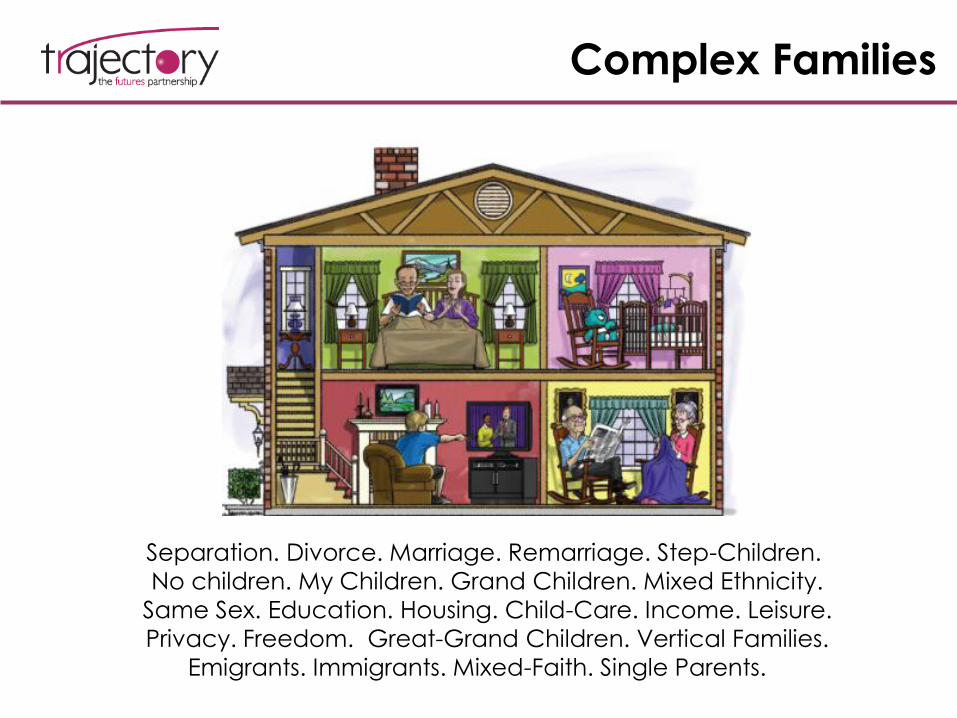
Complex Families
Separation. Divorce. Marriage. Remarriage. Step-Children.
No children. My Children. Grand Children. Mixed Ethnicity.
Same Sex. Education. Housing. Child-Care. Income. Leisure.
Privacy. Freedom. Great-Grand Children. Vertical Families.
Emigrants. Immigrants. Mixed-Faith. Single Parents.
CULTURAL CONTEXT
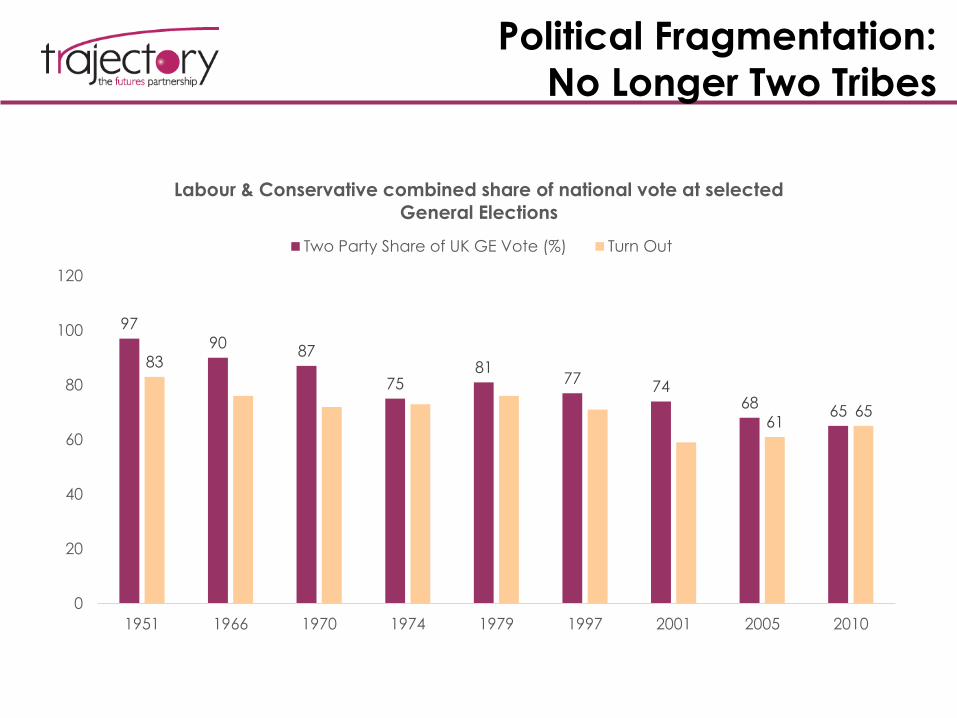
Political Fragmentation:
No Longer Two Tribes
97 90
87
75 81
77 74
68 65
83
61 65
0
20
40
60
80
100
120
1951 1966 1970 1974 1979 1997 2001 2005 2010
Labour & Conservative combined share of national vote at selected
General Elections
Two Party Share of UK GE Vote (%) Turn Out
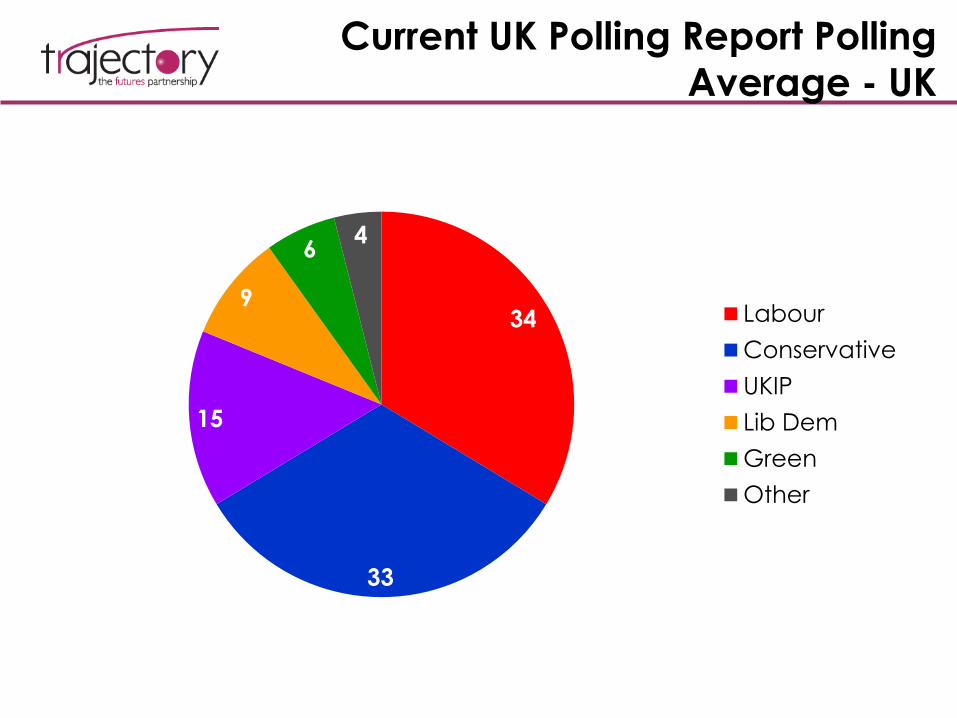
Current UK Polling Report Polling
Average - UK
34
33
15
9
6 4
Labour
Conservative
UKIP
Lib Dem
Green
Other
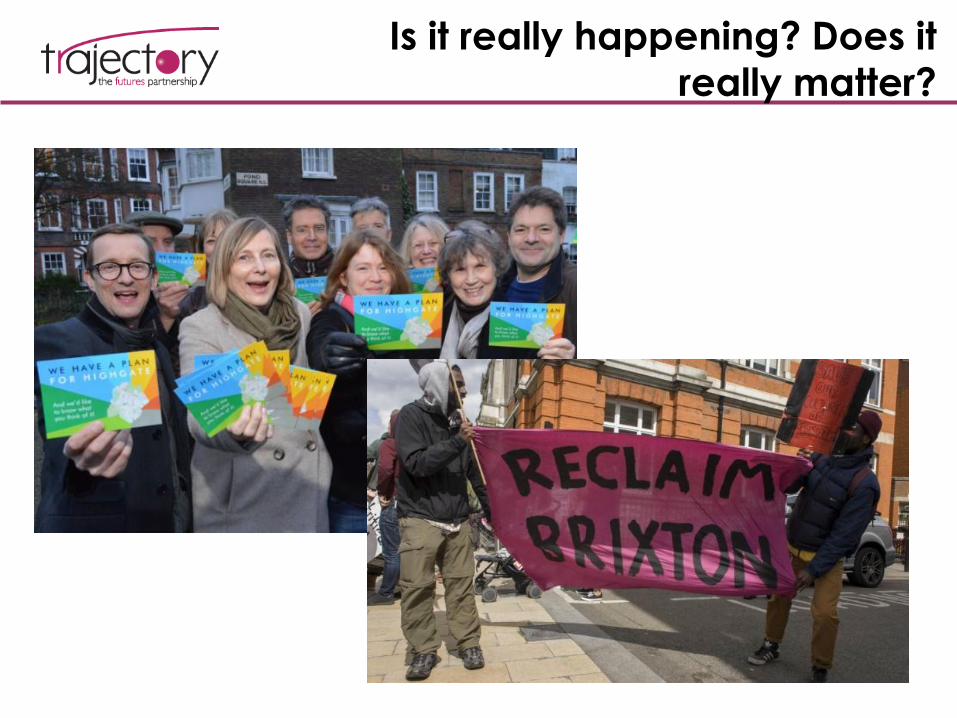
Is it really happening? Does it
really matter?
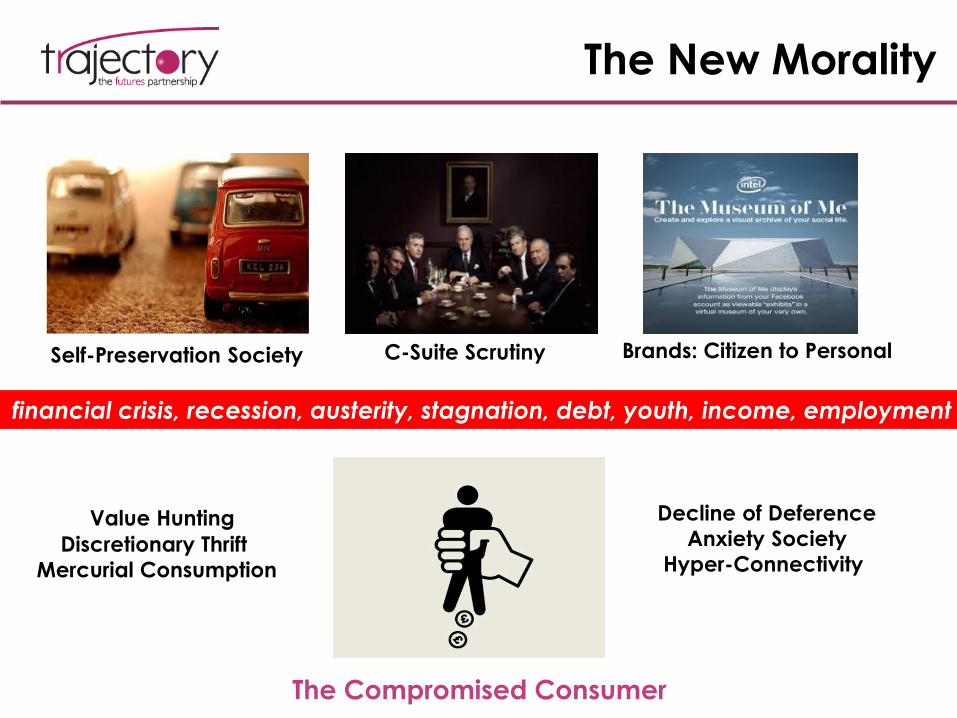
The New Morality
Self-Preservation Society C-Suite Scrutiny Brands: Citizen to Personal
The Compromised Consumer
Value Hunting
Discretionary Thrift
Mercurial Consumption
Decline of Deference
Anxiety Society
Hyper-Connectivity
financial crisis, recession, austerity, stagnation, debt, youth, income, employment

Mobile Everything

Hybrid Lives
Fast & Slow
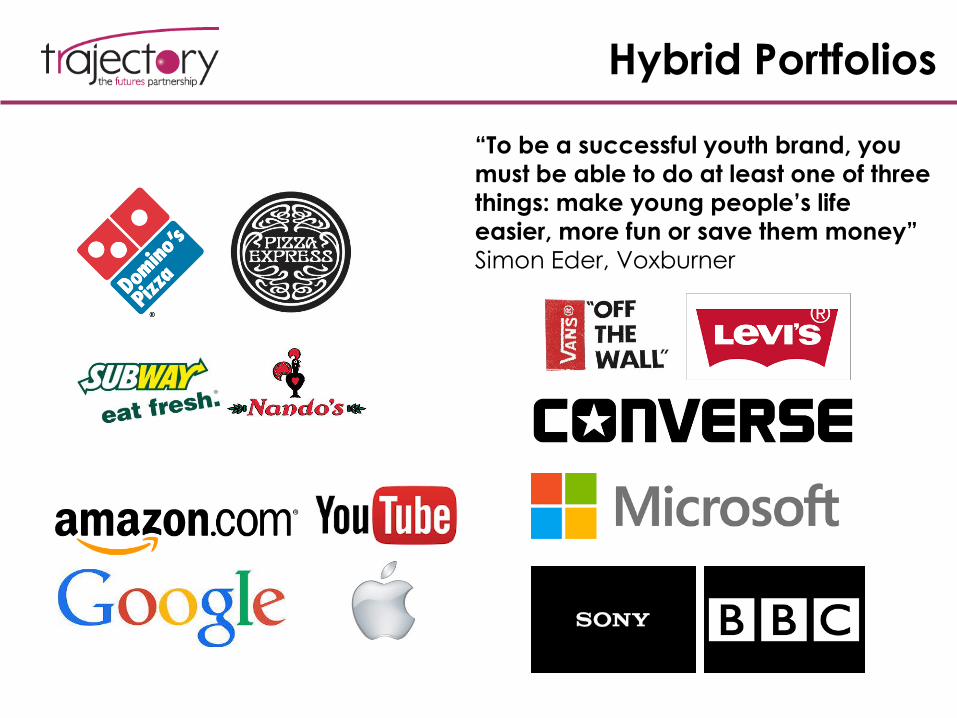
Hybrid Portfolios
“To be a successful youth brand, you
must be able to do at least one of three
things: make young people’s life
easier, more fun or save them money”
Simon Eder, Voxburner
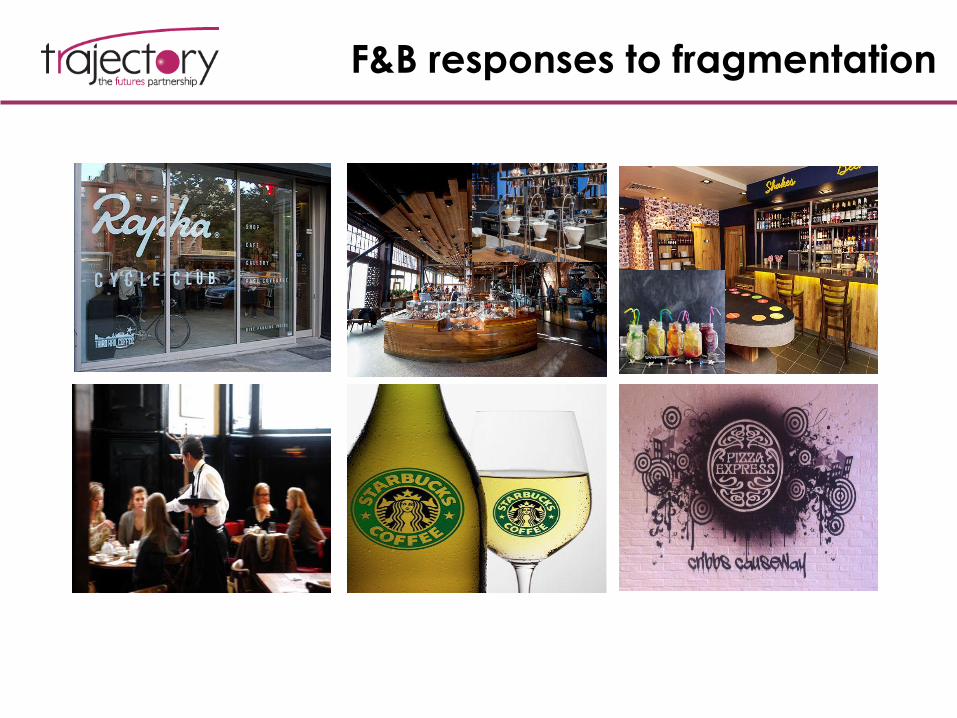
F&B responses to fragmentation
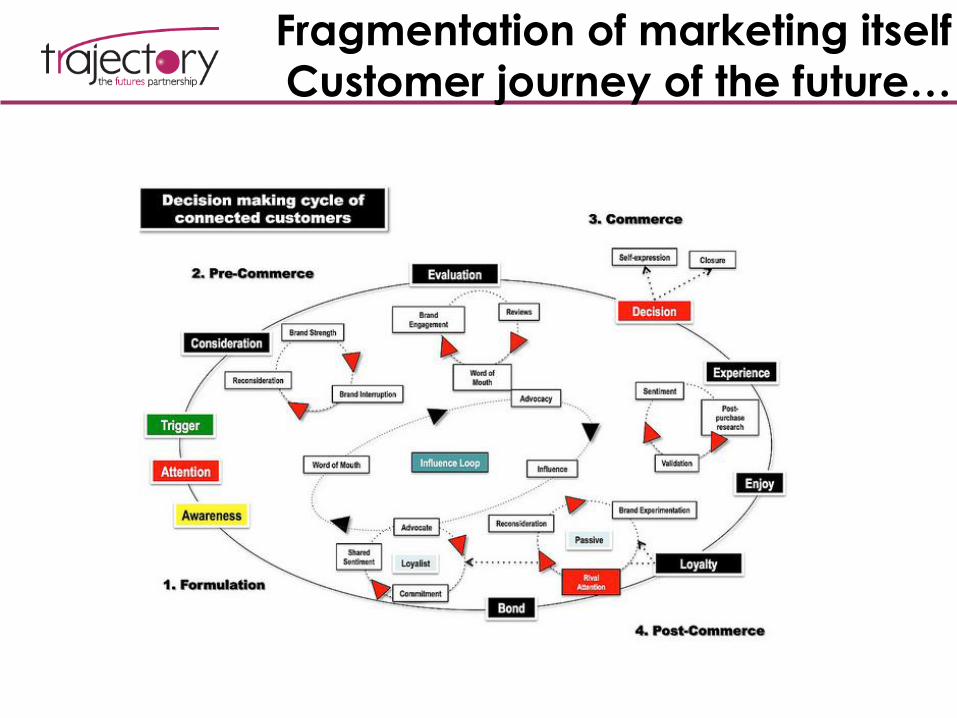
Fragmentation of marketing itself
Customer journey of the future…

Thank you
Trajectory Ltd Enterprise House
1-2 Hatfields
London SE1 9PG
T 020 3567 5801
#TrajectoryTweet
www.trajectorypartnership.com
Paul Flatters: Founder & CEO [email protected]


![ETSI ISG CIM · [JSON-LD] 20170608 Introduction to ISG CIM CIM-002-UC CIM -003 GAP CIM-004-APIprelim CIM-005-DPP CIM-001-AB ) CIM-006-MOD0. Timeline in ToR 02/2017 First General Meeting](https://img.pdfslide.net/doc/110x75/6002860fd1e0f63f360db5f2/etsi-isg-cim-json-ld-20170608-introduction-to-isg-cim-cim-002-uc-cim-003-gap.jpg)