Embed Size (px)
Citation preview

PERSUASION by DESIGNTHE NEXT LEVEL OF ENGAGEMENT IN DIGITAL SALES AIDS

Data Visualization
User Experience
Design an engaging experience that attracts and maintains attention for maximum absorption, & persuasion.
Reaching A Higher Degree of Effectiveness
75%

DATA VISUALIZATIONS

Humans are visually wired
Almost 50% of our brains are involved in visual processing
50%
Over 70% of all sensory receptors are in our eyes
70%

Data Visualizations help combat information overload
We receive 5x as much information daily as we did in 1986
1986 2014
1010001001
1010001001 0100010011 1010001001 1000100110 1010001001
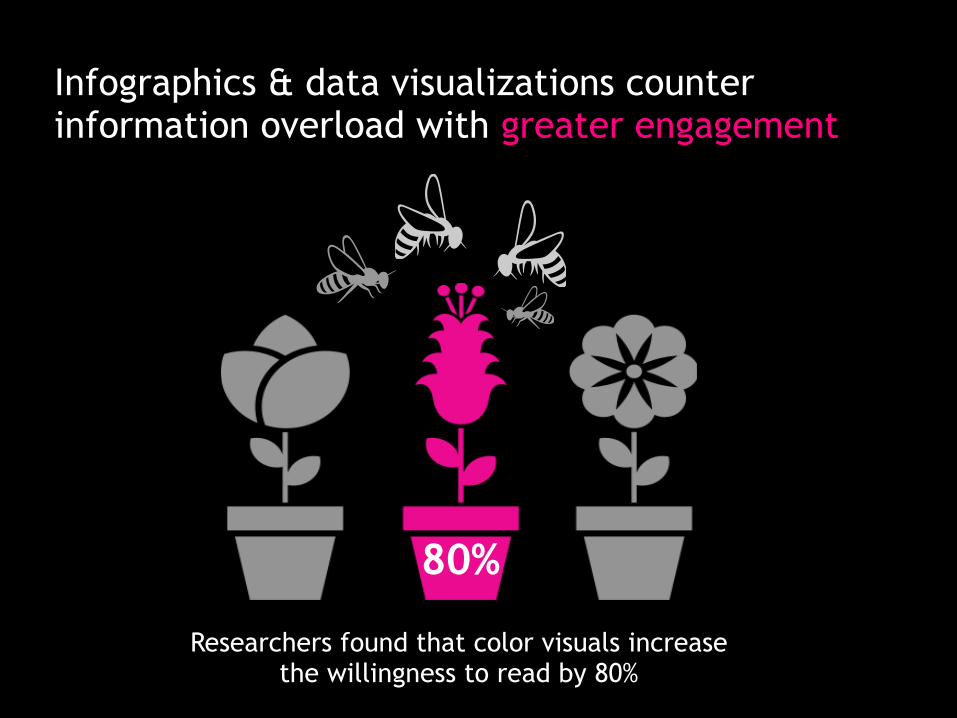
Infographics & data visualizations counter information overload with greater engagement
80%
Researchers found that color visuals increase the willingness to read by 80%

When it comes to comprehension rates of medicine labels:
!
There’s a 95% comprehension of labels with pictures
There’s a 70% comprehension of text only labels
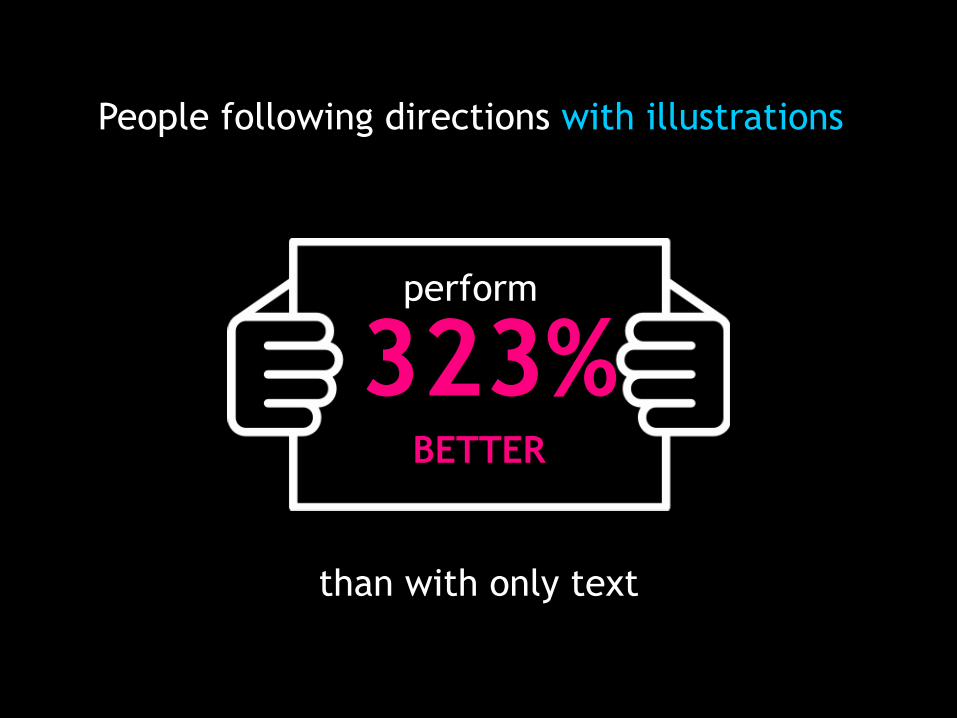
People following directions with illustrations
323%
than with only text
perform
BETTER

A Wharton School of Business Study Found
67%50%
50% of the audience were persuaded by a purely verbal presentation 67% of the audience were
persuaded by a presentation with graphics

ENHANCING THE USER EXPERIENCE

80%of what they SEE and DO
People Remember…
20%
10%
of what they READ
of what they HEAR

“Tell me and I forget, teach me and I may remember, involve me and I learn.”
- Ben Franklin

The combination of UX & ART with hands-on interactive content creates the most persuasive experiences
Interactive Video
Augmented Reality
Dynamic Data Builds
Onscreen Drawing
Data Capture
& Sharing