Embed Size (px)
Citation preview

Measuring Engagement in Native Advertising

Author:Kristopher KalishBidtellect
777 East Atlantic Ave, Suite 312 Delray Beach, FL 33483
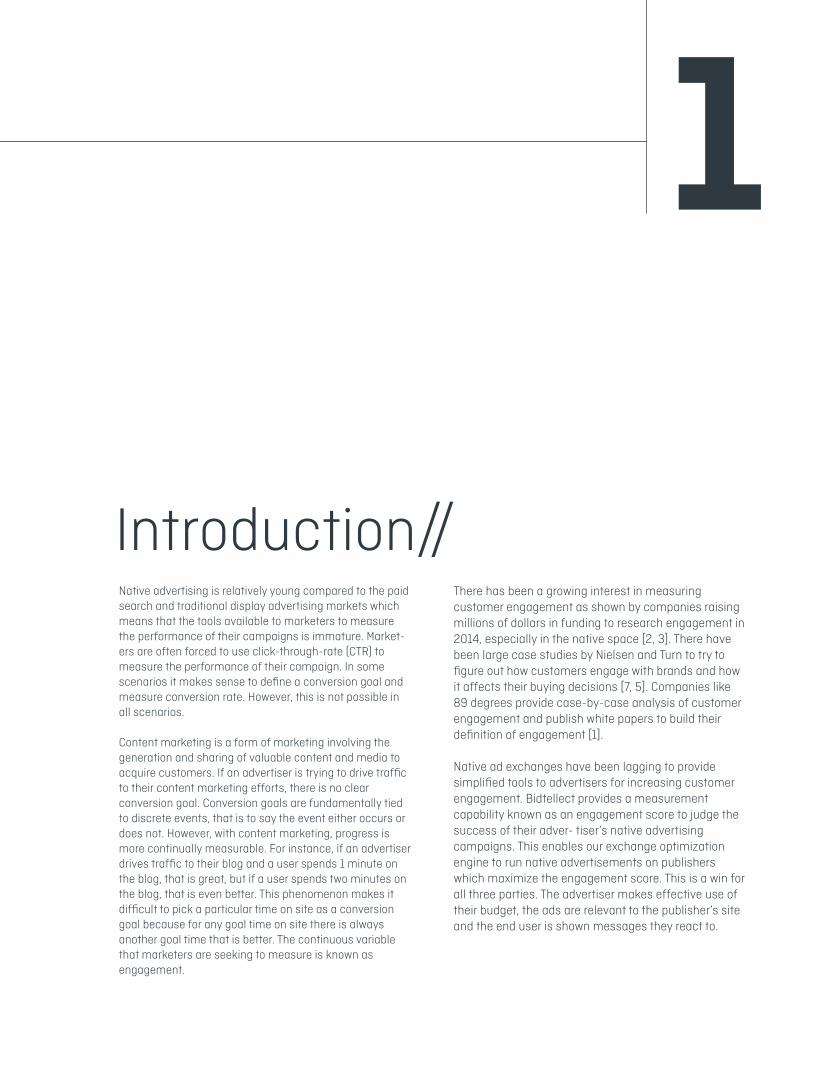
Introduction//Native advertising is relatively young compared to the paid search and traditional display advertising markets which means that the tools available to marketers to measure the performance of their campaigns is immature. Market-ers are often forced to use click-through-rate (CTR) to measure the performance of their campaign. In some scenarios it makes sense to define a conversion goal and measure conversion rate. However, this is not possible in all scenarios.
Content marketing is a form of marketing involving the generation and sharing of valuable content and media to acquire customers. If an advertiser is trying to drive traffic to their content marketing efforts, there is no clear conversion goal. Conversion goals are fundamentally tied to discrete events, that is to say the event either occurs or does not. However, with content marketing, progress is more continually measurable. For instance, if an advertiser drives traffic to their blog and a user spends 1 minute on the blog, that is great, but if a user spends two minutes on the blog, that is even better. This phenomenon makes it difficult to pick a particular time on site as a conversion goal because for any goal time on site there is always another goal time that is better. The continuous variable that marketers are seeking to measure is known as engagement.
There has been a growing interest in measuring customer engagement as shown by companies raising millions of dollars in funding to research engagement in 2014, especially in the native space [2, 3]. There have been large case studies by Nielsen and Turn to try to figure out how customers engage with brands and how it affects their buying decisions [7, 5]. Companies like 89 degrees provide case-by-case analysis of customer engagement and publish white papers to build their definition of engagement [1].
Native ad exchanges have been lagging to provide simplified tools to advertisers for increasing customer engagement. Bidtellect provides a measurement capability known as an engagement score to judge the success of their adver- tiser’s native advertising campaigns. This enables our exchange optimization engine to run native advertisements on publishers which maximize the engagement score. This is a win for all three parties. The advertiser makes effective use of their budget, the ads are relevant to the publisher’s site and the end user is shown messages they react to.
1
RelatedWork//Paid search marketers may be familiar with the “Quality Score” on Google Ad Words and Bing Ads. These methods are a function of your ad’s performance on the network and the contextual relevancy of the landing page to the user’s search query. Relevancy is established by crawling the landing page and applying proprietary analysis to assign keywords to it. This makes Quality Score “exchange-centric” in that it is calculated from the performance of the campaign on the exchange and contextual relevancy is established from keywords originating from the exchange. The engagement score presented here differs in that it advertiser-centric; It only captures the performance of your campaign once the user has been acquired from the exchange.
2
The Engagement Score//The engagement score is a number ranging from 0 to 10 where 0 corresponds to the least customer engagement and 10 represents the highest level of engagement. It is derived from four variables measured from the behavior of users once they land on the advertiser’s site. The advertiser places our JavaScript snippet on their landing page and any other pages they wish to track. When a user clicks an ad and lands on their site, this is considered a visit and a page view. If the user clicks a second page, they have contributed two page views and one visit. If the user closes the browser and revisits that is considered another visit. If a user visits the page and leaves within five seconds, that is considered one visit, one page view, and one bounce. The time on site is measured as the difference between the first event and last event in a visit measured in minutes. For example if a user clicks an ad, lands on the advertiser’s page, reads it for 1 minute, then clicks a link to another article and reads that for 30 seconds before leaving the time on site for that visit is 1.5 minutes.
The engagement score is a function of the four variables described above: time on site, page views, number of visitors, and bounces. For reference the variables are explained in Table 1.
Metric Abv. Description
Table 1: The four variables used to calculate the engagement score
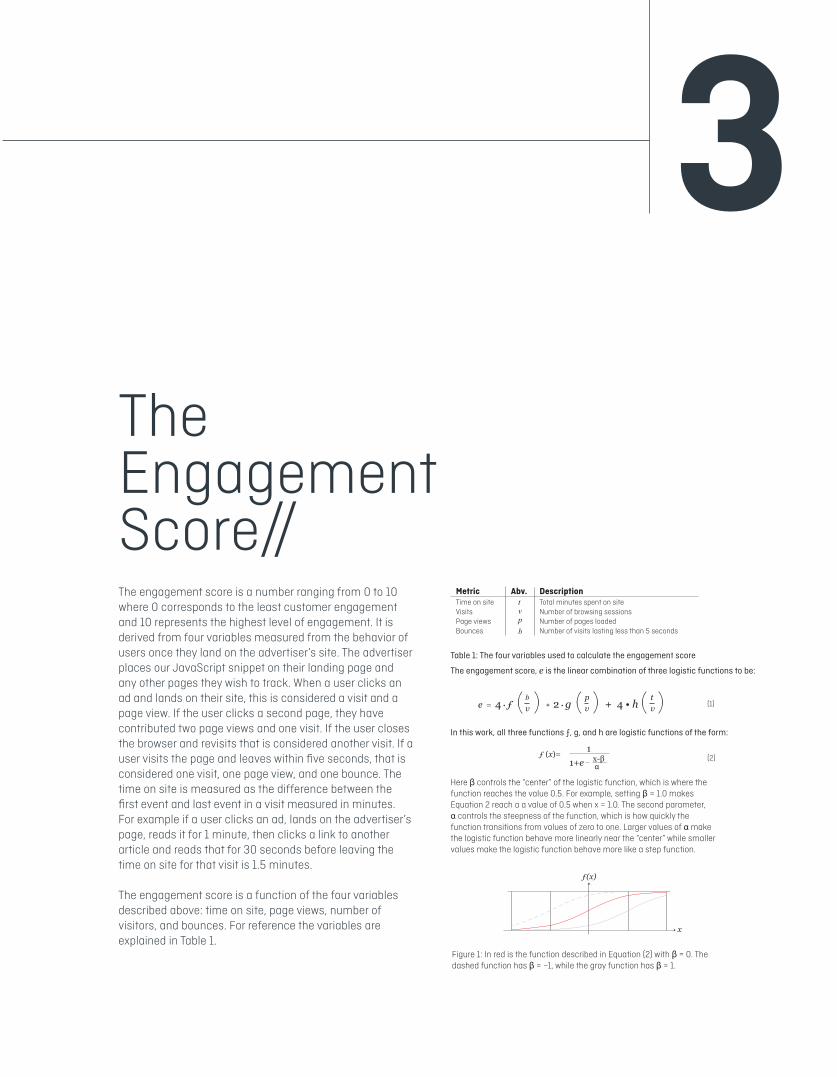
The engagement score, e is the linear combination of three logistic functions to be:
t
In this work, all three functions ƒ, g, and h are logistic functions of the form:
e = 4 • ƒ ( ) + 2 • g ( ) + 4 • h ( ) bv
pv
tv
Time on siteVisitsPage viewsBounces
Total minutes spent on siteNumber of browsing sessionsNumber of pages loadedNumber of visits lasting less than 5 seconds
Here β controls the “center” of the logistic function, which is where thefunction reaches the value 0.5. For example, setting β = 1.0 makes Equation 2 reach a a value of 0.5 when x = 1.0. The second parameter, α controls the steepness of the function, which is how quickly the function transitions from values of zero to one. Larger values of α make the logistic function behave more linearly near the “center” while smaller values make the logistic function behave more like a step function.
Figure 1: In red is the function described in Equation (2) with β = 0. The dashed function has β = −1, while the gray function has β = 1.
ƒ(x)
x
(1)
(2)1
1+eƒ (x)= x-β
α
vpb
Native advertising is relatively young compared to the paid search and traditional display advertising markets which means that the tools available to marketers to measure the performance of their campaigns is immature. Market-ers are often forced to use click-through-rate (CTR) to measure the performance of their campaign. In some scenarios it makes sense to define a conversion goal and measure conversion rate. However, this is not possible in all scenarios.
Content marketing is a form of marketing involving the generation and sharing of valuable content and media to acquire customers. If an advertiser is trying to drive traffic to their content marketing efforts, there is no clear conversion goal. Conversion goals are fundamentally tied to discrete events, that is to say the event either occurs or does not. However, with content marketing, progress is more continually measurable. For instance, if an advertiser drives traffic to their blog and a user spends 1 minute on the blog, that is great, but if a user spends two minutes on the blog, that is even better. This phenomenon makes it difficult to pick a particular time on site as a conversion goal because for any goal time on site there is always another goal time that is better. The continuous variable that marketers are seeking to measure is known as engagement.
There has been a growing interest in measuring customer engagement as shown by companies raising millions of dollars in funding to research engagement in 2014, especially in the native space [2, 3]. There have been large case studies by Nielsen and Turn to try to figure out how customers engage with brands and how it affects their buying decisions [7, 5]. Companies like 89 degrees provide case-by-case analysis of customer engagement and publish white papers to build their definition of engagement [1].
Native ad exchanges have been lagging to provide simplified tools to advertisers for increasing customer engagement. Bidtellect provides a measurement capability known as an engagement score to judge the success of their adver- tiser’s native advertising campaigns. This enables our exchange optimization engine to run native advertisements on publishers which maximize the engagement score. This is a win for all three parties. The advertiser makes effective use of their budget, the ads are relevant to the publisher’s site and the end user is shown messages they react to.
3
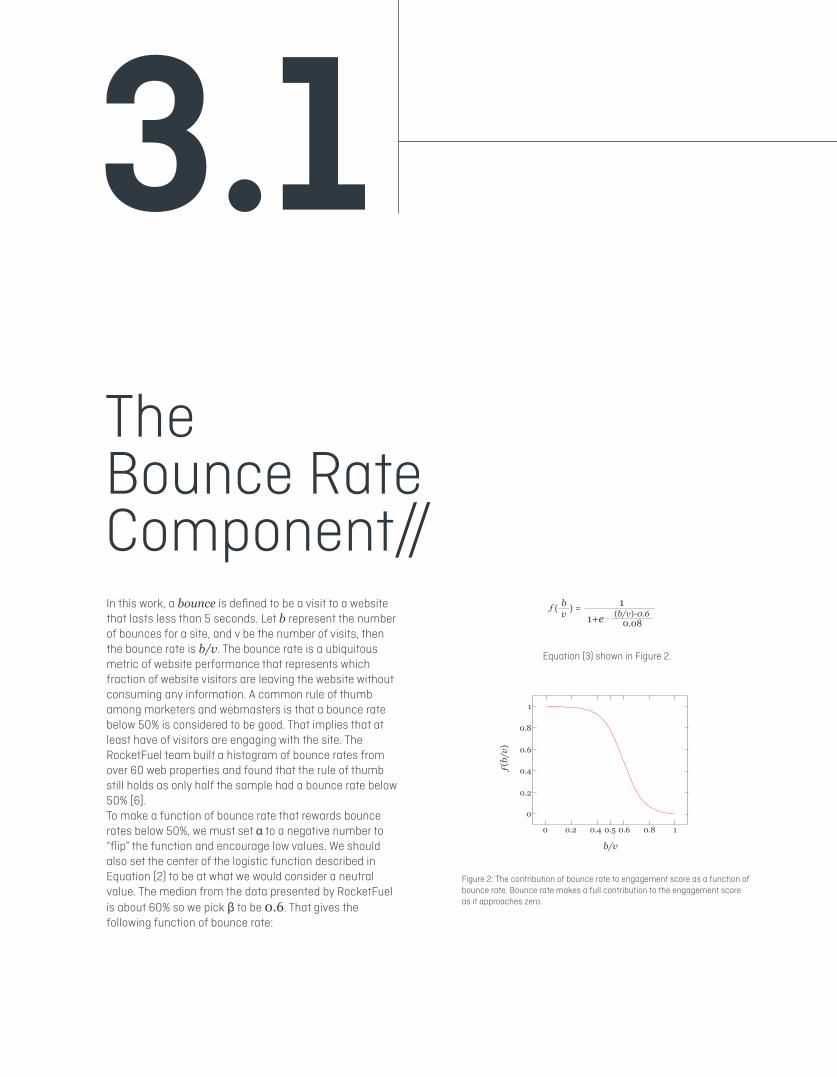
In this work, a bounce is defined to be a visit to a website that lasts less than 5 seconds. Let b represent the number of bounces for a site, and v be the number of visits, then the bounce rate is b/v. The bounce rate is a ubiquitous metric of website performance that represents which fraction of website visitors are leaving the website without consuming any information. A common rule of thumb among marketers and webmasters is that a bounce rate below 50% is considered to be good. That implies that at least have of visitors are engaging with the site. The RocketFuel team built a histogram of bounce rates from over 60 web properties and found that the rule of thumb still holds as only half the sample had a bounce rate below 50% [6].To make a function of bounce rate that rewards bounce rates below 50%, we must set α to a negative number to “flip” the function and encourage low values. We should also set the center of the logistic function described in Equation (2) to be at what we would consider a neutral value. The median from the data presented by RocketFuel is about 60% so we pick β to be 0.6. That gives the following function of bounce rate:
The Bounce RateComponent//
Equation (3) shown in Figure 2.
11+e (b/v)-0.6
0.08
ƒ( )bv =
Figure 2: The contribution of bounce rate to engagement score as a function of bounce rate. Bounce rate makes a full contribution to the engagement score as it approaches zero.
ƒ(b/
v)
b/v
0
0
0.2
0.2
0.4
0.4
0.5 0.6
0.6
0.8
0.8
1
1
3.1
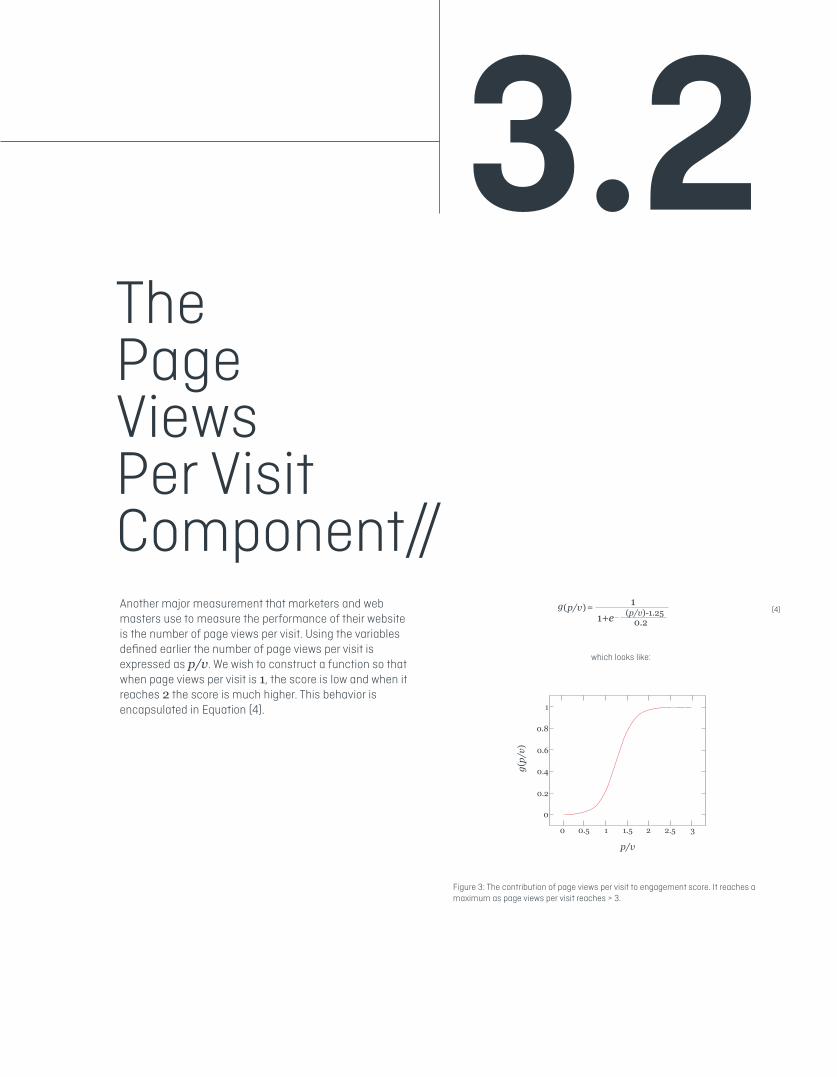
Figure 3: The contribution of page views per visit to engagement score. It reaches a maximum as page views per visit reaches > 3.
3.2The Page Views Per Visit Component//Another major measurement that marketers and web masters use to measure the performance of their website is the number of page views per visit. Using the variables defined earlier the number of page views per visit is expressed as p/v. We wish to construct a function so that when page views per visit is 1, the score is low and when it reaches 2 the score is much higher. This behavior is encapsulated in Equation (4).
which looks like:
g(p/
v)
p/v
0
0
0.5
0.2
1
0.4
1.5 2
0.6
2.5
0.8
3
1
11+e (p/v)-1.25
0.2
g( )p/v = (4)
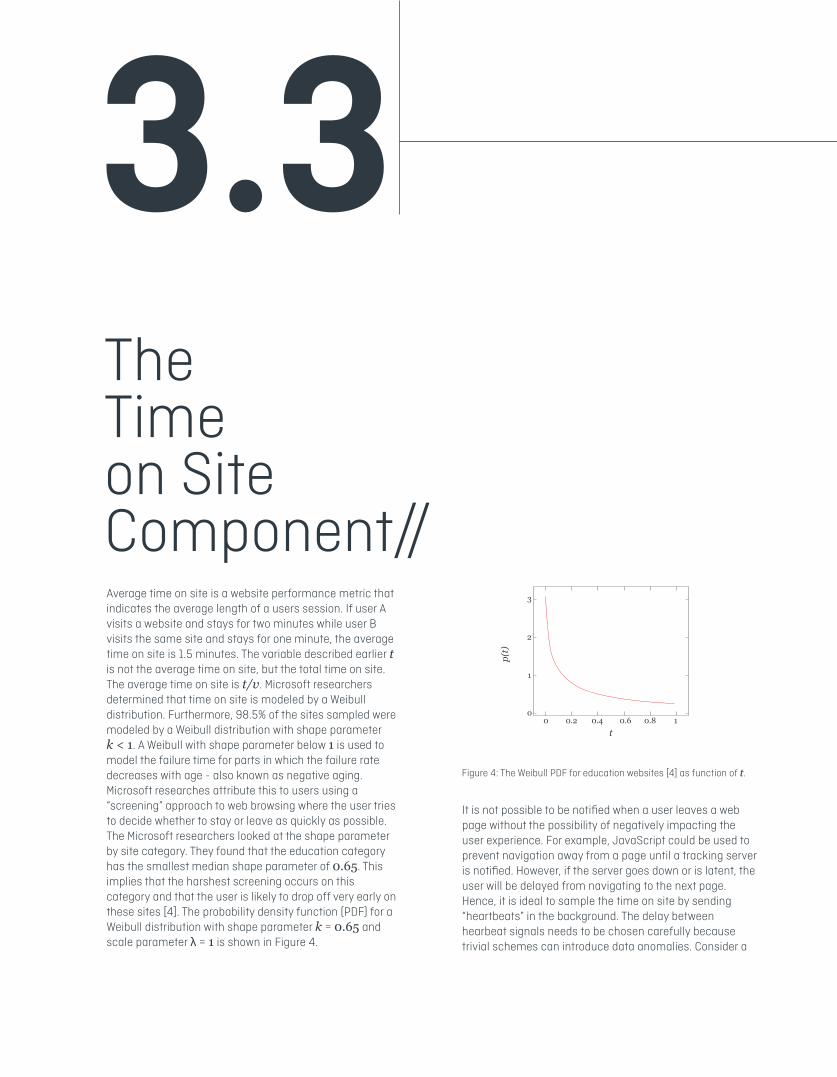
Average time on site is a website performance metric that indicates the average length of a users session. If user A visits a website and stays for two minutes while user B visits the same site and stays for one minute, the average time on site is 1.5 minutes. The variable described earlier t is not the average time on site, but the total time on site. The average time on site is t/v. Microsoft researchers determined that time on site is modeled by a Weibull distribution. Furthermore, 98.5% of the sites sampled were modeled by a Weibull distribution with shape parameter k < 1. A Weibull with shape parameter below 1 is used to model the failure time for parts in which the failure rate decreases with age - also known as negative aging. Microsoft researches attribute this to users using a “screening” approach to web browsing where the user tries to decide whether to stay or leave as quickly as possible. The Microsoft researchers looked at the shape parameter by site category. They found that the education category has the smallest median shape parameter of 0.65. This implies that the harshest screening occurs on this category and that the user is likely to drop off very early on these sites [4]. The probability density function (PDF) for a Weibull distribution with shape parameter k = 0.65 and scale parameter λ = 1 is shown in Figure 4.
It is not possible to be notified when a user leaves a web page without the possibility of negatively impacting the user experience. For example, JavaScript could be used to prevent navigation away from a page until a tracking server is notified. However, if the server goes down or is latent, the user will be delayed from navigating to the next page. Hence, it is ideal to sample the time on site by sending “heartbeats” in the background. The delay between hearbeat signals needs to be chosen carefully because trivial schemes can introduce data anomalies. Consider a
The Time on Site Component//
3.3
Figure 4: The Weibull PDF for education websites [4] as function of t.
p(t)
t0
00.2
1
0.4 0.6
2
0.8 1
3
scenario where heartbeats are sent every 10 seconds. Since most visitors drop off quickly, it would appear that most users were on the site for 0 seconds. In reality, it takes these users several seconds to screen the website and leave.
Intuitively, it is understood that we should send heartbeats at a fast rate initially and progressively less frequently the longer a user is on a page. To mathematically formulate this, we need to make a decision on exactly what is an acceptable coarseness. In this work we decided that the sampling frequency should bet done so that an equal part of the browser population falls between hearbeats. This prevents any part of the population from exerting more influence of the time on site variable than another.In order to break the population into equally sized intervals, we must con- sider the cumulative distribution function (CDF) of the Weibull distribution which is presented in Equation (5).
To send heartbeats that capture equally sized groups we must send heartbeats at equally spaced quantiles of the CDF. Let ∆ [0,1] be the quantile size. We send a heartbeat i at F−1(i∆) seconds from the beginning of a page view.Picking the quantile size ∆ = 0.01 means approxi-mately one percent of users will drop off between each heartbeat. After sampling time on site, we must find a function of time on site that controls its contribution to the
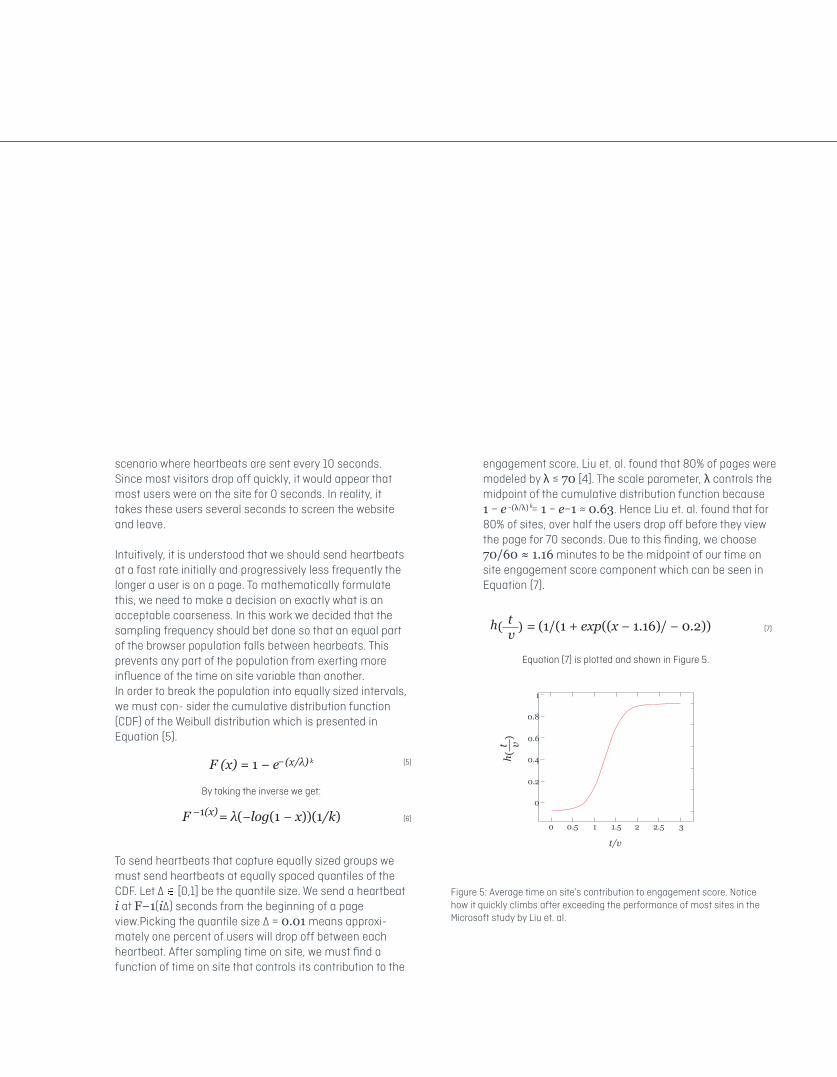
Figure 5: Average time on site’s contribution to engagement score. Notice how it quickly climbs after exceeding the performance of most sites in the Microsoft study by Liu et. al.
Equation (7) is plotted and shown in Figure 5.
t/v
0
0
0.5
0.2
1
0.4
1.5 2
0.6
2.5
0.8
3
1
h (
)t v
By taking the inverse we get:
(5)
(6)
F (x) = 1 − e (x/λ) k−
F = λ(−log(1 − x))(1/k)−1(x)
engagement score. Liu et. al. found that 80% of pages were modeled by λ ≤ 70 [4]. The scale parameter, λ controls the midpoint of the cumulative distribution function because 1 − e = 1 − e−1 ≈ 0.63. Hence Liu et. al. found that for 80% of sites, over half the users drop off before they view the page for 70 seconds. Due to this finding, we choose 70/60 ≈ 1.16 minutes to be the midpoint of our time on site engagement score component which can be seen in Equation (7).
h( )tv = (1/(1 + exp((x − 1.16)/ − 0.2)) (7)
−(λ/λ) k
This work presented an algorithm for measuring customer engagement with a single number ranging from 0 to 10. It described a way to accurately sample time on site based on the Weibull distribution to control discretization error. The Bidtellect platform is able to measure which suppliers contributed to the score and selectively run advertising campaigns on supply which maximizes the engagement score. By optimizing for engagement score we satisfy publishers and advertisers simultaneously. Publishers win because we only run ads that their users like and engage with. Advertisers win because the users they receive from their campaign are interacting with their site.
Conclusion and Future Work//
4
[1] 89 Degrees. Engagement scoring: Are you ready? 89degrees.com, 2013.
[2] Anthony Ha. Real-time analytics startup chartbeat adds data for native ads,raises $3m more. Tech Crunch, May 2014.
[3] Anthony Ha. Simplereach raises $9m to measure content marketing and native ads. Tech Crunch, July 2014.
[4] Chao Liu, Ryen W. White, and Susan Dumais. Understanding web brows- ing behaviors through weibull analysis of dwell time. In Proceedings of the 33rd International ACM SIGIR Conference on Research and Development in Information Retrieval, SIGIR ’10, pages 379–386, New York, NY, USA, 2010. ACM.
[5] Nielsen. 2013 nielsen national cross-media engagement study. Newspaper Association of America, April 2013.
[6] RocketFuel. What’s the average bounce rate for a website? http://www.gorocketfuel.com, February 2014.
[7] Turn. The new rules of engagement measuring the power of social currency. Forbes Insights, 2012.
To send heartbeats that capture equally sized groups we must send heartbeats at equally spaced quantiles of the CDF. Let ∆ [0,1] be the quantile size. We send a heartbeat i at F−1(i∆) seconds from the beginning of a page view.Picking the quantile size ∆ = 0.01 means approxi-mately one percent of users will drop off between each heartbeat. After sampling time on site, we must find a function of time on site that controls its contribution to the
References//


![Native...Eigenschaften von Native Advertising im Vergleich mit Display Werbung Native Advertising bringt dem Leser den meisten Nutzen „Wenn Sie [Native Advertising] mit Werbung vergleichen….“](https://img.pdfslide.net/doc/110x75/5f0d65997e708231d43a2660/native-eigenschaften-von-native-advertising-im-vergleich-mit-display-werbung.jpg)