Embed Size (px)
Citation preview
Mobile Network Infrastructure Sharing
Industry overview and Coleago’s approach
Chris Buist, Director
May 2016

© copyright Coleago 2016
Data traffic and global initiatives to provide rural broadband coverage will be the future drivers
JVs between MNOs and tower sale-and-leaseback deals have taken
off since 2009. In the last few years some multinational MNOs have
started to establish captive tower companies. Sharing has also led
some shareholders to consider consolidation.
Looking forwards, new trends are likely to be rural/remote
infrastructure sharing and increased spectrum sharing. Technologies
such as NFV and SDN may open up new sharing opportunities.
To identify potential sharing options, operators need to consider five
dimensions: technology scope, geographical scope, architectural
scope, potential partners and sourcing.
Ultimately network sharing is driven by the need to maximise
Enterprise Value. The major benefit from network sharing is a net
reduction in network CapEx and OpEx, usually in the range from 10-
40% of the in-scope costs dependent on the sharing option. As with
any major programme, there are numerous risks that need to be
analysed and, where possible, mitigated.
1
Mobile Network Infrastructure Sharing
Network sharing has grown rapidly since 2009
There is no time to lose because there is clear evidence of a first-
mover advantage, or at least a last-mover disadvantage. For
passive/active sharing JVs, it is better to choose your preferred
partner than be handed a partner by default or, in the case of a three-
player market, left with no partner. Similarly, information from
completed tower sales shows that the first to market will command a
higher price than the followers.
Coleago’s approach is applicable regardless of the sharing option
selected. It is designed to work as well for a tower deal with a
TowerCo as it does for an active RAN share with another MNO.
Typically, it takes between 9 and 15 months for the first three phases
depending on the sharing option, regulatory approval(s), the need to
transfer assets and the willingness/ambition of the partners. The
Transformation phase may take several years to deliver all the
savings.
During the last decade our consultants have built up experience
across every type of sharing deal and all phases. We provide a
complete range of services to support or lead your project team
throughout the process.
First-mover advantage – operators need to act
Executive Summary
Mobile data traffic is
doubling every two
years. Revenues are
growing much more
slowly or even
falling. Financial
performance will
suffer unless
operators take action
to share infra-
structure or enter
into M&A.
In many emerging
markets, sharing is
also being driven by
limited spectrum
availability or
government ambition
to improve rural
broadband services
– the latter driven by
a plethora of global
initiatives led by the
UN, NGOs and
commercial entities
such as the GSMA.
• Internal & external analysis
• Business case
• Approach partner(s)
• Negotiate Heads of Agreement
Strategy
• Regulatory approval
• Design “To-Be”
• NegotiateAgreement(s)
• Conduct due diligence
Negotiation• Plan
• Establish JV
• Transfer staff, assets
• Implement processes, systems
Transition
• Depends on sharing scope
Transformation
© copyright Coleago 2016 2
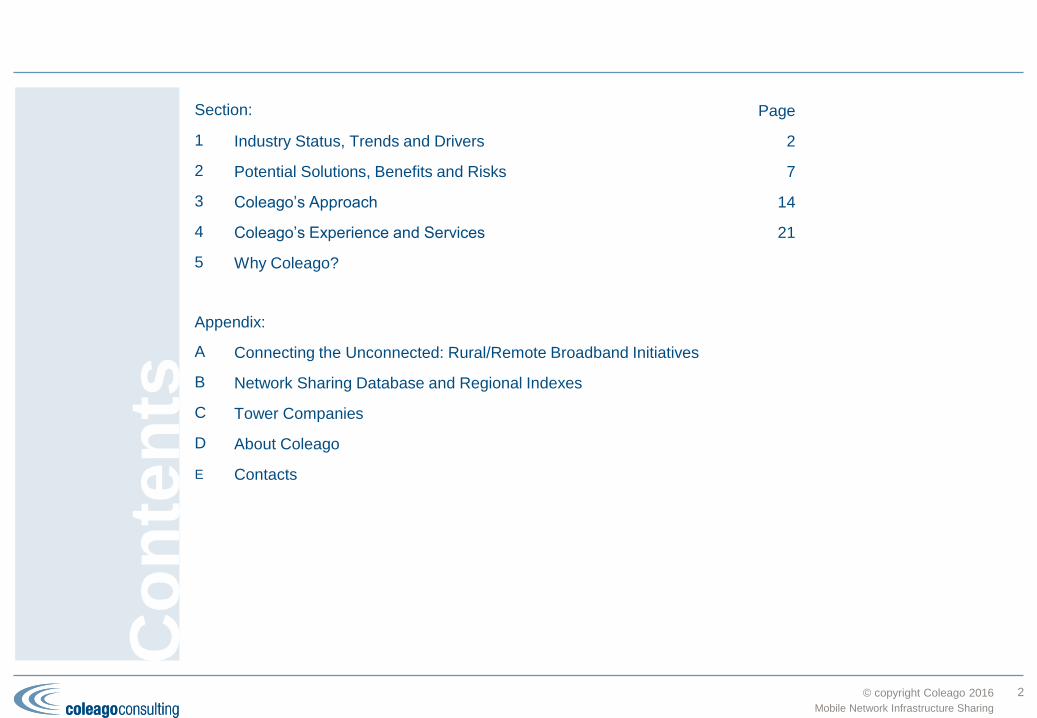
Section: Page
1 Industry Status, Trends and Drivers 2
2 Potential Solutions, Benefits and Risks 7
3 Coleago’s Approach 14
4 Coleago’s Experience and Services 21
5 Why Coleago?
Appendix:
A Connecting the Unconnected: Rural/Remote Broadband Initiatives
B Network Sharing Database and Regional Indexes
C Tower Companies
D About Coleago
E Contacts
Co
nte
nts
Mobile Network Infrastructure Sharing
© copyright Coleago 2016
Global situation. Current and future trends. Key drivers.
Industry status, trends and drivers
3
1Mobile Network Infrastructure Sharing

© copyright Coleago 2016
Network sharing has grown rapidly since 2009
4
Mobile Network Infrastructure Sharing
1. Industry status, trends and drivers
Countries shaded
according to deal
with “deepest” extent
of sharing.
Status is based on
public
announcements to
end-2015.
Excludes national
roaming, MVNOs,
transmission-only,
captive tower
companies and
informal or
unannounced site
sharing deals.

© copyright Coleago 2016
Current and future trends in mobile network sharing
Current trends
Mobile network sharing is not new. It has been around for decades in one form or another, starting with national roaming and site sharing –usually encouraged or mandated by regulators to help new entrants.
Four trends have emerged since the millennium:
Network sharing Joint Ventures (JVs) between MNOs
Whereas site sharing started off in many markets as a mutual exchange involving a small percentage of sites, a JV can go much further to maximise the number of shared sites and cost savings, typically 25-40% of the in-scope costs. Furthermore the scope of radio access network (RAN) sharing has been extending from passive to active (MORAN) and, in some cases, to spectrum pooling/sharing (MOCN).
Tower sale-and-lease-back deals
By the end of 2015, some 45 operators had sold their towers to third parties (or formed joint ventures) and leased them back. The majority of these transactions have been in Africa but similar deals are now taking place in all other regions. Given their long-term secure cash flows and growth prospects, tower companies are attracting considerable Private Equity (PE) investment thereby facilitating further deals.
Captive tower companies
Separating passive infrastructure into a subsidiary may be beneficial from an operational efficiency perspective. It may also open up a range of alternative financing options including joint ventures, stock exchange flotation or eventually a sale. Recent examples include Airtel Africa, América Móvil (Telesites), Axiata (edotco), Telefónica (Telxius) and Telecom Italia (INWIT). It may explain some of the recent drop-off in sale-and-lease-back deals.
In-market consolidation
Undoubtedly discussions about sharing are leading some shareholders to be more radical and consider consolidation; Coleago believes that most markets will end up within the next five years with only three mobile operators and two (shared) RANs.
Future trends
Three further trends are expected to emerge over the next five years:
Rural/remote infrastructure sharing
Most MNOs have finished rolling out 2G, and in some cases 3G, coverage as far as is financially feasible. Any further roll-out will be slow and depend on GDP growth and unit cost reductions. Most governments have now developed national broadband plans, encouraged by the ITU and the Broadband Commission, that include objectives to provide broadband access to rural areas (see next page). Usually the only cost-effective solution to achieve such an objective is 3G or 4G infrastructure shared between two or more MNOs using active sharing or roaming.
Network Functions Virtualisation (NFV) and Software-Defined Networking (SDN)
NFV and SDN are emerging complementary technology developments that might enable and encourage further types of network sharing in the future, depending on how standards and OEM products/services evolve. In particular they may enable much greater core network sharing.
Spectrum sharing
There are currently 14 spectrum pooling/sharing (MOCN) joint ventures between MNOs. With mobile data traffic doubling every two years, MOCN deals are likely to increase but NRAs will still be under considerable pressure to release more spectrum. Some NRAs such as the FCC in the USA and Ofcom in the UK are evaluating advanced spectrum sharing using “lightly licensed” or unlicensed spectrum.
5
Mobile Network Infrastructure Sharing
1. Industry status, trends and drivers
More than 60% of
the deals to date are
RAN-sharing joint
ventures that
maximise savings.
Tower companies
are expanding
rapidly with the
backing of PE funds
but in the last few
years MNOs have
also started to
establish captive
tower companies.
Of the future trends,
rural/remote sharing
is probably the most
significant given the
sums involved and
the plethora of global
initiatives led by UN
bodies such as the
ITU, UNESCO and
the World Bank.

© copyright Coleago 2016
Drivers: EBITDA pressure, spectrum scarcity and government policy
What is driving the huge increase in sharing, tower sales and
consolidation? The uptick in sharing deals since 2009 has been due
almost exclusively to EBITDA pressure but this is set to change with
the global initiatives to provide rural/remote broadband coverage.
EBITDA pressure from competition and the data tsunami
EBITDA pressure has been and will continue to be the predominant
driver, be it as a result of revenue competition (new entrants, MVNOs
or OTT players), regulators reducing termination rates or international
roaming fees (Europe and Africa), or the rapid increase in mobile
data traffic. The latter is possibly the most significant, with data traffic
forecast to double every two years.
LTE roll-out has been the “burning platform” for numerous network
sharing deals. LTE creates two major cost pressures for an operator.
Initially it requires a major capital investment in licence/spectrum
fees, network elements and transmission, with a commensurate
increase in operating costs. Later, as take-up increases, LTE users
consume two to three times the amount of data compared to 3G
users, incurring further capital and operating expenditure but with
limited revenue upside.
Spectrum scarcity will be a driver in some markets
In many emerging markets with more than four mobile and fixed-
wireless operators, limited spectrum availability is causing operators
to evaluate MOCN sharing versus consolidation. Which direction they
choose to go will depend on government competition policy,
shareholder objectives and the business case.
Connecting the unconnected: rural/remote broadband initiatives
At the last count there were more than ten global initiatives with a
similar objective: to “connect the unconnected” or in other words to
provide broadband services in rural/remote areas to those who
currently don’t have access to the Internet. Putting aside the question
of how effective they are, there has undoubtedly been some progress
at the national level as most countries now have a national
broadband plan, although the quality of the plans and the
implementation progress to date are mixed to say the least. Similarly,
many government departments and regulators have realised that
mobile is the most cost-effective technology for such areas and that
infrastructure sharing is a key enabler. Consequently some
governments have become much more proactive about sharing and
have started to change their regulatory frameworks accordingly.
Yet the industry has not appreciated two of the key ingredients to
finding a solution for such remote areas:
All operators will need to actively share a single network
The government will also need to provide fiscal measures (e.g.,
tax changes, licence/spectrum fee reductions, USF funding, etc.)
Without this common understanding, progress will continue to be
slow and patchy.
6
Mobile Network Infrastructure Sharing
1. Industry status, trends and drivers
EBITDA pressure
has been and will
continue to be the
predominant driver.
Government policy
related to broadband
objectives for
rural/remote areas
will become
increasingly more
important over the
next five years.
Connecting the unconnected: making sense of the initiatives
See Appendix A
for further details
EBITDA: Earnings Before
Interest, Tax, Depreciation
and Amortisation

© copyright Coleago 2016
Five dimensions of network sharing. Maximising Enterprise Value. Common risks.
Potential solutions, benefits and risks
7
2Mobile Network Infrastructure Sharing
© copyright Coleago 2016
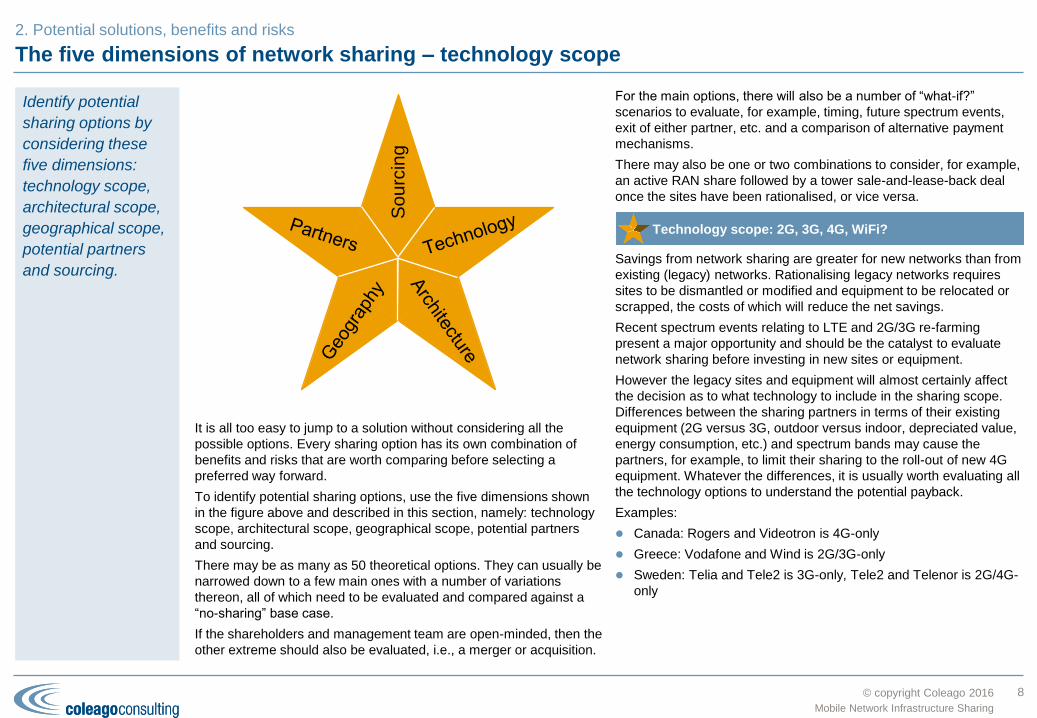
The five dimensions of network sharing – technology scope
It is all too easy to jump to a solution without considering all the
possible options. Every sharing option has its own combination of
benefits and risks that are worth comparing before selecting a
preferred way forward.
To identify potential sharing options, use the five dimensions shown
in the figure above and described in this section, namely: technology
scope, architectural scope, geographical scope, potential partners
and sourcing.
There may be as many as 50 theoretical options. They can usually be
narrowed down to a few main ones with a number of variations
thereon, all of which need to be evaluated and compared against a
“no-sharing” base case.
If the shareholders and management team are open-minded, then the
other extreme should also be evaluated, i.e., a merger or acquisition.
For the main options, there will also be a number of “what-if?”
scenarios to evaluate, for example, timing, future spectrum events,
exit of either partner, etc. and a comparison of alternative payment
mechanisms.
There may also be one or two combinations to consider, for example,
an active RAN share followed by a tower sale-and-lease-back deal
once the sites have been rationalised, or vice versa.
Savings from network sharing are greater for new networks than from
existing (legacy) networks. Rationalising legacy networks requires
sites to be dismantled or modified and equipment to be relocated or
scrapped, the costs of which will reduce the net savings.
Recent spectrum events relating to LTE and 2G/3G re-farming
present a major opportunity and should be the catalyst to evaluate
network sharing before investing in new sites or equipment.
However the legacy sites and equipment will almost certainly affect
the decision as to what technology to include in the sharing scope.
Differences between the sharing partners in terms of their existing
equipment (2G versus 3G, outdoor versus indoor, depreciated value,
energy consumption, etc.) and spectrum bands may cause the
partners, for example, to limit their sharing to the roll-out of new 4G
equipment. Whatever the differences, it is usually worth evaluating all
the technology options to understand the potential payback.
Examples:
Canada: Rogers and Videotron is 4G-only
Greece: Vodafone and Wind is 2G/3G-only
Sweden: Telia and Tele2 is 3G-only, Tele2 and Telenor is 2G/4G-
only
8
Mobile Network Infrastructure Sharing
Identify potential
sharing options by
considering these
five dimensions:
technology scope,
architectural scope,
geographical scope,
potential partners
and sourcing.
2. Potential solutions, benefits and risks
Technology scope: 2G, 3G, 4G, WiFi?
So
urc
ing

© copyright Coleago 2016
The five dimensions of network sharing – architectural scope
9
Mobile Network Infrastructure Sharing
2. Potential solutions, benefits and risks
The table at right shows the main architectural models for network
sharing.
Undoubtedly active sharing provides the greatest total savings.
However it is important to understand the incremental benefit over
the other models particularly given variations in some of the other
network sharing dimensions, e.g., potential partners and sourcing.
If the two potential partners are about to invest in new RAN
equipment to introduce new technology (3G or 4G), then an active
share becomes much more attractive.
Less than 10% of network sharing deals involve spectrum sharing or
pooling (MOCN) for a variety of reasons, such as:
Both partners have sufficient spectrum for their needs (capacity
and broadband speed) taking into account features such as
carrier aggregation
One partner has a spectrum advantage and is unwilling to share it
for competitive reasons
The regulator is unwilling to sanction spectrum trading or sharing.
As mobile data traffic continues to grow, regulators will be pressured
to release more spectrum. In some markets, spectrum pooling may
be one of the solutions to this demand.
To date there are no Core Network (GWCN) sharing deals because
regulators have strongly opposed such arrangements for reasons of
competition. However, developments in NFV and SDN may change
this situation and therefore sharing agreements should recognise this
potential future change in scope.
Examples:
Bangladesh: Airtel and Telenor (Grameenphone) is passive
Denmark: Telenor and Telia is active (MOCN)
UK: EE and Hutchison is active (MORAN)
MORAN: Multi-Operator Radio Access Network
MOCN: Multi-Operator Core Network
GWCN: Gateway Core Network
MVNO: Mobile Virtual Network Operator
Architectural scope
Architectural
Model
Sit
e
An
ten
nas &
feed
ers
RA
N e
lem
en
ts
Tra
nsm
issio
n
(backh
au
l)
Sp
ectr
um
Co
re n
etw
ork
ele
men
ts
Tra
nsm
issio
n
(backb
on
e)
Passive
Active RAN
Transmission
Core Network
(GWCN)
National
Roaming
Full MVNO
Thin MVNO
MORAN
MOCN

© copyright Coleago 2016
The five dimensions of network sharing – geographical scope and potential partners
Urban areas usually present more valuable opportunities than rural
areas for competitive differentiation in terms of network quality, in-
building coverage, service features, etc. and so it often makes
strategic sense not to share in such areas – but where to draw the
line?
For the same reason, regulatory or competition authorities may
impose a limit on the geographical extent of network sharing; in
Sweden, Telenor and Hutchison were only allowed to share their 3G
RANs up to a maximum 70% population coverage (since relaxed).
CapEx and OpEx differ between rural (typically towers) and urban
(typically rooftop) sites resulting in different payback periods and
NPV. Urban sites may also present difficulties in terms of space
availability, radiation limits, planning restrictions, etc.
Given the emerging trend to extend broadband coverage to
rural/remote areas (see page 6), it may be necessary to consider
different sharing arrangements for urban, rural and remote areas.
Taking a theoretical example of a country with four MNOs, it might
end up with two MNOs sharing in the urban and rural areas, the other
two MNOs only sharing in rural areas and all four MNOs sharing in
the remote areas.
Geography is also an important aspect when considering the
sourcing dimension (next page). An approach used in some sharing
deals is to partition the country between the parties for design, build
and O&M, for example, Vodafone and O2 in the UK.
Other examples:
Finland: Telia and DNA is rural-only, equating to 50% land area
and 15% of the population
France: SFR and Bouygues is rural-only, equating to 57% of the
population
Greece: Vodafone and Wind is rural and limited selected urban
areas, equating to 70% of rural and 40% of urban population
10
Mobile Network Infrastructure Sharing
Geographical scope
There may only be a few potential MNO partners or tower companies
from which to choose but you still need to evaluate their fit against a
number of criteria (see chart above). High-level examples of the
evaluation criteria include:
Commercial fit: for example, market share, competitive
differentiation (including brand)
Technical fit: in terms of spectrum (and therefore site grid),
technologies, vendors and MS providers
Cultural fit: experience from any existing relationship,
management styles, corporate values, etc.
Ownership: international versus local, public versus private,
shareholder ambitions, etc.
Note that the evaluation score of a potential partner may differ
according to the sharing option being evaluated.
Potential partners
2. Potential solutions, benefits and risks

© copyright Coleago 2016
The five dimensions of network sharing – sourcing
11
Mobile Network Infrastructure Sharing
2. Potential solutions, benefits and risks
Joint Venture (JV) JV outsources to MSP
JV outsources geographically to Partners Unilateral or Bilateral
For active sharing and some passive sharing deals, a 50:50 JV is the norm. It will be the overall authority for designing, building and operating the shared network. However responsibility for any of these activities may be undertaken by the JV itself or outsourced, possibly on a geographical basis, to:
The JV partners: one or both of the partners may be the best solution for delivering some of the scope, for example, each partner could take responsibility for designing and building the shared network in different geographical areas with the JV
responsible for overall design authority, programme management and O&M
Managed Service (MS) provider(s): one or more MS providers may be part of the solution; their contract(s) could also be extended to include the (unshared) legacy networks, thereby providing benefits beyond the network sharing itself.
By its nature, roaming is a unilateral or bilateral arrangement.
© copyright Coleago 2016
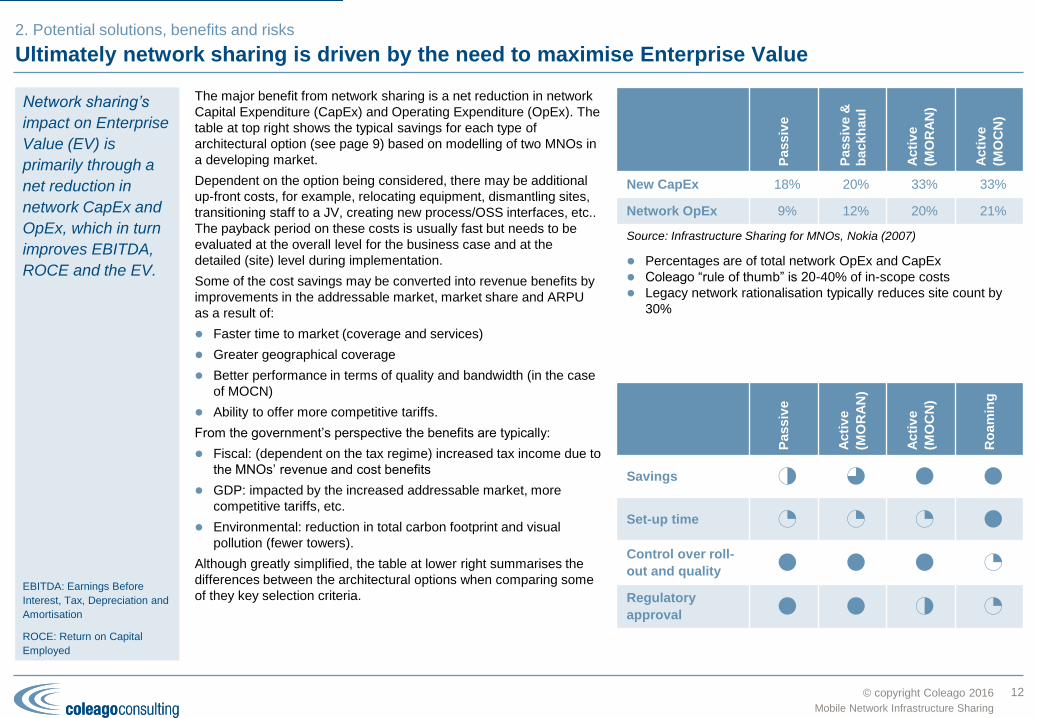
Ultimately network sharing is driven by the need to maximise Enterprise Value
12
Mobile Network Infrastructure Sharing
2. Potential solutions, benefits and risks
Network sharing’s
impact on Enterprise
Value (EV) is
primarily through a
net reduction in
network CapEx and
OpEx, which in turn
improves EBITDA,
ROCE and the EV.
EBITDA: Earnings Before
Interest, Tax, Depreciation and
Amortisation
ROCE: Return on Capital
Employed
The major benefit from network sharing is a net reduction in network
Capital Expenditure (CapEx) and Operating Expenditure (OpEx). The
table at top right shows the typical savings for each type of
architectural option (see page 9) based on modelling of two MNOs in
a developing market.
Dependent on the option being considered, there may be additional
up-front costs, for example, relocating equipment, dismantling sites,
transitioning staff to a JV, creating new process/OSS interfaces, etc..
The payback period on these costs is usually fast but needs to be
evaluated at the overall level for the business case and at the
detailed (site) level during implementation.
Some of the cost savings may be converted into revenue benefits by
improvements in the addressable market, market share and ARPU
as a result of:
Faster time to market (coverage and services)
Greater geographical coverage
Better performance in terms of quality and bandwidth (in the case
of MOCN)
Ability to offer more competitive tariffs.
From the government’s perspective the benefits are typically:
Fiscal: (dependent on the tax regime) increased tax income due to
the MNOs’ revenue and cost benefits
GDP: impacted by the increased addressable market, more
competitive tariffs, etc.
Environmental: reduction in total carbon footprint and visual
pollution (fewer towers).
Although greatly simplified, the table at lower right summarises the
differences between the architectural options when comparing some
of they key selection criteria.
Passiv
e
Acti
ve
(MO
RA
N)
Acti
ve
(MO
CN
)
Ro
am
ing
Savings 2 3 4 4
Set-up time 1 1 1 4
Control over roll-
out and quality4 4 4 1
Regulatory
approval4 4 2 1
Passiv
e
Passiv
e &
backh
au
l
Acti
ve
(MO
RA
N)
Acti
ve
(MO
CN
)
New CapEx 18% 20% 33% 33%
Network OpEx 9% 12% 20% 21%
Percentages are of total network OpEx and CapEx
Coleago “rule of thumb” is 20-40% of in-scope costs
Legacy network rationalisation typically reduces site count by
30%
Source: Infrastructure Sharing for MNOs, Nokia (2007)
© copyright Coleago 2016
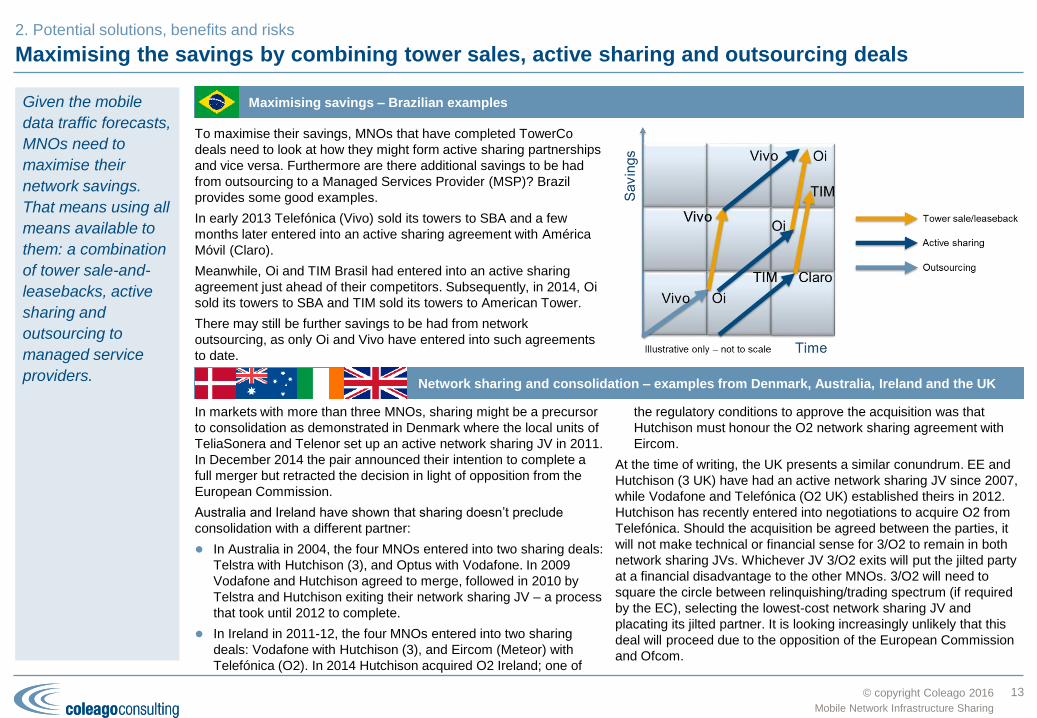
Maximising the savings by combining tower sales, active sharing and outsourcing deals
13
Mobile Network Infrastructure Sharing
2. Potential solutions, benefits and risks
To maximise their savings, MNOs that have completed TowerCo
deals need to look at how they might form active sharing partnerships
and vice versa. Furthermore are there additional savings to be had
from outsourcing to a Managed Services Provider (MSP)? Brazil
provides some good examples.
In early 2013 Telefónica (Vivo) sold its towers to SBA and a few
months later entered into an active sharing agreement with América
Móvil (Claro).
Meanwhile, Oi and TIM Brasil had entered into an active sharing
agreement just ahead of their competitors. Subsequently, in 2014, Oi
sold its towers to SBA and TIM sold its towers to American Tower.
There may still be further savings to be had from network
outsourcing, as only Oi and Vivo have entered into such agreements
to date.
Maximising savings – Brazilian examples
In markets with more than three MNOs, sharing might be a precursor
to consolidation as demonstrated in Denmark where the local units of
TeliaSonera and Telenor set up an active network sharing JV in 2011.
In December 2014 the pair announced their intention to complete a
full merger but retracted the decision in light of opposition from the
European Commission.
Australia and Ireland have shown that sharing doesn’t preclude
consolidation with a different partner:
In Australia in 2004, the four MNOs entered into two sharing deals:
Telstra with Hutchison (3), and Optus with Vodafone. In 2009
Vodafone and Hutchison agreed to merge, followed in 2010 by
Telstra and Hutchison exiting their network sharing JV – a process
that took until 2012 to complete.
In Ireland in 2011-12, the four MNOs entered into two sharing
deals: Vodafone with Hutchison (3), and Eircom (Meteor) with
Telefónica (O2). In 2014 Hutchison acquired O2 Ireland; one of
the regulatory conditions to approve the acquisition was that
Hutchison must honour the O2 network sharing agreement with
Eircom.
At the time of writing, the UK presents a similar conundrum. EE and
Hutchison (3 UK) have had an active network sharing JV since 2007,
while Vodafone and Telefónica (O2 UK) established theirs in 2012.
Hutchison has recently entered into negotiations to acquire O2 from
Telefónica. Should the acquisition be agreed between the parties, it
will not make technical or financial sense for 3/O2 to remain in both
network sharing JVs. Whichever JV 3/O2 exits will put the jilted party
at a financial disadvantage to the other MNOs. 3/O2 will need to
square the circle between relinquishing/trading spectrum (if required
by the EC), selecting the lowest-cost network sharing JV and
placating its jilted partner. It is looking increasingly unlikely that this
deal will proceed due to the opposition of the European Commission
and Ofcom.
Network sharing and consolidation – examples from Denmark, Australia, Ireland and the UK
Given the mobile
data traffic forecasts,
MNOs need to
maximise their
network savings.
That means using all
means available to
them: a combination
of tower sale-and-
leasebacks, active
sharing and
outsourcing to
managed service
providers.
© copyright Coleago 2016
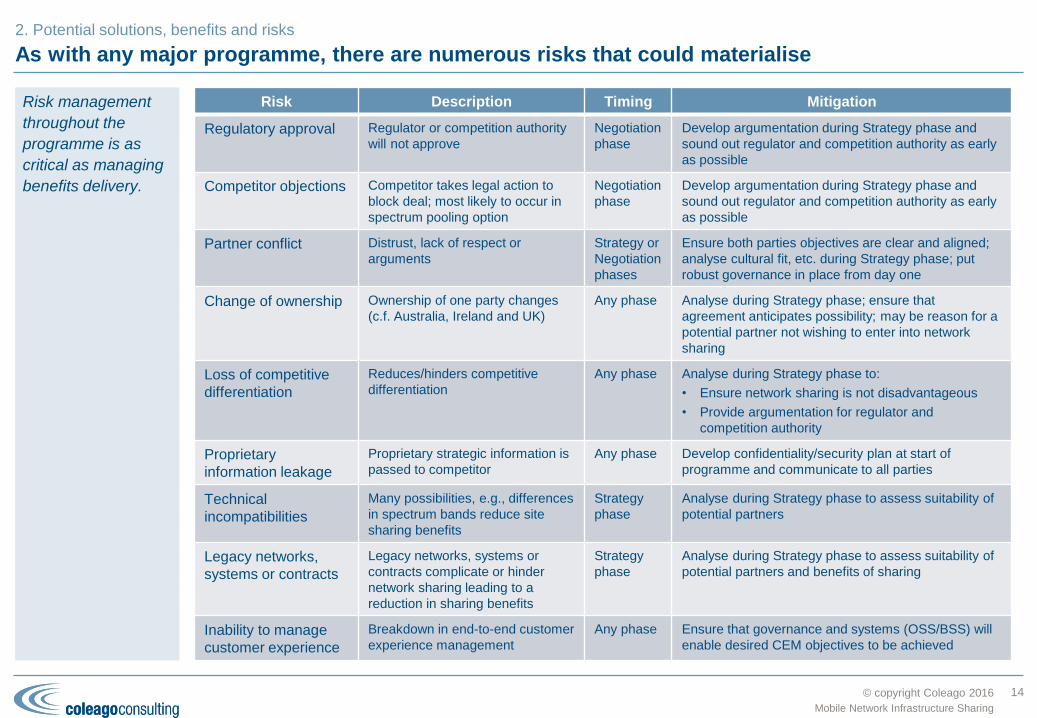
As with any major programme, there are numerous risks that could materialise
14
Mobile Network Infrastructure Sharing
Risk management
throughout the
programme is as
critical as managing
benefits delivery.
2. Potential solutions, benefits and risks
Risk Description Timing Mitigation
Regulatory approval Regulator or competition authority
will not approve
Negotiation
phase
Develop argumentation during Strategy phase and
sound out regulator and competition authority as early
as possible
Competitor objections Competitor takes legal action to
block deal; most likely to occur in
spectrum pooling option
Negotiation
phase
Develop argumentation during Strategy phase and
sound out regulator and competition authority as early
as possible
Partner conflict Distrust, lack of respect or
arguments
Strategy or
Negotiation
phases
Ensure both parties objectives are clear and aligned;
analyse cultural fit, etc. during Strategy phase; put
robust governance in place from day one
Change of ownership Ownership of one party changes
(c.f. Australia, Ireland and UK)
Any phase Analyse during Strategy phase; ensure that
agreement anticipates possibility; may be reason for a
potential partner not wishing to enter into network
sharing
Loss of competitive
differentiation
Reduces/hinders competitive
differentiation
Any phase Analyse during Strategy phase to:
• Ensure network sharing is not disadvantageous
• Provide argumentation for regulator and
competition authority
Proprietary
information leakage
Proprietary strategic information is
passed to competitor
Any phase Develop confidentiality/security plan at start of
programme and communicate to all parties
Technical
incompatibilities
Many possibilities, e.g., differences
in spectrum bands reduce site
sharing benefits
Strategy
phase
Analyse during Strategy phase to assess suitability of
potential partners
Legacy networks,
systems or contracts
Legacy networks, systems or
contracts complicate or hinder
network sharing leading to a
reduction in sharing benefits
Strategy
phase
Analyse during Strategy phase to assess suitability of
potential partners and benefits of sharing
Inability to manage
customer experience
Breakdown in end-to-end customer
experience management
Any phase Ensure that governance and systems (OSS/BSS) will
enable desired CEM objectives to be achieved
© copyright Coleago 2016
Overview of our approach, methodology, deliverables and indicative timescales.
Coleago’s approach
15
3Mobile Network Infrastructure Sharing

© copyright Coleago 2016
Overview of Coleago’s approach to network sharing
16
Mobile Network Infrastructure Sharing
3. Coleago’s Approach
Phases Strategy Negotiation Transition Transformation
Responsibility Prospective Partners Prospective Partners Partners and JV JV
Steps Internal & external analysis
Business case
Partner engagement
Obtain regulatory approval
Design “To-Be”
Negotiate Agreement(s)
Conduct due diligence
Plan
Transition
Depends on scope
Project management
Internal and external communications
Deliverables Business Case
Data Room
Information Memorandum
(TowerCo only)
Heads of Agreement
Regulatory approval(s)
“Target Operating Model
(TOM)” design
Agreement(s)
Legal entity and financing
Staff, assets, contracts,
etc. transferred from
parents
Transformation (within
parents)
JV operational
OpEx and CapEx savings
from, e.g.:
Site dismantling
Equipment relocation or
replacement
Subcontract
renegotiation
Duration 4-5 months 2-5 months but may be
longer dependent on the
regulatory approval
4-6 months Months to years
Variants on the approach
This approach is applicable regardless of the sharing option. It is
designed to work as well for a tower deal with a TowerCo as it does
for an active RAN share with another MNO.
Examples of how the approach varies:
For sharing with another MNO, the Information Memorandum is
not required as the partner selection is not conducted through a
formal, competitive process
The form of the Agreements referred to in the Negotiation phase
will depend on the sharing option, for example, for a tower deal a
Sale/Purchase Agreement and Master Lease Agreement will be
needed
For some sharing options, the entity referred to in the Transition
and Transformation phases may not be a joint venture; for
example, it may be a subsidiary of a tower company or one of the
MNOs.
This approach is
applicable
regardless of the
sharing option. It is
designed to work as
well for a tower deal
with a TowerCo as it
does for an active
RAN share with
another MNO.
Milestone
© copyright Coleago 2016
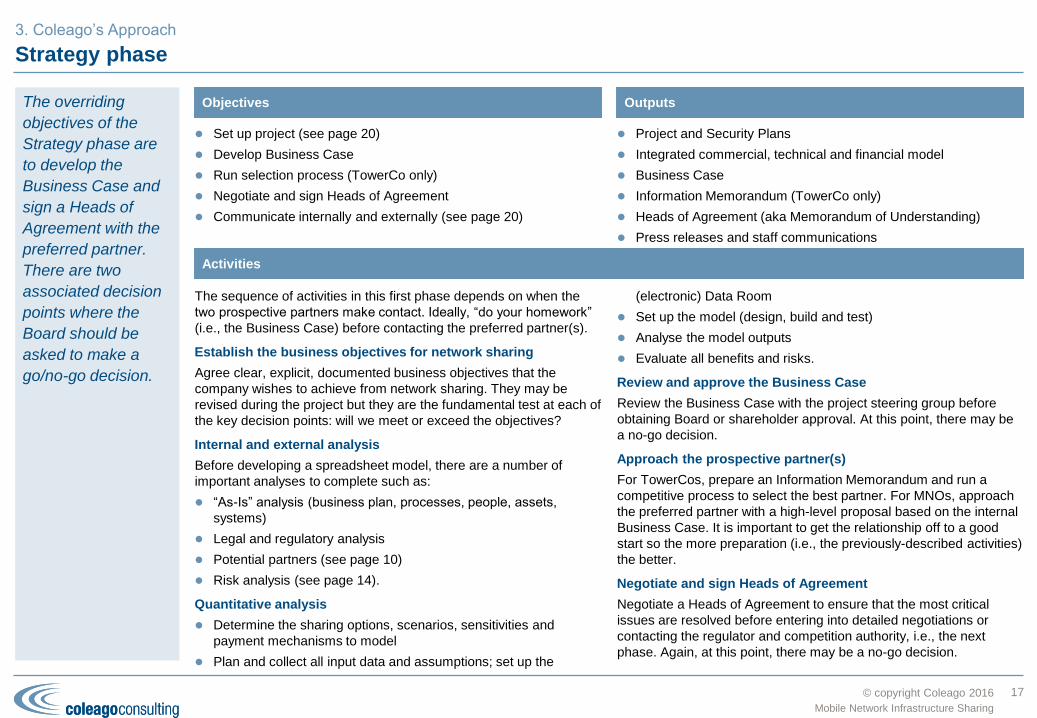
Strategy phase
17
Mobile Network Infrastructure Sharing
3. Coleago’s Approach
The sequence of activities in this first phase depends on when the
two prospective partners make contact. Ideally, “do your homework”
(i.e., the Business Case) before contacting the preferred partner(s).
Establish the business objectives for network sharing
Agree clear, explicit, documented business objectives that the
company wishes to achieve from network sharing. They may be
revised during the project but they are the fundamental test at each of
the key decision points: will we meet or exceed the objectives?
Internal and external analysis
Before developing a spreadsheet model, there are a number of
important analyses to complete such as:
“As-Is” analysis (business plan, processes, people, assets,
systems)
Legal and regulatory analysis
Potential partners (see page 10)
Risk analysis (see page 14).
Quantitative analysis
Determine the sharing options, scenarios, sensitivities and
payment mechanisms to model
Plan and collect all input data and assumptions; set up the
(electronic) Data Room
Set up the model (design, build and test)
Analyse the model outputs
Evaluate all benefits and risks.
Review and approve the Business Case
Review the Business Case with the project steering group before
obtaining Board or shareholder approval. At this point, there may be
a no-go decision.
Approach the prospective partner(s)
For TowerCos, prepare an Information Memorandum and run a
competitive process to select the best partner. For MNOs, approach
the preferred partner with a high-level proposal based on the internal
Business Case. It is important to get the relationship off to a good
start so the more preparation (i.e., the previously-described activities)
the better.
Negotiate and sign Heads of Agreement
Negotiate a Heads of Agreement to ensure that the most critical
issues are resolved before entering into detailed negotiations or
contacting the regulator and competition authority, i.e., the next
phase. Again, at this point, there may be a no-go decision.
Activities
Set up project (see page 20)
Develop Business Case
Run selection process (TowerCo only)
Negotiate and sign Heads of Agreement
Communicate internally and externally (see page 20)
Objectives
Project and Security Plans
Integrated commercial, technical and financial model
Business Case
Information Memorandum (TowerCo only)
Heads of Agreement (aka Memorandum of Understanding)
Press releases and staff communications
OutputsThe overriding
objectives of the
Strategy phase are
to develop the
Business Case and
sign a Heads of
Agreement with the
preferred partner.
There are two
associated decision
points where the
Board should be
asked to make a
go/no-go decision.

© copyright Coleago 2016
Negotiation phase
18
Mobile Network Infrastructure Sharing
3. Coleago’s Approach
Obtain regulatory approval(s)
The process and timing to obtain the necessary regulatory approvals
depends on the sharing option and the applicable local legal and
regulatory framework. In general, it is better to consult the
telecommunications and competition authorities as early as possible
to ensure that the sharing option and agreements take into account
their policies, requirements, etc.
Design “To-Be” entities
A lot of preparatory work is required to develop the details needed for
the Agreement(s). Having agreed on the sharing option in the
Strategy phase, the teams now need to develop the governance
structure, process maps, RACI tables, organisation structures, high-
level job descriptions, KPIs and network/OSS architectures for the JV
and parent companies. This will enable the teams to define interfaces
between the entities, identify the resources (assets, contracts,
people, etc.) to be transferred or procured and prepare the
Implementation Plan.
Prepare JV Business Plan and update Business Cases
Whereas during the Strategy phase the savings estimates are only
accurate to a high order of magnitude, the project teams now need to
develop a more accurate picture. The accuracy will depend on the
resources and time available: if limited, one approach is to analyse a
number of sample/pilot areas in detail in order to adjust the key
assumptions for the whole in-scope network. Outputs from this
activity include the commercial terms, JV Business Plan and updated
Business Cases.
Negotiate and sign Agreement(s)
All the previous activities will enable the appropriate agreements to
be drafted and negotiated, all of which usually takes place in parallel
(see schedule on page 21). Signature will depend on the partners’
governance processes; completion will usually be subject to
obtaining final regulatory approval and, if appropriate, completing due
diligence. Again, at this point, there may be a no-go decision.
Undertake appropriate Due Diligence (DD)
The need for a DD and its scope/duration will depend on the sharing
option and what, if anything, is being transferred to the JV.
Activities
Obtain regulatory approval
Design “To-Be” entities and prepare Implementation Plan
Prepare JV Business Plan and update Business Cases
Negotiate and sign Agreement(s)
Undertake appropriate due diligence
Communicate internally and externally (see page 20)
Objectives
“To-Be” design
High-level Implementation Plan
JV Business Plan
Updated Business Cases
Regulatory approval(s)
Agreement(s)
Press releases and staff communications
Due diligence reports, if required
OutputsKey objectives for
the Negotiation
phase are to
negotiate the JV
agreement and gain
the appropriate
regulatory approval.

© copyright Coleago 2016
Transition phase
19
Mobile Network Infrastructure Sharing
3. Coleago’s Approach
Develop detailed Implementation Plan
The Implementation Plan prepared during the previous phase is high
level: sufficient to agree milestones and develop a budget for the JV
Business Plan. Start work on the detailed Implementation Plan as
soon as the partners are confident that they will proceed; at latest
when the JV Agreement is ready for signature.
For a smooth operational handover from the parents to the JV, it is
important to define how all in-scope assets and activities will be
transferred and at what point the JV takes over responsibility for
meeting KPIs.
Establish legal entity and initial financing
Go through the necessary steps to establish the new legal entity
including providing the initial financing.
Lease and fit out office(s)
Find suitable offices and fit out ready for staff move.
Transfer or recruit/procure staff, assets and contracts
In accordance with the “To-Be” design and the JV Agreement,
transfer/recruit staff, transfer/procure all assets and novate/procure
all third-party contracts.
Implement processes and systems
In accordance with the “To-Be” design and the JV Agreement,
implement all processes and systems.
Transform parent organisations
Implement the changes to the parent organisations in accordance
with the “To-Be” design and the JV Agreement. These activities will
take place before or in parallel with the JV set-up activities.
Start JV operation
At this point the JV takes over responsibility for delivering services in
accordance with the SLAs and KPIs set out in the JV Agreement.
Note that there may still be transfer, recruitment, procurement and
implementation activities in progress.
Activities
Set up JV governance and project team (see page 20)
Develop detailed Implementation Plan
Establish legal entity and initial financing
Transfer staff, assets, contracts, etc. from parents
Transform parent organisations to work with the JV
Communicate internally and externally (see page 20)
Start JV operation
Objectives
Detailed Implementation Plan
Legal entity established
Staff, assets, contracts, etc. transferred from parents
Operational JV
Post-implementation review(s)
OutputsThe overall objective
of this phase is to
get the shared entity
operational. The full
benefits may take
several years to
deliver, which will be
managed against the
JV’s Business Plan.

© copyright Coleago 2016
Use best-practice project management and communications management throughout
Benefits of sound project management
The benefits of using best-practice project management are generally
understood. In the case of network sharing it is particularly important
in order to:
Co-ordinate the activities of numerous parties and resources
across three organisations, especially during the Transition phase
Make the most effective use of the CxO team during the Strategy
and Negotiation phases
Manage post-Transition benefits delivery.
Having decided that network sharing is worth investigating, set it up
as a formal project with a steering group, sponsor, manager, Project
Plan, regular (weekly) reporting cycle, etc.
Given the strategic nature of the project, it is extremely important to
prepare a Security Plan and ensure that anyone joining the project
understands it.
Co-ordinated Transition management
Only a few activities need to be co-ordinated between the prospective
partners during the Strategy and Negotiation phases, namely
negotiations, communications (see text at right), internal approvals
and regulatory approvals. However, during the Transition phase
almost all activities must be co-ordinated between the prospective
partners and the JV to ensure it proceeds smoothly. The
Implementation Plan (pages 18 and 19) must clearly define the split
of responsibilities, handover points, etc.
20
Mobile Network Infrastructure Sharing
Project management
Communication is critical
Network sharing may have a material impact on the Enterprise Value
and therefore all external communications must be managed very
carefully. Similarly internal communications are also highly sensitive
because jobs may be transferred or closed.
For these reasons, involve senior representatives from Human
Resources (HR) and Investor Relations (IR) from the start of the
project. Legal advice will probably also be required with respect to
applicable employment, telecommunications and financial law.
Co-ordinated communications
It is important to co-ordinate communications at a fine level of detail:
the wording and timing of communications must be
exchanged/agreed (subject to legal constraints) between the two
partners and, once it is established, the JV.
Prepare and maintain a Joint Communications Plan
Prepare a Communications Plan at the start of the project and
maintain it through all the phases. It should cover all stakeholders
and all proactive/reactive, internal/external communications activities.
Prior to signing the Heads of Agreement, work with the prospective
partner to extend the Communications Plan to include their
stakeholders and communications activities, i.e., a Joint Plan.
Key milestones for internal and external communications are:
Heads of Agreement signature
JV Agreement signature
JV Agreement completion following regulatory approval and DD
JV operational – usually an internal communication only.
Communications management
3. Coleago’s Approach
Be clear about the
split of
responsibilities
between the
partners and the JV.
Ensure all activities
are well co-
ordinated,
particularly during
Transition.
© copyright Coleago 2016
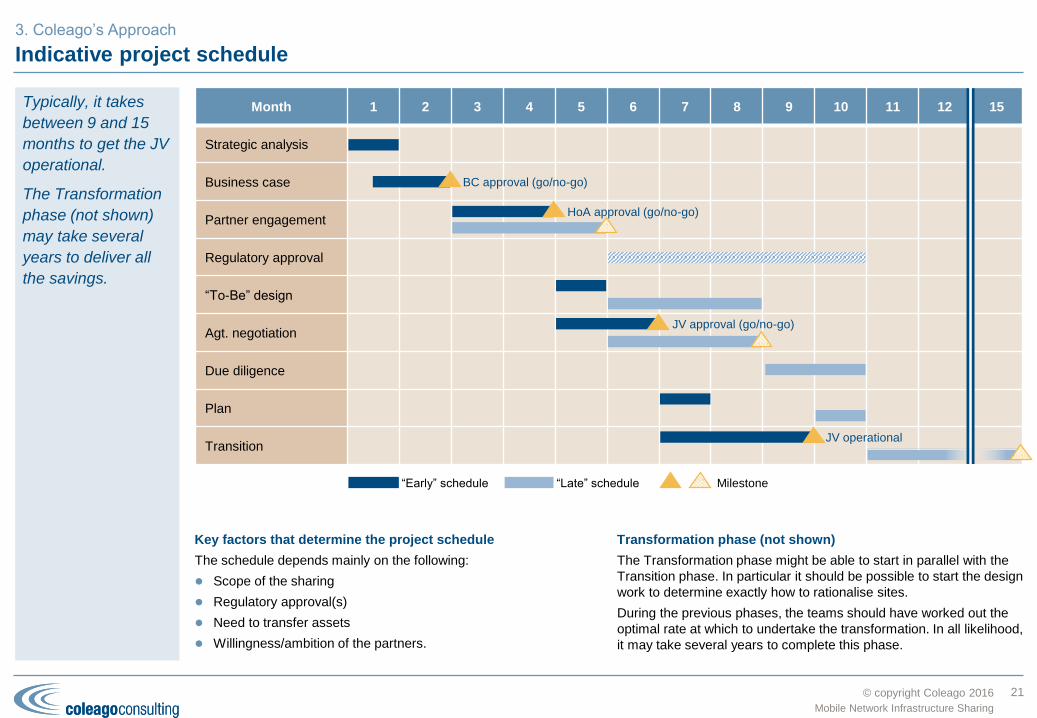
Indicative project schedule
21
Mobile Network Infrastructure Sharing
3. Coleago’s Approach
Month 1 2 3 4 5 6 7 8 9 10 11 12 15
Strategic analysis
Business case
Partner engagement
Regulatory approval
“To-Be” design
Agt. negotiation
Due diligence
Plan
Transition
Typically, it takes
between 9 and 15
months to get the JV
operational.
The Transformation
phase (not shown)
may take several
years to deliver all
the savings.
Key factors that determine the project schedule
The schedule depends mainly on the following:
Scope of the sharing
Regulatory approval(s)
Need to transfer assets
Willingness/ambition of the partners.
Transformation phase (not shown)
The Transformation phase might be able to start in parallel with the
Transition phase. In particular it should be possible to start the design
work to determine exactly how to rationalise sites.
During the previous phases, the teams should have worked out the
optimal rate at which to undertake the transformation. In all likelihood,
it may take several years to complete this phase.
BC approval (go/no-go)
HoA approval (go/no-go)
JV approval (go/no-go)
JV operational
“Early” schedule “Late” schedule Milestone

© copyright Coleago 2016
During the last decade our consultants have built up experience across most types of
sharing deals and phases. We provide a complete range of services to support or lead
your project team.
Coleago’s experience and services
22
4Mobile Network Infrastructure Sharing

© copyright Coleago 2016
Our consultants have built up experience across most types of sharing deals and project phases
Region Sharing
Option
Description
Global All On behalf of the Communications Regulators’ Association of Southern Africa (CRASA) and the International
Telecommunications Union (ITU) developed the ICT and Broadcasting Infrastructure Sharing Guidelines for
the Southern African Development Community (SADC) countries (though applicable anywhere in the world).
Europe All Developed this operator’s 2G, 3G and 4G technology strategy including network sharing, equipment
sourcing and managed services. The project evaluated all possible sharing options and identified the two
most attractive dependent on subsequent expected regulatory events.
Europe Active Modelling of the active network sharing options including alternative commercial terms to help this client
decide its network sharing strategy before entering into negotiations.
Europe Passive
(TowerCo)
Carried out a market and technical analysis for the potential creation of a mobile network towers and
infrastructure sharing business in a major European market.
Asia Active As part of several spectrum valuation projects, evaluated the impact on Enterprise Value of different network
sharing options.
Africa & Asia Active For the GSMA’s Connected Society programme, developed the Infrastructure Economics Toolkit to help
governments and MNOs understand the infrastructure sharing options and fiscal measures needed to
provide rural/remote broadband access to 100% of the population.
Europe Passive Appointed to act as the independent mediator for a passive, antennae and transmission sharing deal. Work
included preparation of the joint business case and a draft heads of agreement.
Middle East
& Africa
Active (MOCN
and roaming)
Provided expert support for the Business Case development and JV Agreement negotiation for a 3G and 4G
MOCN network share and 2G roaming.
Europe Passive
(TowerCo)
Analysed the passive network sharing options for this mobile operator. Working with the client’s legal and
financial advisers, developed the Information Memorandum and drafted the services schedule for the Master
Agreement.
Europe Active Led the technical and commercial activities to develop the relevant JV Agreement schedules for a 3G active
network share in a major European market.
Middle East
& Africa
Passive
(TowerCo)
Technical and commercial due diligence of tower portfolios in Tanzania, Ghana, South Africa and Uganda.
Reviewed the purchaser’s business plans and carried out detailed review of the site portfolio to assess
attractiveness to local market demand.
23
Mobile Network Infrastructure Sharing
In addition to
working on every
type of sharing deal
for MNOs, Coleago’s
consultants have
also worked for
regulators and the
ITU to bring
regulatory
frameworks up to
best practice.
4. Coleago’s Experience and Services

© copyright Coleago 2016
We provide a complete range of services to support or lead your project team
Phase Service Description
Strategy Business Case Internal and external analysis including “As-Is” (business plan, processes, people, assets,
systems), legal and regulatory, potential partners and risks. Quantitative analysis including
commercial, technical and financial modelling. Business Case and Board presentation
preparation.
Info. Memorandum
(TowerCos)
Information Memorandum preparation (with your legal or financial advisors). Evaluation process
design and execution. Board presentation preparation.
HoA negotiation Negotiation team training. Draft HoA (with your legal or financial advisors). Establish internal
position on key terms. Lead or support negotiations. Board presentation preparation.
Negotiation Regulatory support Internal briefing document preparation. Presentations/papers preparation for submission to the
regulatory authorities in support of requests for approvals.
“To-Be” design Design of the governance structure, process maps, RACI tables, organisation structures, high-
level job descriptions, KPIs and network/OSS architectures for the JV and parent companies.
Implementation
Planning
High-level and detailed Implementation Plans (WBS, schedule, resources and costs).
JV Business Plan Commercial terms analysis (in support of negotiation). Business Case update. JV Business
Plan preparation.
Agreement
negotiation
Negotiation team training. Draft Agreement(s) (with your legal or financial advisors). Lead or
support negotiations. Board presentation preparation.
Due diligence Commercial and technical due diligence.
Transform-
ation
RAN rationalisation Lead or support the site or RAN rationalisation.
Any Phase Project
management
Project set-up: governance, Project Plan and reporting cycle. Project management of any phase
including Transition.
Communications
support
Communications planning support to your HR and IR managers. Assistance with drafting Press
Releases and internal communications.
Expert advice Expert advice to the Board and CxO team. Knowledge transfer to the project team.
24
Mobile Network Infrastructure Sharing
Coleago can help
throughout the
project at all levels.
Our consultants
become part of your
project team.
Our methodology
includes templates
and tools based on
our experience
which increase the
team’s efficiency and
reduce risk.
4. Coleago’s Experience and Services

© copyright Coleago 2016
The key benefits of working with Coleago.
Why Coleago?
25
Mobile Network Infrastructure Sharing
5
© copyright Coleago 2016
The benefits of working with Coleago
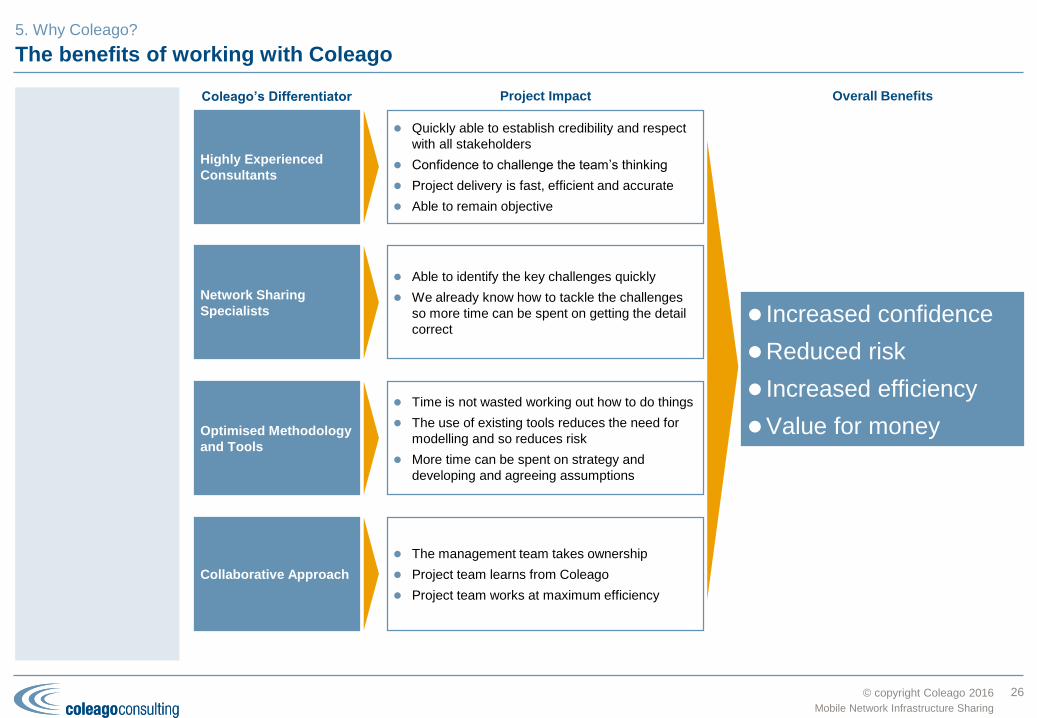
Coleago’s Differentiator Overall Benefits
Mobile Network Infrastructure Sharing
5. Why Coleago?
Quickly able to establish credibility and respect
with all stakeholders
Confidence to challenge the team’s thinking
Project delivery is fast, efficient and accurate
Able to remain objective
Able to identify the key challenges quickly
We already know how to tackle the challenges
so more time can be spent on getting the detail
correct
Time is not wasted working out how to do things
The use of existing tools reduces the need for
modelling and so reduces risk
More time can be spent on strategy and
developing and agreeing assumptions
The management team takes ownership
Project team learns from Coleago
Project team works at maximum efficiency
Network Sharing
Specialists
Optimised Methodology
and Tools
Highly Experienced
Consultants
Collaborative Approach
Increased confidence
Reduced risk
Increased efficiency
Value for money
Project Impact
26
© copyright Coleago 2016
Connecting the Unconnected: Rural/Remote Broadband Initiatives
Appendix A
27
Mobile Network Infrastructure Sharing
A
© copyright Coleago 2016
Making sense of the plethora of global initiatives – public bodies
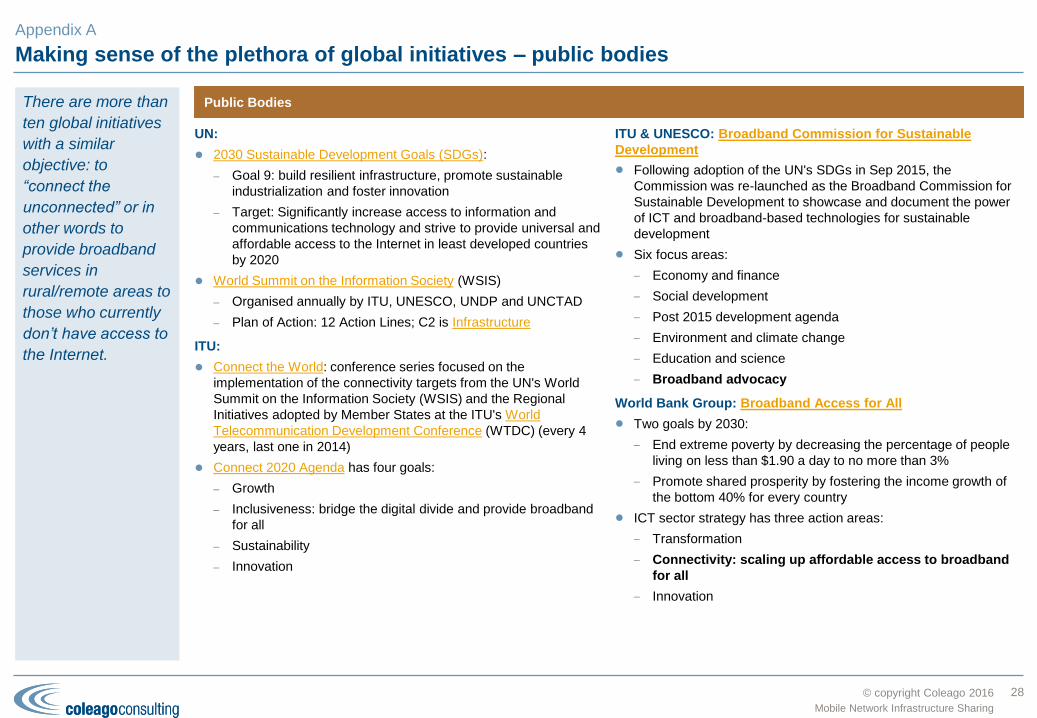
UN:
2030 Sustainable Development Goals (SDGs):
– Goal 9: build resilient infrastructure, promote sustainable
industrialization and foster innovation
– Target: Significantly increase access to information and
communications technology and strive to provide universal and
affordable access to the Internet in least developed countries
by 2020
World Summit on the Information Society (WSIS)
– Organised annually by ITU, UNESCO, UNDP and UNCTAD
– Plan of Action: 12 Action Lines; C2 is Infrastructure
ITU:
Connect the World: conference series focused on the
implementation of the connectivity targets from the UN's World
Summit on the Information Society (WSIS) and the Regional
Initiatives adopted by Member States at the ITU's World
Telecommunication Development Conference (WTDC) (every 4
years, last one in 2014)
Connect 2020 Agenda has four goals:
– Growth
– Inclusiveness: bridge the digital divide and provide broadband
for all
– Sustainability
– Innovation
ITU & UNESCO: Broadband Commission for Sustainable
Development
Following adoption of the UN's SDGs in Sep 2015, the
Commission was re-launched as the Broadband Commission for
Sustainable Development to showcase and document the power
of ICT and broadband-based technologies for sustainable
development
Six focus areas:
– Economy and finance
– Social development
– Post 2015 development agenda
– Environment and climate change
– Education and science
– Broadband advocacy
World Bank Group: Broadband Access for All
Two goals by 2030:
– End extreme poverty by decreasing the percentage of people
living on less than $1.90 a day to no more than 3%
– Promote shared prosperity by fostering the income growth of
the bottom 40% for every country
ICT sector strategy has three action areas:
– Transformation
– Connectivity: scaling up affordable access to broadband
for all
– Innovation
28
Mobile Network Infrastructure Sharing
There are more than
ten global initiatives
with a similar
objective: to
“connect the
unconnected” or in
other words to
provide broadband
services in
rural/remote areas to
those who currently
don’t have access to
the Internet.
Appendix A
Public Bodies

© copyright Coleago 2016
Making sense of the plethora of global initiatives – NGOs
World Economic Forum (WEF): Internet for All
WEF:
– Established in 1971 as a not-for-profit foundation
– Headquartered in Geneva
– independent, impartial and not tied to any special interests
10 Global Challenge Initiatives, one of which is "Future of the
Internet".
Consists of four projects, one of which is "Internet for All"
Objective: develop a scalable, replicable new model of public-
private collaboration that accelerate internet access and adoption
for the 4 billion people currently not on the internet
Two phases:
– Internet for All report (2015)
– Country programmes (2016 onwards)
– Rwanda, Kenya, Uganda and South Sudan
– Additional country programmes (up to three in total) in other
regions of the world (Asia, Latin America)
Alliance for Affordable Internet (A4AI)
Global coalition working to make broadband affordable for all
Currently working in six countries — Nigeria, Ghana,
Mozambique, Liberia, Myanmar and the Dominican Republic — to
make Internet more affordable and accessible for nearly 300
million people. In each of these countries, we’ve signed formal
memoranda of understanding with the government, and have
worked with a wide range of in-country stakeholders to build
strong national multi-stakeholder coalitions. These national
coalitions work to develop solutions tailored to local realities, and
lead efforts in their country to realise more affordable access.
Research and international advocacy
ONE:
International campaigning and advocacy organisation of more than
7 million people
Focused on the UN SDGs
Digital Impact Alliance (DIAL):
Includes the UN Foundation, Bill & Melinda Gates Foundation,
USAID, etc.
DIAL’s mission is to accelerate the collective efforts of
government, industry and development organizations to realize the
vision of a more inclusive digital economy for the underserved in
emerging markets
29
Mobile Network Infrastructure Sharing
Appendix A
Non-Governmental Organisations (NGOs)

© copyright Coleago 2016
Making sense of the plethora of global initiatives – commercial entities
GSMA:
Mobile for Development - Connected Society programme has
four work streams:
– Affordability
– Infrastructure economics
– Digital literacy
– Locally-relevant content
Facebook: Internet.org
Free Basics offers access to basic websites for local audiences
Connectivity Lab developing ways to make affordable internet
access possible in communities around the world
– Aquila unmanned aircraft
Express Wi-Fi working with carriers, ISPs and local entrepreneurs
to help expand connectivity to underserved locations
Innovation Lab, an Ericsson-Facebook collaboration, helps
developers understand how their apps work in different parts of
the world
Alphabet: Project Loon
Network of balloons traveling on the edge of space, designed to
connect people in rural and remote areas, help fill coverage gaps,
and bring people back online after disasters
30
Mobile Network Infrastructure Sharing
Appendix A
Commercial Entities

© copyright Coleago 2016
Network Sharing Database and Regional Indexes
Appendix B
31
Mobile Network Infrastructure Sharing
B

© copyright Coleago 2016
Network Sharing Database and Regional Indexes
32
Mobile Network Infrastructure Sharing
Appendix B
MNO Network Sharing Deals by Region (2001-15) Network Sharing Experience by Group (end-2015)
Coleago’s Sharing Indexes by Region (end-2015)Database (charts above and tables on following pages)
Coleago’s database is based on public announcements by MNOs. It
includes passive and active sharing deals between MNOs and tower
JVs with, or sales to, TowerCos. It excludes M&A, national roaming,
transmission-only and informal or unannounced site sharing deals.
Note that the “Date” column in the following tables is the date that the
deal was announced. The completion date may be different.
Regional Indexes (see chart at right)
As the number of countries and MNOs differ considerably between
regions, Coleago has developed two indexes in order to compare the
status of network sharing. The “TowerCo Index” is calculated by
dividing the number of sale-and-leaseback deals by the total number
of MNOs in the region. The “MNO Sharing Index” is calculated by
dividing the number of passive/active sharing deals by the number of
MNOs and multiplying by two. In both cases, the index may exceed
100 depending on the industry structure within a country.

© copyright Coleago 2016
Americas (1 of 2)
Country MNO1 MNO2 TowerCo or MNO3 Deal Type Date
Canada Bell Mobility Telus Active (MORAN) Oct-08
Jamaica LIME América Móvil (Claro) Passive Jul-09
Canada Rogers Videotron Active (MORAN) Jul-09
Canada Rogers Manitoba Telecom Active (MORAN) Jul-09
Canada Bell Mobility SaskTel Active (MORAN) Oct-09
Chile Telefónica (Movistar) ATC TowerCo Jul-10
Colombia MIC (Tigo) ATC TowerCo Jul-11
Mexico Telefónica (Movistar) ATC TowerCo Dec-11
Chile Telefónica (Movistar) ATC TowerCo Jan-12
Brazil Telefónica (Vivo) SBA TowerCo Jan-13
Brazil Oi TIM Brasil Active (MORAN) Mar-13
Brazil Telefónica (Vivo) América Móvil (Claro) Active (MORAN) Mar-13
Colombia Telefónica (Movistar) MIC (Tigo) Active (MORAN) Aug-13
Brazil NII ATC TowerCo Aug-13
Mexico AT&T [formerly Nextel] ATC TowerCo Aug-13
USA AT&T Crown Castle TowerCo Oct-13
Brazil Oi SBA TowerCo Dec-13
Brazil Oi SBA TowerCo Jun-14
Venezuela Movilnet Telefónica (Movistar) Digitel Passive Oct-14
Brazil TIM Brasil ATC TowerCo Nov-14
33
Mobile Network Infrastructure Sharing
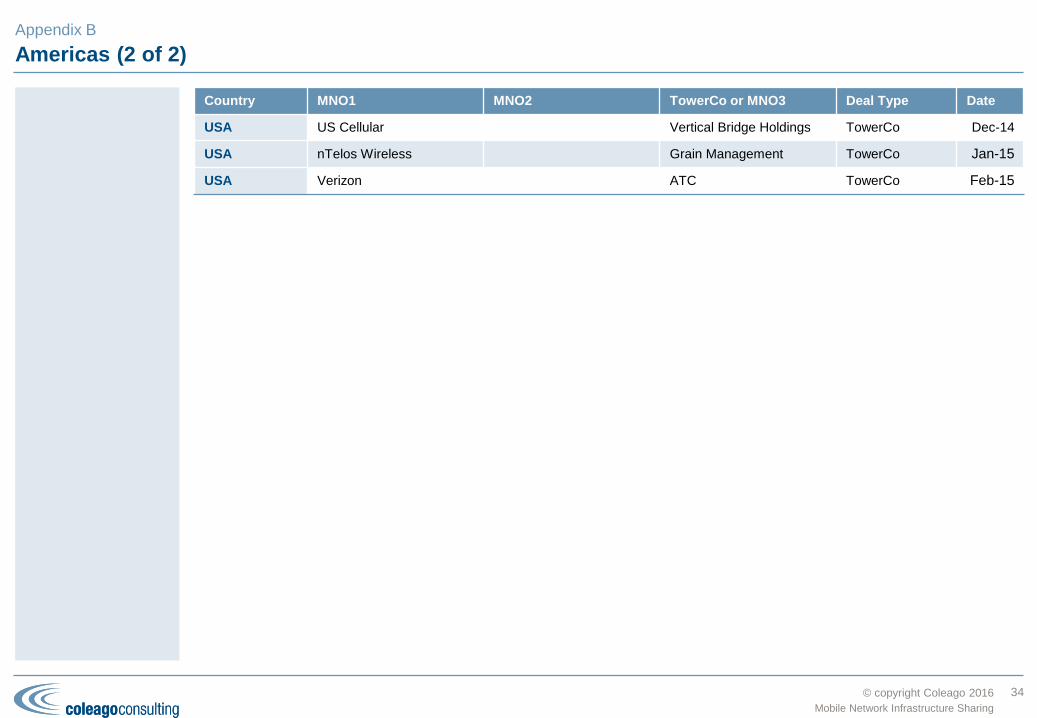
The network sharing
picture in the
Americas has been
dominated by
TowerCo deals (over
70%) to the extent
that the region is on
a par with the MEA
region on the
TowerCo Index.
However it is still
early days as these
deals have only
taken place in five
countries (Brazil,
Chile, Colombia,
Mexico and USA).
An even greater
opportunity is active
sharing between
MNOs where the
only deals to date
have been in
Canada, Colombia
and Brazil.
Appendix B
© copyright Coleago 2016
Americas (2 of 2)
Country MNO1 MNO2 TowerCo or MNO3 Deal Type Date
USA US Cellular Vertical Bridge Holdings TowerCo Dec-14
USA nTelos Wireless Grain Management TowerCo Jan-15
USA Verizon ATC TowerCo Feb-15
34
Mobile Network Infrastructure Sharing
Appendix B

© copyright Coleago 2016
Europe (1 of 2)
Country MNO1 MNO2 TowerCo or MNO3 Deal Type Date
Sweden TeliaSonera Tele2 Active (MOCN) Jan-01
Sweden Telenor Sweden Hutchison (3) Active (MOCN) Apr-01
Spain Vodafone Spain Orange Spain Active (MORAN) Nov-06
Italy Vodafone Italia TIM Passive Nov-07
United
Kingdom
T-Mobile UK [now EE] Hutchison (3) Active (MORAN) Dec-07
Germany Vodafone Germany Telefónica (O2 Germany) Passive Mar-09
Spain Vodafone Spain Telefónica (Movistar) Passive Mar-09
Ireland Vodafone Ireland Telefónica O2 Ireland
[now Hutchison (3)]
Passive Mar-09
Sweden Tele2 Telenor Sweden Active (MOCN) Apr-09
Italy TIM Hutchison (3) Passive Jul-09
Belgium Orange (Mobistar) KPN (BASE) Passive Oct-09
Czech
Republic
Telefónica O2 [now O2
Czech Republic]
T-Mobile CR Active (MORAN) Feb-11
Ireland Hutchison (3) [formerly
Telefónica O2 Ireland]
Eircom (Meteor) Passive Apr-11
Denmark TeliaSonera Denmark Telenor Denmark Active (MOCN) Jun-11
Poland T-Mobile (PTC) PTK Centertel [now
Orange Polska]
Active (MORAN) Jul-11
Russia Rostelecom MTS Passive Feb-12
United
Kingdom
Vodafone UK Telefónica (O2 UK) Active (MORAN) Jun-12
35
Mobile Network Infrastructure Sharing
Europe has gone the
furthest in terms of
“depth of sharing”
with 17 active
(MORAN and
MOCN) sharing
deals to date but has
been the laggard
when it comes to
TowerCo deals. With
no sharing of any
form in half of
Europe, there is still
some way to go.
Appendix B

© copyright Coleago 2016
Europe (2 of 2)
Country MNO1 MNO2 TowerCo or MNO3 Deal Type Date
Ireland Vodafone Ireland Hutchison (3) Passive Jul-12
France Bouygues Antin IP TowerCo Nov-12
Netherlands KPN Protelindo TowerCo Nov-12
Greece Vodafone Greece Wind Hellas Active (MORAN) Jun-13
Romania Vodafone Orange Active (MORAN) Aug-13
Spain Telefónica (Movistar) TeliaSonera (Yoigo) Abertis TowerCo Aug-13
Netherlands T-Mobile Tele2 Passive Sep-13
Iceland Fjarskipti (Vodafone) Nova Active (MOCN) Nov-13
France SFR Bouygues Active (MORAN) Jan-14
Finland TeliaSonera Finland DNA Active (MOCN) Aug-14
Russia Vimpelcom MTS Active (MORAN) Dec-14
Hungary T-Mobile (Magyar
Telekom)
Telenor Active (MORAN) Feb-15
Italy Vimplecom (Wind) Abertis TowerCo Mar-15
Finland Ukko Mobile Digita Passive Dec-15
36
Mobile Network Infrastructure Sharing
Appendix B

© copyright Coleago 2016
Middle East & Africa (1 of 2)
Country MNO1 MNO2 TowerCo or MNO3 Deal Type Date
Iran MCCI Irancell Taliya Passive Jan-07
Qatar Qtel [now Ooredoo] Vodafone Qatar Passive Mar-09
Ghana MIC (Tigo) Helios TowerCo Jan-10
South Africa Cell C ATC TowerCo Nov-10
Ghana MTN ATC TowerCo Dec-10
Nigeria Starcomms SPAN TowerCo Dec-10
Tanzania MIC (Tigo) Helios TowerCo Dec-10
DRC MIC (Tigo) Helios TowerCo Dec-10
Uganda MTN Uganda ATC TowerCo Dec-11
Uganda Orange Eaton TowerCo Mar-12
Uganda Warid [now Airtel] Eaton TowerCo Mar-12
Côte d'Ivoire MTN IHS Holding TowerCo Oct-12
Cameroon MTN IHS Holding TowerCo Oct-12
Rwanda Rwanda Development
Board
KT Corp Open Access Mar-13
Tanzania MIC (Tigo) Vodafone (Vodacom) Helios TowerCo Jul-13
Israel Partner (Orange) Golan Passive Oct-13
Israel Partner (Orange) HOT Mobile Active (MOCN) Nov-13
Rwanda MTN IHS Holding TowerCo Dec-13
Zambia MTN IHS Holding TowerCo Dec-13
37
Mobile Network Infrastructure Sharing
Africa leads the
world in TowerCo
deals; the regional
Index being pulled
down from 17 to 13
because of the lack
of deals in the
Middle East. Three
multinational
operators, Millicom
(Tigo), MTN, and
Airtel, account for
more than 80% of
the deals.
Appendix B

© copyright Coleago 2016
Middle East & Africa (2 of 2)
Country MNO1 MNO2 TowerCo or MNO3 Deal Type Date
DRC Airtel Helios TowerCo Jul-14
Republic of
Congo
Airtel Helios TowerCo Jul-14
Nigeria Etisalat Nigeria IHS Holding TowerCo Aug-14
Nigeria MTN Nigeria IHS Holding TowerCo Sep-14
Israel Cellcom Golan Active (MOCN) Sep-14
Israel Cellcom Pelephone Passive Sep-14
Egypt Orange (MobiNil) Eaton TowerCo Nov-14
Nigeria Airtel ATC TowerCo Nov-14
Rwanda Airtel IHS Holding TowerCo Dec-14
Zambia Airtel IHS Holding TowerCo Dec-14
Tunisia Ooredoo Tunisia Tunisie Telecom Active (MORAN) Oct-15
Burkina Faso Airtel Eaton TowerCo Oct-15
38
Mobile Network Infrastructure Sharing
Similar to the
Americas, there are
still more than 30
African countries
without TowerCos
and an even bigger
opportunity for active
sharing between
MNOs.
With the exception of
Israel, Middle
Eastern operators
have yet to embark
on the TowerCo or
network sharing
journey.
Appendix B

© copyright Coleago 2016
Asia Pacific (1 of 2)
Country MNO1 MNO2 TowerCo or MNO3 Deal Type Date
Australia Vodafone Hutchison
Australia
Optus Active (MORAN) Aug-04
Pakistan PTCL (Ufone) Telenor Pakistan Passive Jul-07
India Airtel (Bharti Infratel) Essar [now Vodafone] Idea Cellular Passive Dec-07
Indonesia Axiata (XL) Hutchison (3) Passive Dec-07
New Zealand Vodafone NZ NZ Communications Passive Oct-08
Vietnam Viettel [formerly EVN
Telecom]
Hanoi Telecom
(Vietnamobile)
Active (MOCN) Apr-09
India Aircel Datacom Solutions [now
Videocon]
Passive Sep-09
India BSNL Tata Teleservices Passive Oct-09
India BSNL Aircel Passive Oct-09
Bangladesh Axiata (Robi) Warid [now Airtel] Passive Oct-09
India BSNL Datacom Solutions [now
Videocon]
Passive Oct-09
India BSNL MTS (SSTL) Passive Nov-09
Bangladesh Vimpelcom (banglalink) Telenor (Grameenphone) Passive Feb-10
Bangladesh Axiata (Robi) Telenor (Grameenphone) Passive Feb-10
India Essar [now Vodafone] ATC TowerCo Feb-10
Bangladesh Warid [now Airtel] Citycell Passive Apr-10
Hong Kong PCCW Hutchison (3) Active (MOCN) Oct-10
Bangladesh Warid [now Airtel] Telenor (Grameenphone) Passive Nov-10
39
Mobile Network Infrastructure Sharing
Asia Pacific stands
out for its passive
sharing between
MNOs but the Index
is exaggerated by
the multiplicity of
deals in Bangladesh
and India.
Appendix B

© copyright Coleago 2016
Asia Pacific (2 of 2)
Country MNO1 MNO2 TowerCo or MNO3 Deal Type Date
Malaysia Celcom DiGi Passive Jan-11
Pakistan PTCL (Ufone) Vimpelcom (Mobilink) Passive Apr-11
Pakistan Telenor Pakistan Vimpelcom (Mobilink) Passive May-11
Malaysia Maxis U Mobile Active (MORAN) Oct-11
Thailand AIS TOT Passive Jan-12
Malaysia Maxis REDTone Active (MOCN) Jul-12
Bangladesh Axiata (Robi) Teletalk Passive Jan-13
Azerbaijan Bakcell Azerfon Active (MOCN) May-13
India RCOM Reliance Jio Passive Jun-13
Malaysia Celcom Puncak Semangat (Altel) Active (MOCN) Jul-13
India Airtel Reliance Jio Passive Dec-13
Bangladesh Airtel (formerly Warid) Teletalk Passive Feb-14
China China Mobile China Telecom China Unicom Passive Jul-14
Papua New
Guinea
Telikom PNG bmobile Active (MORAN) Aug-14
India BSNL Reliance Jio Passive Aug-14
Indonesia Axiata (XL) Solusi Tunas Pratama
(STP)
TowerCo Oct-14
Indonesia Telkom Indonesia Tower Bersama
Infrastructure (TBI)
TowerCo Oct-14
Pakistan Warid TowerShare TowerCo Apr-15
Thailand AIS DTAC Passive Aug-15
40
Mobile Network Infrastructure Sharing
Although the
TowerCo Index is as
low as Europe, the
segment is expected
to grow rapidly with
a number of
operators such as
Axiata (Malaysia,
Bangladesh, etc.)
establishing their
own captive tower
businesses and
TowerCos such as
American Tower and
Viom expanding into
India and Myanmar
respectively.
Similar to the
Americas and MEA,
active sharing still
leaves huge
potential.
Appendix B

© copyright Coleago 2016
Tower Companies
Appendix C
41
Mobile Network Infrastructure Sharing
C
© copyright Coleago 2016
Multinational tower companies
42
Mobile Network Infrastructure Sharing
Appendix C
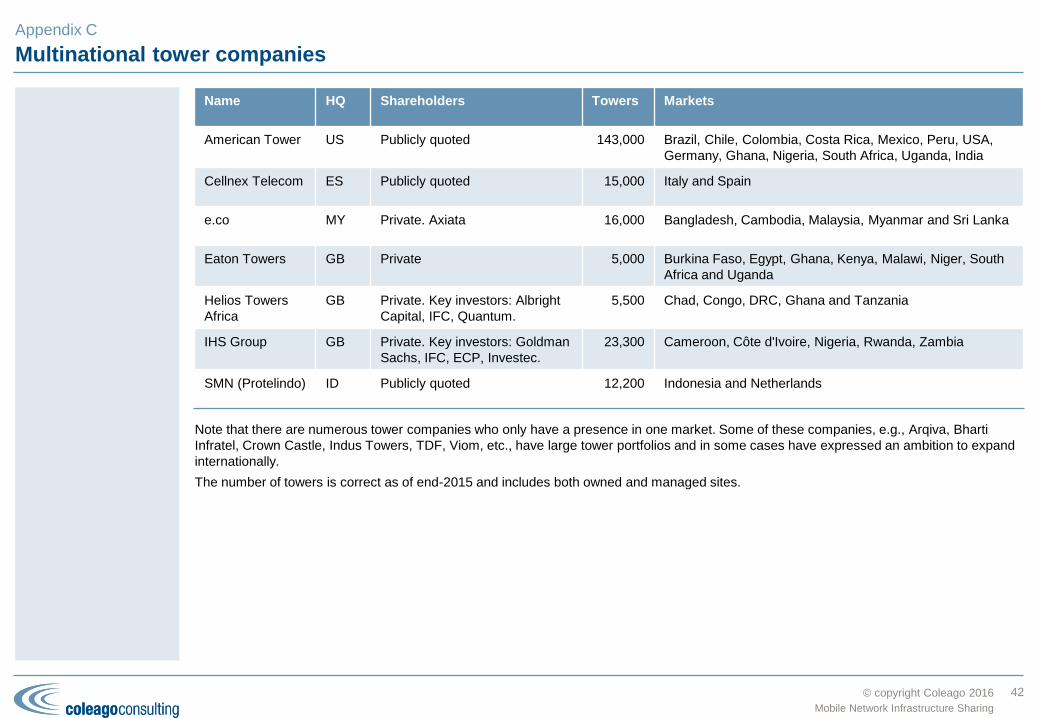
Name HQ Shareholders Towers Markets
American Tower US Publicly quoted 143,000 Brazil, Chile, Colombia, Costa Rica, Mexico, Peru, USA,
Germany, Ghana, Nigeria, South Africa, Uganda, India
Cellnex Telecom ES Publicly quoted 15,000 Italy and Spain
e.co MY Private. Axiata 16,000 Bangladesh, Cambodia, Malaysia, Myanmar and Sri Lanka
Eaton Towers GB Private 5,000 Burkina Faso, Egypt, Ghana, Kenya, Malawi, Niger, South
Africa and Uganda
Helios Towers
Africa
GB Private. Key investors: Albright
Capital, IFC, Quantum.
5,500 Chad, Congo, DRC, Ghana and Tanzania
IHS Group GB Private. Key investors: Goldman
Sachs, IFC, ECP, Investec.
23,300 Cameroon, Côte d'Ivoire, Nigeria, Rwanda, Zambia
SMN (Protelindo) ID Publicly quoted 12,200 Indonesia and Netherlands
Note that there are numerous tower companies who only have a presence in one market. Some of these companies, e.g., Arqiva, Bharti
Infratel, Crown Castle, Indus Towers, TDF, Viom, etc., have large tower portfolios and in some cases have expressed an ambition to expand
internationally.
The number of towers is correct as of end-2015 and includes both owned and managed sites.
© copyright Coleago 2016
Tower/site sharing through third-party tower companies
Business rationale for tower companies
Saddled with the high cost of 3G licences and the cost of 3G build
out, many mobile operators sought to release capital from the sale of
their tower assets. This also had advantages from the stock market
perspectives since the telecoms business and the tower business
were valued on a different basis. Mobile telecoms operators are
deemed to be growth stocks whereas the tower business is based on
predictable, stable cash flow.
The communication tower or mast business is a large business
dominated by infrastructure and or real estate orientated companies
as opposed to technology companies. For example Crown Castle
International Inc. and American Tower Corp. are the dominant
independent tower companies in the USA.
More recently, tower companies also moved into the transmission
space, benefitting from the growth in demand for backhaul as a result
of increase mobile data traffic.
The features that make the tower business attractive to investors are:
Restrictions in granting building permits may create a local
monopoly. It is this which also makes it risky for operators to sell
their tower assets to a dominant supplier.
Long-term contracts are the norm.
High switching costs result in high renewal rates.
Most of the OpEx is fixed.
The combination of predictable revenue and OpEx results in a
steady cash flow.
Tower companies have low borrowing costs because they can
offer towers as collateral.
Renting tower space
The rent or lease prices mobile network operators have to pay to
tower companies depend on a number of factors.
Location and availability of alternatives are a significant issue. As
with the real estate business what matters is location, location,
location.
In some cases operators share in the construction cost in
exchange for a rent reduction.
Volume discounts are common as are discounts for a long term
commitment.
The risk of creating a tower/site monopoly
In countries where operators have sold towers and rooftop sites to
third-party operators, they have effectively created a monopoly with
control over an essential facility.
In many countries, it is difficult or impossible to build new sites as site
build authorisations are refused. This means the only option is to go
onto an existing site owned by a site or tower company. In some
markets independent site companies control virtually all sites in a
given area. This means the mobile operators become price takers in
a monopoly market. For example in the UK, this has had some
negative impact on operating costs and led to litigation.
43
Appendix C
Some of the early
tower sharing deals
were driven by the
desire to release
capital by selling
assets to tower
companies.
However, there is
the risk of creating a
tower monopoly
Mobile Network Infrastructure Sharing
© copyright Coleago 2016
About Coleago
Appendix D
44
Mobile Network Infrastructure Sharing
D

© copyright Coleago 2016
A leading boutique telecommunications consulting and training firm
Operators and regulators
Telecoms operators around the world trust Coleago to
provide insight and advice on key strategic and commercial
issues through our broad range of consulting and training
services.
Experience-based consulting approach
We do not use inexperienced associates or analysts – all our
consultants have a minimum of 10 years experience and
most have over 15 years, often at board level in operational
businesses. Our insight and advice is therefore based on
practical experience and proven processes and
methodologies developed over many years. Clients can be
confident that their project will be delivered by Partner and
Senior Manager level consultants from start to finish and our
solutions and recommendations will be credible, relevant,
realistic and practical.
Developed and developing market experience
Coleago has worked with clients in developed markets and
also in some of the most challenging emerging markets
including the Yemen and the Sudan and we have launched
and operated GSM businesses in countries such as Algeria.
Small, effective teams
Our consultants are highly experienced, multi-skilled and
have extensive project management experience. This allows
Coleago to deploy smaller teams as we do not require the
hierarchy of traditional consultancies to manage large teams
of juniors. Clients find our small teams easier to work with
and integrate into their own project teams.
Exceptional value
By eliminating many of the overheads of traditional firms we
are able to offer end-to-end partner level consulting at fee
rates that provide exceptional value.
45
Mobile Network Infrastructure Sharing
Appendix D
Based in the UK
Coleago provides
consulting and
training services to
global and regional
telecoms, media and
technology players
Advice covering a broad range of technologies
We have advised clients on wireless, fixed, cable, satellite and fibre based
technologies. We have specialist expertise in spectrum valuations and
spectrum auctions have participated in more than 50 awards since 1994.
Media and technology experience
We have developed strategies and business plans for media companies, TV
channels and web based businesses as well as technology companies.
Innovative training services
Coleago has developed a range of training and management development
programmes, including a War Game (business simulation)
Junior Consultant
Senior Consultant
Manager
Senior
Managers
Partner
Analyst
Traditional
Consulting Firm
Model

© copyright Coleago 2016
Contacts
Appendix E
46
Mobile Network Infrastructure Sharing
E

© copyright Coleago 2016
Contacts
47
Mobile Network Infrastructure Sharing
Appendix E
Stefan Zehle
Tel: +44 7974 356 258
CEO
Graham Friend
Tel: +41 79 855 1354
Managing Director
Further information: www.coleago.com
Scott McKenzie
Tel: +44 7825 294 576
Director
Chris Buist
Tel: +43 664 352 1068
Director