Embed Size (px)
Citation preview
Results from the2015 Schooling in America Survey
edchoice.org/nationalsurvey2015
American Enterprise InstituteWashington, DCJune 30, 2015
Paul DiPerna


Survey ProfileData Collection: Braun Research, Inc.
Interview Dates: April 22 to May 12, 2015
Interview Method: Live Telephone | 60% landline, 40% cell phone
Interview Length: 17.5 minutes (average)
Sampling Method: Dual Frame; Probability Sampling; RDD
Population Sample: National / General Population (Adults, Age 18+)
Sample Size: N = 1,002
Margin of Error: ± 3.1 percentage points
Response Rates: Landline (LL) = 13.5%Cell Phone = 13.5%
Weighting? Yes (LL/Cell, Age, Gender, Race, Ethnicity, Region)
Oversampling? Yes (Latinos)*

Survey Profile
Population Sample: National / General Population (Adults, Age 18+)
Sample Size: N = 1,002
Margin of Error: ± 3.1 percentage points

Observing, and making comparisons based on, the following metrics…
~ Levels
~ Margins (i.e. differences, gaps)
~ Intensities (strong positive – strong negative)
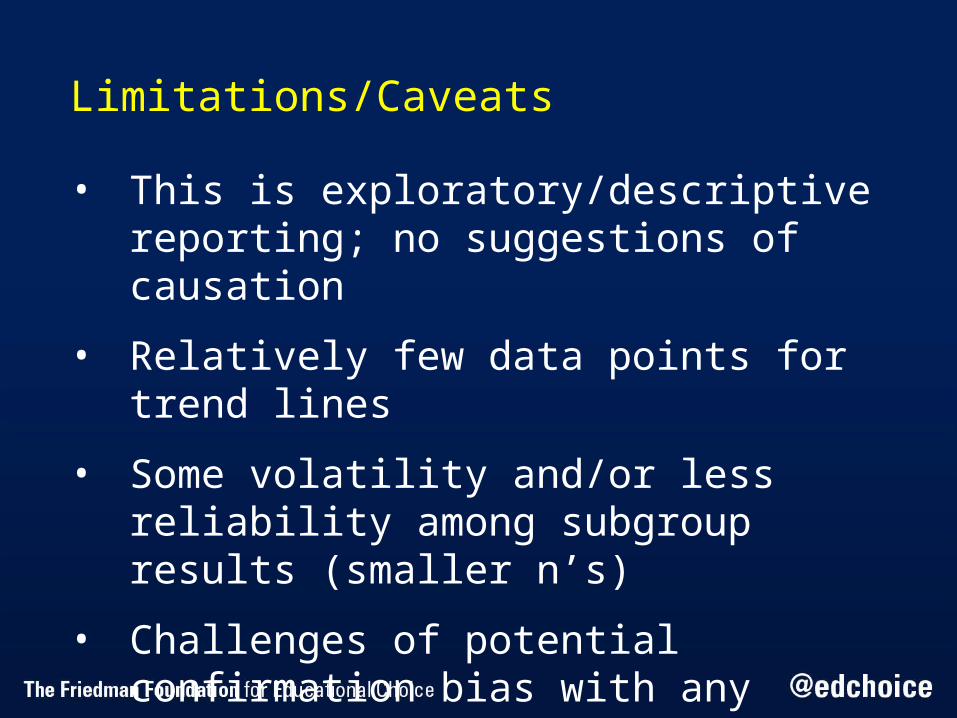
Limitations/Caveats
• This is exploratory/descriptive reporting; no suggestions of causation
• Relatively few data points for trend lines
• Some volatility and/or less reliability among subgroup results (smaller n’s)
• Challenges of potential confirmation bias with any issue-oriented surveys

General Findings
• Americans continue to be negative about the direction of K-12 education in the country; even more so about the federal government’s performance
• Wide gaps between expressed schooling preferences and actual school enrollment patterns

• School choice reforms (vouchers, ESAs, tax-credit scholarships) have large margins of support (=>< 2014)
• Majority favors charter schools as well, but support (surprisingly) has dipped since last year (< 2014)
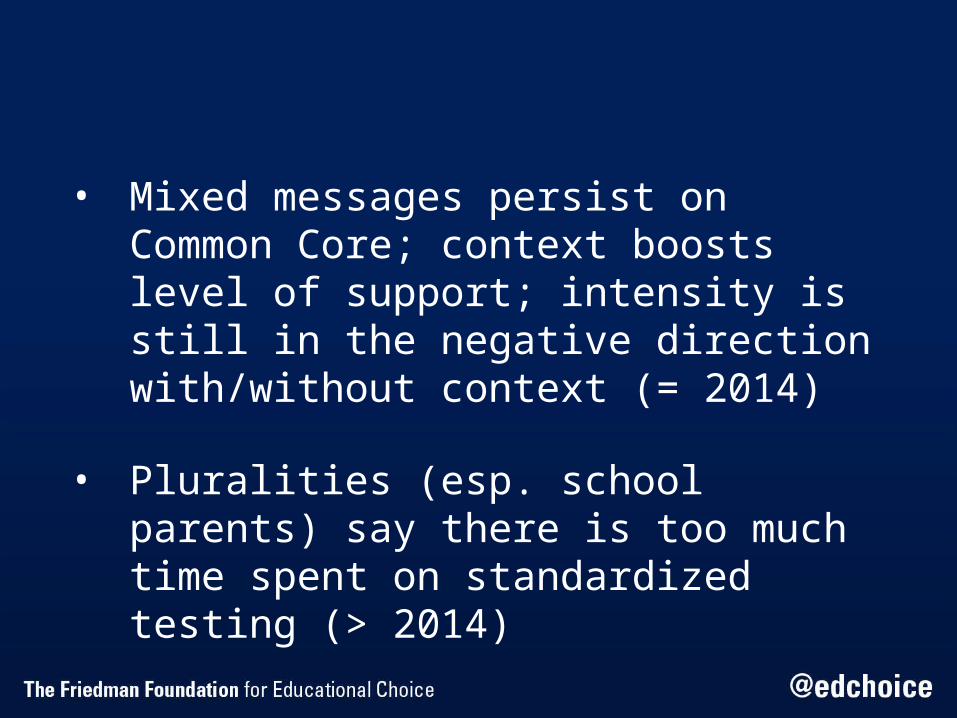
• Mixed messages persist on Common Core; context boosts level of support; intensity is still in the negative direction with/without context (= 2014)
• Pluralities (esp. school parents) say there is too much time spent on standardized testing (> 2014)

Topics
• Direction of K-12 Education in U.S.• Rating Federal Involvement
• School Type Preference, and Why
• School Choice Reforms (Vouchers, ESAs, Tax-Credit Scholarships, Charter
Schools)
• Common Core• Standardized Testing• State Intervention in Schools

Direction of K-12 Education
Rating Federal Involvement


School Type Preference
Why?


Top reasons offered by school parents for choosing a specific school type:
17% BETTER EDUCATION / QUALITY
14% INDIVIDUAL ATTENTION / ONE-ON-ONE
12% BETTER TEACHERS / TEACHERS / TEACHING
10% ACADEMICS / CURRICULUM
10% CLASS SIZE / STUDENT-TEACHER RATIO
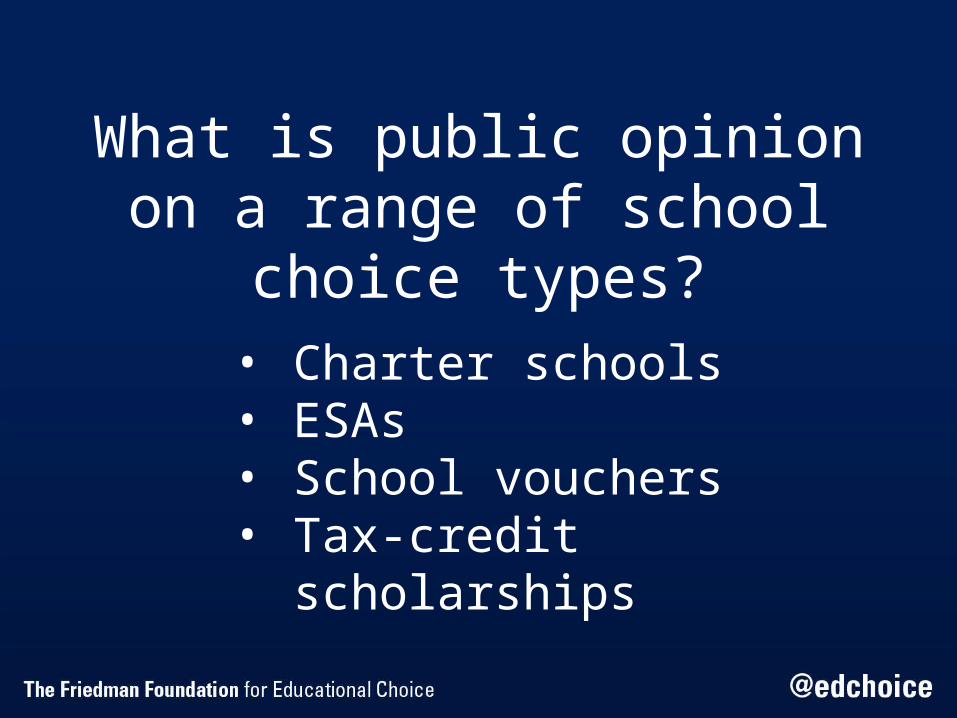
What is public opinion on a range of school choice types?
• Charter schools• ESAs• School vouchers• Tax-credit scholarships

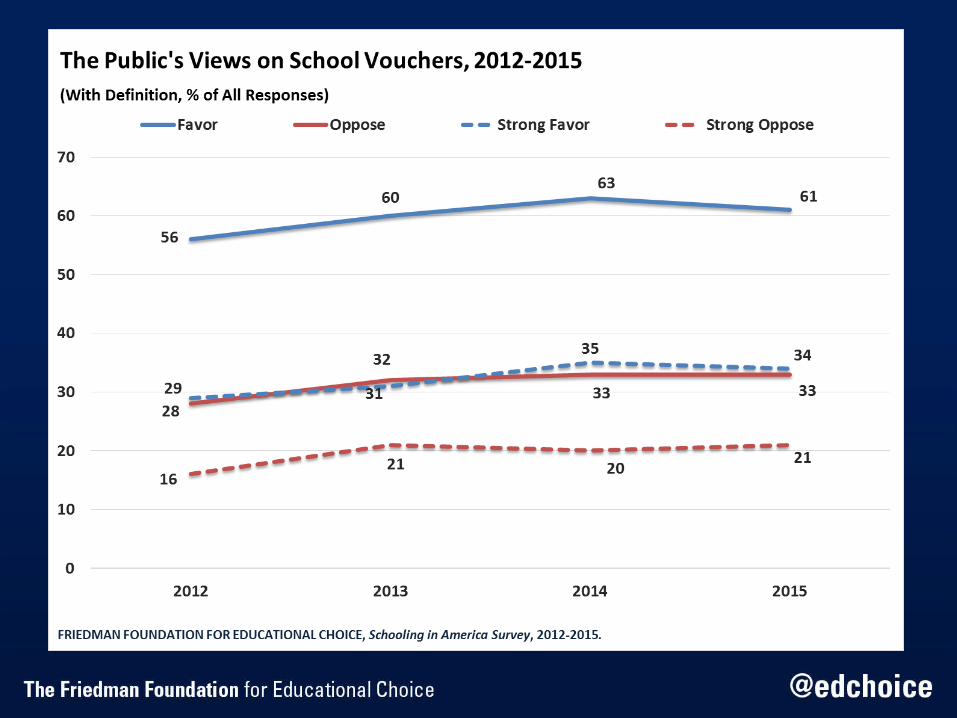
Public Opinion on School Choice
by level of support
62% ESAs61% Vouchers60% Tax-Credit Scholarships53% Charter Schools
by level of opposition
33% Vouchers29% Tax-Credit Scholarships28% ESAs27% Charter Schools
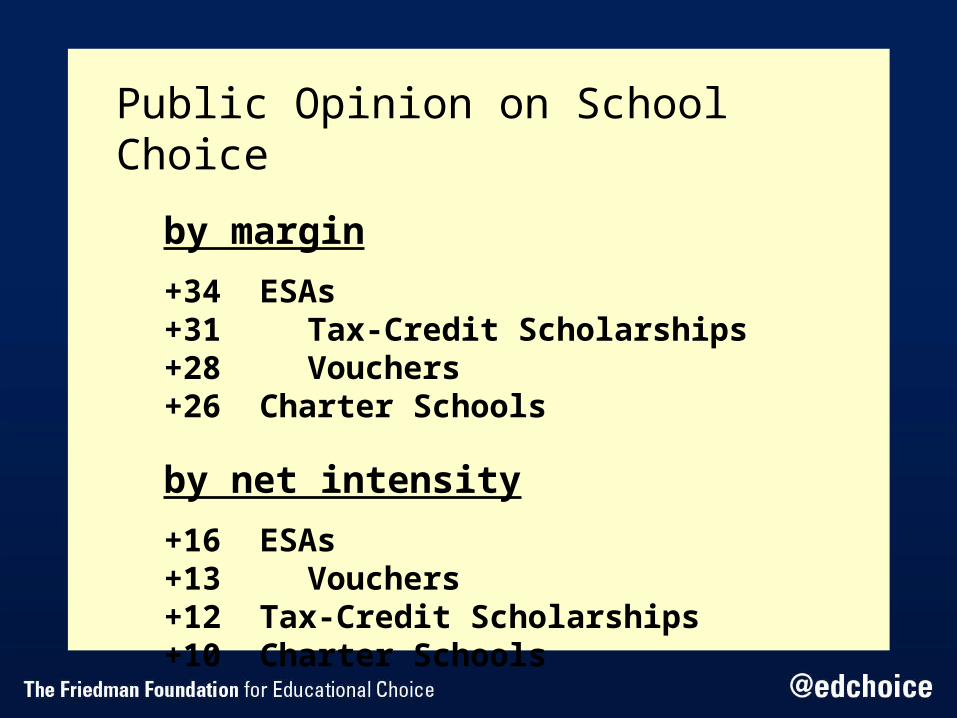
Public Opinion on School Choice
by margin
+34 ESAs+31 Tax-Credit Scholarships+28 Vouchers+26 Charter Schools
by net intensity
+16 ESAs+13 Vouchers+12 Tax-Credit Scholarships+10 Charter Schools

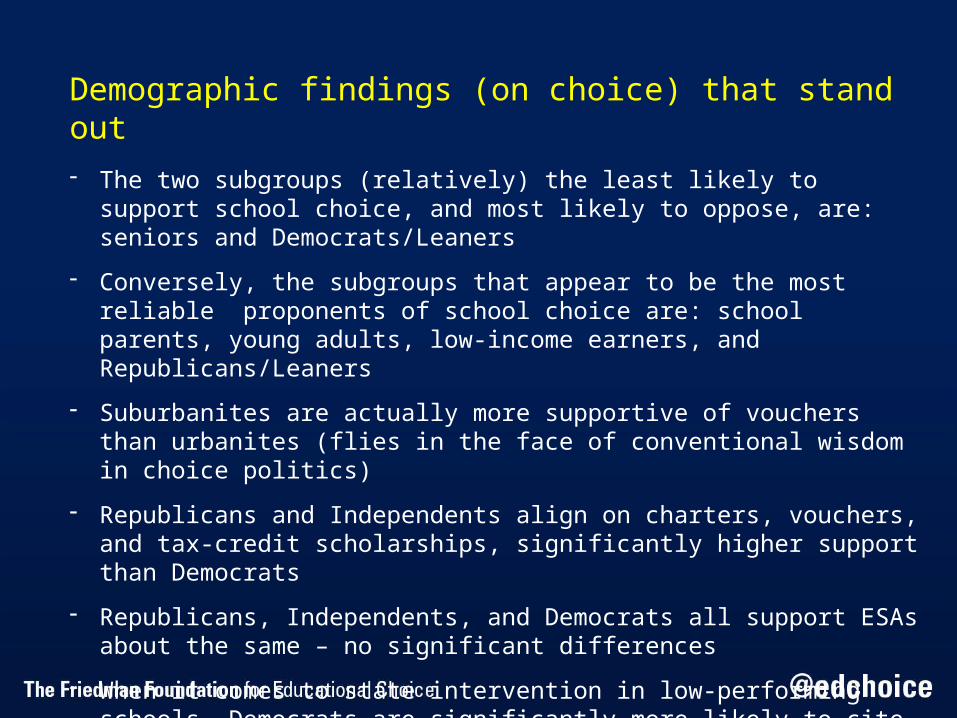
Demographic findings (on choice) that stand out- The two subgroups (relatively) the least likely to support school
choice, and most likely to oppose, are: seniors and Democrats/Leaners
- Conversely, the subgroups that appear to be the most reliable proponents of school choice are: school parents, young adults, low-income earners, and Republicans/Leaners
- Suburbanites are actually more supportive of vouchers than urbanites (flies in the face of conventional wisdom in choice politics)
- Republicans and Independents align on charters, vouchers, and tax-credit scholarships, significantly higher support than Democrats
- Republicans, Independents, and Democrats all support ESAs about the same – no significant differences
- When it comes to state intervention in low-performing schools, Democrats are significantly more likely to cite school choice as a remedy than Republicans

Common Core
Standardized Testing
Intervention in Schools


Specific findings that stand out- Increase in support of ESAs (56% in ‘14 to 62% in ‘15)
- Drop in support of charter schools (61% in ‘14 to 53% in ‘15)
- If the state intervenes in a low-performing school, the remedy cited most often (41%) as useful to families was “supplying vouchers/scholarships/ESAs” to students
- Public opinion on Common Core remains mixed
- Net intensities on choice questions are positive, but negative on the Common Core questions
- 4 out of 10 respondents (42%) said amount of time spent on testing is “too high”; even higher among school parents (47%)
- Almost 4 of 5 (77%) give “fair” or “poor” ratings toward federal involvement in K-12 matters (NCLB reauthorization discussions should whip up next month)

Thank You
Paul [email protected]
Full report and section files are available at
edchoice.org/nationalsurvey2015


About the Friedman Foundation
edchoice.org
• Est. in 1996 by Milton & Rose Friedman• Based in Indianapolis, IN• 501(c)(3) / Nonpartisan / Nonprofit• Annual Activities/Services in 30+ states
• What do we do?
Research, Data Collection & Analysis Legislator Education, Advocate Education Partnerships/Coalitions, Government Relations

What we mean by “school choice”
• Public education funding should follow the student to whichever school – public or private – that family feels is best to meet the child’s needs and priorities.
• Separate the public education funding mechanism from the administration and operation of schools, and minimize the inherent conflict of interest in such arrangements.

Types of School Choice Programs
• Vouchers – funds typically expended by the state and/or school district would be allocated to a participating family in the form of a voucher to pay partial or full tuition for their child’s private school, including both religious and non-religious options.
• Education Savings Accounts (ESAs) – allow parents to take their child out of a public school and receive a deposit of public funds into government-authorized savings accounts that can apply toward private school tuition/fees, tutoring, online education programs, special needs therapies, or save for future college expenses.
• Tax-Credit Scholarships – eligible individual/corporate taxpayers can receive full or partial tax credits when they donate to nonprofits that provide private school scholarships.
Compare with other national surveys

EdNext-PEPG/KN (2007 to 2014)Public Support for Low-Income Vouchers

PDK/Gallup (1970 to 2014)Public Support for [Vouchers]

“Classics”


![Ch. 8 Secondary Schooling in America - Dr. William Allan Kritsonis]](https://img.pdfslide.net/doc/110x75/55535944b4c905031f8b46d0/ch-8-secondary-schooling-in-america-dr-william-allan-kritsonis.jpg)