Embed Size (px)
Citation preview
Cleveland State UniversityEngagedScholarship@CSU
Urban Publications Maxine Goodman Levin College of Urban Affairs
9-2015
Mapping the Opportunities for ShaleDevelopment in OhioIryna LendelCleveland State University, [email protected]
Andrew R. ThomasCleveland State University, [email protected]
Bryan Townley
Jeffrey C. Dick
Follow this and additional works at: http://engagedscholarship.csuohio.edu/urban_facpub
Part of the Urban Studies and Planning Commons
This Report is brought to you for free and open access by the Maxine Goodman Levin College of Urban Affairs at EngagedScholarship@CSU. It hasbeen accepted for inclusion in Urban Publications by an authorized administrator of EngagedScholarship@CSU. For more information, please [email protected].
Repository CitationLendel, Iryna; Thomas, Andrew R.; Townley, Bryan; and Dick, Jeffrey C., "Mapping the Opportunities for Shale Development inOhio" (2015). Urban Publications. Paper 1328.http://engagedscholarship.csuohio.edu/urban_facpub/1328
2121 Euclid Avenue Cleveland, Ohio
44115
http://urban.csuohio.edu
2121 Euclid Avenue Cleveland, Ohio
44115
http://urban.csuohio.edu
MAPPING THE
OPPORTUNITIES
FOR SHALE
DEVELOPMENT
IN OHIO
MAPPING THE
OPPORTUNITIES
FOR SHALE
DEVELOPMENT
IN OHIO
MAPPING THE
OPPORTUNITIES
FOR SHALE
DEVELOPMENT
Prepared for:
THE ECONOMIC GROWTH FOUNDATION RECS SHALE COMMITTEE
JOBSOHIO
September 2015
December 30, 2014
THE ECONOMIC GROWTH FOUNDATION RECS SHALE COMMITTEE
JOBSOHIO
Center for
Economic
Development
Energy Policy
Center

Prepared for:
The Economic Growth Foundation
RECS Shale Committee
JobsOhio
Prepared by:
Center for Economic Development
Energy Policy Center
Maxine Goodman Levin College of Urban Affairs
Cleveland State University
September 2015


Acknowledgments
About the Research Team
Iryna V. Lendel - author
Dr. Iryna V. Lendel is an economist with experience in conducting academic and applied
research as well as analyzing regional economic development. Her research portfolio includes
projects on industrial analysis (high-tech industries, the oil and gas industry, steel industry and
the re-emerging optics industry); technology-based economic development; and the energy
policy and economics. Dr. Lendel is the Research Associate Professor of Economic Development
and Assistant Director of the Center for Economic Development at the Maxine Goodman Levin
College of Urban Affairs at Cleveland State University.
Dr. Lendel is affiliated with the Center for Energy Policy and Applications at Cleveland State
University. Dr. Lendel was a principal co-investigator on a project assessing the economic impact
of the Utica Shale development on the State of Ohio. She is a principal investigator of the
current study on the potential opportunities on downstream, midstream and upstream
industries resulting from further development of Ohio Utica shale resources and shale gas
industry in Ohio and Pennsylvania. She is an assistant editor of Economic Development
Quarterly and a Member of Editorial Board of International Shale Gas and Oil Journal; and she is
a frequent guest blogger at Crain’s Ohio Energy Report. [email protected], 216-875-9967.
Andrew Thomas – author
Andrew Thomas is an Executive-in-Residence with the Energy Policy Center in the Maxine
Goodman Levin College of Urban Affairs of Cleveland State University where he researches oil
and gas regulation and law. His research also includes electricity markets and regulation. He
was formerly a geophysicist with Shell Oil Company, and has been a practicing energy lawyer in
Louisiana and Ohio for the past 20 years. He serves as counsel to the university facilities
management and is adjunct to the Cleveland Marshall School of Law and the College of Urban
Affairs, where he teaches courses in energy law and policy. He also teaches oil and gas
contracting courses internationally. [email protected], 216-687-9304.

Bryan Townley – contributing author
Bryan Townley primarily worked with the geographic information systems (GIS) and
cartographic portions of this project, while also contributing research and writing pertaining to
midstream and downstream infrastructure and development. Townley is a graduate research
assistant with the Center for Economic Development and is a graduate student in the Urban
Planning, Design, and Development program at the Maxine Goodman Levin College of Urban
Affairs.
Jeffrey C. Dick, Ph.D. – contributing author
Dr. Dick's primary research interests are centered around ground water occurrence and
contamination, coastal processes of Lake Erie and San Salvador, Bahamas, and geographic
information system applications in the geosciences. The primary focus of Professor Dick’s
academic career has been integrating technology and field experiences to improve
undergraduate education. Professor Dick has also served Youngstown State University since
2003 as Director of Undergraduate Research. He is the chair for the geological and
environmental science department and is the director for the Natural Gas and Water Resources
Institute at Youngstown State. He previously worked for Chevron as a petroleum geologist.
Ohio Regional Economic Competitiveness Strategy
Shale Development Steering Committee Members
Don Fischbach, Co-Chair, Calfee, Halter & Griswold
Edward (Ned) Hill, Co-Chair, the John Glenn College of Public Affairs, The Ohio State
University
Paul Boulier, TeamNEO
Bill Hagstrand, TeamNEO
Thomas M. Humphries, Youngstown/Warren Regional Chamber of Commerce
Daniel E. Klimas, Lorain National Bank
John Molinaro, Appalachian Partnership for Economic Growth
David Mustine, JobsOhio
Steve Percy, former CEO of BP America
Steve Paquette, Stark Development Board
Jim Samuel, Capitol Integrity Group
Economic Growth Foundation
Jobs Ohio
About the Center for Economic Development
The Center for Economic Development at Cleveland State University’s Maxine Goodman Levin
College of Urban Affairs provides research and technical assistance to government agencies,
non-profit organizations, and private industry. The Center for Economic Development serves as
a designated Economic Development Administration (EDA) University Center, since 1985.
The Center has expertise in studying ecology of innovation, entrepreneurship, performance of
economic clusters, industry analysis, economic analysis of cities and regions, economic impact,
economic development strategy and policy, workforce development and evaluation of economic
development initiatives.
The Center’s professional staff includes four full-time researchers, associated faculty, and
several graduate research assistants. The Center works with funders, partners, and clients at the
national, state, regional, and local levels. All of the Center’s research is summarized in
publications, including working reports, journal articles, and book chapters.
For more information on the Center for Economic Development, use the following link:
http://urban.csuohio.edu/economicdevelopment/
About the Energy Policy Center
The Energy Policy Center (EPC) is housed within the Maxine Goodman Levin College of Urban
Affairs at Cleveland State University. The mission of the EPC is to help overcome social and
institutional barriers to the implementation of solutions to energy challenges by providing an
objective channel for the free exchange of ideas, the dissemination of knowledge, and the
support of energy-related research in the areas of public policy, economics, business and social
science.
For more information on the Energy Policy Center, use the following link:
http://urban.csuohio.edu/epc/
Table of Contents Executive Summary ......................................................................................................................... 1
1. Introduction ................................................................................................................................ 7
1.1. Background, Issues Presented and Scope of Research. ....................................................... 7
1.2 Midstream Industries and Throughput Capacity. .................................................................. 8
1.3 Refining of Natural Gas Liquids and the Petrochemical Industry .......................................... 9
1.4 Research Methodology ......................................................................................................... 9
2. Utica Shale Production History and Projections ....................................................................... 11
2.1. Factors Controlling Production ........................................................................................... 11
2.1.1. Natural Gas Prices ....................................................................................................... 11
2.1.2. Midstream Infrastructure Catch Up ............................................................................ 17
2.1.3. Drilling Rig Availability and Technology Improvements .............................................. 18
2.1.4. Effects of Unitization and Stranded Leases ................................................................. 22
2.1.5. Strategies of Principal Utica Upstream Players ........................................................... 23
2.2. Volumes and Throughput Projections ................................................................................ 28
2.2.1. Projections Based Upon Publicly Available Data ......................................................... 28
2.2.1.1. Production data ........................................................................................................ 28
2.2.1.2. Well Status ................................................................................................................ 29
2.2.1.3. Production Type Zones ............................................................................................. 30
2.2.1.4. Production Distribution ............................................................................................ 32
2.2.1.5. Potential Productive Acreage ................................................................................... 34
2.2.1.6. Drilling Estimates ...................................................................................................... 35
2.2.1.7. Decline Projections ................................................................................................... 36
2.2.1.8. Throughput Projections ............................................................................................ 37
2.2.2. Midstream and Other Industry Throughput Projections............................................. 39
2.3. Midstream Company Activities .......................................................................................... 40
2.3.1. Gathering Lines ............................................................................................................ 40
2.3.2. Cryogenic Processing and Fractionation Capacity ....................................................... 42
2.3.3. Natural Gas Liquids Take Away Capacity ..................................................................... 47
2.3.4. Regional Production Compared to Regional Processing and Take Away Capacity ..... 50
2.3.5. Natural Gas Take Away Capacity ................................................................................. 57
2.3.6. Condensate Midstream Infrastructure ........................................................................ 62
3. Prospects for Utica-Marcellus products in Ohio....................................................................... 65
3.1. Demand for the Natural Gas Uses ...................................................................................... 65
3.2. Wet Gas as a Feedstock for the Petrochemical and Chemical Industries .......................... 68
3.3. Natural Gas as Fuel for Transportation .............................................................................. 75
3.4. Power Production and Heat Generation ............................................................................ 78
3.5. Gas to Liquids Technology Development ........................................................................... 82
3.6. International Export of Natural Gas ................................................................................... 83
3.7. Methanol and Fertilizer Industries ..................................................................................... 85
4. PROSPECTS FOR OHIO DOWNSTREAM DEVELOPMENT .......................................................................... 87
4.1 Regional Market for Oil and Gas Products .......................................................................... 89
4.2. Availability of Feedstock ..................................................................................................... 90
4.3. Transportation, Storage, and Pipeline Redundancy ........................................................... 96
4.4. Role of Long Term Contracts in Downstream Development .............................................. 99
4.6. Economics of Petrochemical Feedstock ........................................................................... 106
4.7. Main Nodes of Ohio Development and Critical Investment Decisions ............................ 111
Abbreviation Glossary ............................................................................................................. 115
APPENDIX A ................................................................................................................................. 116
APPENDIX B ................................................................................................................................. 119
APPENDIX C ................................................................................................................................. 124
List of Figures
Figure 1. Annual average Hub spot prices for natural gas in five cases, 1990-2014 (2012 dollars
per million btu) .............................................................................................................................. 12
Figure 2. U.S. natural gas production, three scenarios, 1990-2040 (tcf per year) ........................ 13
Figure 3. EIA projected and historical natural gas consumption by sector (tcf) and annual Henry
Hub spot prices (2012$ per mmbtu) (for the reference case after 2012; 1990-2040). ................ 14
Figure 4. Marcellus Regional Gas Prices and Henry Hub Spot Price and Map of Main Natural Gas
Regional Trading Hubs. .................................................................................................................. 15
Figure 5. Dynamic of Rotary Drilling Rigs Count in Selected States. 2004-2015. .......................... 19
Figure 6. Rig Count by Type of Wells in Selected Basins. 2011-2015 ............................................ 20
Figure 7. Rig Count by Basin: 12 Weeks December 2014 – February 2015 .................................. 21
Figure 8. Spatial Distribution of Permitted, Drilled and Producing Wells of Main 7 Utica
Operators....................................................................................................................................... 24
Figure 9. Distribution of Drilled, Permitted and Producing Wells of Chesapeake and EnerVest .. 26
Figure 10. Gulfport Permitted, Drilled and Producing Wells in Utica. .......................................... 27
Figure 11. Ohio Utica Shale Well Status. ....................................................................................... 30
Figure 12. Ohio Utica Shale Production Areas with Initial Production Test btu Values, October
2014 ............................................................................................................................................... 31
Figure 13. Ohio Utica Shale Total Production Barrels of Oil Equivalent (boe), October 2014 ...... 33
Figure 14. Ohio Utica Shale Peak Average Daily Production Barrels of Oil Equivalent Per Day
(boepd), October 2014 .................................................................................................................. 33
Figure 15. Ohio Utica Shale Area and Production Units, October 2014 ........................................ 34
Figure 16. Utica Shale Projected Decline Curve ............................................................................ 37
Figure 17. Gathering Trunk Lines and Cryogenic Processing Facilities in the Utica Region, June
2015 ............................................................................................................................................... 42
Figure 18. Cryogenic Processing, Fractionation, and De-Ethanization in the Utica Region, June
2015 ............................................................................................................................................... 47
Figure 19. NGL Pipelines in the Utica and Marcellus Regions, June 2015 ..................................... 54
Figure 20. Proposed NGL Pipelines in the Utica and Marcellus Regions, June 2015 .................... 55
Figure 21. NGL Pipelines by Type in the Utica and Marcellus Regions, June 2015 ....................... 56

Figure 22. Natural Gas Interstate Pipeline Expansion Projects in the Utica, Announced as of
October 2014 ................................................................................................................................. 61
Figure 23. Natural Gas Interstate Expansion Projects by Type, Announced as of June 2015 ....... 61
Figure 24. Existing and Proposed Crude Oil and Condensate Pipelines in Ohio, June 2015 ......... 64
Figure 25. Crude Oil, Condensate, and Refined Product Pipelines in Ohio, June 2015 ................ 64
Figure 26. Projected Energy Demand, 2035 .................................................................................. 66
Figure 27. Growth of Oil and NGLs Demand by 2035.................................................................... 67
Figure 28. Projected Incremental Natural Gas Demand, 2020 ..................................................... 68
Figure 29. Global Chemical Shipments by Region (billions of dollars) .......................................... 69
Figure 30. NGL Consumption by Sector and Source, 2013 ............................................................ 70
Figure 31. Ethylene Chain to Final Products .................................................................................. 71
Figure 32. Average Monthly Ethane, Naphtha, Ethylene and Their Spreads, 2010 – 2014. ......... 73
Figure 33. Average Monthly Propane, Propylene, and Their Spreads, 2010 – 2014. ................... 74
Figure 34. U.S. Natural Gas Vehicle Fuel Consumption, mmcf ..................................................... 76
Figure 35. CNG Stations in Ohio, October 2014 ............................................................................ 78
Figure 36. Capacity of Coal-Fired Power Generation Plants Planned to Retire, 2012 – 2025 ...... 80
Figure 37. Total Net Summer Capacity of Natural Gas Power Plants in Ohio, October 2014 ....... 81
Figure 38. Approved, Proposed, and Potential LNG Export Facilities, December 2014 ................ 85
Figure 39. U.S. Gas Plant Production of Ethane-Ethylene ............................................................. 88
Figure 40. Natural Gas Liquids Spot Prices .................................................................................... 93
Figure 41. Utica Natural Gas Production and Total Rigs ............................................................... 95
Figure 42. Underground Natural Gas Storage Facilities in the United States, 2010. .................... 98
Figure 43. Products from Petroleum Feedstock .......................................................................... 101
Figure 44. Concentration of Commodity Chemicals Companies in the Tri-State Region ............ 103
Figure 45. Crude Oil Prices React to a Variety of Geopolitical and Economic Events ................. 108
Figure 46. Oil and Gas Development Timeline for the Utica ....................................................... 114
List of Tables
Table 1. Leading Utica Drilling Companies in Ohio, 2013-2014 .................................................... 24
Table 2. Five-Year Most Likely Drilling Rate Estimate ................................................................... 36
Table 3. 2014 Throughput Projections .......................................................................................... 38
Table 4. 2019 Throughput Projections .......................................................................................... 38
Table 5. Comparison of Study Derived Throughput to Public Industry Projections ...................... 40
Table 6. Existing Processing Capacity in the Utica, June 2015 ...................................................... 45
Table 7. Planned Processing Capacity Expansions in the Utica, June 2015................................... 46
Table 8. Utica NGL Take Away Capacity, June 2015 ...................................................................... 50
Table 9. Existing Processing Capacity in the Utica and Marcellus, June 2015 .............................. 51
Table 10. Planned Processing Capacity Expansions in the Utica and Marcellus, June 2015 ......... 52
Table 11. Utica and Marcellus Projected Production Compared to Fractionation Capacity,
2020…… ......................................................................................................................................... 53
Table 12. Outflow Capacity from Ohio, Pennsylvania, and West Virginia, 2013 .......................... 57
Table 13. Planned Utica Natural Gas Take Away Capacity Additions, October 2014 ................... 60
Table 14. NAICS Profile of the Top U.S. Commodity Chemicals Companies ............................... 102
Table 15. Employment and GRP Location Quotients of the Commodity Chemicals Companies
within the 500 miles Radius from Proposed Regional Crackers .................................................. 105
Table 16. Estimates of Production from Different Feedstock ..................................................... 107
Table 17. Ethylene Production Costs from Different Feedstock, c/lb ......................................... 109

Mapping the Opportunities for Shale Development in Ohio
Center for Economic Development, Cleveland State University Page 1
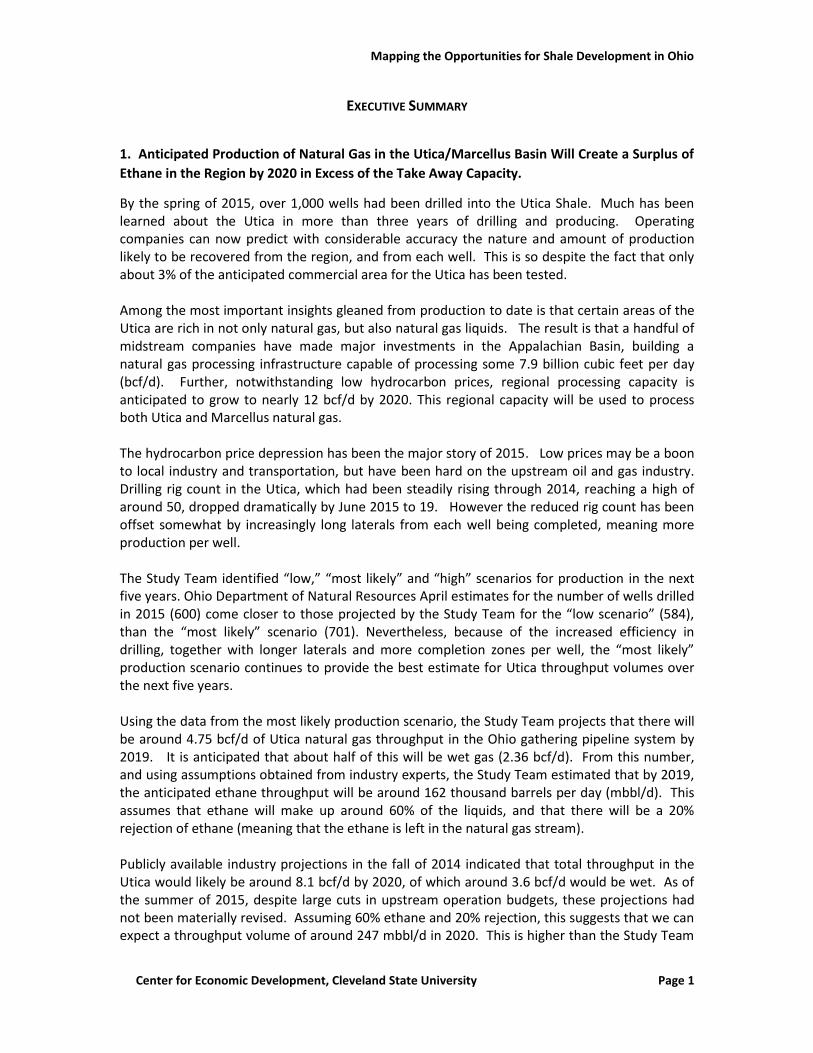
EXECUTIVE SUMMARY
1. Anticipated Production of Natural Gas in the Utica/Marcellus Basin Will Create a Surplus of
Ethane in the Region by 2020 in Excess of the Take Away Capacity.
By the spring of 2015, over 1,000 wells had been drilled into the Utica Shale. Much has been learned about the Utica in more than three years of drilling and producing. Operating companies can now predict with considerable accuracy the nature and amount of production likely to be recovered from the region, and from each well. This is so despite the fact that only about 3% of the anticipated commercial area for the Utica has been tested. Among the most important insights gleaned from production to date is that certain areas of the Utica are rich in not only natural gas, but also natural gas liquids. The result is that a handful of midstream companies have made major investments in the Appalachian Basin, building a natural gas processing infrastructure capable of processing some 7.9 billion cubic feet per day (bcf/d). Further, notwithstanding low hydrocarbon prices, regional processing capacity is anticipated to grow to nearly 12 bcf/d by 2020. This regional capacity will be used to process both Utica and Marcellus natural gas. The hydrocarbon price depression has been the major story of 2015. Low prices may be a boon to local industry and transportation, but have been hard on the upstream oil and gas industry. Drilling rig count in the Utica, which had been steadily rising through 2014, reaching a high of around 50, dropped dramatically by June 2015 to 19. However the reduced rig count has been offset somewhat by increasingly long laterals from each well being completed, meaning more production per well. The Study Team identified “low,” “most likely” and “high” scenarios for production in the next five years. Ohio Department of Natural Resources April estimates for the number of wells drilled in 2015 (600) come closer to those projected by the Study Team for the “low scenario” (584), than the “most likely” scenario (701). Nevertheless, because of the increased efficiency in drilling, together with longer laterals and more completion zones per well, the “most likely” production scenario continues to provide the best estimate for Utica throughput volumes over the next five years. Using the data from the most likely production scenario, the Study Team projects that there will be around 4.75 bcf/d of Utica natural gas throughput in the Ohio gathering pipeline system by 2019. It is anticipated that about half of this will be wet gas (2.36 bcf/d). From this number, and using assumptions obtained from industry experts, the Study Team estimated that by 2019, the anticipated ethane throughput will be around 162 thousand barrels per day (mbbl/d). This assumes that ethane will make up around 60% of the liquids, and that there will be a 20% rejection of ethane (meaning that the ethane is left in the natural gas stream). Publicly available industry projections in the fall of 2014 indicated that total throughput in the Utica would likely be around 8.1 bcf/d by 2020, of which around 3.6 bcf/d would be wet. As of the summer of 2015, despite large cuts in upstream operation budgets, these projections had not been materially revised. Assuming 60% ethane and 20% rejection, this suggests that we can expect a throughput volume of around 247 mbbl/d in 2020. This is higher than the Study Team
Mapping the Opportunities for Shale Development in Ohio
Center for Economic Development, Cleveland State University Page 2
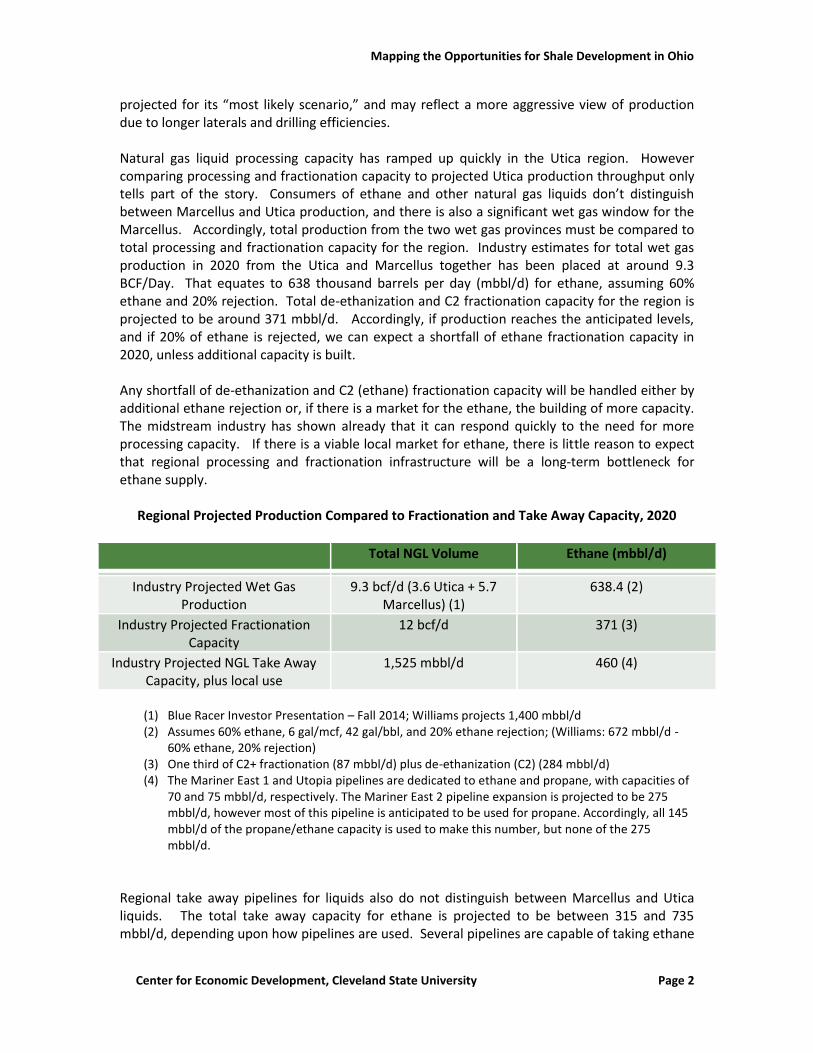
projected for its “most likely scenario,” and may reflect a more aggressive view of production due to longer laterals and drilling efficiencies. Natural gas liquid processing capacity has ramped up quickly in the Utica region. However comparing processing and fractionation capacity to projected Utica production throughput only tells part of the story. Consumers of ethane and other natural gas liquids don’t distinguish between Marcellus and Utica production, and there is also a significant wet gas window for the Marcellus. Accordingly, total production from the two wet gas provinces must be compared to total processing and fractionation capacity for the region. Industry estimates for total wet gas production in 2020 from the Utica and Marcellus together has been placed at around 9.3 BCF/Day. That equates to 638 thousand barrels per day (mbbl/d) for ethane, assuming 60% ethane and 20% rejection. Total de-ethanization and C2 fractionation capacity for the region is projected to be around 371 mbbl/d. Accordingly, if production reaches the anticipated levels, and if 20% of ethane is rejected, we can expect a shortfall of ethane fractionation capacity in 2020, unless additional capacity is built. Any shortfall of de-ethanization and C2 (ethane) fractionation capacity will be handled either by additional ethane rejection or, if there is a market for the ethane, the building of more capacity. The midstream industry has shown already that it can respond quickly to the need for more processing capacity. If there is a viable local market for ethane, there is little reason to expect that regional processing and fractionation infrastructure will be a long-term bottleneck for ethane supply.
Regional Projected Production Compared to Fractionation and Take Away Capacity, 2020
Total NGL Volume Ethane (mbbl/d)
Industry Projected Wet Gas Production
9.3 bcf/d (3.6 Utica + 5.7 Marcellus) (1)
638.4 (2)
Industry Projected Fractionation Capacity
12 bcf/d 371 (3)
Industry Projected NGL Take Away Capacity, plus local use
1,525 mbbl/d 460 (4)
(1) Blue Racer Investor Presentation – Fall 2014; Williams projects 1,400 mbbl/d (2) Assumes 60% ethane, 6 gal/mcf, 42 gal/bbl, and 20% ethane rejection; (Williams: 672 mbbl/d -
60% ethane, 20% rejection) (3) One third of C2+ fractionation (87 mbbl/d) plus de-ethanization (C2) (284 mbbl/d) (4) The Mariner East 1 and Utopia pipelines are dedicated to ethane and propane, with capacities of
70 and 75 mbbl/d, respectively. The Mariner East 2 pipeline expansion is projected to be 275 mbbl/d, however most of this pipeline is anticipated to be used for propane. Accordingly, all 145 mbbl/d of the propane/ethane capacity is used to make this number, but none of the 275 mbbl/d.
Regional take away pipelines for liquids also do not distinguish between Marcellus and Utica liquids. The total take away capacity for ethane is projected to be between 315 and 735 mbbl/d, depending upon how pipelines are used. Several pipelines are capable of taking ethane

Mapping the Opportunities for Shale Development in Ohio
Center for Economic Development, Cleveland State University Page 3
or propane, and at least one can also take heavier liquids. However Sunoco, the owner of the new 275 mbbl/d Mariner East line, has indicated the line would be used primarily for propane. Accordingly, a reasonable estimate for take away capacity is around 460 mbbl/d by 2020. This estimate assumes that the lines dedicated to ethane and propane jointly are used for ethane, and the lines dedicated for C2 and up are not used for ethane. For purposes of evaluating the likelihood of a developing local market for ethane, this number is important. Current industry projections for ethane production, assuming 20% rejection, are such that we can expect a shortfall in the ability of the industry to ship ethane out of the region. Such a take-away shortfall invites the development of a local ethane market. Based upon projections for production and take away capacity, it appears that ethane production (with 20% rejection) could outpace take away capacity in 2020 by 200 mbbl/d or more, depending upon how much take away capacity is used for propane and heavier liquids. This excess production should be attractive for petrochemical companies locating or considering a location in the Ohio/West Virginia/Pennsylvania region of the Appalachian basin. However the local market will have to be at least as valuable as that for methane, because producers should be able to reduce this excess considerably, and possibly entirely, by rejecting more ethane. A local market needs to be developed to prevent ethane rejection or a building of additional take away capacity. 2. Ethane Surplus in the Utica/Marcellus Basin Should Drive the Development of Downstream Markets for Ethane in Ohio, Creating Opportunity for New Growth in the Downstream Petrochemical Business. A regional surplus of ethane creates an opportunity for the development of Ohio businesses downstream of the processing and fractionation facilities. Ohio is already a significant national player nationally in the chemical industry, exporting chemical commodities worth $6.5 billion/year. Chemical industries in Ohio have an employment location quotient of 2.0, and a Gross Regional Product location quotient of 1.81 – among the highest in the nation. This means that the concentration of employment in the chemical industry in Ohio is twice that of the national average. The Ohio chemical and petrochemical industries in particular could gain from a regional surplus of natural gas liquids. These industries use ethylene and polyethylene, among other refined hydrocarbon products, as raw material for their products. In the United States, ethylene and polyethylene are primarily made from cracking ethane. Currently most of the cracking facilities are located in the Louisiana and Texas Gulf Coast, where natural gas liquids have been historically produced in abundance. Ohio’s downstream manufacturers have had to acquire these products primarily from petrochemical companies located on the Gulf Coast. With the Appalachian area quickly developing into one of America’s largest sources of natural gas and natural gas liquids, long-term hydrocarbon prices in the region have become attractive to petrochemical companies. Further, with a large market for commodity chemicals already located in the region, petrochemical companies also stand to gain from transportation cost savings. It is possible that some of these savings in costs will be passed along to markets downstream of the cracker facility, such as to distributers, compounders and converters. The savings for ethane transportation, together with the savings on shipping polyethylene from the
Mapping the Opportunities for Shale Development in Ohio
Center for Economic Development, Cleveland State University Page 4
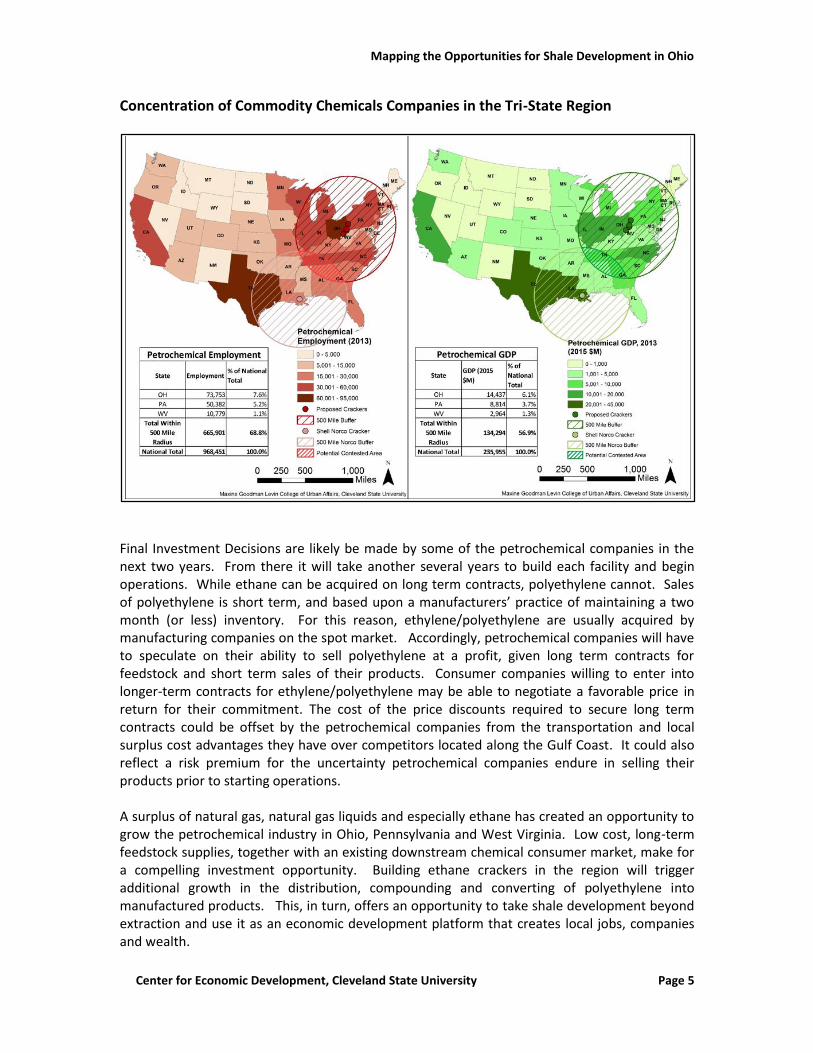
Gulf Coast back to the Midwest, has been projected to be around $100 million per year for each prospective local large scale cracker. In light of this opportunity, by the summer of 2015 four petrochemical companies had publicly announced that they were considering building ethane crackers in the Appalachian Basin. None of the four have yet reached a “Final Investment Decision.” However they have advanced far enough to choose potential sites and to project likely required ethane feedstock requirements. Sites have been selected along the Ohio River, which is necessary for ease of transportation of equipment. If all four crackers are built, it would require an ethane supply of about 223 mbbl/d – roughly 1/3 of the anticipated total ethane locally available in 2020. With a projected take away capacity of about 430 mbbl/d for the region in 2020, these two ethane markets would likely consume the regional ethane production, with 20% ethane rejection. Obtaining firm commitments for ethane will be a critical step for the petrochemical companies. Currently two of the companies have announced at least tentative long-term contracts for delivery of ethane. The terms of the deals have not been released, however insofar as no Final Investment Decision has been made, the contracts are likely not firm commitments. Once the Final Investment Decision has been made, the contracts are likely to have components of both “take and pay” and “warranty” commitments. This means that the petrochemical company will have to commit to take, and the producing company to deliver, a range of ethane volumes. One cost advantage the Gulf Coast has over Appalachia relates to storage capacity. Ethane is volatile at atmospheric temperatures and pressures, and as such cannot be easily stored. Storage is principally located underground in salt caverns or in permeable sandstone reservoirs. All such storage in the Appalachian region is already being used by natural gas. Accordingly, Appalachian petrochemical companies must develop other strategies for storage. There are multiple strategies for dealing with storage challenges. The most common strategy is pipeline packing – whereby the line pressure is increased, enabling additional ethane to be stored in the line. This is done commonly for natural gas lines, and can be a short-term solution for ethane storage. Long-term solutions will require use of pipeline redundancy and back up contracts among petrochemical companies and upstream producers. For this reason, it is important that more than one cracker facility is located in the region; it provides both the cracker companies and the producers with flexibility to respond to ethane supply volatility. Access to downstream consumers of ethylene and polyethylene is among the most important considerations for petrochemical companies. About 69% of all U.S. chemical commodity employment is located within a 500-mile radius from the Ohio Valley - an effective one day transportation distance. Likewise, around $134 billion of Gross Regional Product was generated by 57% of the commodity chemical companies in this radius. Ohio accounts for about a 10% share of the national employment in this industry – second in the nation after Texas. Likewise, half the 26 states within the 500 mile radius have location quotients for Commodity Chemical Companies greater that 1.2 – meaning that this industry is considered to be a part of the economic base for that state’s economy.
Mapping the Opportunities for Shale Development in Ohio
Center for Economic Development, Cleveland State University Page 5
Concentration of Commodity Chemicals Companies in the Tri-State Region
Final Investment Decisions are likely be made by some of the petrochemical companies in the next two years. From there it will take another several years to build each facility and begin operations. While ethane can be acquired on long term contracts, polyethylene cannot. Sales of polyethylene is short term, and based upon a manufacturers’ practice of maintaining a two month (or less) inventory. For this reason, ethylene/polyethylene are usually acquired by manufacturing companies on the spot market. Accordingly, petrochemical companies will have to speculate on their ability to sell polyethylene at a profit, given long term contracts for feedstock and short term sales of their products. Consumer companies willing to enter into longer-term contracts for ethylene/polyethylene may be able to negotiate a favorable price in return for their commitment. The cost of the price discounts required to secure long term contracts could be offset by the petrochemical companies from the transportation and local surplus cost advantages they have over competitors located along the Gulf Coast. It could also reflect a risk premium for the uncertainty petrochemical companies endure in selling their products prior to starting operations. A surplus of natural gas, natural gas liquids and especially ethane has created an opportunity to grow the petrochemical industry in Ohio, Pennsylvania and West Virginia. Low cost, long-term feedstock supplies, together with an existing downstream chemical consumer market, make for a compelling investment opportunity. Building ethane crackers in the region will trigger additional growth in the distribution, compounding and converting of polyethylene into manufactured products. This, in turn, offers an opportunity to take shale development beyond extraction and use it as an economic development platform that creates local jobs, companies and wealth.

Mapping the Opportunities for Shale Development in Ohio
Center for Economic Development, Cleveland State University Page 6
Mapping the Opportunities for Shale Development in Ohio
Center for Economic Development, Cleveland State University Page 7
1. INTRODUCTION
1.1. Background, Issues Presented and Scope of Research. In 2012 a research team from Cleveland State University, Ohio State University and Marietta
College jointly published a projection of the likely economic impact from the development of
the then nascent Utica/Point Pleasant (hereinafter Utica) Shale formation oil and gas play.1
That report looked at job creation and the economic development value associated with
upstream and portions of midstream oil and gas development. It did not undertake to look at
the downstream potential for shale development.2 While the report used the best data then
available, the results were somewhat speculative, since at the time of publication, little was
known about the nature or quantity of production from the Utica.
Today, three years later, we are still very much in the early stages of development of the Utica
shale formation. However, a great deal more information is available now than was available in
2012. By the fall of 2014, some 584 Utica wells had reported production data to the Ohio
Department of Natural Resources (ODNR). The data indicate that the projections from the 2012
study were generally accurate with regard to the likely number of wells to be drilled, but were
low with regard to their rate of production. Technology improvements, together with a better
understanding of the geology, have caused the industry to revise upward its original estimates
of the likely production to come from the Utica.
One important change to the projections from 2012 relates to the production of natural gas
liquids (NGLs)3 – those heavier, more complex, hydrocarbons that are held in suspension in
natural gas streams. Some of these liquids fall out during production and transportation, with
the reduction of temperature and pressure. Some are taken to processing plants to be removed
from the natural gas stream. Interstate pipelines cannot take gas that contains a quantity of
liquids exceeding a regulated threshold (btu content), thus requiring processing of gas streams
rich in liquids (called “wet gas”). Further, some liquids tend to be more valuable than natural
gas, so processing is usually well worth the cost if they are present in sufficient volumes. It was
anticipated in 2012 that there would be zones within the Utica that produced large enough
volumes of NGLs to justify investments in processing plant infrastructure in Ohio. Accordingly, a
nascent gas gathering and processing (midstream) industry was already in the planning stage by
late 2012.
However the volume of liquids that has been produced to date has been more robust than
originally expected. Since then, there has been a rapid expansion in midstream infrastructure in
Ohio, with investments of hundreds of millions of dollars already having taken place. What’s
more, the Marcellus Shale formation also has a “wet gas” window, producing large amounts of
1 See Thomas, A., Lendel, I., Hill, E. et al, “An Analysis of the Economic Potential for Shale Formations in Ohio” (2012), Urban Publications, Paper 453, http://engagedscholarship.csuohio.edu/urban_facpub/453. For purposes of this paper, “Utica Shale” shall mean both the Utica and the Point Pleasant formations,
which formations occur together and are generally considered as one formation in reports. 2 See section 1.2, infra, for an explanation of what industries fall in which streams of the oil and gas industry. 3 Natural Gas Liquids include the following: ethane (2 carbon chain, or C2), propane (C3), butane (C4), and natural gasoline (C5 and higher). Sometimes natural gasoline is also called "natural gas condensate" because it can separate in the field with the change in pressure and temperature upon production.
Mapping the Opportunities for Shale Development in Ohio
Center for Economic Development, Cleveland State University Page 8
NGLs. This in turn has generated interest in the possibility of a petrochemical industry
renaissance in the region.
With these developments in mind, the Study Team was asked to investigate the likely mid and
downstream opportunities that may be arising in Ohio as a result of the Utica Shale drilling and
infrastructure build out. The questions posed are summarized as follows:
How has drilling in the Utica changed the picture with regard to anticipated production and throughput volumes?
What does the midstream infrastructure look like in Ohio, and will it keep up with production?
What amounts of NGLs are likely to be produced, what local markets for those liquids are available, and what is the value proposition for local industry in keeping those liquids in Ohio?
What opportunities are there for downstream development of industry in Ohio both from natural gas and NGLs?
What strategies might be deployed to capture these industries, and when should they be deployed?
The Study Team looked at these and other questions to guide its investigation. The study below
sets forth the results of the Study Team’s investigation.
1.2 Midstream Industries and Throughput Capacity. Oil and gas industry activities are categorized by operation into upstream, midstream and
downstream sectors. Upstream refers to the exploration and production end of the business:
drilling, completing and producing wells. Midstream oil and gas operations occur subsequent to
upstream operations. Midstream oil and gas activities include the gathering, compressing,
transporting, storing, treating, separating, processing and fractionation of hydrocarbons.
Downstream refers to those activities that take place subsequent to midstream activities. Such
activities include natural gas used in power generation, propane or methane used for home or
industrial heating, and methane used in fertilizer manufacturing. They also include refining
operations (e.g. reforming, cracking, or distillation) and all of those operations that
subsequently occur within the petrochemical industry, such as compounding, distribution and
conversion of petrochemicals. According to the North American Industry Classification System
(NAICS), upstream companies are those found within the mineral extraction industries, while
midstream companies are those found within the oil and gas transportation business.
Companies engaged in downstream activities usually are included in NAICS as manufacturing
industries, primarily in petroleum, petrochemical and chemical manufacturing.
Upstream operations require midstream infrastructure to take the production to market.
Accordingly, midstream investment is critical to the success of the upstream business. In order
to build sufficient infrastructure, midstream companies must estimate the likely volume of
hydrocarbons to be produced. Pipelines and processing plants are built based upon an expected
volume of production likely to be passing through their facilities (“throughput”) on a daily basis.
Midstream investment costs hundreds of millions of dollars. The construction of some
midstream facilities are secured by a contractually obligated delivery of production from certain
Mapping the Opportunities for Shale Development in Ohio
Center for Economic Development, Cleveland State University Page 9
wells or fields to those facilities.4 Others are financed based on the likely needed midstream
infrastructure in a given region, with the midstream company assuming all of the financial risk.
Either way, midstream companies will be making, and have already made, major capital
investment in their facilities, and their throughput estimates must be accurate.5
1.3 Refining of Natural Gas Liquids and the Petrochemical Industry Downstream companies face a similar problem. These companies must make investments,
often times in the billions of dollars, into their facilities based on the likely available throughput
and the likely market for their refined or reformed products.
Investment into natural gas refining, such as for ethane crackers, requires not only a secure
supply of the hydrocarbon raw products, it also requires a market for the product being refined.
Accordingly, long-term supply contracts either from producers or from those midstream
companies that take title to the liquids after processing is critical to enabling downstream
facility investment. Of course long-term contracts for sales of refined products from the facility
would likewise be important to obtaining investment capital. However, much of the market for
refined products made from NGLs today is spot, rather than long term. Accordingly, we can
expect that downstream refiners will have to assume the sales risk.
Natural gas liquid refineries take segregated liquids derived from the natural gas stream (“pure
products”) and, using processes like catalytic cracking, reform the liquid into a new product that
can be compounded, distributed and consumed by various operations further downstream. The
most common example of this is refining ethane into ethylene, which is then polymerized into
polyethylene pellets. Polyethylene is then distributed to various converter companies for
molding into plastics that are consumed in an assortment of commercial applications.
Investment by chemical companies into crackers and other refineries in the Utica Shale region
will be determined by a number of factors, including access to markets, transportation costs,
labor costs, and storage capacity. But the first and most important factor will be the likelihood
of production of large volumes of NGLs and condensate in the region. Regional production
volumes for liquids and condensate will, however, be controlled as much by the Marcellus
production as it will be by Utica Shale production.
1.4 Research Methodology The research methods used for this study include several undertakings. The first relates to the
assessment of likely upstream development and throughput scenarios. This was accomplished
through the collection of ODNR well production data, together with assessing likely drilling and
production scenarios based upon rig count, drilling times, and likely decline rates. Industry
projections for development and throughput were acquired through literature searches,
4 Sales of natural gas are usually based upon a “daily contract quantity,” and contracts to sell natural gas tend to be far more complex than those for sales of liquids due to the difficulty in storing natural gas. Industry trade associations, such as the Association of International Petroleum Negotiators, have developed forms for gas sales agreements. 5 The midstream industry has introduced flexibility to its planning by building pipelines that can increase capacity with pressure, and by making processing facilities modular. Most processing plants can be built on skids – standard capacity units - and installed or uninstalled for redeployment elsewhere.
Mapping the Opportunities for Shale Development in Ohio
Center for Economic Development, Cleveland State University Page 10
interviews, and conference presentations. These projections were then compared to the ODNR
data.
A second undertaking relates to the assessment of the status of the midstream oil and gas
infrastructure in Ohio. To obtain this data, the Study Team conducted both a literature search
and conducted interviews of the major midstream companies working in Ohio, together with
some of the major producers.
A similar investigation was undertaken to determine the downstream markets for natural gas
and NGLs, with a principal focus on ethane. For this the Study Team undertook literature
searches, attended industry conferences, and conducted interviews with downstream
companies, especially those in the petrochemical business downstream of the refinery.
Because the downstream industry takes into account regional projections of throughput and
does not differentiate Marcellus production from Utica production (both being in the same
region), the Study Team was required to look broadly at prospects for production, infrastructure
build out, and regional downstream development.
Finally, during the last phases of this study, hydrocarbon prices, especially for oil, dropped
dramatically, calling into question some of the industry projections for production and
infrastructure build out. The Study Team looked at a range of production scenarios that has
likely captured the effects of this downturn. However at the time of publication, publicly
available industry projections for production and infrastructure had not yet been materially
altered – notwithstanding industry-wide cut backs in capital expenditures in the upstream
business. In the coming months, this is likely to change. The Study Team has, where
appropriate and possible, commented throughout the study about the possible effects of this
downturn.
Mapping the Opportunities for Shale Development in Ohio
Center for Economic Development, Cleveland State University Page 11
2. UTICA SHALE PRODUCTION HISTORY AND PROJECTIONS
2.1. Factors Controlling Production The pace at which the Utica shale resource develops depends upon factors reflecting regional,
national and sometimes global considerations. Regional factors include such things as the
availability of local labor, infrastructure, supplies and contractors, as well as the status of state
regulations. National and global factors, on the other hand, are beyond the control of regional
players; they have to react to the realities presented by market forces. In most cases, global
tendencies in oil and gas development influence local conditions through adjustments in
business strategies of multinational corporations. Global oil prices, for instance, affect the
availability of capital for investment into regional drilling, production and infrastructure and
determine if it is profitable to drill and process natural gas and its derivatives in the Appalachian
basin.
In this study we accounted for the influence of five factors that control the regional production
of dry gas and NGLs, including natural gas prices, the pace of construction in the region’s
midstream infrastructure, the availability of drilling rigs, the effect of unitization, stranded or
expiring leases, and the 2014-2015 business strategies of the principal Utica upstream players.
These factors are largely regional in nature. However the rate of production will also be
influenced by national and global supply, demand, and geo-political factors germane to the oil
and gas industry.
2.1.1. Natural Gas Prices Geologists anticipate that the vast majority of hydrocarbons produced from the Utica and
Marcellus region will be methane and ethane. Accordingly, prices for methane and ethane play
a major role in determining the pace of development. Producing companies will of course drill
and produce with alacrity when prices are high. The volume of natural gas produced from the
Appalachian Basin has already been so significant that it is changing not only how we use gas,
but also how we assess the natural gas market. Regional natural gas hubs have become, for the
first time, more relevant than the traditional Gulf Coast trading locations in setting prices for the
full range of products derived from natural gas, and for measuring regional supply and demand
conditions and their relationships with global markets.
A number of private companies and government agencies generate projections for natural gas
prices. The reports conducted by the U.S. Energy Information Agency (EIA), known as the
“Annual Energy Outlook,”6 provide a reference case for future natural gas prices. The report
also models the wedge in the projected prices due to macroeconomics growth rates and
expected rates of resource recovery from natural gas wells (Figure 1). Higher rates of economic
growth reflect increased consumption of natural gas due to their effects on housing starts,
additional commercial floor space, and industrial output. According to EIA projections, in the
case of high economic growth, natural gas prices will rise by 4.0% a year beginning in 2012; in
the case of low economic growth, natural gas prices will increase by 3.5% a year.
6 US EIA, Annual Energy Outlook 2014 with Projections to 2040. DOE/EIA-0383, April 2014. http://www.eia.gov/forecasts/aeo/pdf/0383%282014%29.pdf
Mapping the Opportunities for Shale Development in Ohio
Center for Economic Development, Cleveland State University Page 12
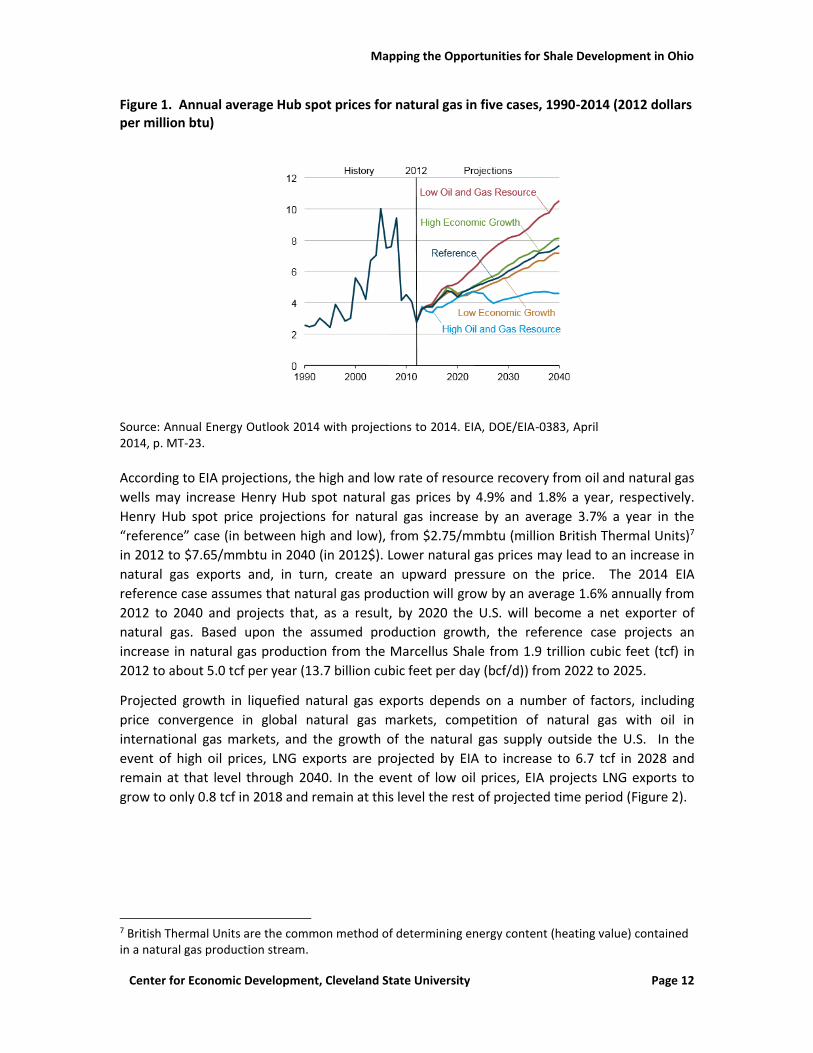
Figure 1. Annual average Hub spot prices for natural gas in five cases, 1990-2014 (2012 dollars per million btu)
Source: Annual Energy Outlook 2014 with projections to 2014. EIA, DOE/EIA-0383, April 2014, p. MT-23.
According to EIA projections, the high and low rate of resource recovery from oil and natural gas
wells may increase Henry Hub spot natural gas prices by 4.9% and 1.8% a year, respectively.
Henry Hub spot price projections for natural gas increase by an average 3.7% a year in the
“reference” case (in between high and low), from $2.75/mmbtu (million British Thermal Units)7
in 2012 to $7.65/mmbtu in 2040 (in 2012$). Lower natural gas prices may lead to an increase in
natural gas exports and, in turn, create an upward pressure on the price. The 2014 EIA
reference case assumes that natural gas production will grow by an average 1.6% annually from
2012 to 2040 and projects that, as a result, by 2020 the U.S. will become a net exporter of
natural gas. Based upon the assumed production growth, the reference case projects an
increase in natural gas production from the Marcellus Shale from 1.9 trillion cubic feet (tcf) in
2012 to about 5.0 tcf per year (13.7 billion cubic feet per day (bcf/d)) from 2022 to 2025.
Projected growth in liquefied natural gas exports depends on a number of factors, including
price convergence in global natural gas markets, competition of natural gas with oil in
international gas markets, and the growth of the natural gas supply outside the U.S. In the
event of high oil prices, LNG exports are projected by EIA to increase to 6.7 tcf in 2028 and
remain at that level through 2040. In the event of low oil prices, EIA projects LNG exports to
grow to only 0.8 tcf in 2018 and remain at this level the rest of projected time period (Figure 2).
7 British Thermal Units are the common method of determining energy content (heating value) contained in a natural gas production stream.
Mapping the Opportunities for Shale Development in Ohio
Center for Economic Development, Cleveland State University Page 13
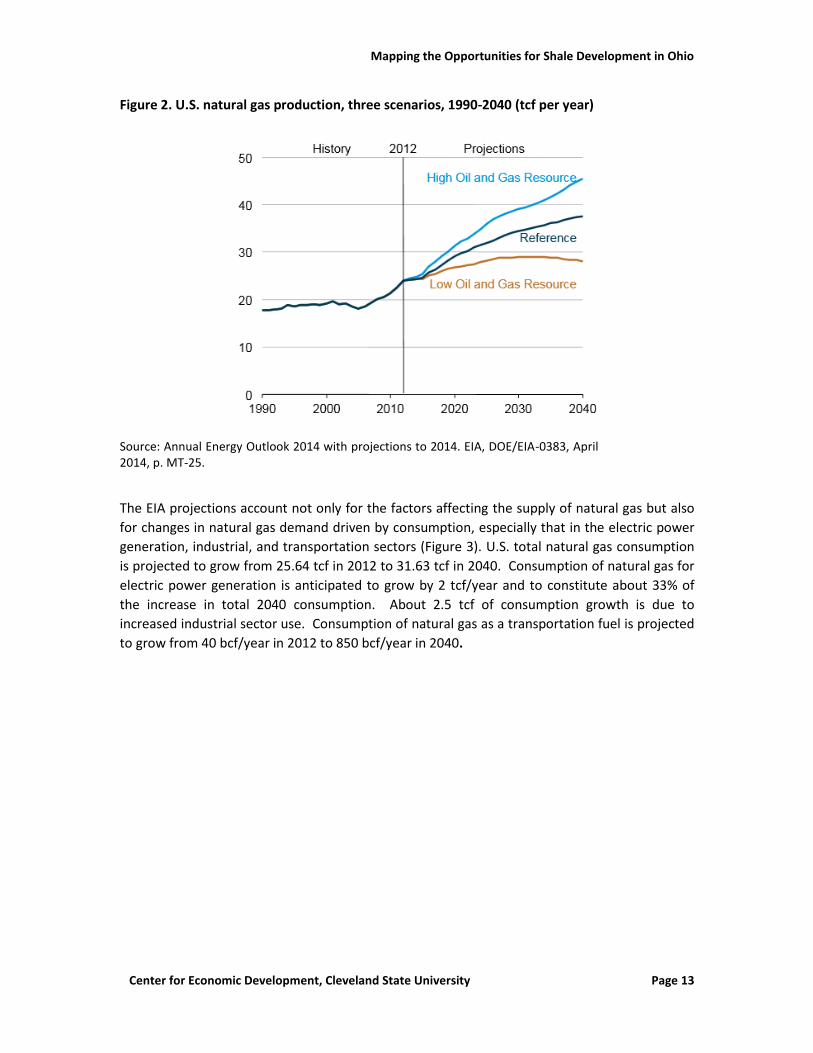
Figure 2. U.S. natural gas production, three scenarios, 1990-2040 (tcf per year)
Source: Annual Energy Outlook 2014 with projections to 2014. EIA, DOE/EIA-0383, April 2014, p. MT-25.
The EIA projections account not only for the factors affecting the supply of natural gas but also
for changes in natural gas demand driven by consumption, especially that in the electric power
generation, industrial, and transportation sectors (Figure 3). U.S. total natural gas consumption
is projected to grow from 25.64 tcf in 2012 to 31.63 tcf in 2040. Consumption of natural gas for
electric power generation is anticipated to grow by 2 tcf/year and to constitute about 33% of
the increase in total 2040 consumption. About 2.5 tcf of consumption growth is due to
increased industrial sector use. Consumption of natural gas as a transportation fuel is projected
to grow from 40 bcf/year in 2012 to 850 bcf/year in 2040.
Mapping the Opportunities for Shale Development in Ohio
Center for Economic Development, Cleveland State University Page 14
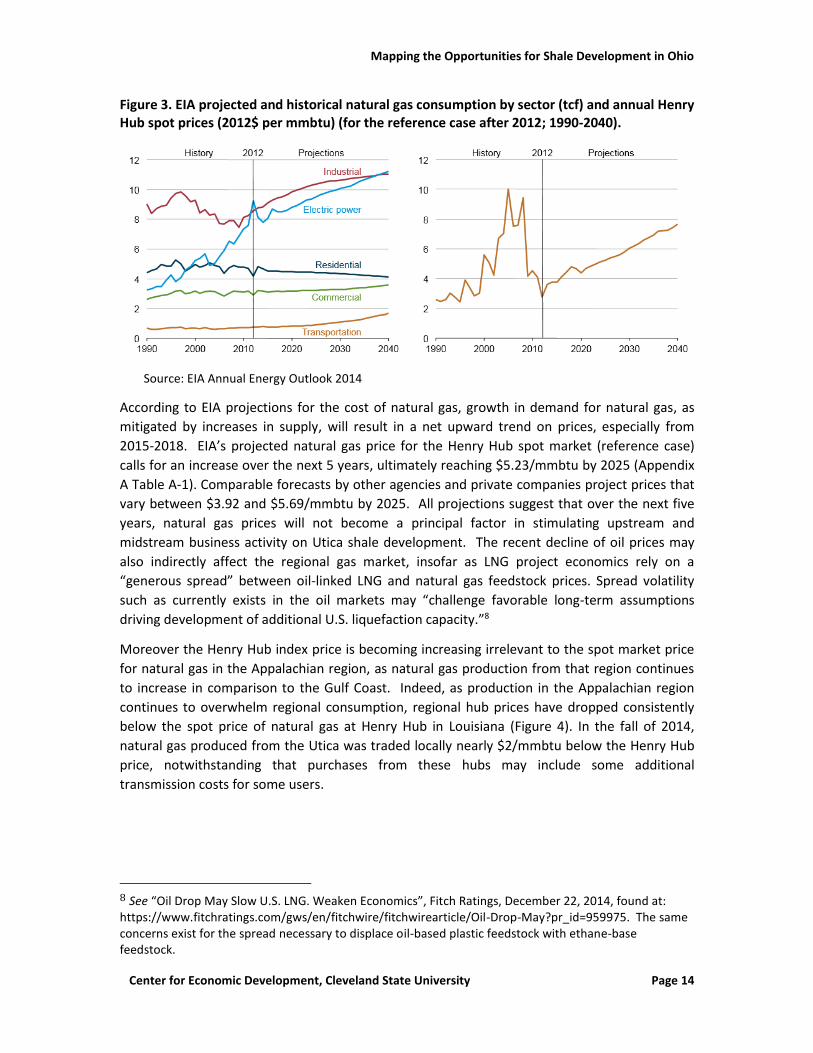
Figure 3. EIA projected and historical natural gas consumption by sector (tcf) and annual Henry Hub spot prices (2012$ per mmbtu) (for the reference case after 2012; 1990-2040).
Source: EIA Annual Energy Outlook 2014
According to EIA projections for the cost of natural gas, growth in demand for natural gas, as
mitigated by increases in supply, will result in a net upward trend on prices, especially from
2015-2018. EIA’s projected natural gas price for the Henry Hub spot market (reference case)
calls for an increase over the next 5 years, ultimately reaching $5.23/mmbtu by 2025 (Appendix
A Table A-1). Comparable forecasts by other agencies and private companies project prices that
vary between $3.92 and $5.69/mmbtu by 2025. All projections suggest that over the next five
years, natural gas prices will not become a principal factor in stimulating upstream and
midstream business activity on Utica shale development. The recent decline of oil prices may
also indirectly affect the regional gas market, insofar as LNG project economics rely on a
“generous spread” between oil-linked LNG and natural gas feedstock prices. Spread volatility
such as currently exists in the oil markets may “challenge favorable long-term assumptions
driving development of additional U.S. liquefaction capacity.”8
Moreover the Henry Hub index price is becoming increasing irrelevant to the spot market price
for natural gas in the Appalachian region, as natural gas production from that region continues
to increase in comparison to the Gulf Coast. Indeed, as production in the Appalachian region
continues to overwhelm regional consumption, regional hub prices have dropped consistently
below the spot price of natural gas at Henry Hub in Louisiana (Figure 4). In the fall of 2014,
natural gas produced from the Utica was traded locally nearly $2/mmbtu below the Henry Hub
price, notwithstanding that purchases from these hubs may include some additional
transmission costs for some users.
8 See “Oil Drop May Slow U.S. LNG. Weaken Economics”, Fitch Ratings, December 22, 2014, found at: https://www.fitchratings.com/gws/en/fitchwire/fitchwirearticle/Oil-Drop-May?pr_id=959975. The same concerns exist for the spread necessary to displace oil-based plastic feedstock with ethane-base feedstock.
Mapping the Opportunities for Shale Development in Ohio
Center for Economic Development, Cleveland State University Page 15
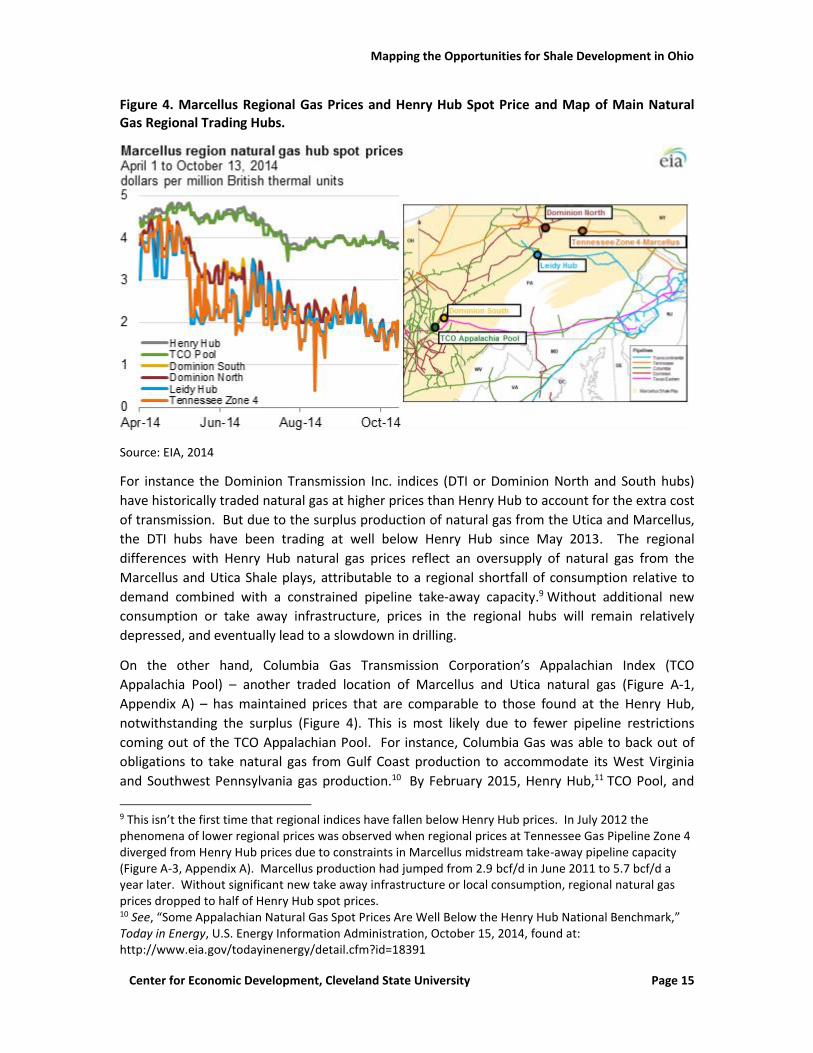
Figure 4. Marcellus Regional Gas Prices and Henry Hub Spot Price and Map of Main Natural Gas Regional Trading Hubs.
Source: EIA, 2014
For instance the Dominion Transmission Inc. indices (DTI or Dominion North and South hubs)
have historically traded natural gas at higher prices than Henry Hub to account for the extra cost
of transmission. But due to the surplus production of natural gas from the Utica and Marcellus,
the DTI hubs have been trading at well below Henry Hub since May 2013. The regional
differences with Henry Hub natural gas prices reflect an oversupply of natural gas from the
Marcellus and Utica Shale plays, attributable to a regional shortfall of consumption relative to
demand combined with a constrained pipeline take-away capacity.9 Without additional new
consumption or take away infrastructure, prices in the regional hubs will remain relatively
depressed, and eventually lead to a slowdown in drilling.
On the other hand, Columbia Gas Transmission Corporation’s Appalachian Index (TCO
Appalachia Pool) – another traded location of Marcellus and Utica natural gas (Figure A-1,
Appendix A) – has maintained prices that are comparable to those found at the Henry Hub,
notwithstanding the surplus (Figure 4). This is most likely due to fewer pipeline restrictions
coming out of the TCO Appalachian Pool. For instance, Columbia Gas was able to back out of
obligations to take natural gas from Gulf Coast production to accommodate its West Virginia
and Southwest Pennsylvania gas production.10 By February 2015, Henry Hub,11 TCO Pool, and
9 This isn’t the first time that regional indices have fallen below Henry Hub prices. In July 2012 the phenomena of lower regional prices was observed when regional prices at Tennessee Gas Pipeline Zone 4 diverged from Henry Hub prices due to constraints in Marcellus midstream take-away pipeline capacity (Figure A-3, Appendix A). Marcellus production had jumped from 2.9 bcf/d in June 2011 to 5.7 bcf/d a year later. Without significant new take away infrastructure or local consumption, regional natural gas prices dropped to half of Henry Hub spot prices. 10 See, “Some Appalachian Natural Gas Spot Prices Are Well Below the Henry Hub National Benchmark,” Today in Energy, U.S. Energy Information Administration, October 15, 2014, found at: http://www.eia.gov/todayinenergy/detail.cfm?id=18391
Mapping the Opportunities for Shale Development in Ohio
Center for Economic Development, Cleveland State University Page 16
Dominion South were trading around $3.00/thousand cubic feet of gas (mcf), while Dominion
North was trading around $2.00/mcf.12
In addition to the threat to shale development from sustained low prices for natural gas, the
current decline in global oil prices is indirectly affecting national and regional natural gas pricing
due to the likely decrease in demand for liquefied natural gas (LNG) on the international
markets. Internationally, where shale development has not fundamentally altered natural gas
markets like they have in America, natural gas prices are more closely tied to oil prices. With
falling oil prices, exporting LNG from the United States to Europe and Asia becomes less
attractive, notwithstanding the relatively low cost of making LNG in America. Although the low
regional prices will still increase domestic demand from the electricity generation, chemical, and
transportation industries, some expansion projects might be slowed down or revisited.
Sustained low oil prices may affect natural gas production in the Appalachian basin in two other
ways. First reduced oil production as a result of low prices will lead to a reduction in the
production of inexpensive associated natural gas, a by-product of oil production. Second, low
profits from oil production may constrain the availability of capital for drilling new non-
associated gas wells. Both of these trends could lead to an overall decrease of natural gas
supply and, as a result, will eventually lift natural gas prices.
Natural gas liquid prices will also have an effect on drilling in the Utica. Propane, butane and
natural gasoline all have local markets and usually retrieve prices that are higher than methane
on an mmbtu-basis. However ethane makes up the largest portion of NGLs, and it may or may
not retrieve a higher price than methane; it all depends on demand relative to supply. Ethane
and methane prices tend to be closely related, since both exist as gas at normal temperatures
and pressures, and as such can be mixed together when delivered to a natural gas interstate
pipeline. The decision to not remove ethane from the natural gas stream is known in the
industry as “ethane rejection.” Ethane separation is rejected whenever the price of methane is
higher than ethane, and if the pipelines are able to take it. Ethane is also rejected when there is
no available de-ethanization facility or when there is no take-away infrastructure to deliver the
ethane to a market.
In wet gas production areas, not all ethane can be rejected if it causes the btu content of the gas
stream to exceed pipeline specifications. Interstate pipelines have limits to how much ethane
can be placed into the gas stream. In such instances, ethane may have to be sold into lower
revenue, or inferior, markets. These instances provide the most advantageous circumstances
for a refiner looking to lock up supplies of ethane.
The decision to build a natural gas liquid catalytic cracking facility, however, will not rest on
near-term methane or ethane prices. Both the size of the investment and the lead-time for
construction require price projections many years out. Accordingly, chemical companies looking
11 “Henry Hub Natural Gas Spot Price” U.S. Energy Information Administration 2/25/15. http://www.eia.gov/dnav/ng/hist/rngwhhdm.htm 12 “Northeast Natural Gas Prices” NGI Data 2/15. http://www.naturalgasintel.com/data/data_products/daily?region_id=northeast&location_id=NEACNGNP
Mapping the Opportunities for Shale Development in Ohio
Center for Economic Development, Cleveland State University Page 17
at investing in a cracking facility will be contemplating long-term natural gas and natural gas
liquid pricing prospects.
Another way that declining oil prices may affect natural gas markets is that there may be
diminishing opportunities to substitute natural gas for oil as a feedstock for petrochemical
products or as a fuel for transportation. Some plastics can be made from either refined ethane
or from naphtha – a light component of crude oil. The former strategy is favored in the United
States, while the latter is generally used in Europe. Cheaper naphtha may slow down
investment projects in the U.S. petrochemical industry especially if their target markets are
overseas buyers of ethylene or polyethylene. This illustrates the growing competition between
lower-priced oil and gas for both fuel and feedstock uses, which in turn might lead to a decrease
in demand for natural gas.
U.S. produced Ethane can also be sold on international markets to relieve U.S. market
oversupply problems. Earlier this year Enterprise Products Partners estimated that Europe
could provide an incremental 415,000 barrels per day (bbl/d) ethane demand.13 However, this
market could also be supplied by ethane derived from naphtha.
2.1.2. Midstream Infrastructure Catch Up Planning natural gas marketing today in America is relatively simple. Market planning does not
normally begin in earnest until after a discovery. It wasn’t always this way, and it is certainly not
this way in most other oil and gas provinces around the world. In the 1950s and 60s in America,
large volumes of natural gas were flared because there was no market for it. Much of this was
because most natural gas was associated with and a by-product of oil production, and could not
be shut in pending the development of a market. Markets for natural gas did not fully develop
in America until the build out of the petrochemical industry in Texas and Louisiana in the late
1960s. Eventually, as interstate transportation and local distribution systems were built, it
became possible to defer marketing decisions until after a discovery.
However even with today’s mature American natural gas markets, new natural gas provinces
such as the Utica require major new investment into a midstream infrastructure. Without that
infrastructure in place, production must be shut in. Operators prefer to not expend resources
on drilling and completing wells when there is no expectation of immediately selling the
hydrocarbons that are produced.
Midstream companies also have to be careful to not overbuild. So investment into the
midstream infrastructure has to be careful and deliberate. To date, the infrastructure in the
Utica has been lagging discovery, but not by much. The midstream industry has already
invested heavily in the region, and the lag has been less than a year. Throughput projections for
the wet gas regions of the Utica and Marcellus shale basin are not expected to exceed
13 Marcellus/Utica produced ethane to reach USGC markets in January: Enterprise. Houston (Platts)--5Dec2013/437 pm EST/2137 GMT. http://www.platts.com/latest-news/natural-gas/houston/marcellusutica-produced-ethane-to-reach-usgc-21914284
Mapping the Opportunities for Shale Development in Ohio
Center for Economic Development, Cleveland State University Page 18
processing or take away capacity before 2020. Total Utica and Marcellus midstream
investments are projected to exceed $30 billion.14
2.1.3. Drilling Rig Availability and Technology Improvements Counting the number of drilling rigs that are at work in an oil and gas development play is an
important tool to track domestic development of oil and gas resources. Rig counts fluctuate with
drilling activity and are often used to project relevant employment trends in the United States.
Drilling followed the global economic downturn on energy prices in 2008, with rig activity
declining from a high of 2,031 active rotary drilling rigs in September 2008 to a low of 875 rigs in
June 2009.15 Although rig counts follow economic trends, and does not predict them, the
sensitivity of the number of drilling rigs to changes in regional markets is a useful indicator of
the development path in the Utica.
The Study Team tested several hypotheses regarding the count of drilling rigs in Utica region.
We considered whether the number of drilling rigs will be increasing in the region due to the
approaching end of land leasing cycles and whether sufficient rigs will be available to respond to
this possible surge. The Study Team also considered the possibility of a decline in rig count and
a consequent reduction in drilling activity due to plunging oil prices.
To answer these questions, the Study Team examined historical trends in numbers of drilling rigs
in the principal states located within the regional Marcellus-Utica basin – Ohio, Pennsylvania
and West Virginia. We compared the drilling rig counts in these states to the trend of drilling rig
counts in North Dakota – home to the Bakken Shale, which is a predominantly oil rich play.
North Dakota’s rig count has, since 2008, served as a useful benchmark for overall economic
growth, and as an example of the dynamic that exists between drilling activity and leasing cycles
(Figure 5).
14 J. Lafield, “From Importer to Exporter,” Blue Racer Investor Presentation, 1/30/14, found at: http://www.caimanenergy.com/sites/default/files/resources/resources0114Presentation.pdf 15 Headquarters Economics. Drilling Rig Activity Nears Twenty-Year High Price and Technology Remain Key Drivers of Oil and Gas Drilling Activity. June 20, 2011. http://headwaterseconomics.org/wphw/wp-content/uploads/RigCounts.pdf
Mapping the Opportunities for Shale Development in Ohio
Center for Economic Development, Cleveland State University Page 19
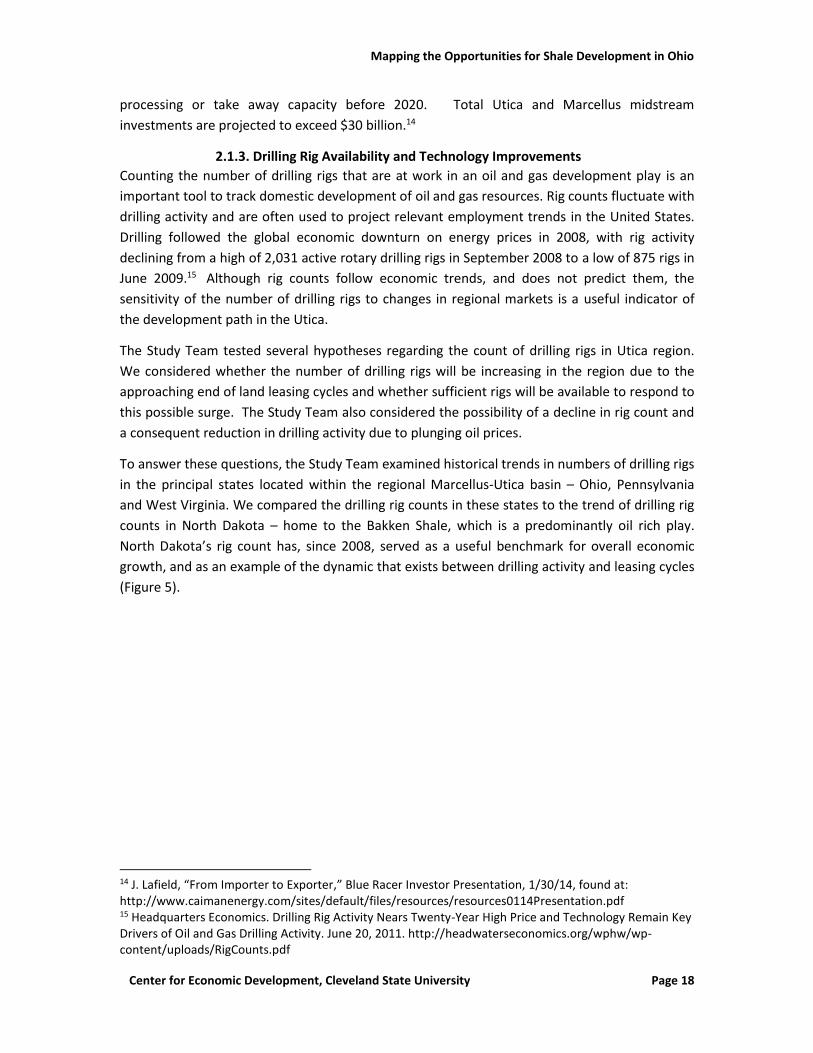
Figure 5. Dynamic of Rotary Drilling Rigs Count in Selected States. 2004-2015.
Source: Baker Hughes. U.S. Rig Count Data, 2015 data is based on July averages
Just before the global recession, the number of drilling rigs in the Bakken increased from 39 in
2007 to 68 in 2008, and this trend generally continued despite the recession, ultimately reaching
188 rigs in 2012. Since most oil and gas leases contain five-year primary terms, we can
speculate that oil prices and production in the Bakken was likely fueled by intense leasing
activity in the 2007-2012 time frame. With low oil prices, operators are now facing a decision
whether to continue drilling or to release acreage.
A rapid increase of drilled wells in the Marcellus formation in Pennsylvania occurred between
2007 and 2009, rising from 27 to 785 per year. It is likely that leasing activity in the Marcellus
was heaviest in the 2006-2009 time frame, which would suggest that primary lease term
expiration would drive an increase drilling activity in 2012-2014. However, it appears from the
drilling rig count in Pennsylvania (dropping by around 50 rigs between 2011 and 2013) that shale
development there was influenced more by natural gas prices than by the leasing cycle.
Likewise, while we might expect that expiring leases in the Utica would cause a surge in drilling
in 2015-2016, it appears that such a surge, will not significantly influence the overall
development of Utica play. Prices for the gas and access to midstream infrastructure will have a
greater influence on the development of the Utica then will expiring land leases.
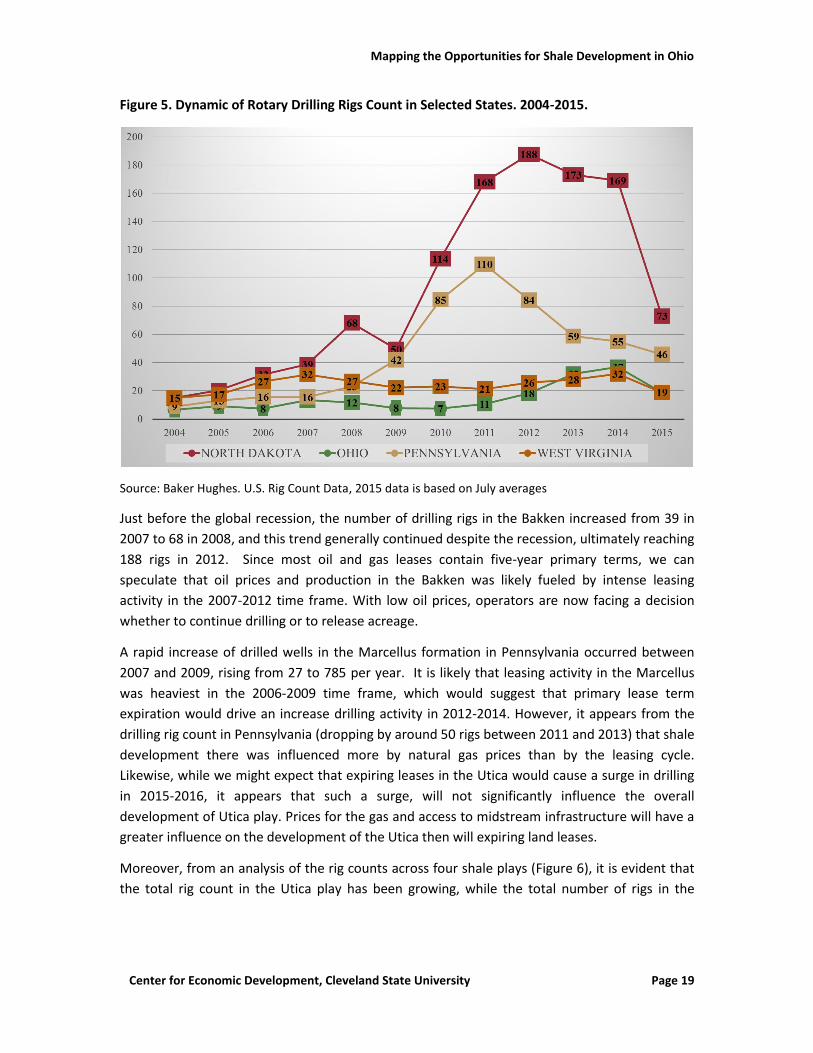
Moreover, from an analysis of the rig counts across four shale plays (Figure 6), it is evident that
the total rig count in the Utica play has been growing, while the total number of rigs in the
Mapping the Opportunities for Shale Development in Ohio
Center for Economic Development, Cleveland State University Page 20
Barnett, Eagle Ford, and Marcellus plays have been declining.16 The decline may be caused by a
decreasing number of rigs drilling for “dry” natural gas. The drilling in recent years in the Utica
has targeted the “wet gas” portion of that play.
Of course, the recent price collapse for oil may well be changing this. Lower oil prices have also
caused a price reduction for liquids, and as a result, we are now also seeing a reduction of
drilling rigs in the areas targeting NGLs, such as the Utica. According to Rigdata, the rig count for
the Utica (in Ohio) has dropped from 52 in October 2014 to 19 as of June 2015.
Figure 6. Rig Count by Type of Wells in Selected Basins. 2011-2015
Source: Baker Hughes. U.S. Rig Count Data, 2015. 2015 data are based on the average of January and
February 2015.
Improving technology is another factor that has caused a drop in the number of drilling rigs in
shale basins. One such technology improvement has been a decrease in the “spud to spud”
drilling time for wells.17 This means fewer rigs are needed to do the same work. Longer
completion zones in the horizontal laterals also have reduced the number of required wells, and
therefore rigs. Likewise, better knowledge of a basin’s geological conditions, together with
improving skills within operating and service companies, has reduced the risk of both
mechanical and commercial failure. Indeed, shale drilling has become more like a factory
16 Count of rigs in Utica Shale by Baker Hughes differs from the number of rigs listed by Ohio Department of Natural Resources. Being aware of under count in number of rigs by Baker Hughes data, this analysis aim to show the dynamic of rigs across time and geographies. 17 “Spud” refers to the actual time when the drilling bit penetrates the surface. Spud to spud refers to the time from the beginning of one well to the beginning of the next well.
Mapping the Opportunities for Shale Development in Ohio
Center for Economic Development, Cleveland State University Page 21
process than the traditional “high risk-high reward” strategy used for exploration.18 The
emphasis of shale drilling is on process optimization rather than on risk control. Drilling plans
and “authorities for expenditure” (cost estimates) are predictable and reproducible from well to
well. This approach has improved efficiencies and reduced the need for as many rigs.
The total number of rigs within Marcellus-Utica basins has been stable between 2012 and 2014.
This followed a slight decline in the number of rigs from 2011 to 2012, caused by an outflow of
rigs in response to low regional natural gas prices. Utica producing companies interviewed do
not anticipate any problems with drilling rig availability. With about half of their active rigs in the
dry gas corridor and half in the wet gas/condensate corridor, Utica producers should be able to
retain mineral rights through production by moving the rigs between wells, depending on
commodity pricing, availability of infrastructure and the exigencies of leasehold requirements.
As a result of falling oil prices in the winter of 2014-15, some analysts have projected that 500
drilling rigs may be taken off the market in 2015. These projections are based upon
announcements from producers that they anticipate capital budget cuts ranging from 20% to
40% for 2015. Companies making public announcements that reflect budget reductions include
Laredo Petroleum, Range Resources Corp., Oasis Petroleum, among others.
Figure 7. Rig Count by Basin: 12 Weeks December 2014 – February 2015
Source: Baker Hughes. U.S. Rig Count Data, 2015
18 See e.g. S. Rahim, “Focus on Well Efficiency Keeps Marcellus Shale Pumping Despite Low Prices, E&E Publishing, February 5, 2014, found at: http://www.eenews.net/stories/1059994007.
Mapping the Opportunities for Shale Development in Ohio
Center for Economic Development, Cleveland State University Page 22
Over the 12 weeks between December 2014 and February 2015, the Marcellus-Utica region lost
fewer rigs on a percentage basis than the more crude-intensive Eagle Ford and Barnett basins
(Figure 7). Utica dropped 9 rigs, decreasing its count by 18.8%, while the Marcellus parked 13
rigs (15.9%). The Eagle Ford decreased its rigs by 22.3% and Barnett lost 54.2% of its rig count.
The enduring Marcellus-Utica rig count, in the face of falling oil and gas prices, suggests a leaner
cost of development in that region compared to other shale plays.
2.1.4. Effects of Unitization and Stranded Leases One potential threat to the rapid development of the Utica relates to the rate and availability of
statutory (forced) unitization. Operators cannot begin drilling until a unit has been established
for the area to be drained, and often times the operators are unable to get all the mineral rights
leased within a proposed unit. When this happens, the operators may deploy a legal procedure
that enables them to “force-unitize” unleased acreage.19 If unitization approval through this
process is delayed, operators may not be able to proceed to drill with the speed they might
otherwise have.
Currently, under Ohio Department of Natural Resources procedures, there is a 120-day notice
period required before a hearing on a forced unit is set.20 Moreover, a decision on the hearing
can take up to another 90-120 days before an order is issued. The result is that an operator may
have to wait 8 months to get a unitization order. This lengthy waiting period can create
difficulties for operators looking to efficiently develop their leaseholds.
However the Ohio General Assembly is in the process of considering a bill – House Bill 8 -- that
will reduce the notice period to 45 days. As of September 2015, HB 8 was still under evaluation
by the Ohio Senate. Other states, such as West Virginia and North Dakota, have considerably
shorter notice periods than does Ohio.21
It is impossible to know exactly how this will play out over time, but there is no doubt that
delays in statutorily created units will impact drilling strategies in some fashion. This in turn
could lead to the creation of inefficient units, the use of sub-optimal drilling locations, and
ultimately to the stranding of leases. The last will occur when operators are forced to abandon
leases because they are either unable to fit them into a voluntary unit, or because they do not
have the necessary 65% leasehold to force a unit.
19 See ORC §1509.28. At least 65% of the acreage contained in the unit must be voluntary. When mineral rights are forced into a unit, they are typically treated as though it were a mixture of leasing rights (royalty percentage) and working interest rights (net profit share). 20 The 120 day notice period policy is set forth in an Ohio Department of Natural Resources, Oil and Gas Division, “Guidance Letter.” Under the traditional forced pooling strategy in Ohio – a far less complex and controversial procedure than forced unitization – the guidance letter required 45 days. See http://oilandgas.ohiodnr.gov/portals/oilgas/pdf/Unitization%20Application%20Guidelines_E050914.pdf. 21 The most common notice period is 45 days. See, e.g. North Dakota (NDCC Section 38-08-09.5).
Mapping the Opportunities for Shale Development in Ohio
Center for Economic Development, Cleveland State University Page 23
2.1.5. Strategies of Principal Utica Upstream Players The development of the Utica shale formation within the state of Ohio will depend principally
upon the investment strategies of a handful of key oil and gas operating companies. Most large
and mid-size oil and gas producers mitigate their risk by investing in multiple plays. Some will
also invest in midstream and even downstream projects to further mitigate risk, and also to
ensure that there will be a market for their production. Companies investing into the Utica are
no different in this regard; they all have investments that cross multiple regions and markets,
and that compete internally for financial resources.
The Study Team examined historical ODNR data for drilling permits and actual drilling to identify
the principal Utica players, resulting in a list of seven companies that have, to date, performed
over 80% of operations in the Utica basin. Based on the data over six quarters during 2013-
2014, the top producers ranked by the number of drilled and permitted wells, are the following
companies (Figure 8):
Chesapeake
Gulfport
Antero
Hess and CNX Gas
Rex Energy
HG Energy
PDC Energy
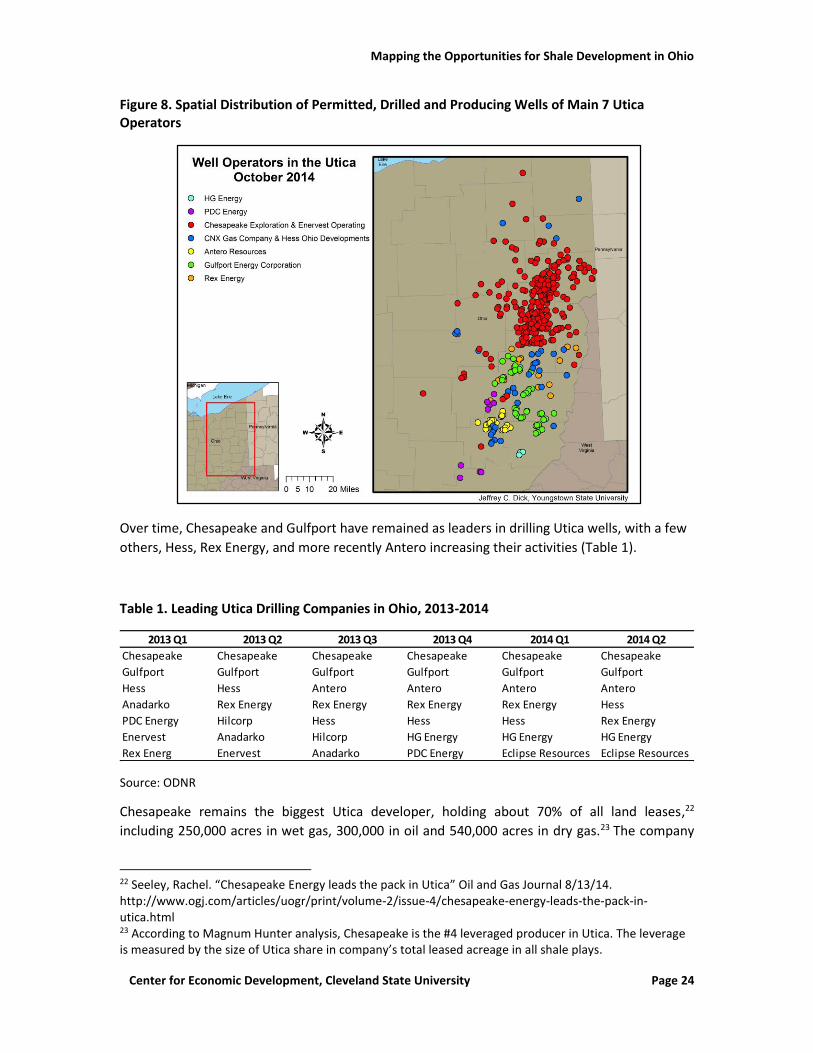
Mapping the Opportunities for Shale Development in Ohio
Center for Economic Development, Cleveland State University Page 24
Figure 8. Spatial Distribution of Permitted, Drilled and Producing Wells of Main 7 Utica Operators
Over time, Chesapeake and Gulfport have remained as leaders in drilling Utica wells, with a few
others, Hess, Rex Energy, and more recently Antero increasing their activities (Table 1).
Table 1. Leading Utica Drilling Companies in Ohio, 2013-2014
Source: ODNR
Chesapeake remains the biggest Utica developer, holding about 70% of all land leases,22
including 250,000 acres in wet gas, 300,000 in oil and 540,000 acres in dry gas.23 The company
22 Seeley, Rachel. “Chesapeake Energy leads the pack in Utica” Oil and Gas Journal 8/13/14. http://www.ogj.com/articles/uogr/print/volume-2/issue-4/chesapeake-energy-leads-the-pack-in-utica.html 23 According to Magnum Hunter analysis, Chesapeake is the #4 leveraged producer in Utica. The leverage is measured by the size of Utica share in company’s total leased acreage in all shale plays.
2013 Q1 2013 Q2 2013 Q3 2013 Q4 2014 Q1 2014 Q2
Chesapeake Chesapeake Chesapeake Chesapeake Chesapeake Chesapeake
Gulfport Gulfport Gulfport Gulfport Gulfport Gulfport
Hess Hess Antero Antero Antero Antero
Anadarko Rex Energy Rex Energy Rex Energy Rex Energy Hess
PDC Energy Hilcorp Hess Hess Hess Rex Energy
Enervest Anadarko Hilcorp HG Energy HG Energy HG Energy
Rex Energ Enervest Anadarko PDC Energy Eclipse Resources Eclipse Resources
Mapping the Opportunities for Shale Development in Ohio
Center for Economic Development, Cleveland State University Page 25
has been drilling over 70% of all Utica wells.24 By the end of the first quarter of 2014,
Chesapeake was operating, on average, 8 rigs in Ohio’s Utica play, accounting for 485 drilled
wells and 274 producing wells. At the time, 211 of Chesapeake’s drilled wells were shut in
awaiting connection to the midstream take away system. This number decreased to 172 by
September 30, 2014. The company identified its Estimated Ultimate Recovery (EUR) per well at
1,325 mboe (thousand-barrel oil equivalent), with production of 67 mboe per day as the
expected per well average in the second quarter, rising to 85.5 mboe per day during the third
quarter of 2014. Over 2013-2014, the company estimated its production growth in the Utica
play at 300%, after seeing 400% growth in 2012-2013. The company’s strategy within the Utica
has been to increase its drilling efficiency. Chesapeake’s average completed well cost rose from
$6.7 M in 2013 to $7.1 M in 2014; however in those same two years, it improved its efficiency
substantially through longer completed lateral well lengths (5,150 to 6,300 feet) and by
increasing the number of fracturing stages (from 17 to 32).
Chesapeake shifted its emphasis in the Utica from dry gas production to wet gas, growing its wet
gas segment by 65% in 2013-2014. Chesapeake formed two joint ventures, with French TOTAL
and Houston-based EnerVest (EV). The company’s plans to unlock an oil window may prove to
be less appealing if prices remain as low as they were in the winter of 2014-2015. Chesapeake
Energy recently sold its assets in the South Marcellus Shale and part of its assets in the Eastern
Utica Shale to Southwestern Energy. This was followed by a recent announcement of the
company’s plans to repurchase $1 billion worth of its own shares. 25 However there is nothing in
these moves that suggests that Chesapeake will discontinue its bullish strategy in the Utica.
EnerVest Energy (EV) is the most leveraged producer in Utica26 and operates through its joint
venture with Chesapeake (Figure 9). The company operates primarily within the wet gas window
and also has invested in midstream capacity through joint ventures in the Cardinal (9%) and
Utica East Ohio (21%) pipeline systems. Although EV has significant Utica acreage and
midstream assets, it also sells acreage when it suits its financial needs. In December 2014, the
company was considering increasing its investment into the condensate27 portion of the Utica,
among other opportunities, such as expanding its investment into the wet gas window and
ramping up its Utica midstream presence. The company has a diversified portfolio of assets
across 10 basins with commitments to spend 11% of its exploration and production capital in
24 The analysis of the main Utica producers’ strategies is based on the analysis of Q1 and Q3 2014 investor presentations, press releases and producer presentations in multiple public events. 25 Fukushima, Kurumi. “Chesapeake Energy (CHK) Stock Closed Up Today on $1 Billion Share Buyback Following Asset Sale” The Street 12/23/14. http://www.thestreet.com/story/12994764/1/chesapeake-energy-chk-stock-closed-up-today-on-1-billion-share-buyback-following-asset-sale.html 26 “2014 Louisiana Energy Conference” Magnum Hunter Resources 6/14. http://www.louisianaenergyconference.com/webdocs/Magnum%20Hunter-LEC%20Panel-2.pdf 27 Condensate, also known as volatile oil, is oil that is in a gaseous state under reservoir conditions, but separates out (condenses) as a liquid with production at surface conditions. It has a relatively high API rating (upper 30s to low 40s) compared to conventional oil. API is a reference which compares a liquid hydrocarbon density (specific gravity) to that of water. Anything with a higher API rating than 10 is less dense that water, and will float on it. Most hydrocarbon liquids range in API gravity ratings from 10-70, with heavy crude anything below 22, and light crude anything above 31. Condensate falls into the light crude category.
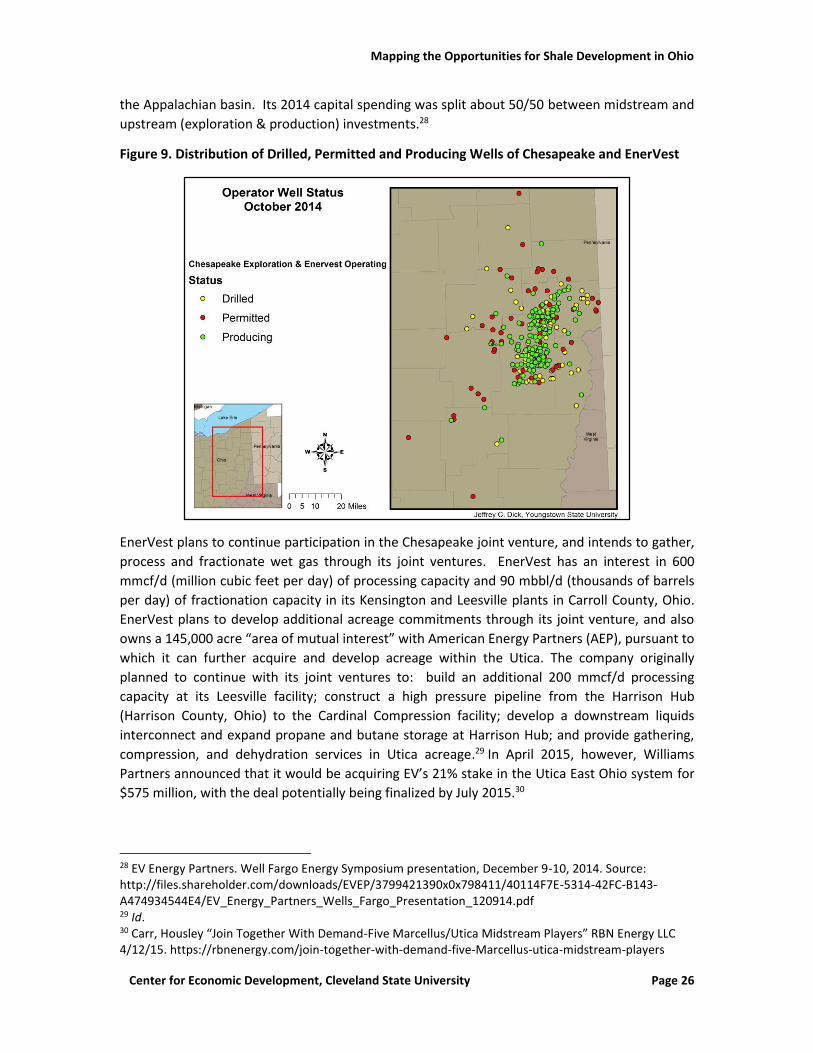
Mapping the Opportunities for Shale Development in Ohio
Center for Economic Development, Cleveland State University Page 26
the Appalachian basin. Its 2014 capital spending was split about 50/50 between midstream and
upstream (exploration & production) investments.28
Figure 9. Distribution of Drilled, Permitted and Producing Wells of Chesapeake and EnerVest
EnerVest plans to continue participation in the Chesapeake joint venture, and intends to gather,
process and fractionate wet gas through its joint ventures. EnerVest has an interest in 600
mmcf/d (million cubic feet per day) of processing capacity and 90 mbbl/d (thousands of barrels
per day) of fractionation capacity in its Kensington and Leesville plants in Carroll County, Ohio.
EnerVest plans to develop additional acreage commitments through its joint venture, and also
owns a 145,000 acre “area of mutual interest” with American Energy Partners (AEP), pursuant to
which it can further acquire and develop acreage within the Utica. The company originally
planned to continue with its joint ventures to: build an additional 200 mmcf/d processing
capacity at its Leesville facility; construct a high pressure pipeline from the Harrison Hub
(Harrison County, Ohio) to the Cardinal Compression facility; develop a downstream liquids
interconnect and expand propane and butane storage at Harrison Hub; and provide gathering,
compression, and dehydration services in Utica acreage.29 In April 2015, however, Williams
Partners announced that it would be acquiring EV’s 21% stake in the Utica East Ohio system for
$575 million, with the deal potentially being finalized by July 2015.30
28 EV Energy Partners. Well Fargo Energy Symposium presentation, December 9-10, 2014. Source: http://files.shareholder.com/downloads/EVEP/3799421390x0x798411/40114F7E-5314-42FC-B143-A474934544E4/EV_Energy_Partners_Wells_Fargo_Presentation_120914.pdf 29 Id. 30 Carr, Housley “Join Together With Demand-Five Marcellus/Utica Midstream Players” RBN Energy LLC 4/12/15. https://rbnenergy.com/join-together-with-demand-five-Marcellus-utica-midstream-players
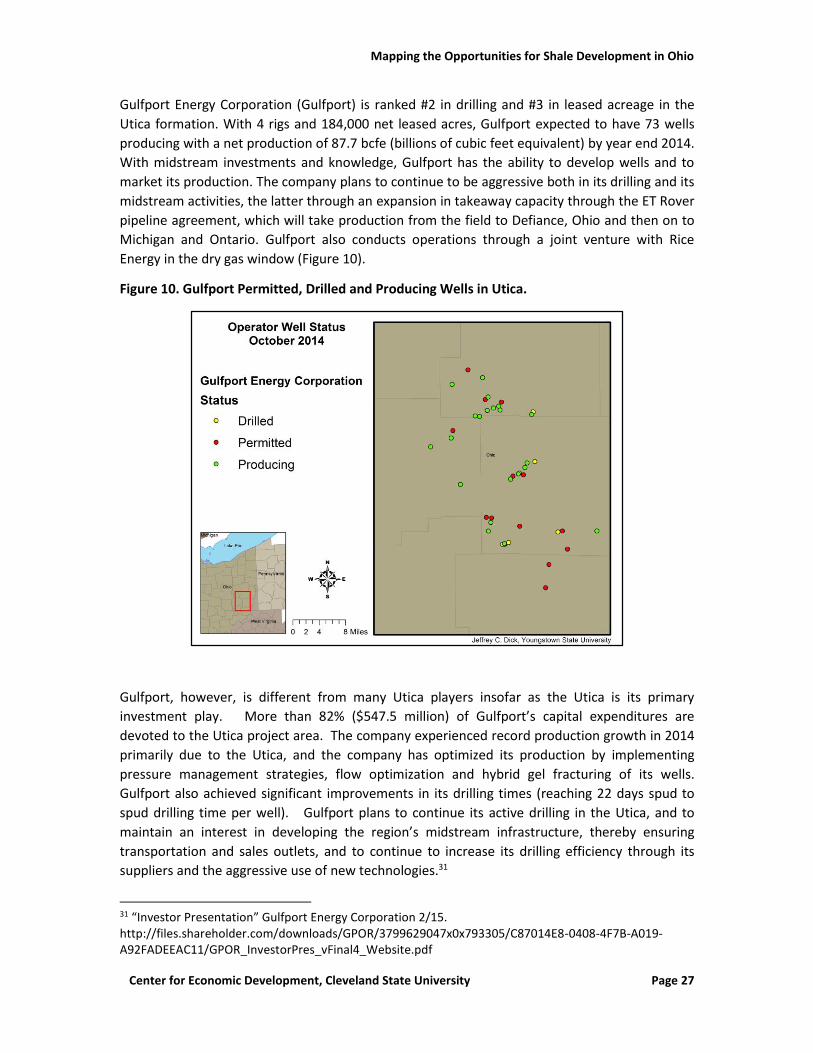
Mapping the Opportunities for Shale Development in Ohio
Center for Economic Development, Cleveland State University Page 27
Gulfport Energy Corporation (Gulfport) is ranked #2 in drilling and #3 in leased acreage in the
Utica formation. With 4 rigs and 184,000 net leased acres, Gulfport expected to have 73 wells
producing with a net production of 87.7 bcfe (billions of cubic feet equivalent) by year end 2014.
With midstream investments and knowledge, Gulfport has the ability to develop wells and to
market its production. The company plans to continue to be aggressive both in its drilling and its
midstream activities, the latter through an expansion in takeaway capacity through the ET Rover
pipeline agreement, which will take production from the field to Defiance, Ohio and then on to
Michigan and Ontario. Gulfport also conducts operations through a joint venture with Rice
Energy in the dry gas window (Figure 10).
Figure 10. Gulfport Permitted, Drilled and Producing Wells in Utica.
Gulfport, however, is different from many Utica players insofar as the Utica is its primary
investment play. More than 82% ($547.5 million) of Gulfport’s capital expenditures are
devoted to the Utica project area. The company experienced record production growth in 2014
primarily due to the Utica, and the company has optimized its production by implementing
pressure management strategies, flow optimization and hybrid gel fracturing of its wells.
Gulfport also achieved significant improvements in its drilling times (reaching 22 days spud to
spud drilling time per well). Gulfport plans to continue its active drilling in the Utica, and to
maintain an interest in developing the region’s midstream infrastructure, thereby ensuring
transportation and sales outlets, and to continue to increase its drilling efficiency through its
suppliers and the aggressive use of new technologies.31
31 “Investor Presentation” Gulfport Energy Corporation 2/15. http://files.shareholder.com/downloads/GPOR/3799629047x0x793305/C87014E8-0408-4F7B-A019-A92FADEEAC11/GPOR_InvestorPres_vFinal4_Website.pdf
Mapping the Opportunities for Shale Development in Ohio
Center for Economic Development, Cleveland State University Page 28
Other significant players in the Utica include Antero Resources, Hess, Rex Energy, Range
Resources, HG Energy, PDC Energy, and American Energy Partners. Each has had a significant,
but, as of 2014, a less decisive impact on the development of the Utica play. These companies
will likely continue to orient their portfolios in the Utica towards natural gas production (wet
and dry) and to optimize their investments through mid and possibly even downstream
activities.
2.2. Volumes and Throughput Projections
2.2.1. Projections Based Upon Publicly Available Data
2.2.1.1. Production data Projecting the likely midstream and downstream opportunities from shale development begins
with projecting likely total production over a given time frame. For purposes of estimating likely
construction, mid and downstream industries use “throughput” to estimate the amount of
infrastructure required to accommodate a particular volume of hydrocarbons. For natural gas,
this throughput is commonly expressed as millions or billions of cubic feet per day (mmcf/d or
bcf/d) that pass through the pipelines or processing facilities. For NGLs or condensate,
throughput is typically expressed in terms of thousands of barrels per day (mbbl/d).
In order to project likely throughput from the Utica formation over the next five years (2015-
2019) it was necessary to make several determinations about the nature of drilling and
production performance from the Utica over its relatively short production history. The
principal factors controlling the throughput estimates are: (1) average initial production from
each well, (2) expected decline in production thereafter from each well, and (3) the number of
likely wells in production.
The Ohio Department of Natural Resources Division of Oil and Gas Resource Management
provides production reports on an annual basis for 2011 and 2012 and on a quarterly basis for
2013 (Q1 – Q4) and 2014 (Q1 and Q2). The quarterly production reports are generally released
three months after the end of the production period. At the time the production study was
prepared, only the first and second quarters of production were available for 2014.32 The
production reports provide wellhead production values for barrels of oil (bbl) (one barrel equals
42 U.S. gallons), thousands of cubic feet of gas (mcf), barrels of produced water (brine and
flowback) and the number of production days for each well. Since the natural gas liquid
components are produced with the gas stream at the wellhead and typically separated at off-
site cryogenic and fractionation facilities, the NGLs components (ethane, propane, butane, etc.)
are not included in the ODNR production reports.
In order to estimate liquids throughput an additional analysis was required to estimate the
volume of NGLs that could be gleaned from natural gas processing. This undertaking required a
spatial analysis of Utica production, as well as an examination of the makeup of liquids
recovered at the processing plants. Ultimately, areas classified as natural gas (dry gas), NGLs
(wet gas), condensate, and oil were identified as occurring in distinct zones, and mapped as
such.
32 The third quarter 2014 production report was issued just before the release of this study, however there was insufficient time to evaluate that report.
Mapping the Opportunities for Shale Development in Ohio
Center for Economic Development, Cleveland State University Page 29
Accordingly, an analysis was undertaken for the Utica based upon a review of 573 producing
wells as reported by the Ohio Department of Natural Resources (ODNR) in its October 11, 2014
Utica/Point Pleasant Shale Cumulative Permitting Activity Report. In addition, the following
data were examined in reaching estimates for throughput:
ODNR annual production reports for 2011-2012,
ODNR quarterly production reports for 2013,
ODNR production reports for the first two quarters of 2014,
Rigdata Locations and Operators’ reports,
Calculated Initial gas/oil ratios (first quarter production for individual wells),
and
Publicly released initial production and test rate information.
2.2.1.2. Well Status The ODNR provides Utica/Point Pleasant Shale Cumulative Permitting Activity Reports on a
weekly basis. Individual wells are classified as “drilled,” “drilling,” “permitted” and “producing.”
Additional information on well status is available from commercial reporting agencies such as
Rigdata. The combination of these two sources provides a reasonably accurate assessment of
well status. Figure 11 identifies individual well pads as producing, drilled, drilling, and permitted
as of October 11, 2014. A total of 573 producing wells from 241 drilling pads (identified in
green) were used in the study to estimate throughput. Although producing wells can be found
throughout most of the Utica Shale region, the majority of producing wells are clustered along a
rough line starting in Columbiana County and extending south-southwest through Carroll,
Harrison, Guernsey and Noble Counties. Drilling activities in October 2014 were concentrated
within Carroll, Harrison, Guernsey, Belmont, Noble and Monroe Counties. Many wells identified
as “drilled” are waiting on the construction of gathering lines for natural gas and NGL
production. The drilled wells along the western edge of drilling activity in Ashland, Knox and
Medina Counties are presumably non-productive due to the shallow nature of the Utica Shale
and likely low formation pressure and/or insufficient dissolved gas content.
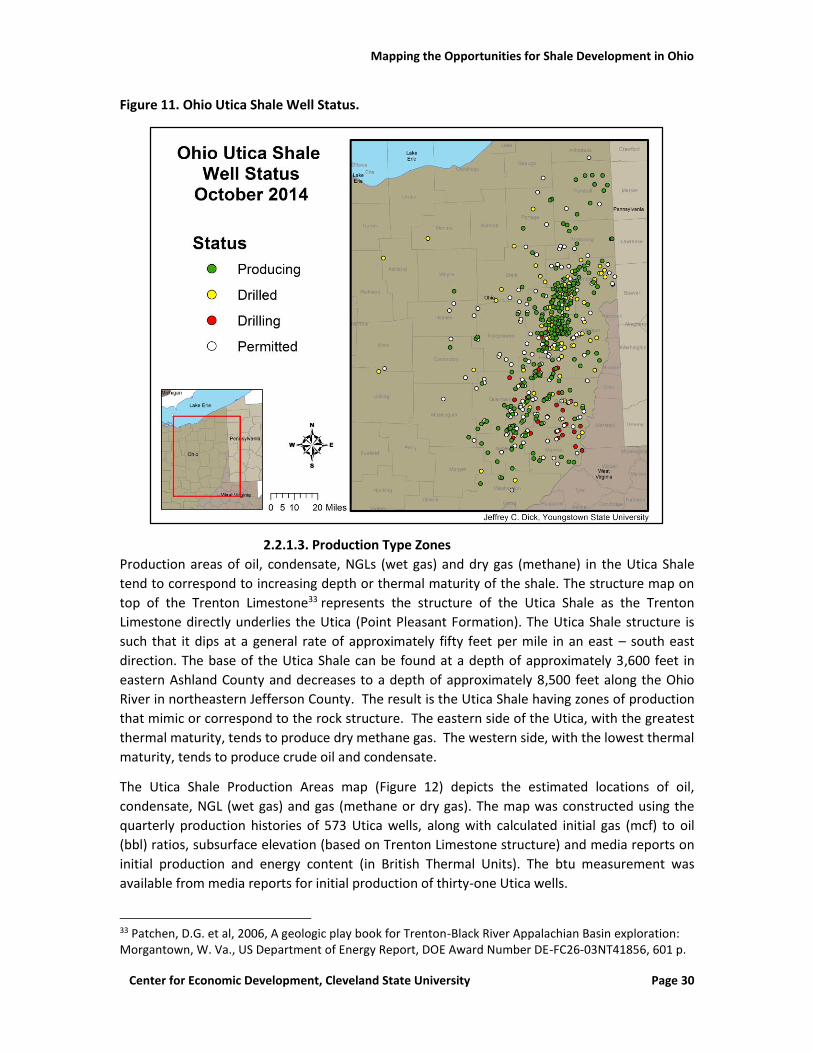
Mapping the Opportunities for Shale Development in Ohio
Center for Economic Development, Cleveland State University Page 30
Figure 11. Ohio Utica Shale Well Status.
2.2.1.3. Production Type Zones Production areas of oil, condensate, NGLs (wet gas) and dry gas (methane) in the Utica Shale
tend to correspond to increasing depth or thermal maturity of the shale. The structure map on
top of the Trenton Limestone33 represents the structure of the Utica Shale as the Trenton
Limestone directly underlies the Utica (Point Pleasant Formation). The Utica Shale structure is
such that it dips at a general rate of approximately fifty feet per mile in an east – south east
direction. The base of the Utica Shale can be found at a depth of approximately 3,600 feet in
eastern Ashland County and decreases to a depth of approximately 8,500 feet along the Ohio
River in northeastern Jefferson County. The result is the Utica Shale having zones of production
that mimic or correspond to the rock structure. The eastern side of the Utica, with the greatest
thermal maturity, tends to produce dry methane gas. The western side, with the lowest thermal
maturity, tends to produce crude oil and condensate.
The Utica Shale Production Areas map (Figure 12) depicts the estimated locations of oil,
condensate, NGL (wet gas) and gas (methane or dry gas). The map was constructed using the
quarterly production histories of 573 Utica wells, along with calculated initial gas (mcf) to oil
(bbl) ratios, subsurface elevation (based on Trenton Limestone structure) and media reports on
initial production and energy content (in British Thermal Units). The btu measurement was
available from media reports for initial production of thirty-one Utica wells.
33 Patchen, D.G. et al, 2006, A geologic play book for Trenton-Black River Appalachian Basin exploration: Morgantown, W. Va., US Department of Energy Report, DOE Award Number DE-FC26-03NT41856, 601 p.
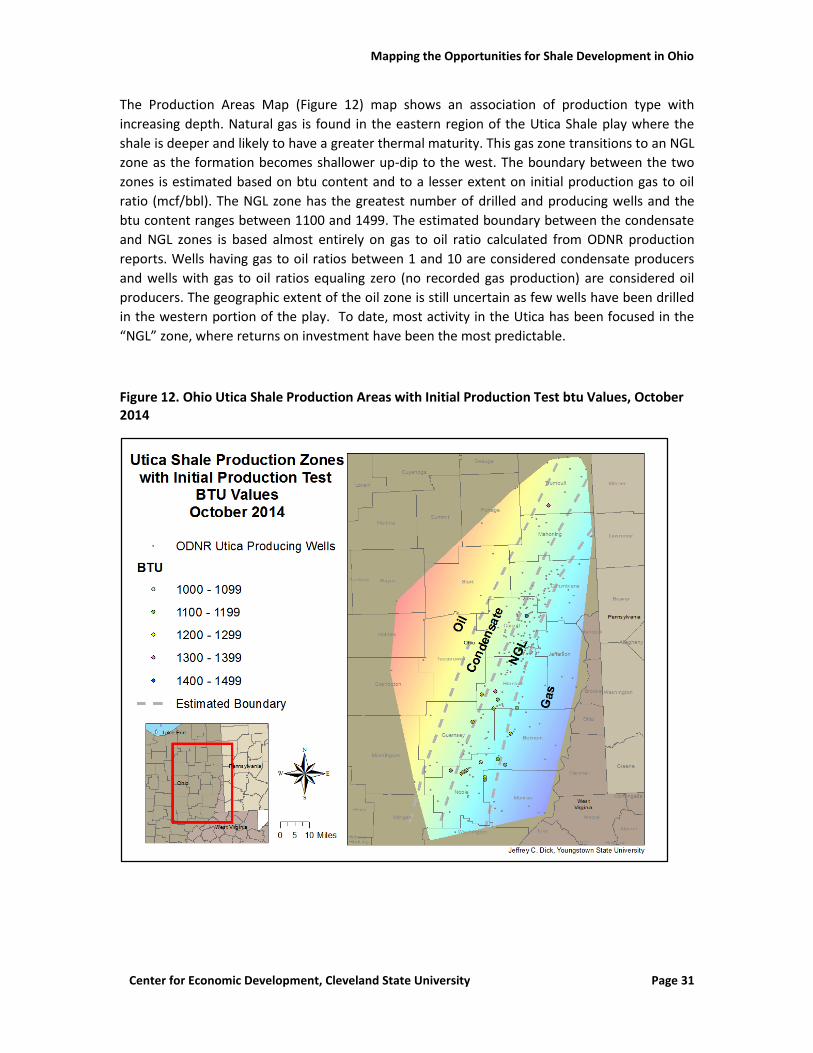
Mapping the Opportunities for Shale Development in Ohio
Center for Economic Development, Cleveland State University Page 31
The Production Areas Map (Figure 12) map shows an association of production type with
increasing depth. Natural gas is found in the eastern region of the Utica Shale play where the
shale is deeper and likely to have a greater thermal maturity. This gas zone transitions to an NGL
zone as the formation becomes shallower up-dip to the west. The boundary between the two
zones is estimated based on btu content and to a lesser extent on initial production gas to oil
ratio (mcf/bbl). The NGL zone has the greatest number of drilled and producing wells and the
btu content ranges between 1100 and 1499. The estimated boundary between the condensate
and NGL zones is based almost entirely on gas to oil ratio calculated from ODNR production
reports. Wells having gas to oil ratios between 1 and 10 are considered condensate producers
and wells with gas to oil ratios equaling zero (no recorded gas production) are considered oil
producers. The geographic extent of the oil zone is still uncertain as few wells have been drilled
in the western portion of the play. To date, most activity in the Utica has been focused in the
“NGL” zone, where returns on investment have been the most predictable.
Figure 12. Ohio Utica Shale Production Areas with Initial Production Test btu Values, October 2014
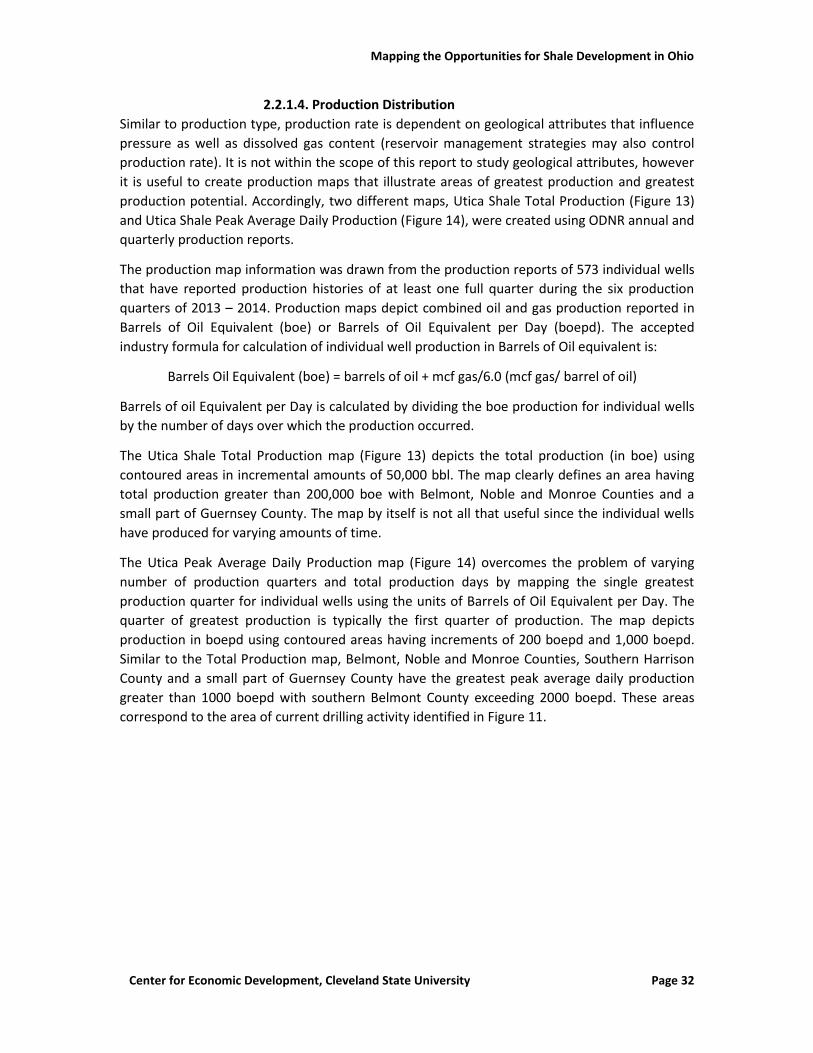
Mapping the Opportunities for Shale Development in Ohio
Center for Economic Development, Cleveland State University Page 32
2.2.1.4. Production Distribution Similar to production type, production rate is dependent on geological attributes that influence
pressure as well as dissolved gas content (reservoir management strategies may also control
production rate). It is not within the scope of this report to study geological attributes, however
it is useful to create production maps that illustrate areas of greatest production and greatest
production potential. Accordingly, two different maps, Utica Shale Total Production (Figure 13)
and Utica Shale Peak Average Daily Production (Figure 14), were created using ODNR annual and
quarterly production reports.
The production map information was drawn from the production reports of 573 individual wells
that have reported production histories of at least one full quarter during the six production
quarters of 2013 – 2014. Production maps depict combined oil and gas production reported in
Barrels of Oil Equivalent (boe) or Barrels of Oil Equivalent per Day (boepd). The accepted
industry formula for calculation of individual well production in Barrels of Oil equivalent is:
Barrels Oil Equivalent (boe) = barrels of oil + mcf gas/6.0 (mcf gas/ barrel of oil)
Barrels of oil Equivalent per Day is calculated by dividing the boe production for individual wells
by the number of days over which the production occurred.
The Utica Shale Total Production map (Figure 13) depicts the total production (in boe) using
contoured areas in incremental amounts of 50,000 bbl. The map clearly defines an area having
total production greater than 200,000 boe with Belmont, Noble and Monroe Counties and a
small part of Guernsey County. The map by itself is not all that useful since the individual wells
have produced for varying amounts of time.
The Utica Peak Average Daily Production map (Figure 14) overcomes the problem of varying
number of production quarters and total production days by mapping the single greatest
production quarter for individual wells using the units of Barrels of Oil Equivalent per Day. The
quarter of greatest production is typically the first quarter of production. The map depicts
production in boepd using contoured areas having increments of 200 boepd and 1,000 boepd.
Similar to the Total Production map, Belmont, Noble and Monroe Counties, Southern Harrison
County and a small part of Guernsey County have the greatest peak average daily production
greater than 1000 boepd with southern Belmont County exceeding 2000 boepd. These areas
correspond to the area of current drilling activity identified in Figure 11.
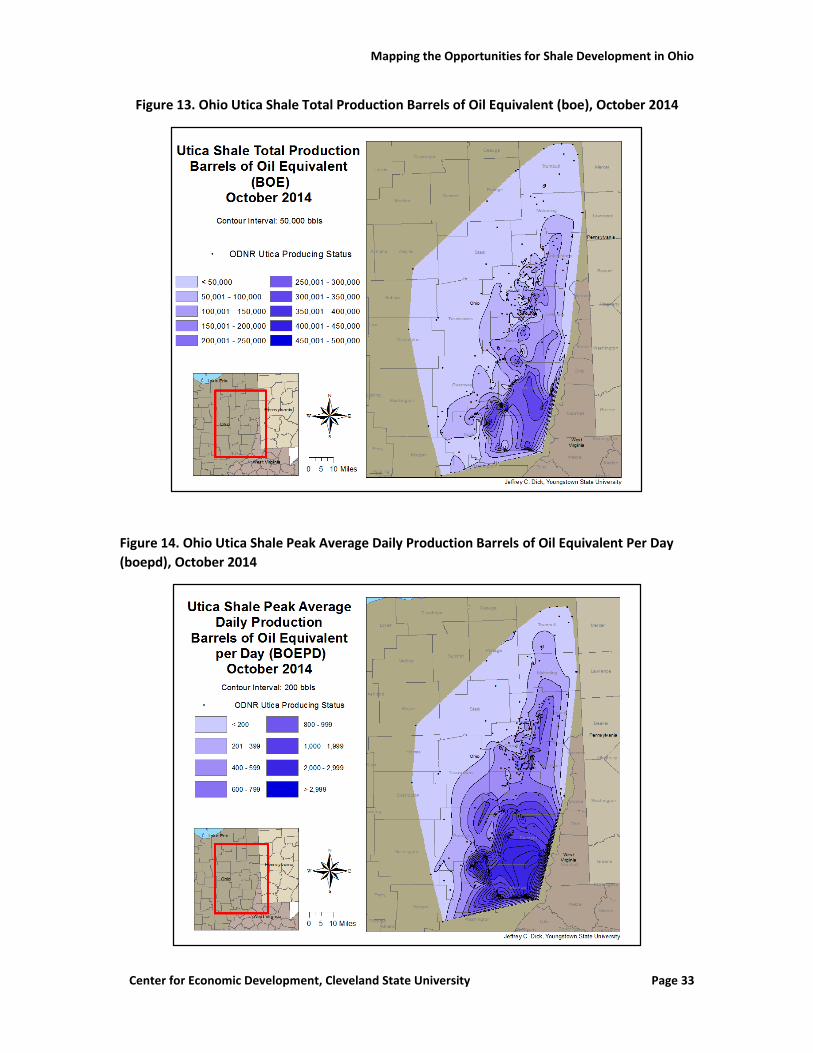
Mapping the Opportunities for Shale Development in Ohio
Center for Economic Development, Cleveland State University Page 33
Figure 13. Ohio Utica Shale Total Production Barrels of Oil Equivalent (boe), October 2014
Figure 14. Ohio Utica Shale Peak Average Daily Production Barrels of Oil Equivalent Per Day
(boepd), October 2014
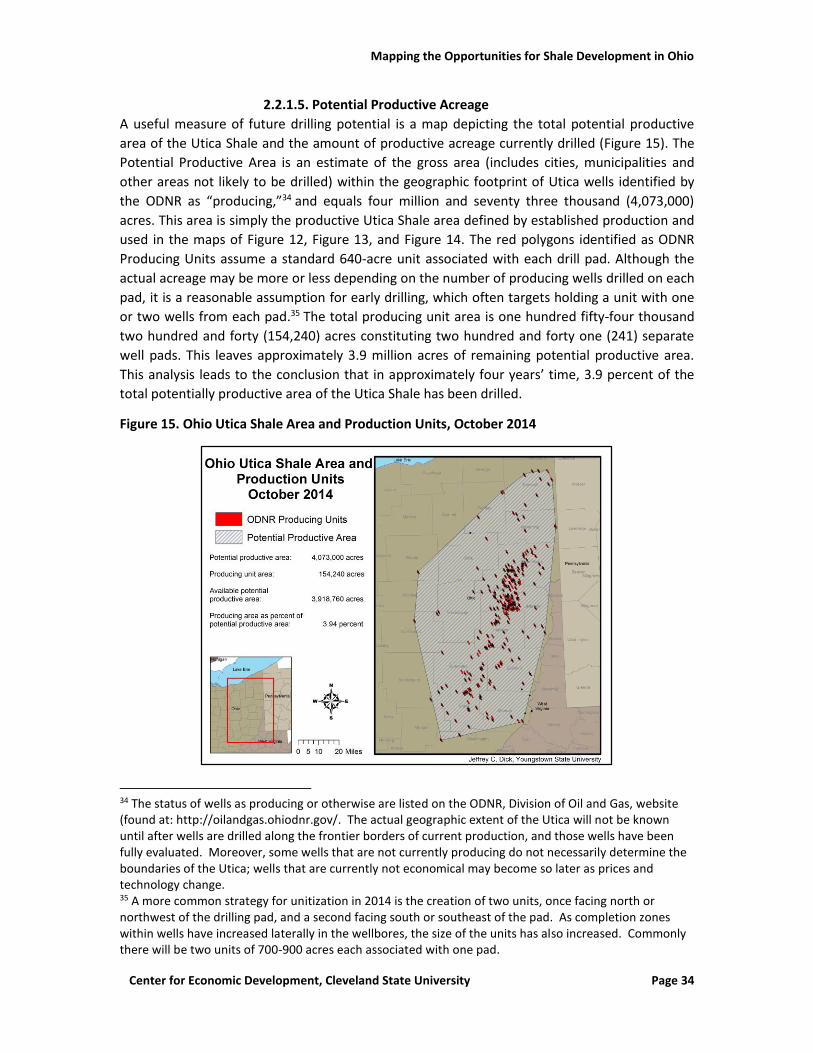
Mapping the Opportunities for Shale Development in Ohio
Center for Economic Development, Cleveland State University Page 34
2.2.1.5. Potential Productive Acreage A useful measure of future drilling potential is a map depicting the total potential productive
area of the Utica Shale and the amount of productive acreage currently drilled (Figure 15). The
Potential Productive Area is an estimate of the gross area (includes cities, municipalities and
other areas not likely to be drilled) within the geographic footprint of Utica wells identified by
the ODNR as “producing,”34 and equals four million and seventy three thousand (4,073,000)
acres. This area is simply the productive Utica Shale area defined by established production and
used in the maps of Figure 12, Figure 13, and Figure 14. The red polygons identified as ODNR
Producing Units assume a standard 640-acre unit associated with each drill pad. Although the
actual acreage may be more or less depending on the number of producing wells drilled on each
pad, it is a reasonable assumption for early drilling, which often targets holding a unit with one
or two wells from each pad.35 The total producing unit area is one hundred fifty-four thousand
two hundred and forty (154,240) acres constituting two hundred and forty one (241) separate
well pads. This leaves approximately 3.9 million acres of remaining potential productive area.
This analysis leads to the conclusion that in approximately four years’ time, 3.9 percent of the
total potentially productive area of the Utica Shale has been drilled.
Figure 15. Ohio Utica Shale Area and Production Units, October 2014
34 The status of wells as producing or otherwise are listed on the ODNR, Division of Oil and Gas, website (found at: http://oilandgas.ohiodnr.gov/. The actual geographic extent of the Utica will not be known until after wells are drilled along the frontier borders of current production, and those wells have been fully evaluated. Moreover, some wells that are not currently producing do not necessarily determine the boundaries of the Utica; wells that are currently not economical may become so later as prices and technology change. 35 A more common strategy for unitization in 2014 is the creation of two units, once facing north or northwest of the drilling pad, and a second facing south or southeast of the pad. As completion zones within wells have increased laterally in the wellbores, the size of the units has also increased. Commonly there will be two units of 700-900 acres each associated with one pad.
Mapping the Opportunities for Shale Development in Ohio
Center for Economic Development, Cleveland State University Page 35
2.2.1.6. Drilling Estimates Rate of drilling is controlled by a combination of factors that include petroleum commodity
prices, production rates, rig availability, rig counts, drilling efficiency, and strategies of the
exploration and production companies. Commodity prices include NGLs, which have remained
relatively high in recent years for the C3 (propane) and greater liquids. Lower commodity prices
for methane may have contributed to rigs being moved from the dry gas region to the wet gas
region in recent years.
The number of rigs moving on to site, drilling or moving off site is referred to as rig count. Rig
count for the state of Ohio is monitored by the ODNR and reported by several industry reporting
entities such as Rigdata. According to weekly Rigdata reports36, the rig count increased from 40
in January 2014 to its peak of 56 in November 2014. However, Ohio rig counts have declined to
19 by June 2015.37 Based on drill rate information determined from ODNR records in October
2014, it was estimated that a total of 593 Utica wells would be drilled in 2014. The actual
number of Utica wells drilled and completed in 2014 was 391.38
Rate of drilling is dependent on drilling efficiency and the number of available rigs. This rate can
increase both due to the addition of drill rigs and to the improvement in drilling efficiencies.
Indeed, drilling efficiency has improved considerably in recent years, as operators improve their
understanding of the Utica Shale and as operations shift from exploration activities to
development activities. Spud-to-spud time is the amount of days required to set up a rig, drill a
well and then move to a new site. Based on ODNR cumulative permitting activity reports for
2014, the average spud-to-spud time for 2014 was 28.4 days. Drilling efficiency will continue to
improve, however; spud-to-spud times will most likely be impacted by an emphasis on
development drilling wherein rigs drill multiple wells on individual pads before tearing down and
moving to a different pad.
It can be reasonably assumed that the rig count will increase slightly in the next several years in
response to the high production volumes being delivered from the Utica. The “Most Likely”
scenario throughput projections made in this study assumes that Utica rig count will rise by
around 3 rigs per year, from 45 in 2014 to 53 in 2017. The study also assumes drilling efficiency
will continue to improve, reaching spud-to-spud times of 22 days during this same time period.
The projected rig count and spud-to-spud times can be used to project future drilling rates
(wells/year) and the cumulative number of wells. Nevertheless, production on a per well basis
continues to increase in the Utica as a result of longer laterals and more completion stages in
each well. Accordingly, for purposes of projecting throughput volumes between 2015 and 2019,
the “most likely” drilling estimate is still projected to provide the best estimate.
36 “The Rig Count by State & District: Weekly Average for Each Month, January 2014-December 2014” RigData 1/15. http://www.rigdata.com/counts_rankings/rig_count.aspx 37 “The Rig Count by State & District: Weekly Average for Each Month, January 2015-June 2015” RigData 7/15. http://www.rigdata.com/counts_rankings/rig_count.aspx 38 The total number of unconventional wells drilled and completed in 2014 was 401, including wells drilled into the Marcellus formation. See “The Debrosse Memorial Report 2014,” Ohio Oil and Gas Association 68th Annual Winter Meeting, http://c.ymcdn.com/sites/www.ooga.org/resource/resmgr/Docs/The_Debrosse_Memorial_Report.pdf
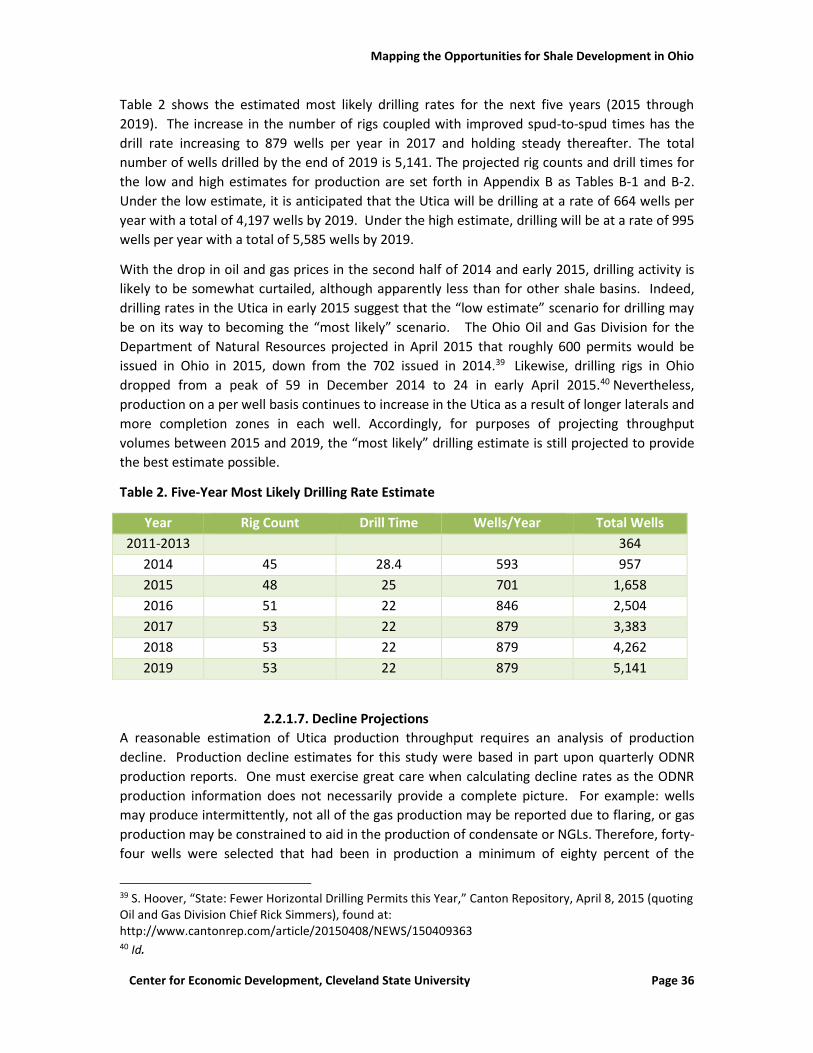
Mapping the Opportunities for Shale Development in Ohio
Center for Economic Development, Cleveland State University Page 36
Table 2 shows the estimated most likely drilling rates for the next five years (2015 through
2019). The increase in the number of rigs coupled with improved spud-to-spud times has the
drill rate increasing to 879 wells per year in 2017 and holding steady thereafter. The total
number of wells drilled by the end of 2019 is 5,141. The projected rig counts and drill times for
the low and high estimates for production are set forth in Appendix B as Tables B-1 and B-2.
Under the low estimate, it is anticipated that the Utica will be drilling at a rate of 664 wells per
year with a total of 4,197 wells by 2019. Under the high estimate, drilling will be at a rate of 995
wells per year with a total of 5,585 wells by 2019.
With the drop in oil and gas prices in the second half of 2014 and early 2015, drilling activity is
likely to be somewhat curtailed, although apparently less than for other shale basins. Indeed,
drilling rates in the Utica in early 2015 suggest that the “low estimate” scenario for drilling may
be on its way to becoming the “most likely” scenario. The Ohio Oil and Gas Division for the
Department of Natural Resources projected in April 2015 that roughly 600 permits would be
issued in Ohio in 2015, down from the 702 issued in 2014.39 Likewise, drilling rigs in Ohio
dropped from a peak of 59 in December 2014 to 24 in early April 2015.40 Nevertheless,
production on a per well basis continues to increase in the Utica as a result of longer laterals and
more completion zones in each well. Accordingly, for purposes of projecting throughput
volumes between 2015 and 2019, the “most likely” drilling estimate is still projected to provide
the best estimate possible.
Table 2. Five-Year Most Likely Drilling Rate Estimate
Year Rig Count Drill Time Wells/Year Total Wells
2011-2013 364
2014 45 28.4 593 957
2015 48 25 701 1,658
2016 51 22 846 2,504
2017 53 22 879 3,383
2018 53 22 879 4,262
2019 53 22 879 5,141
2.2.1.7. Decline Projections A reasonable estimation of Utica production throughput requires an analysis of production
decline. Production decline estimates for this study were based in part upon quarterly ODNR
production reports. One must exercise great care when calculating decline rates as the ODNR
production information does not necessarily provide a complete picture. For example: wells
may produce intermittently, not all of the gas production may be reported due to flaring, or gas
production may be constrained to aid in the production of condensate or NGLs. Therefore, forty-
four wells were selected that had been in production a minimum of eighty percent of the
39 S. Hoover, “State: Fewer Horizontal Drilling Permits this Year,” Canton Repository, April 8, 2015 (quoting Oil and Gas Division Chief Rick Simmers), found at: http://www.cantonrep.com/article/20150408/NEWS/150409363 40 Id.
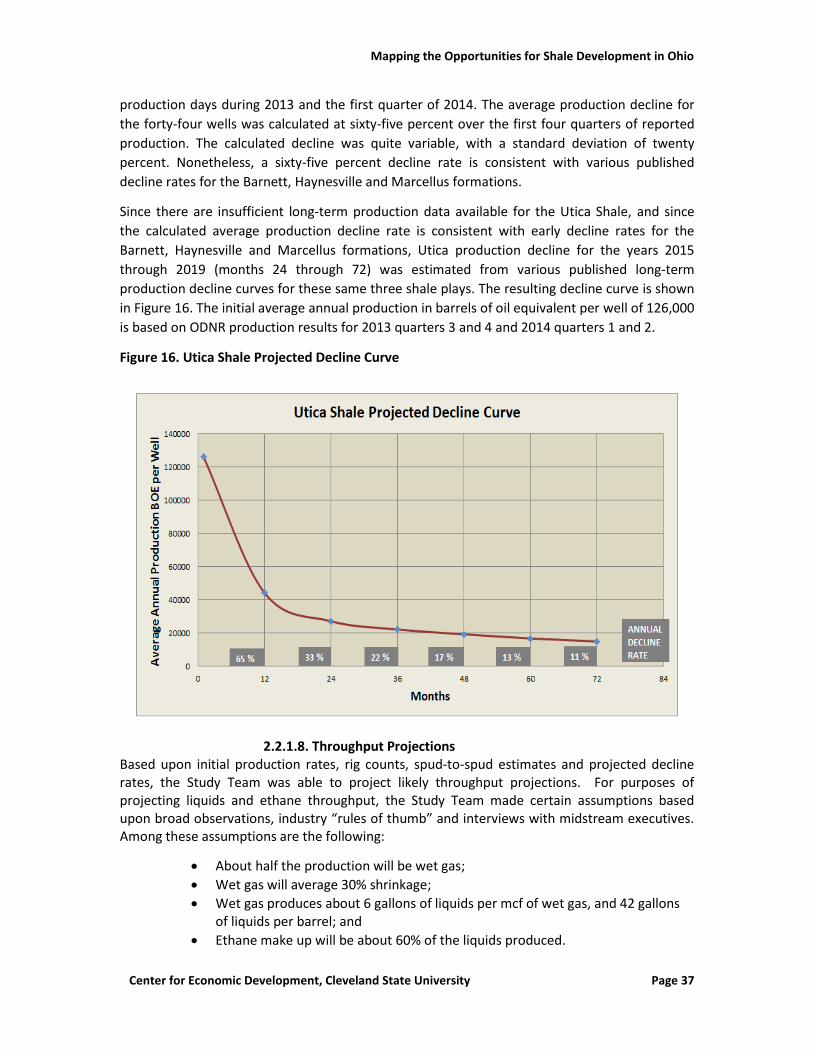
Mapping the Opportunities for Shale Development in Ohio
Center for Economic Development, Cleveland State University Page 37
production days during 2013 and the first quarter of 2014. The average production decline for
the forty-four wells was calculated at sixty-five percent over the first four quarters of reported
production. The calculated decline was quite variable, with a standard deviation of twenty
percent. Nonetheless, a sixty-five percent decline rate is consistent with various published
decline rates for the Barnett, Haynesville and Marcellus formations.
Since there are insufficient long-term production data available for the Utica Shale, and since
the calculated average production decline rate is consistent with early decline rates for the
Barnett, Haynesville and Marcellus formations, Utica production decline for the years 2015
through 2019 (months 24 through 72) was estimated from various published long-term
production decline curves for these same three shale plays. The resulting decline curve is shown
in Figure 16. The initial average annual production in barrels of oil equivalent per well of 126,000
is based on ODNR production results for 2013 quarters 3 and 4 and 2014 quarters 1 and 2.
Figure 16. Utica Shale Projected Decline Curve
2.2.1.8. Throughput Projections Based upon initial production rates, rig counts, spud-to-spud estimates and projected decline rates, the Study Team was able to project likely throughput projections. For purposes of projecting liquids and ethane throughput, the Study Team made certain assumptions based upon broad observations, industry “rules of thumb” and interviews with midstream executives. Among these assumptions are the following:
About half the production will be wet gas;
Wet gas will average 30% shrinkage;
Wet gas produces about 6 gallons of liquids per mcf of wet gas, and 42 gallons of liquids per barrel; and
Ethane make up will be about 60% of the liquids produced.
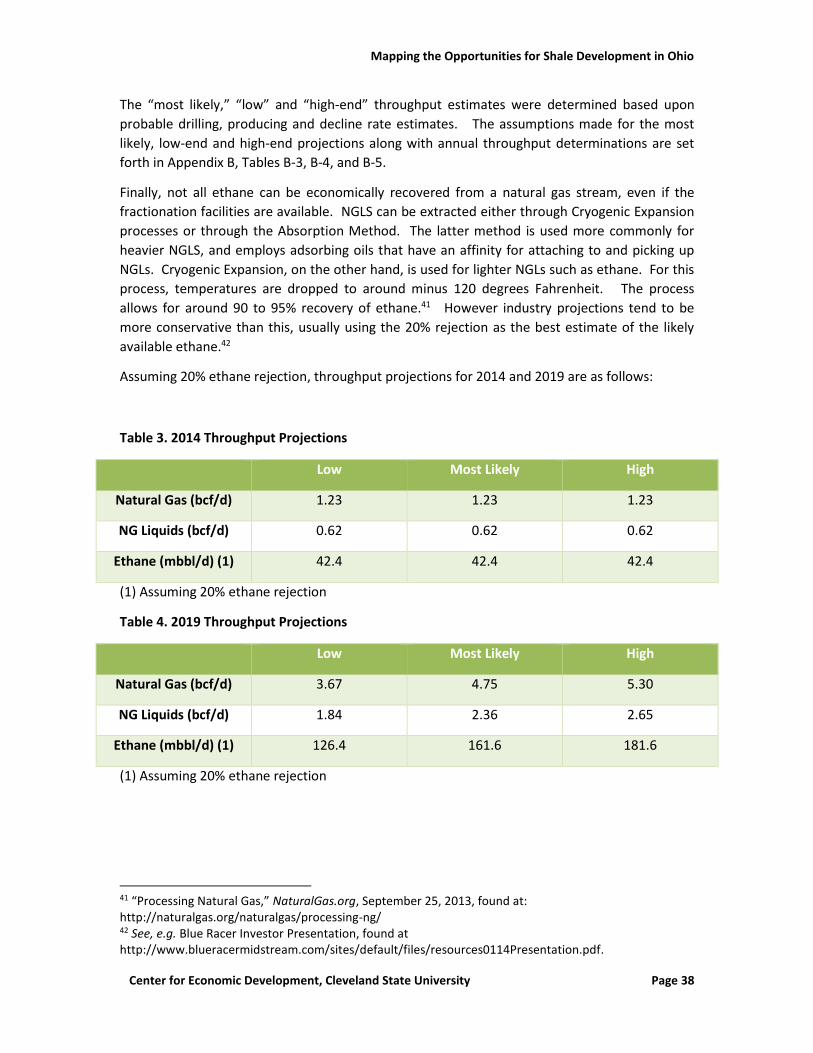
Mapping the Opportunities for Shale Development in Ohio
Center for Economic Development, Cleveland State University Page 38
The “most likely,” “low” and “high-end” throughput estimates were determined based upon
probable drilling, producing and decline rate estimates. The assumptions made for the most
likely, low-end and high-end projections along with annual throughput determinations are set
forth in Appendix B, Tables B-3, B-4, and B-5.
Finally, not all ethane can be economically recovered from a natural gas stream, even if the
fractionation facilities are available. NGLS can be extracted either through Cryogenic Expansion
processes or through the Absorption Method. The latter method is used more commonly for
heavier NGLS, and employs adsorbing oils that have an affinity for attaching to and picking up
NGLs. Cryogenic Expansion, on the other hand, is used for lighter NGLs such as ethane. For this
process, temperatures are dropped to around minus 120 degrees Fahrenheit. The process
allows for around 90 to 95% recovery of ethane.41 However industry projections tend to be
more conservative than this, usually using the 20% rejection as the best estimate of the likely
available ethane.42
Assuming 20% ethane rejection, throughput projections for 2014 and 2019 are as follows:
Table 3. 2014 Throughput Projections
Low Most Likely High
Natural Gas (bcf/d) 1.23 1.23 1.23
NG Liquids (bcf/d) 0.62 0.62 0.62
Ethane (mbbl/d) (1) 42.4 42.4 42.4
(1) Assuming 20% ethane rejection
Table 4. 2019 Throughput Projections
Low Most Likely High
Natural Gas (bcf/d) 3.67 4.75 5.30
NG Liquids (bcf/d) 1.84 2.36 2.65
Ethane (mbbl/d) (1) 126.4 161.6 181.6
(1) Assuming 20% ethane rejection
41 “Processing Natural Gas,” NaturalGas.org, September 25, 2013, found at: http://naturalgas.org/naturalgas/processing-ng/ 42 See, e.g. Blue Racer Investor Presentation, found at http://www.blueracermidstream.com/sites/default/files/resources0114Presentation.pdf.
Mapping the Opportunities for Shale Development in Ohio
Center for Economic Development, Cleveland State University Page 39
2.2.2. Midstream and Other Industry Throughput Projections To justify their large investments into infrastructure to serve the upstream industry, midstream
companies have been making their own projections. These projections, along with those of
industry analysts, are often presented at conferences and for investors. Moreover, most
midstream companies are creating one integrated infrastructure for the Utica-Marcellus region.
Often, as a result, they aggregate volume projections from both shale deposits. The Study Team
reviewed publicly available literature and presentations made by midstream companies
projecting throughput. This section compiles the various views provided by industry experts as
to the likely production to be found from the Utica Shale over the next five years.
Due to the value received from NGLs, early development of the Utica is expected to be primarily
in the “wet gas” corridor. The same assumptions that were made for the Study Team
production scenarios were used here to estimate throughput: according to midstream and
upstream companies operating in the region, a typical Utica natural gas well producing in the
wet gas corridor has about 30% shrinkage after processing, or approximately 6 gallons of liquids
per mcf of produced wet natural gas. Of these liquids, the typical make up is approximately:
60% ethane,
22% propane,
11% butane, and
7% other, more complex hydrocarbons.43
A 2014 study from Tudor, Pickering & Holt projected 8.1 bcf/d of production from the Utica by
the year 2020, a substantial increase from the 6.0 bcf/d projections made by that firm earlier.44
Using this natural gas throughput volume, we can generate a very rough estimate of the amount
of ethane likely to be produced from the Utica on a daily basis. Assuming that half of this
production volume is wet gas (assumes that drilling in the dry gas area will pick up by 2020 to
preserve leaseholds), and assuming 6 gallons of NGL/mcf and 60% of every gallon of NGL in
ethane, the projected 8.1 bcf/d of Utica’s natural gas converts to 347 mbbl/d of ethane by
2020.45
Of course, the downstream companies acquiring ethane supplies don’t concern themselves as to
whether the ethane comes from the Marcellus or the Utica production. So for purposes of
assessing regional ethane supply, the Utica and Marcellus production should be combined.
According to midstream company Blue Racer, 2014 natural gas production will be around 13
bcf/d for the two shale plays.46 Industry analysts at Wood MacKenzie project this will increase
to about 25 bcf/d by 2020.47 Blue Racer projects total “wet gas” production from the basin in
43 The Study Team interviewed a number of major midstream and upstream companies during the course of the research. Based upon these interviews ethane content was found to be around 60% of the NGLs produced, and this number was used for the “rule of thumb” ethane throughput calculation. 44 2015 Tudor, Pickering, Holt & Co. 11th Annual Hotter ‘N Hell Energy Conference. 6/16/15. 45 A coefficient of 42 is used to convert American gallons to barrels of oil. 46 “From Importer to Exporter” Blue Racer 1/30/14. 47 C. Davis, “Eagle Ford to Rival North Slope Output at its Peak, Says Wood Mackenzie,” NGI’s Shale Daily 6/6/14. http://www.naturalgasintel.com/articles/98627-eagle-ford-to-rival-north-slope-output-at-its-peak-says-wood-mackenzie

Mapping the Opportunities for Shale Development in Ohio
Center for Economic Development, Cleveland State University Page 40
2020 to be around 9.3 bcf/d. Of this, Blue Racer projects about 3.6 bcf/d will be from the Utica,
and about 5.7 bcf/d from the Marcellus.48
Using the same formula as before (but without adjusting for dry gas), we obtain from Blue
Racer’s projections a throughput of approximately 247 mbbl/d by 2020 from the Utica
formation plus another 391 mbbl/d (both assuming 20% ethane rejection) from the Marcellus
formation, for a total ethane output of 638 mbbl/d from the combined Utica/Marcellus basin.
The anticipated industry throughput projections compared to those from the Study Team are as
follows:
Table 5. Comparison of Study Derived Throughput to Public Industry Projections
Total Throughput
(bcf/d)
Wet Gas Throughput
(bcf/d)
Ethane Throughput
(mbbl/d) (1)
Study Projections
(“most likely” scenario)
4.75 2.36 162
Industry Projections 8.149 3.650 247
(1) Assuming 20% ethane rejection
2.3. Midstream Company Activities
2.3.1. Gathering Lines The midstream operations in the Utica region consist of gathering lines to bring the gas to either
an interstate pipeline (if the gas is dry) or to a processing plant (if the gas is wet). These
activities are often the specialty of companies that have particular skills in transportation,
processing, or both. The result is that many of the midstream activities in the Utica are carried
out by joint ventures (JV) between companies that pool together expertise and capital. A
common partner to the JV might be a producing company. By joining the venture, producing
companies may have more control over midstream infrastructure development and,
accordingly, more control over development of markets for their production. After the take-
away process is constructed and the market ensured, the producer may sell its interests in the
JV to other partners so that it may reinvest the capital into exploration and production.
Because midstream infrastructure is so capital intensive, one of the co-venturers may also be
the party that brings capital to the project. The JVs are also usually structured based upon the
geography of the producer leaseholds owned by the principal producers and of any pre-existing
gathering lines owned by the midstream company.
There are two principal JV business models for marketing of liquids that may affect downstream
industry development. Both models are employed in the Utica. One model envisions
48 Blue Racer, January 2014. 49 Tudor, Pickering and Holt projection, Fall 2014. 50 Blue Racer projection, Fall 2014. Ethane projections are based upon the same assumptions set forth earlier: 6 gallons/mcf, 60% ethane and 42 gallons/bbl.
Mapping the Opportunities for Shale Development in Ohio
Center for Economic Development, Cleveland State University Page 41
transporting and processing natural gas on a “fee” basis, tying the fee to the volume of gas
transported or processed. The other model allows the midstream company to take title to the
NGLs upon processing. In this case, the midstream company assumes the risk of marketing or
any loss of the liquids. Which model is deployed depends largely upon what expertise the JV
participants may have. Normally, whoever has the most expertise at marketing liquids will take
title to the production after processing. In some instances this may be the producing company;
in other cases, it may be the midstream company. In some cases a JV may deploy both models.
The Appalachian basin had a significant gathering line infrastructure that pre-existed the
development of the shale formations. Dominion, for instance, contributed almost 600 miles of
gathering lines (with a capacity of 1.5 bcf/d) to its Blue Racer joint venture with Caiman Energy,
much of which predates the Utica development. 51 However Dominion’s pre-existing
infrastructure was insufficient to support the significant new production coming into Blue
Racer’s processing facilities, so new gathering lines are being built.
In addition to Dominion, other midstream companies that have gathering line capacity include:
MarkWest (385 mmcf/d)52 and Access (1.1 bcf/d).53 Companies that report gathering lines in
miles include: NiSource (55 miles)54 and Antero (105 miles).55 While it appears that there is or
will be sufficient gathering trunk line capacity to ensure continued growth in the Utica, there is a
possibility that gathering line build out from the trunk lines to the respective fields will lag gas
discovery. This could slow production growth.
51 “From Importer to Exporter” Blue Racer 1/30/14. 52 “2014 Morgan Stanley Marcellus-Utica Summit” MarkWest 9/17/14. http://investor.markwest.com/phoenix.zhtml?c=135034&p=irol-presentations 53 Industry interviews 54 “Pennant Midstream Hickory Bend Processing Plant and Gathering System Project” Columbia Pipeline Group 2014. https://www.columbiapipelinegroup.com/current-projects/pennant-midstream-hickory-bend-processing-plant-and-gathering-system 55 “Company Overview October 2014” Antero Resources 10/14. http://investors.anteroresources.com/investors-relations/events-and-presentations/company-presentation/default.aspx
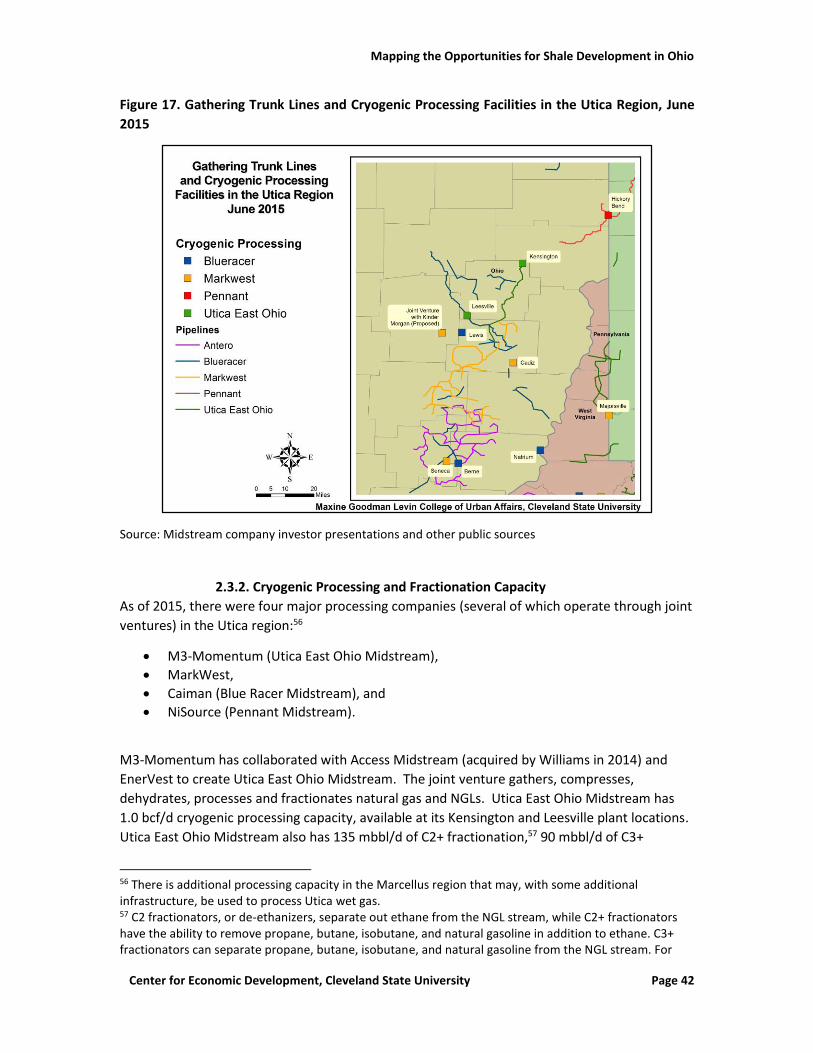
Mapping the Opportunities for Shale Development in Ohio
Center for Economic Development, Cleveland State University Page 42
Figure 17. Gathering Trunk Lines and Cryogenic Processing Facilities in the Utica Region, June
2015
Source: Midstream company investor presentations and other public sources
2.3.2. Cryogenic Processing and Fractionation Capacity As of 2015, there were four major processing companies (several of which operate through joint
ventures) in the Utica region:56
M3-Momentum (Utica East Ohio Midstream),
MarkWest,
Caiman (Blue Racer Midstream), and
NiSource (Pennant Midstream).
M3-Momentum has collaborated with Access Midstream (acquired by Williams in 2014) and
EnerVest to create Utica East Ohio Midstream. The joint venture gathers, compresses,
dehydrates, processes and fractionates natural gas and NGLs. Utica East Ohio Midstream has
1.0 bcf/d cryogenic processing capacity, available at its Kensington and Leesville plant locations.
Utica East Ohio Midstream also has 135 mbbl/d of C2+ fractionation,57 90 mbbl/d of C3+
56 There is additional processing capacity in the Marcellus region that may, with some additional infrastructure, be used to process Utica wet gas. 57 C2 fractionators, or de-ethanizers, separate out ethane from the NGL stream, while C2+ fractionators have the ability to remove propane, butane, isobutane, and natural gasoline in addition to ethane. C3+ fractionators can separate propane, butane, isobutane, and natural gasoline from the NGL stream. For
Mapping the Opportunities for Shale Development in Ohio
Center for Economic Development, Cleveland State University Page 43
fractionation, 1 million barrels of NGL storage, a high capacity rail and truck terminal, and
multiple purity product pipelines to distribute NGLs to the premium markets in the region. Utica
East Ohio Midstream producers include Chesapeake, Total, Hilcorp, Halcon, and Atlas.58
Caiman has partnered with Dominion to create Blue Racer. It processes gas for such operators
as Hess, Consol, Rex and Chesapeake. Caiman may choose to take title to and market the liquids
it processes, or it may choose to process liquids for a fee. As of April 2015 it had cryogenic
processing capability of 400 mmcf/d in Natrium, West Virginia and 400 mmcf/d in Berne, Ohio.
Blue Racer has a C2+ fractionation capacity of 46 mbbl/d in Natrium, with another 80 mbbl/d
under construction.59 Blue Racer also had 200 mmcf/d of cryogenic processing planned for a
new facility in Petersburg, Ohio. Due to poor production in the northern portion of the Utica,
however, the plans for this facility have been cancelled.60
MarkWest (acquired by Marathon in 2015) has midstream operations in Ohio, West Virginia,
New York and Pennsylvania. It takes production from Gulfport, Antero, Chesapeake, Range,
Chevron, Consol and others. MarkWest may undertake fee-based processing or it may take title
to the liquids and market them. Its 2014 processing capacity for the Utica was 925 mmcf/d, 600
of which were at the Seneca, Ohio facility and 325 at the Cadiz, Ohio facility. In 2014, the Seneca
and Cadiz facilities were about 56% in use. MarkWest’s C3+ fractionation capacity in April 2015
was 120 mbbl/d (located at the Hopedale, Ohio complex), with another 40 mbbl/d of de-
ethanization (C2) located at its Cadiz facility. MarkWest anticipates expansions to 1,525
mmcf/d of processing capacity and 180 mbbl/d of C3+ fractionation.61 In August of 2013,
MarkWest announced that it plans to pursue a joint venture with Kinder Morgan to construct a
cryogenic processing facility in Tuscarawas County, Ohio. This plant will have an initial capacity
of 200 mmcf/d, with a planned expansion to 400 mmcf/d.62
NiSource operates midstream gathering and a processing plant as Pennant in a joint venture
with Hilcorp at the Hickory Bend facility in Mahoning County, Ohio. Pennant has processing
capacity of 200 mmcf/d63 and plans to add another 200 mmcf/d.64
more information, refer to: https://rbnenergy.com/adding-fractionation-capacity-and-rationalizing-in-the-utica-marcellus 58 Industry interviews 59 “From Importer to Exporter” Blue Racer 1/30/14. 60 “Blue Racer Shelves Petersburg Gas Project” The Business Journal 1/30/15. http://businessjournaldaily.com/blue-racer-shelves-petersburg-gas-project/ 61 “Fourth Quarter 2014 Conference Call Presentation” MarkWest 2/25/15. http://investor.markwest.com/phoenix.zhtml?c=135034&p=irol-presentations 62 “Kinder Morgan, MarkWest Utica EMG Announce Plans to Form Joint Venture to Support Northern Ohio Rich-Gas Development and NGL Takeaway from the Utica and Marcellus Shale Resource Plays” Business Wire 8/7/13. http://www.businesswire.com/news/home/20130807006090/en/Kinder-Morgan-MarkWest-Utica-EMG-Announce-Plans#.VHzHWcnzi1g 63 “Pennant Midstream Announces Hickory Bend Cryogenic Processing Plant Ready for Service” Columbia Pipeline Group 1/6/14. https://www.columbiapipelinegroup.com/about-us/news-room/2014/01/06/pennant-midstream-announces-hickory-bend-cryogenic-processing-plant-ready-for-service 64 “Pennant Midstream Hickory Bend Processing Plant and Gathering System Project” Columbia Pipeline Group 2014.
Mapping the Opportunities for Shale Development in Ohio
Center for Economic Development, Cleveland State University Page 44
As of June 2015, M3 Momentum had the largest cryogenic processing capacity in the Utica with
1.0 bcf/d, and plans to add at least 500 mmcf/d of additional processing capacity with the timing
dependent upon its customers’ production growth over the next few years.65 Caiman had a total
of 800 mmcf/d in cryogenic processing capacity, with plans to add an additional 600 mmcf/d
planned at either its Natrium or Lewis facilities. MarkWest plans to greatly increase its
processing capacity by 2020, expanding from 925 mmcf/d in 2014 to 1,525 mmcf/d. Its joint
venture with Kinder Morgan will add an additional 400 mmcf/d, once both phases are
complete.66 With Hickory Bend as its only current processing facility, NiSource will increase its
capacity from 200 mmcf/d to 400 mmcf/d by 2020. As of April 2015, the total cryogenic
processing capacity for the Utica is 2,925 mmcf/d, which is expected to increase to 5,225
mmcf/d by 2020.
Projected wet gas production from Utica by 2020, according to Blue Racer, will be about 3,600
mmcf/d. 67 Based upon this projection, it appears that there will be ample processing capacity
for the Utica in 2020. However, much of this processing capacity will also be handling Marcellus
wet gas, so total capacity for the region must be compared to total wet gas for the region. That
analysis is set forth in Section 2.3.4, below.
65 Industry interviews 66 “Kinder Morgan/MarkWest Joint Venture in Utica and Marcellus Shale” Mazurek Alford & Holliday 2/18/14. http://www.mahenergylaw.com/news/the-kinder-morgan-markwest-joint-venture-in-utica-and-marcellus-shale/ 67 “From Importer to Exporter” Blue Racer 1/30/14.
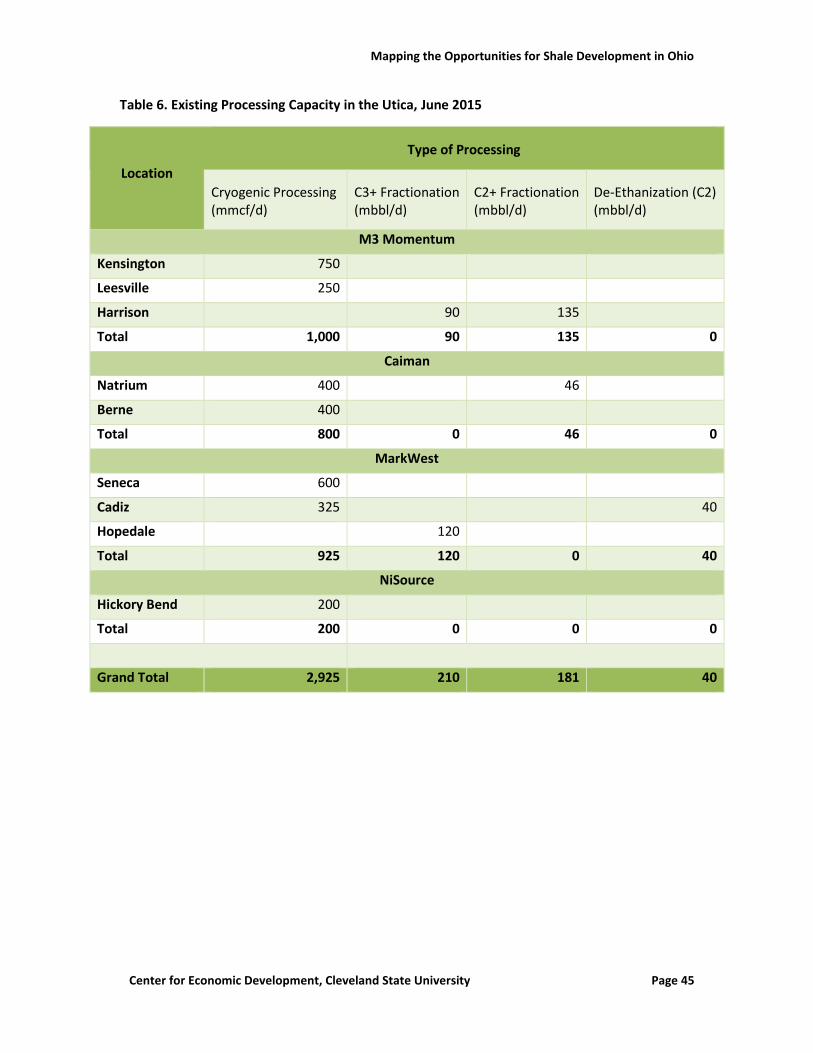
Mapping the Opportunities for Shale Development in Ohio
Center for Economic Development, Cleveland State University Page 45
Table 6. Existing Processing Capacity in the Utica, June 2015
Location
Type of Processing
Cryogenic Processing (mmcf/d)
C3+ Fractionation (mbbl/d)
C2+ Fractionation (mbbl/d)
De-Ethanization (C2) (mbbl/d)
M3 Momentum
Kensington 750
Leesville 250
Harrison 90 135
Total 1,000 90 135 0
Caiman
Natrium 400 46
Berne 400
Total 800 0 46 0
MarkWest
Seneca 600
Cadiz 325 40
Hopedale 120
Total 925 120 0 40
NiSource
Hickory Bend 200
Total 200 0 0 0
Grand Total 2,925 210 181 40
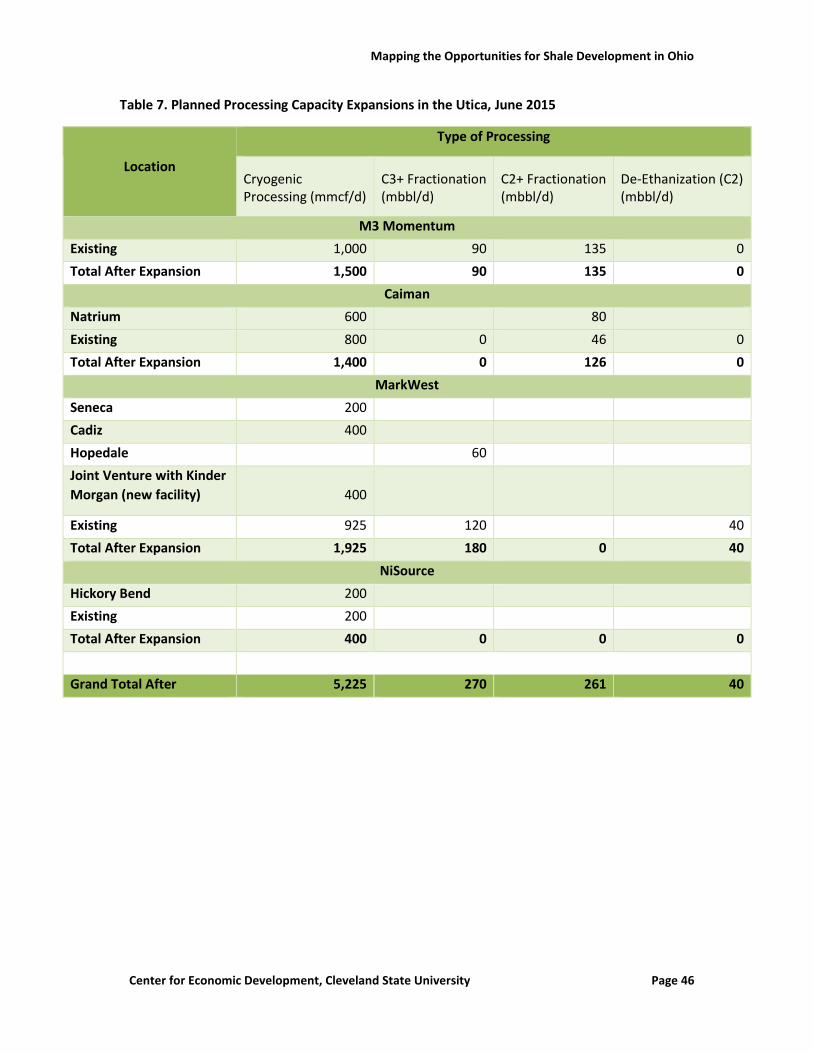
Mapping the Opportunities for Shale Development in Ohio
Center for Economic Development, Cleveland State University Page 46
Table 7. Planned Processing Capacity Expansions in the Utica, June 2015
Location
Type of Processing
Cryogenic Processing (mmcf/d)
C3+ Fractionation (mbbl/d)
C2+ Fractionation (mbbl/d)
De-Ethanization (C2) (mbbl/d)
M3 Momentum
Existing 1,000 90 135
0
Total After Expansion 1,500 90 135 0
Caiman
Natrium 600 80
Existing 800 0 46 0
Total After Expansion 1,400 0 126 0
MarkWest
Seneca 200
Cadiz 400
Hopedale 60
Joint Venture with Kinder
Morgan (new facility)
400
Existing 925 120 40
Total After Expansion 1,925 180 0 40
NiSource
Hickory Bend 200
Existing 200
Total After Expansion 400 0 0 0
Grand Total After
Expansion
5,225 270 261 40
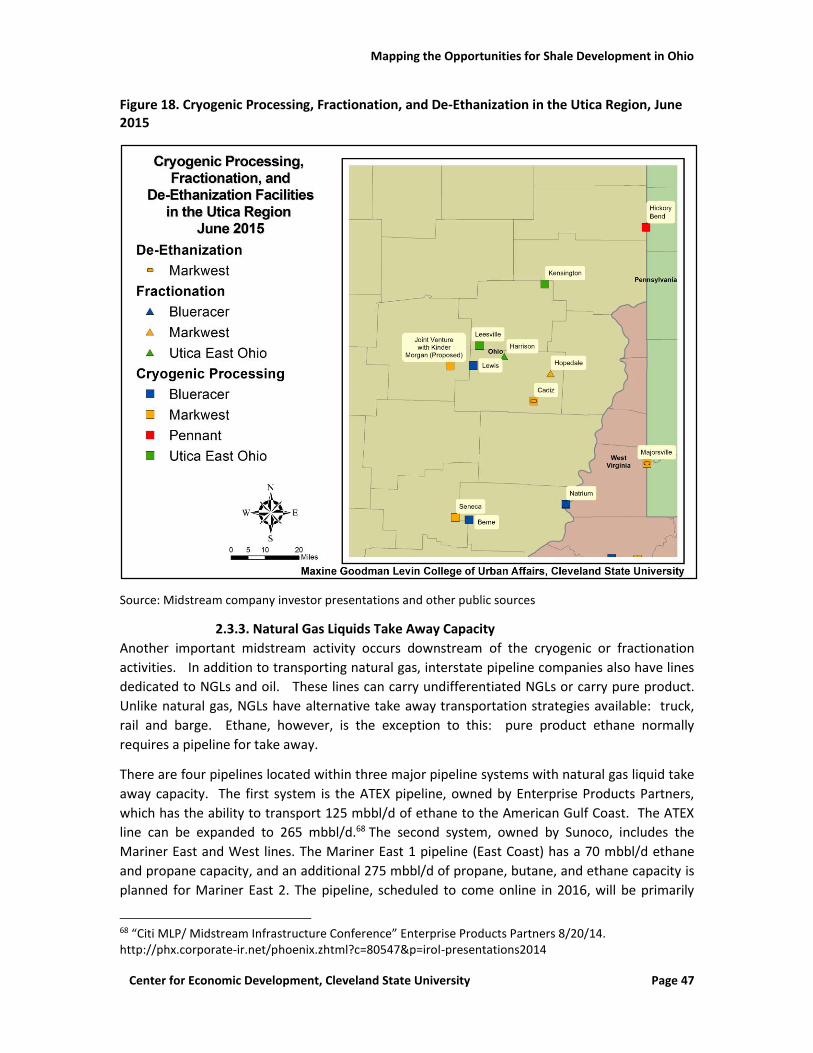
Mapping the Opportunities for Shale Development in Ohio
Center for Economic Development, Cleveland State University Page 47
Figure 18. Cryogenic Processing, Fractionation, and De-Ethanization in the Utica Region, June 2015
Source: Midstream company investor presentations and other public sources
2.3.3. Natural Gas Liquids Take Away Capacity Another important midstream activity occurs downstream of the cryogenic or fractionation
activities. In addition to transporting natural gas, interstate pipeline companies also have lines
dedicated to NGLs and oil. These lines can carry undifferentiated NGLs or carry pure product.
Unlike natural gas, NGLs have alternative take away transportation strategies available: truck,
rail and barge. Ethane, however, is the exception to this: pure product ethane normally
requires a pipeline for take away.
There are four pipelines located within three major pipeline systems with natural gas liquid take
away capacity. The first system is the ATEX pipeline, owned by Enterprise Products Partners,
which has the ability to transport 125 mbbl/d of ethane to the American Gulf Coast. The ATEX
line can be expanded to 265 mbbl/d.68 The second system, owned by Sunoco, includes the
Mariner East and West lines. The Mariner East 1 pipeline (East Coast) has a 70 mbbl/d ethane
and propane capacity, and an additional 275 mbbl/d of propane, butane, and ethane capacity is
planned for Mariner East 2. The pipeline, scheduled to come online in 2016, will be primarily
68 “Citi MLP/ Midstream Infrastructure Conference” Enterprise Products Partners 8/20/14. http://phx.corporate-ir.net/phoenix.zhtml?c=80547&p=irol-presentations2014
Mapping the Opportunities for Shale Development in Ohio
Center for Economic Development, Cleveland State University Page 48
used for propane transportation.69 The Mariner West line (Sarnia, Ontario) has a 50 mbbl/d
ethane capacity.70 Additional expansion is planned for the west to Sarnia through the proposed
Kinder Morgan Utopia line (50 mbbl/d ethane and propane capacity, expandable to 75 mbbl/d)
in 2018.71
Another pipeline operated by Enterprise Products Partners, TEPPCO, runs from the Gulf Coast to
the northeastern United States. This line has the ability to ship propane and refined products
northward, as well as from the Utica/Marcellus region.72 Adjusting for seasonal differences, the
TEPPCO system has a design capacity of 60 mbbl/d.73
In addition to this, there is around 200 mbbl/d railroad take-away capacity.74 However railroad
capacity, as is the case for trucking capacity, is principally limited to those NGLs that are easy to
transport in a liquid state, such as propane. Ethane is normally not transported as a liquid.
There is also a robust local demand for propane, which is a popular fuel used for residential
heating, as well as a feedstock for the petrochemical industry. As of 2014, most produced
propane from the Utica/Marcellus region was consumed locally. Local propane demand in the
Appalachian basin is around 100 mbbl/d.75
New natural gas liquid pipelines have been under consideration since the Utica began to show
prolific wet gas production. The Mariner East 2 pipeline is projected to provide additional NGL
capacity by 2016.76 One system that was contemplated, but has been since suspended, was the
William’s Bluegrass NGL pipeline, which was to have around 200 mbbl/d capacity.77 Kinder
Morgan, however, plans to build a batched system pipeline, (the Utica-Marcellus Texas Pipeline)
to transport propane, butane, natural gasoline, y-grade, and condensate with an initial capacity
of 150 mbbl/d.78 The project will convert 964 miles of Kinder Morgan’s Tennessee Gas Pipeline
for NGL service, in addition to the construction of 200 miles of new pipeline along the Gulf Coast
69 “About Sunoco Logistics and the Mariner East Project” Sunoco Logistics 11/14. http://sxlpipelineprojects.com/wp-content/uploads/2014/11/SXL_Frequently_Asked_Questions.pdf 70 “Citi MLP/ Midstream Infrastructure Conference” Sunoco Logistics Partners L.P. 8/20/14. http://www.sunocologistics.com/SiteData/docs/August2014/b68372a93583dc3e/August%202014%20Investor%20Presentation%20-%20v3.pdf 71 “Kinder Morgan Announces Binding Open Season for Ethane/Propane Movements Out of the Utica Shale” Kinder Morgan 9/4/14. http://www.kindermorgan.com/content/docs/UtopiaPress_Release.pdf 72 “Enterprise increasing TEPPCO propane shipments following US FERC order” Platts 2/10/14. http://www.platts.com/latest-news/oil/houston/enterprise-increasing-teppco-propane-shipments-21198473 73 “Northeast Propane Infrastructure, Supply Shortages & High Cost to Consumers” Crestwood 4/15. http://energy.gov/sites/prod/files/2014/04/f15/Remarksof_AndyRonald_Crestwood_ppt_April21_0.pdf 74 “Credit Suisse 2014 Energy Summit” Williams 2/11/14. http://www.energy.williams.com/Profiles/Investor/Investor.asp?BzID=630&from=du&ID=64367&myID=13611&L=I&Validate=3&I= 75 Id. 76 “Citi MLP/ Midstream Infrastructure Conference” Sunoco Logistics Partners L.P. 8/20/14. 77 “From Importer to Exporter” Blue Racer 1/30/14. 78 “Kinder Morgan Energy Partners- Targa Resources Partners to Expand Fractionation Capacity in Texas to Support the Utica Marcellus Texas NGL Pipeline” Kinder Morgan 12/20/13. http://www.kindermorgan.com/content/docs/KMP_Targa_Ext_Open_Season.pdf
Mapping the Opportunities for Shale Development in Ohio
Center for Economic Development, Cleveland State University Page 49
and 120 miles of new laterals. The Utica Marcellus Texas Pipeline will have a maximum capacity
of 430 mbbl/d and will be in service by the end of 2018.79
Total liquids projected for 2020 from the combined Marcellus and Utica formations is around
1,400 mbbl/d.80 Including the railroad capacity (which won’t work well for ethane), 2014
capacity was around 605 mbbl/d. Assuming the Enterprise Products Kinder Morgan, and Sunoco
expansions occur, take away capacity plus local usage for the basin could reach 1,525 mbbl/d.
This suggests that the total NGL production from the Utica and Marcellus will be comparable to
the total NGL take away capacity plus local demand in 2020.
For ethane, however, there may be no local demand and there may be limitations in take away
capacity. Projected take-away pipeline capacity for ethane in the region for 2020 will range
between 315 and 735 mbbl/d, depending upon how Mariner East and Utopia allocate capacity
for ethane. A best guess capacity is about 460 mbbl/d, based upon the assumption that the
Mariner East 2 pipeline will be primarily used for propane.81 This will be sufficient for industry
projections for the Utica, which is 247.2 mbbl/d. However industry projections call for another
391.2 mbbl/d by 2020 from the Marcellus wet gas window. Based upon industry projections for
wet gas production, a local market for ethane will be required by 2020 to take up product that
cannot be shipped out of the region. The alternative will be significant ethane rejection in the
Utica and Marcellus wet gas windows.
79 “Kinder Morgan Announces Binding Open Season for Utica Marcellus Texas Pipeline” Business Wire 6/17/15. http://www.businesswire.com/news/home/20150617005877/en/Kinder-Morgan-Announces-Binding-Open-Season-Utica#.VYlcFhDzi1g 80 “Credit Suisse 2014 Energy Summit” Williams 2/11/14. 81 This figure does not include the Mariner East 2 pipeline (with 275 mbbl/d of propane, ethane, and butane capacity) because the pipeline will primarily be used for propane transportation (see Sunoco Logistics, footnote 69). However, this figure does include the Mariner East 1 and Utopia pipelines with a combined 145 mbbl/d of ethane and propane capacity. Because of this, ethane take away capacity for the Utica and Marcellus could theoretically range from 315 mbbl/d (if no Mariner East 1, Mariner East 2, and Utopia capacity is dedicated for ethane) to 735 mbbl/d (if all Mariner East 1, Mariner East 2, and Utopia capacity is dedicated for ethane).

Mapping the Opportunities for Shale Development in Ohio
Center for Economic Development, Cleveland State University Page 50
Table 8. Utica NGL Take Away Capacity, June 2015 (Including Selected Utica/ Marcellus NGL Take Away Capacity)
Pipeline Company Type Existing 2014 (mbbl/d)
Projected (mbbl/d)
ATEX Enterprise Products
Ethane 125 265
Mariner East Sunoco Ethane and Propane
70 after completion
of Mariner East 1 in 2015
345*
Mariner West Sunoco Ethane 50 50
Utopia Kinder Morgan Ethane and Propane
0 75
Ethane Total 245 460
TEPPCO Enterprise Products
Propane 60 0
Utica Marcellus Texas
Kinder Morgan Y-grade 0 430
Total 305 1,225
Grand Total 605 including local
demand and rail capacity
1,525 including local demand
and rail capacity
* The Mariner East 2 pipeline will have a capacity of 275 mbbl/d of mixed NGLs, including propane,
ethane, and butane. Because of this, its capacity is not included in the “Ethane Total” figure, but is
included in the “Grand Total” figure.
2.3.4. Regional Production Compared to Regional Processing and Take Away
Capacity
Because natural gas processing and take away facilities do not necessarily differentiate between
the shale plays where their gas is sourced from, it is important to note processing and take away
capacity in a regional context. It is very likely that facilities in the region will process and take
away gas from both the Utica and Marcellus plays. It is also important to compare regional
production to regional processing and take away capacity. When the processing capacity of the
facilities in Pennsylvania and West Virginia are added to those in Ohio as of April 2015, total
capacities become 8,898 mmcf/d for cryogenic processing, 338.5 mbbl/d for C3+ fractionation,
181 mbbl/d for C2+ fractionation, and 174 mbbl/d for de-ethanization. By 2020, these regional
processing capacity totals are projected to increase to 11,998 mmcf/d for cryogenic processing,
447 mbbl/d for C3+ fractionation, 261 mbbl/d for C2+ fractionation, and 284 mbbl/d for de-
ethanization. These amounts are broken down by company in Table 9 and Table 10.
By 2020, the industry projects that total ethane production for the Utica and Marcellus will be
638.4 mbbl/d (assuming 20% rejection). In order to calculate regional ethane processing, de-
ethanization (C2 fractionation) capacity must be added to the amount of C2+ fractionation
capacity that is designated for ethane-specific processing. To calculate this C2+ value, an
industry rule of thumb is used: one third of C2+ fractionation is reserved for ethane processing
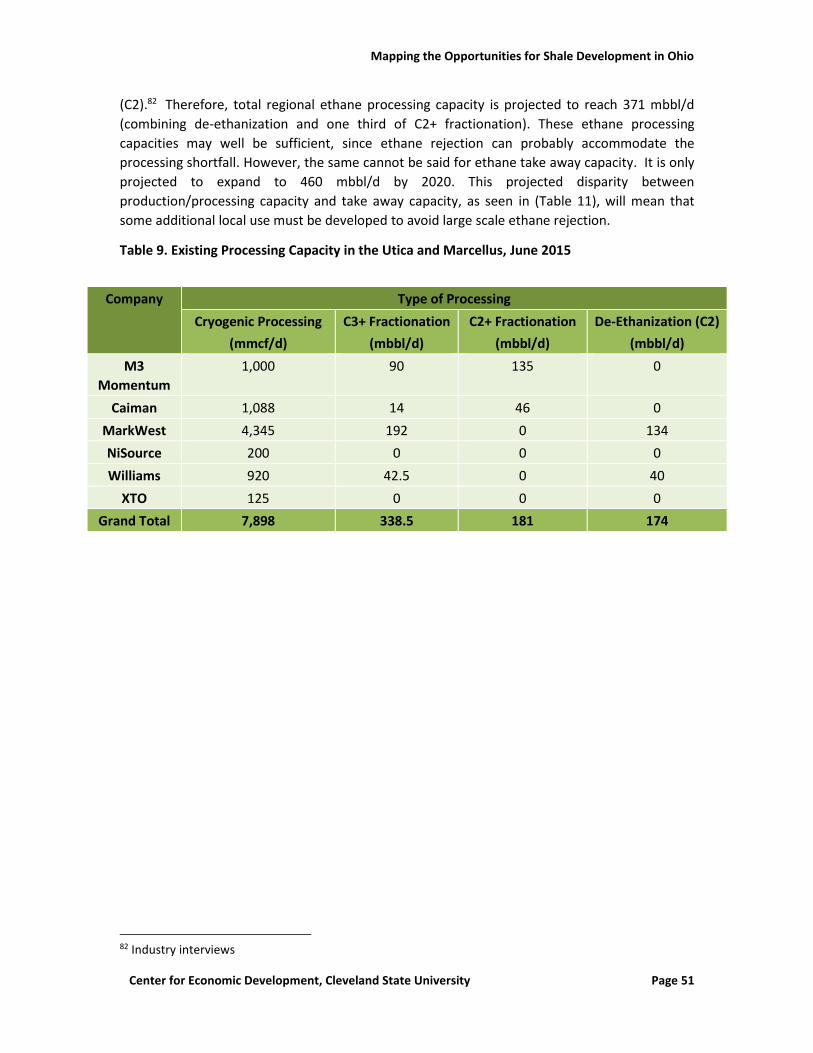
Mapping the Opportunities for Shale Development in Ohio
Center for Economic Development, Cleveland State University Page 51
(C2).82 Therefore, total regional ethane processing capacity is projected to reach 371 mbbl/d
(combining de-ethanization and one third of C2+ fractionation). These ethane processing
capacities may well be sufficient, since ethane rejection can probably accommodate the
processing shortfall. However, the same cannot be said for ethane take away capacity. It is only
projected to expand to 460 mbbl/d by 2020. This projected disparity between
production/processing capacity and take away capacity, as seen in (Table 11), will mean that
some additional local use must be developed to avoid large scale ethane rejection.
Table 9. Existing Processing Capacity in the Utica and Marcellus, June 2015
82 Industry interviews
Company Type of Processing
Cryogenic Processing
(mmcf/d)
C3+ Fractionation
(mbbl/d)
C2+ Fractionation
(mbbl/d)
De-Ethanization (C2)
(mbbl/d)
M3
Momentum
1,000 90 135 0
Caiman 1,088 14 46 0
MarkWest 4,345 192 0 134
NiSource 200 0 0 0
Williams 920 42.5 0 40
XTO 125 0 0 0
Grand Total 7,898 338.5 181 174
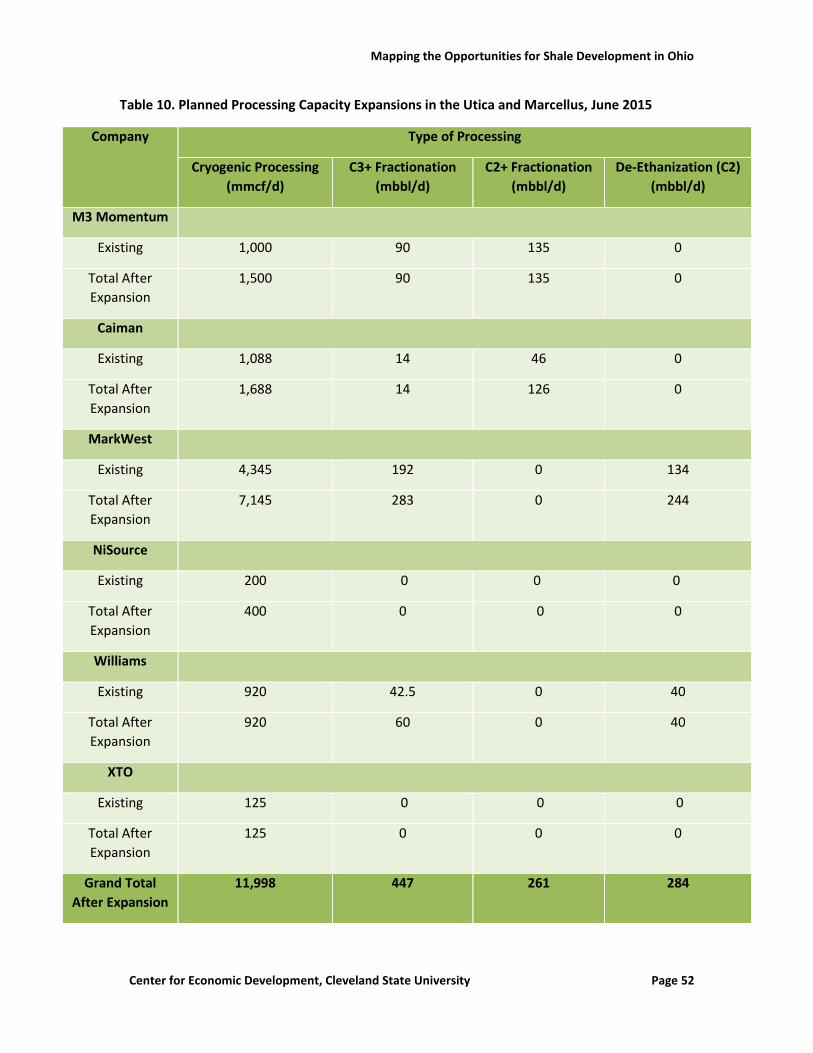
Mapping the Opportunities for Shale Development in Ohio
Center for Economic Development, Cleveland State University Page 52
Table 10. Planned Processing Capacity Expansions in the Utica and Marcellus, June 2015
Company Type of Processing
Cryogenic Processing
(mmcf/d)
C3+ Fractionation
(mbbl/d)
C2+ Fractionation
(mbbl/d)
De-Ethanization (C2)
(mbbl/d)
M3 Momentum
Existing 1,000 90 135 0
Total After
Expansion
1,500 90 135 0
Caiman
Existing 1,088 14 46 0
Total After
Expansion
1,688 14 126 0
MarkWest
Existing 4,345 192 0 134
Total After
Expansion
7,145 283 0 244
NiSource
Existing 200 0 0 0
Total After
Expansion
400 0 0 0
Williams
Existing 920 42.5 0 40
Total After
Expansion
920 60 0 40
XTO
Existing 125 0 0 0
Total After
Expansion
125 0 0 0
Grand Total
After Expansion
11,998 447 261 284

Mapping the Opportunities for Shale Development in Ohio
Center for Economic Development, Cleveland State University Page 53
Table 11. Utica and Marcellus Projected Production Compared to Fractionation Capacity, 2020
Total NGL Volume Ethane (mbbl/d)
Industry Projected Production –
wet gas
9.3 bcf/d (3.6 Utica + 5.7
Marcellus) (1)
638 (2)
Industry Projected Processing
Capacity
12 bcf/d 371 (3)
Industry Projected NGL Take
Away Capacity, plus local use
1,525 mbbl/d 460 (4)
(1) Blue Racer Investor Presentation – Fall 2014; Williams projects 1,400 mbbl/d (2) Assumes 60% ethane, 6 gal/mcf, 42 gal/bbl, and 20% rejection (3) One third of C2+ fractionation (87 mbbl/d) plus de-ethanization (C2) (284 mbbl/d) (4) The Mariner East 1 and Utopia pipelines are dedicated to ethane and propane, with
capacities of 70 and 75 mbbl/d, respectively. The Mariner East 2 pipeline expansion is projected to be 275 mbbl/d, however most of this pipeline’s capacity is anticipated to be used for propane. Accordingly, all 145 mbbl/d of the propane/ethane capacity is used to make this number, but none of the 275 mbbl/d. The range of possible ethane capacity is between 315 and 735 mbbl/d.
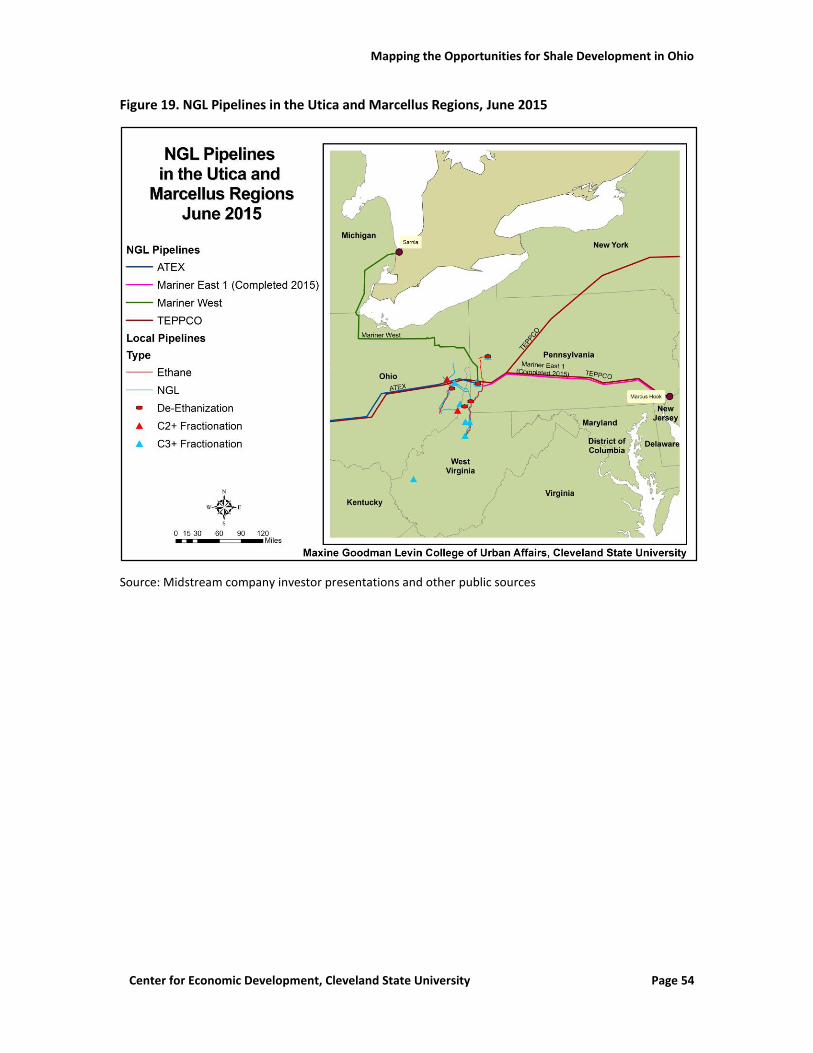
Mapping the Opportunities for Shale Development in Ohio
Center for Economic Development, Cleveland State University Page 54
Figure 19. NGL Pipelines in the Utica and Marcellus Regions, June 2015
Source: Midstream company investor presentations and other public sources

Mapping the Opportunities for Shale Development in Ohio
Center for Economic Development, Cleveland State University Page 55
Figure 20. Proposed NGL Pipelines in the Utica and Marcellus Regions, June 2015
Source: Midstream company investor presentations and other public sources

Mapping the Opportunities for Shale Development in Ohio
Center for Economic Development, Cleveland State University Page 56
Figure 21. NGL Pipelines by Type in the Utica and Marcellus Regions, June 2015
Source: Midstream company investor presentations and other public sources

Mapping the Opportunities for Shale Development in Ohio
Center for Economic Development, Cleveland State University Page 57
2.3.5. Natural Gas Take Away Capacity By 2013, the Appalachian basin, including Ohio, Pennsylvania, and West Virginia, had become a
major exporter of natural gas. According to the United States Energy Information
Administration (EIA), the natural gas outflow (i.e. “take away”) capacity from those three states
to areas outside the region was slightly less than the inflow capacity from outside the region.
The outflow capacity from the three states totaled 34.57 bcf/d in 2013, with 19.37 bcf/d
traveling outside the region and 15.2 bcf/d transferring within the region. The inflow capacity
from outside of the region totaled 20.25 bcf/d in 2013.83
Table 12. Outflow Capacity from Ohio, Pennsylvania, and West Virginia, 2013
State To Outside Region (bcf/d) Within Region (bcf/d) Total Outflow
Capacity (bcf/d)
Ohio 2.58 5.5 8.08
Pennsylvania 14.55 2.2 16.75
West Virginia 2.24 7.5 9.74
Total 19.37 15.2 34.57
Source: EIA, 2013
As of October 2014, there were several key interstate natural gas projects involving new
pipeline construction scheduled to come online by 2020. EQT, a midstream company, has begun
a joint venture with NextEra Energy and will construct the Mountain Valley Pipeline. This
pipeline, which is scheduled for completion in 2018, will run from Mobley, West Virginia to
south central Virginia, and have a capacity of 2 bcf/d.84 Another project by EQT, the Ohio Valley
Connector, will link Marion County, West Virginia to Monroe County, Ohio. This project has a
capacity of 1 bcf/d and a projected startup of 2016.85
Spectra Energy also has two projects planned in the region: NEXUS and OPEN. The NEXUS
pipeline will run for 250 miles between Kensington, Ohio and southeastern Michigan, where it
will interconnect with other natural gas pipelines for transport further north, west, and east into
Canada. It will have a capacity that is scalable to 2 bcf/d86 and is projected to come online in
2017. The OPEN (Ohio Pipeline Energy Network) project will run for 76 miles across eastern Ohio
83 “U.S. State-to-State Capacity” U.S. Energy Information Administration 1/16/14. http://www.eia.gov/pub/oil_gas/natural_gas/analysis_publications/ngpipeline/StatetoState.xls 84 “EQT Analyst Presentation” EQT 10/14. http://ir.eqt.com/sites/eqt.investorhq.businesswire.com/files/doc_library/file/EQT_Analyst_Presentation_October_final.pdf 85 “EQT Midstream: 2 Major Pipeline Projects Advance, 1 Doesn’t” Marcellus Drilling News 7/25/14. http://marcellusdrilling.com/2014/07/eqt-midstream-2-major-pipeline-projects-advance-1-doesnt/ 86 “NEXUS Gas Transmission” Spectra Energy 2014. http://www.spectraenergy.com/Operations/New-Projects-and-Our-Process/New-Projects-in-US/NEXUS-Gas-Transmission/
Mapping the Opportunities for Shale Development in Ohio
Center for Economic Development, Cleveland State University Page 58
from Kensington to Clarington, providing access to points in the southern United States. This
pipeline will have a capacity of 0.55 bcf/d and is scheduled for a 2015 startup.87
TransCanada, through its ANR pipeline network, is planning to construct a 320 mile, 2 bcf/d
natural gas pipeline from Cadiz, Ohio to ANR’s Joliet Hub. Adopting a strategy comparable to
Spectra for its NEXUS pipeline, the proposed ANR East Pipeline will take gas from receipt points
in eastern Ohio and deliver it to points further west and south via the greater ANR Pipeline
network. Depending on interest in the project, the pipeline may be extended southeast to
Clarington, Ohio.88 The ANR East Pipeline is scheduled for completion in 2017.89
Dominion is planning to construct the 550 mile Atlantic Coast Pipeline, traversing a route from
north central West Virginia to southeastern North Carolina, with a lateral to the Hampton Roads
region of Virginia. This project, set for completion in 2018, will have a capacity of 1.5 bcf/d,
which is expandable to 2 bcf/d.90
Energy Transfer created the ET Rover Pipeline LLC in order to build the Rover Pipeline between
the Utica region and Midwest market interconnects in Defiance, Ohio. The pipeline will also
continue on to points in southern Ontario, Canada. The Rover pipeline will be built with a
capacity of 3.25 bcf/d and will begin service in 2017.91
The Columbia Pipeline Group, affiliated with NiSource, plans to construct the Leach Xpress, a
160 mile pipeline running from northern West Virginia to central and southern Ohio. This
pipeline will allow for 1.5 bcf/d of new capacity and will have connections to the greater
Columbia Pipeline network.92 The Leach Xpress project will coincide with Columbia’s Rayne
Xpress project which will involve the addition of 1 bcf/d of capacity on its CGT mainline,
connecting to points along the Gulf Coast. Both are scheduled for completion in 2017.93
Williams is planning to construct the 400 mile Western Marcellus Pipeline from its Ohio Valley
Midstream processing and gathering network in northern West Virginia to its Transco mainline
in Virginia. The Western Marcellus Pipeline will be able to distribute up to 2 bcf/d of natural gas
87 “Supplemental Information Appendix” Spectra Energy 11/5/14. http://investors.spectraenergy.com/phoenix.zhtml?c=204494&p=irol-calendarPast 88 “TransCanada ANR East Pipeline Project” TransCanada 7/4/14. https://www.anrpl.com/documents/CMA/WhatsNew/ANR%20East%20Pipeline%20Project_Brochure.pdf 89 “Several pipeline projects are underway” U.S. Energy Information Administration 10/24/14.
http://www.google.com/url?sa=t&rct=j&q=&esrc=s&source=web&cd=1&ved=0CB4QFjAA&url=http%3A%2F%2Fwww.eia.gov%2Ftodayinenergy%2Fimages%2F2014.10.15%2FEIA%2520pipeline%2520table.xls&ei=pp2ZVPu7H8GbyATNl4GgAw&usg=AFQjCNEBBynoiVzF4eoSAYEkWRavFLS-CA&sig2=eeG-gD1Y897MkCNPz-cGEw&bvm=bv.82001339,d.aWw 90 “Barclays Capital CEO Energy-Power Conference” Dominion 9/3/14. http://investors.dom.com/phoenix.zhtml?c=110481&p=irol-EventDetails&EventId=5168270 91 “ET Rover Pipeline LLC” Energy Transfer 2014. http://www.energytransfer.com/ops_etrover.aspx 92 “Leach Xpress Project” Columbia Pipeline Group 2014. https://www.columbiapipelinegroup.com/current-projects/leach-xpress-project 93 “Several pipeline projects are underway” U.S. Energy Information Administration 10/24/14.
Mapping the Opportunities for Shale Development in Ohio
Center for Economic Development, Cleveland State University Page 59
from the Utica and western Marcellus region to the north and the south via the Transco
mainline by the end of 2018.94
In addition to the new natural gas pipelines being constructed, several existing interstate lines
are being enhanced so as to allow for bi-directional flow by 2020. The majority of these
pipelines run between the Utica region and the Gulf Coast, with the exception being Tallgrass
Energy’s Rockies Express Pipeline (REX). Projects along TransCanada’s ANR Southeast Mainline,
Kinder Morgan’s Tennessee Gas Pipeline, Boardwalk’s Texas Gas Pipeline network, and Spectra’s
Texas Eastern Pipeline network will add 3.93 bcf/d of natural gas take away capacity from the
Utica to points along the Gulf of Mexico. Bi-directional projects along Tallgrass’ REX Pipeline will
add 4.2 bcf/d of take away capacity to points further west.95
Existing natural gas interstate pipelines will also see new capacity additions come online by
2020. Columbia Pipeline Group will add up to 2.44 bcf/d of capacity to its pipeline network in
West Virginia to better move gas produced in eastern Ohio, northern West Virginia, and western
Pennsylvania. Spectra Energy is planning to add 1.8 bcf/d to its Texas Eastern Pipeline system, 1
bcf/d of which heading northeast and 0.8 bcf/d heading south. Kinder Morgan will add 0.73
bcf/d to its Gulf Coast Mainline while enhancing connections with the REX. Columbia Pipeline
Group and Dominion will add a total of 0.73 bcf/d to their respective pipeline networks through
upgrading interconnects with interstate pipelines in Ohio.96
According to the U.S. Department of Energy, natural gas interstate pipeline infrastructure
projects across the United States are projected to total $42 billion in capital expenditures
between 2015 and 2030. Between 2015 and 2020, capital expenditures for these projects are
predicted to roughly total $15 billion. Interstate pipeline projects within the Marcellus alone will
be $10.5 billion of the $42 billion in expenditures between 2015 and 2030, projected to have the
largest activity of any region in the country.97
94Zeits, Richard. “Natural Gas: Marcellus Pipeline Boom Sets Stage for A 30 bcf A Day Tsunami,” Zeits
Energy Analytics 10/10/14. http://seekingalpha.com/article/2554655-natural-gas-marcellus-pipeline-
boom-sets-stage-for-a-30-bcf-a-day-tsunami?page=2 95 “Several pipeline projects are underway” U.S. Energy Information Administration 10/24/14. 96 “Several pipeline projects are underway” U.S. Energy Information Administration 10/24/14. 97 “Natural Gas Infrastructure Implications of Increased Demand from the Electric Power Sector” U.S. Department of Energy 2/15, pp.27-28. http://energy.gov/sites/prod/files/2015/02/f19/dOE%20Report%20Natural%20Gas%20Infrastructure%20V_02-02.pdf
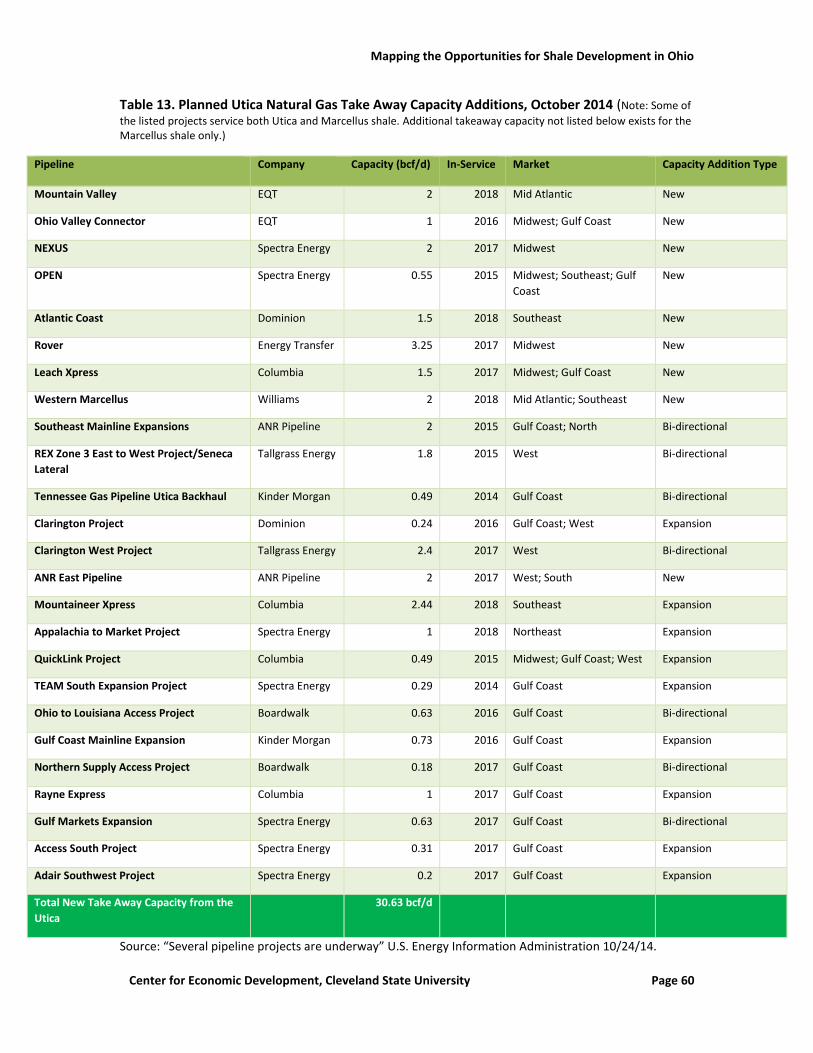
Mapping the Opportunities for Shale Development in Ohio
Center for Economic Development, Cleveland State University Page 60
Table 13. Planned Utica Natural Gas Take Away Capacity Additions, October 2014 (Note: Some of
the listed projects service both Utica and Marcellus shale. Additional takeaway capacity not listed below exists for the Marcellus shale only.)
Pipeline Company Capacity (bcf/d) In-Service Market Capacity Addition Type
Mountain Valley EQT 2 2018 Mid Atlantic New
Ohio Valley Connector EQT 1 2016 Midwest; Gulf Coast New
NEXUS Spectra Energy 2 2017 Midwest New
OPEN Spectra Energy 0.55 2015 Midwest; Southeast; Gulf
Coast
New
Atlantic Coast Dominion 1.5 2018 Southeast New
Rover Energy Transfer 3.25 2017 Midwest New
Leach Xpress Columbia 1.5 2017 Midwest; Gulf Coast New
Western Marcellus Williams 2 2018 Mid Atlantic; Southeast New
Southeast Mainline Expansions ANR Pipeline 2 2015 Gulf Coast; North Bi-directional
REX Zone 3 East to West Project/Seneca
Lateral
Tallgrass Energy 1.8 2015 West Bi-directional
Tennessee Gas Pipeline Utica Backhaul Kinder Morgan 0.49 2014 Gulf Coast Bi-directional
Clarington Project Dominion 0.24 2016 Gulf Coast; West Expansion
Clarington West Project Tallgrass Energy 2.4 2017 West Bi-directional
ANR East Pipeline ANR Pipeline 2 2017 West; South New
Mountaineer Xpress Columbia 2.44 2018 Southeast Expansion
Appalachia to Market Project Spectra Energy 1 2018 Northeast Expansion
QuickLink Project Columbia 0.49 2015 Midwest; Gulf Coast; West Expansion
TEAM South Expansion Project Spectra Energy 0.29 2014 Gulf Coast Expansion
Ohio to Louisiana Access Project Boardwalk 0.63 2016 Gulf Coast Bi-directional
Gulf Coast Mainline Expansion Kinder Morgan 0.73 2016 Gulf Coast Expansion
Northern Supply Access Project Boardwalk 0.18 2017 Gulf Coast Bi-directional
Rayne Express Columbia 1 2017 Gulf Coast Expansion
Gulf Markets Expansion Spectra Energy 0.63 2017 Gulf Coast Bi-directional
Access South Project Spectra Energy 0.31 2017 Gulf Coast Expansion
Adair Southwest Project Spectra Energy 0.2 2017 Gulf Coast Expansion
Total New Take Away Capacity from the
Utica
30.63 bcf/d
Source: “Several pipeline projects are underway” U.S. Energy Information Administration 10/24/14.
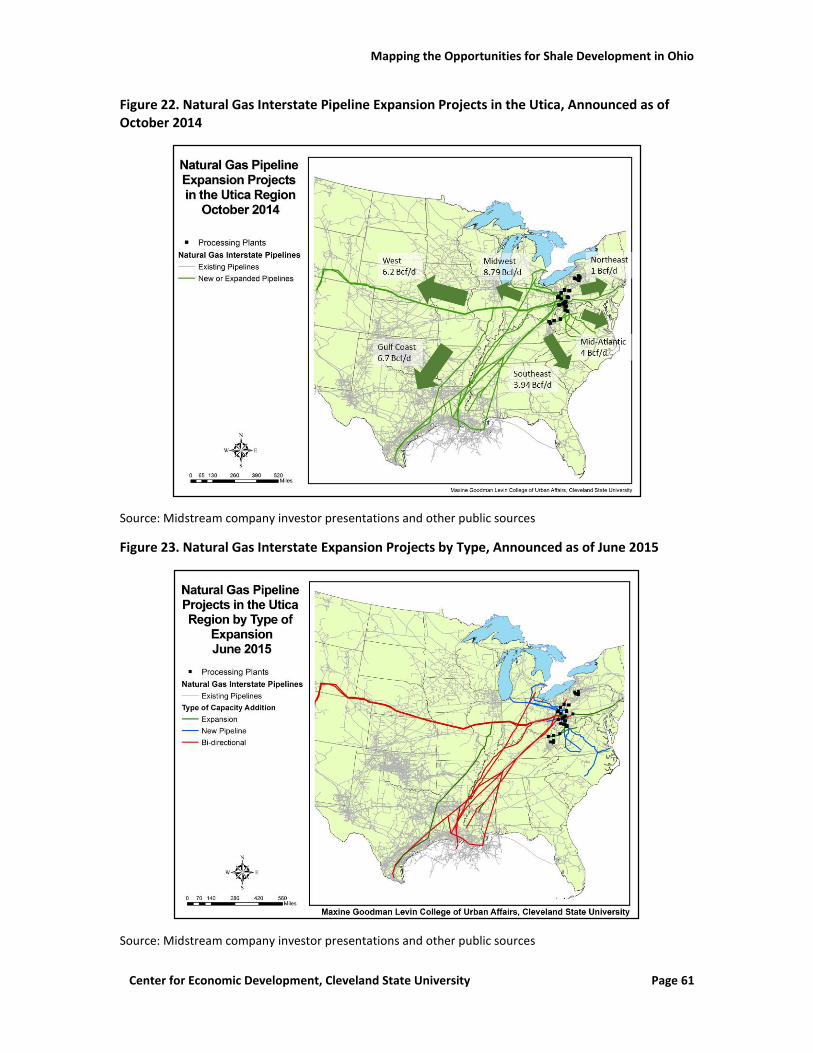
Mapping the Opportunities for Shale Development in Ohio
Center for Economic Development, Cleveland State University Page 61
Figure 22. Natural Gas Interstate Pipeline Expansion Projects in the Utica, Announced as of October 2014
Source: Midstream company investor presentations and other public sources
Figure 23. Natural Gas Interstate Expansion Projects by Type, Announced as of June 2015
Source: Midstream company investor presentations and other public sources
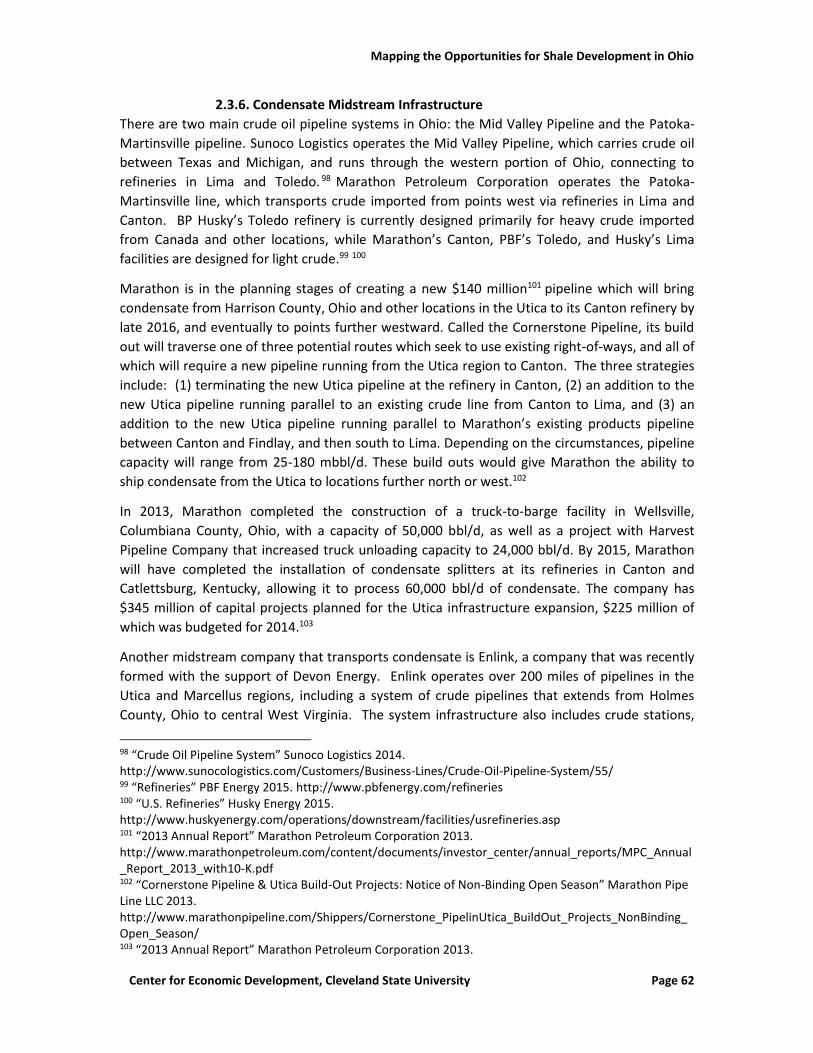
Mapping the Opportunities for Shale Development in Ohio
Center for Economic Development, Cleveland State University Page 62
2.3.6. Condensate Midstream Infrastructure There are two main crude oil pipeline systems in Ohio: the Mid Valley Pipeline and the Patoka-
Martinsville pipeline. Sunoco Logistics operates the Mid Valley Pipeline, which carries crude oil
between Texas and Michigan, and runs through the western portion of Ohio, connecting to
refineries in Lima and Toledo. 98 Marathon Petroleum Corporation operates the Patoka-
Martinsville line, which transports crude imported from points west via refineries in Lima and
Canton. BP Husky’s Toledo refinery is currently designed primarily for heavy crude imported
from Canada and other locations, while Marathon’s Canton, PBF’s Toledo, and Husky’s Lima
facilities are designed for light crude.99 100
Marathon is in the planning stages of creating a new $140 million101 pipeline which will bring
condensate from Harrison County, Ohio and other locations in the Utica to its Canton refinery by
late 2016, and eventually to points further westward. Called the Cornerstone Pipeline, its build
out will traverse one of three potential routes which seek to use existing right-of-ways, and all of
which will require a new pipeline running from the Utica region to Canton. The three strategies
include: (1) terminating the new Utica pipeline at the refinery in Canton, (2) an addition to the
new Utica pipeline running parallel to an existing crude line from Canton to Lima, and (3) an
addition to the new Utica pipeline running parallel to Marathon’s existing products pipeline
between Canton and Findlay, and then south to Lima. Depending on the circumstances, pipeline
capacity will range from 25-180 mbbl/d. These build outs would give Marathon the ability to
ship condensate from the Utica to locations further north or west.102
In 2013, Marathon completed the construction of a truck-to-barge facility in Wellsville,
Columbiana County, Ohio, with a capacity of 50,000 bbl/d, as well as a project with Harvest
Pipeline Company that increased truck unloading capacity to 24,000 bbl/d. By 2015, Marathon
will have completed the installation of condensate splitters at its refineries in Canton and
Catlettsburg, Kentucky, allowing it to process 60,000 bbl/d of condensate. The company has
$345 million of capital projects planned for the Utica infrastructure expansion, $225 million of
which was budgeted for 2014.103
Another midstream company that transports condensate is Enlink, a company that was recently
formed with the support of Devon Energy. Enlink operates over 200 miles of pipelines in the
Utica and Marcellus regions, including a system of crude pipelines that extends from Holmes
County, Ohio to central West Virginia. The system infrastructure also includes crude stations,
98 “Crude Oil Pipeline System” Sunoco Logistics 2014. http://www.sunocologistics.com/Customers/Business-Lines/Crude-Oil-Pipeline-System/55/ 99 “Refineries” PBF Energy 2015. http://www.pbfenergy.com/refineries 100 “U.S. Refineries” Husky Energy 2015. http://www.huskyenergy.com/operations/downstream/facilities/usrefineries.asp 101 “2013 Annual Report” Marathon Petroleum Corporation 2013. http://www.marathonpetroleum.com/content/documents/investor_center/annual_reports/MPC_Annual_Report_2013_with10-K.pdf 102 “Cornerstone Pipeline & Utica Build-Out Projects: Notice of Non-Binding Open Season” Marathon Pipe Line LLC 2013. http://www.marathonpipeline.com/Shippers/Cornerstone_PipelinUtica_BuildOut_Projects_NonBinding_Open_Season/ 103 “2013 Annual Report” Marathon Petroleum Corporation 2013.
Mapping the Opportunities for Shale Development in Ohio
Center for Economic Development, Cleveland State University Page 63
condensate stabilization stations,104 and natural gas compression stations located at points
along the lines.105. Enlink has the capability to ship crude and condensate through its Black Run
rail terminal in Muskingham County, Ohio, and also its Bells Run barge facility along the Ohio
River in Washington County, Ohio. The company also transports crude and condensate via truck.
Enlink is currently in the process of adding a 45 mile condensate pipeline with a capacity of
50,000 bbl/d extending from Guernsey County, Ohio to its existing pipeline in Washington
County. This pipeline will be complemented by the addition of 6 condensate stabilization and
natural gas compression stations, increasing its system capacity to 60,000 bbl/d of condensate
stabilization and 1.2 bcf/d of natural gas compression. These infrastructure improvements are
scheduled to be online by the second half of 2015.106
Blue Racer also operates condensate infrastructure in the Utica region. Gathering lines are
currently being built which will transport condensate to its Berne processing plant, and connect
to its Natrium processing plant along the Ohio River by a 30 mile pipeline. The condensate will
be stabilized at either location, and can be further transported via barge or rail from the
Natrium facility.107
Utica East Ohio Midstream owns and operates condensate stabilization facilities in the Utica.
Utica East Ohio currently has a 6,000 bbl/d condensate stabilizer capacity available at its
Kensington site and is constructing a new 30,000 bbl/d condensate stabilizer at its Harrison Hub
facility. Both facilities are capable of receiving Utica and Marcellus condensate from truck
haulers in the region. Each facility is design to remove the light end NGLs from the condensate
in order to make the product marketable and will provide its customers with options to load the
stabilized condensate onto trucks or rail cars. Utica East Ohio also plans to be able to deliver
into the Marathon Cornerstone pipeline beginning in late 2016.108
MarkWest operates a 23,000 bbl/d condensate stabilization facility near Cadiz, Ohio, from which
Marathon’s Cornerstone Pipeline will originate. The company also has rail infrastructure at its
Hopedale, Houston, Keystone, and Siloam (Kentucky) facilities. MarkWest’s rail operations
include 3 rail terminals, sidings for 835 rail cars, and 108 loading racks.109 MarkWest is in the
process of completing a $15.8 billion merger with MPLX LP, a master limited partnership it
formed with Marathon Petroleum Corporation in 2012. The merger, which is expected to close
by the end of 2015, will combine MarkWest’s gathering and processing operations with MPLX’s
refined products logistics.110
104 Condensate stabilization refers to a process that gives condensate the ability to be transported or used downstream. See “Condensate Stabilization” Frames 2014. http://www.frames-group.com/systems-solutions/lpg-c5-fractionation/condensate-stabilization 105 “Citi One-On-One MLP/ Midstream Infrastructure Conference” Enlink Midstream 8/20/14. http://enlk.enlink.com/files/doc_presentations/2014/Citi-ConferencePresentation-Final-8-20-14.pdf. 106 “Citi One-On-One MLP/ Midstream Infrastructure Conference” Enlink Midstream 8/20/14. 107 “From Importer to Exporter” Blue Racer 1/30/14. 108 Industry interviews 109 “2015 Investor & Analyst Day” MarkWest 6/3/15. http://investor.markwest.com/phoenix.zhtml?c=135034&p=irol-presentations 110 “MPLX, MarkWest to merge in $15.8 billion deal” Oil and Gas Journal 7/13/15.
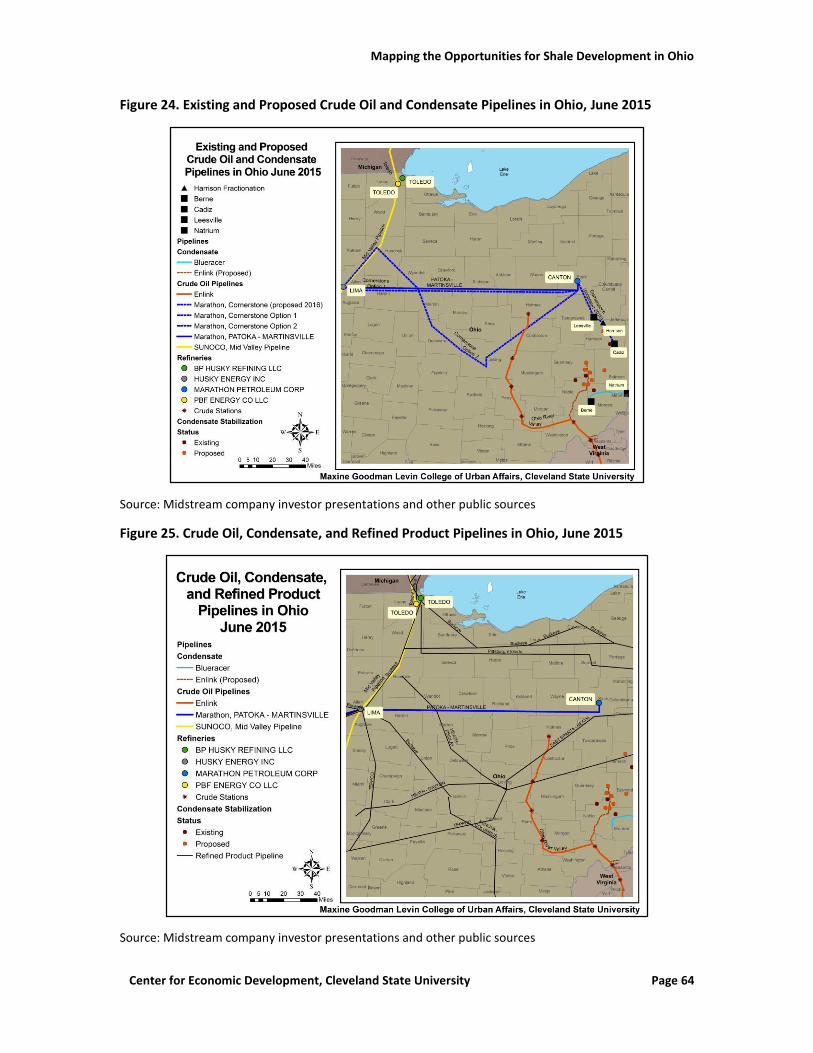
Mapping the Opportunities for Shale Development in Ohio
Center for Economic Development, Cleveland State University Page 64
Figure 24. Existing and Proposed Crude Oil and Condensate Pipelines in Ohio, June 2015
Source: Midstream company investor presentations and other public sources
Figure 25. Crude Oil, Condensate, and Refined Product Pipelines in Ohio, June 2015
Source: Midstream company investor presentations and other public sources
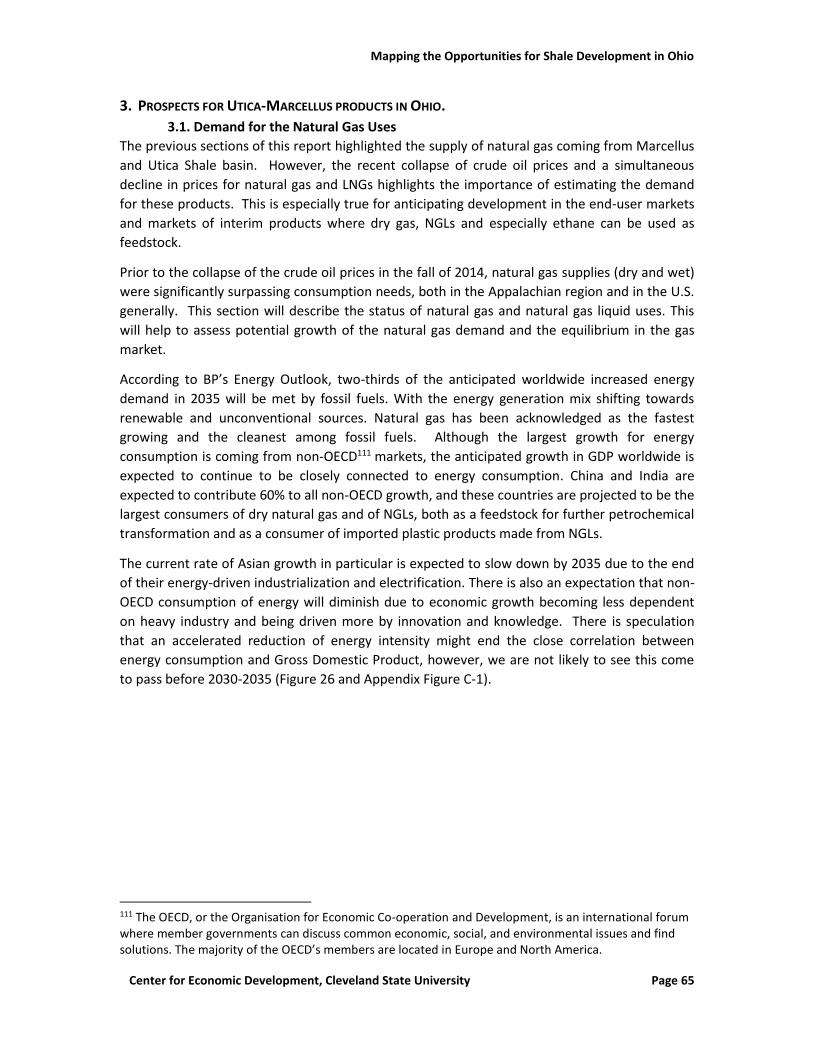
Mapping the Opportunities for Shale Development in Ohio
Center for Economic Development, Cleveland State University Page 65
3. PROSPECTS FOR UTICA-MARCELLUS PRODUCTS IN OHIO.
3.1. Demand for the Natural Gas Uses The previous sections of this report highlighted the supply of natural gas coming from Marcellus
and Utica Shale basin. However, the recent collapse of crude oil prices and a simultaneous
decline in prices for natural gas and LNGs highlights the importance of estimating the demand
for these products. This is especially true for anticipating development in the end-user markets
and markets of interim products where dry gas, NGLs and especially ethane can be used as
feedstock.
Prior to the collapse of the crude oil prices in the fall of 2014, natural gas supplies (dry and wet)
were significantly surpassing consumption needs, both in the Appalachian region and in the U.S.
generally. This section will describe the status of natural gas and natural gas liquid uses. This
will help to assess potential growth of the natural gas demand and the equilibrium in the gas
market.
According to BP’s Energy Outlook, two-thirds of the anticipated worldwide increased energy
demand in 2035 will be met by fossil fuels. With the energy generation mix shifting towards
renewable and unconventional sources. Natural gas has been acknowledged as the fastest
growing and the cleanest among fossil fuels. Although the largest growth for energy
consumption is coming from non-OECD111 markets, the anticipated growth in GDP worldwide is
expected to continue to be closely connected to energy consumption. China and India are
expected to contribute 60% to all non-OECD growth, and these countries are projected to be the
largest consumers of dry natural gas and of NGLs, both as a feedstock for further petrochemical
transformation and as a consumer of imported plastic products made from NGLs.
The current rate of Asian growth in particular is expected to slow down by 2035 due to the end
of their energy-driven industrialization and electrification. There is also an expectation that non-
OECD consumption of energy will diminish due to economic growth becoming less dependent
on heavy industry and being driven more by innovation and knowledge. There is speculation
that an accelerated reduction of energy intensity might end the close correlation between
energy consumption and Gross Domestic Product, however, we are not likely to see this come
to pass before 2030-2035 (Figure 26 and Appendix Figure C-1).
111 The OECD, or the Organisation for Economic Co-operation and Development, is an international forum where member governments can discuss common economic, social, and environmental issues and find solutions. The majority of the OECD’s members are located in Europe and North America.
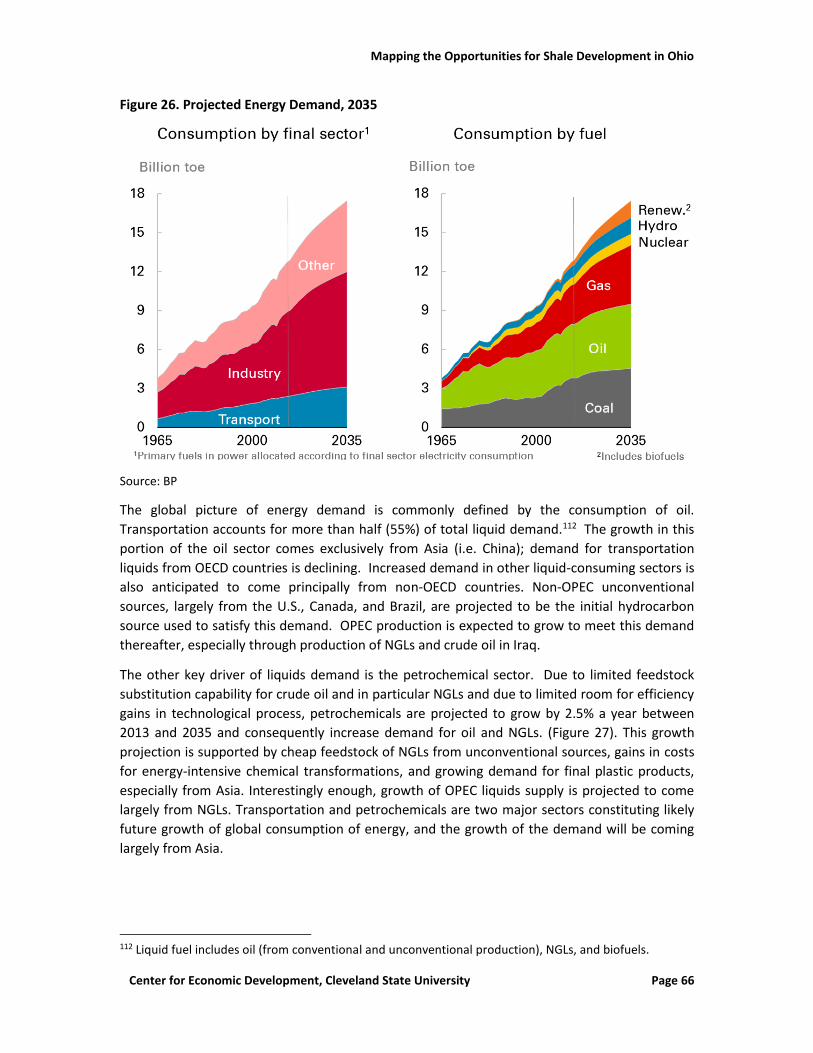
Mapping the Opportunities for Shale Development in Ohio
Center for Economic Development, Cleveland State University Page 66
Figure 26. Projected Energy Demand, 2035
Source: BP
The global picture of energy demand is commonly defined by the consumption of oil.
Transportation accounts for more than half (55%) of total liquid demand.112 The growth in this
portion of the oil sector comes exclusively from Asia (i.e. China); demand for transportation
liquids from OECD countries is declining. Increased demand in other liquid-consuming sectors is
also anticipated to come principally from non-OECD countries. Non-OPEC unconventional
sources, largely from the U.S., Canada, and Brazil, are projected to be the initial hydrocarbon
source used to satisfy this demand. OPEC production is expected to grow to meet this demand
thereafter, especially through production of NGLs and crude oil in Iraq.
The other key driver of liquids demand is the petrochemical sector. Due to limited feedstock
substitution capability for crude oil and in particular NGLs and due to limited room for efficiency
gains in technological process, petrochemicals are projected to grow by 2.5% a year between
2013 and 2035 and consequently increase demand for oil and NGLs. (Figure 27). This growth
projection is supported by cheap feedstock of NGLs from unconventional sources, gains in costs
for energy-intensive chemical transformations, and growing demand for final plastic products,
especially from Asia. Interestingly enough, growth of OPEC liquids supply is projected to come
largely from NGLs. Transportation and petrochemicals are two major sectors constituting likely
future growth of global consumption of energy, and the growth of the demand will be coming
largely from Asia.
112 Liquid fuel includes oil (from conventional and unconventional production), NGLs, and biofuels.
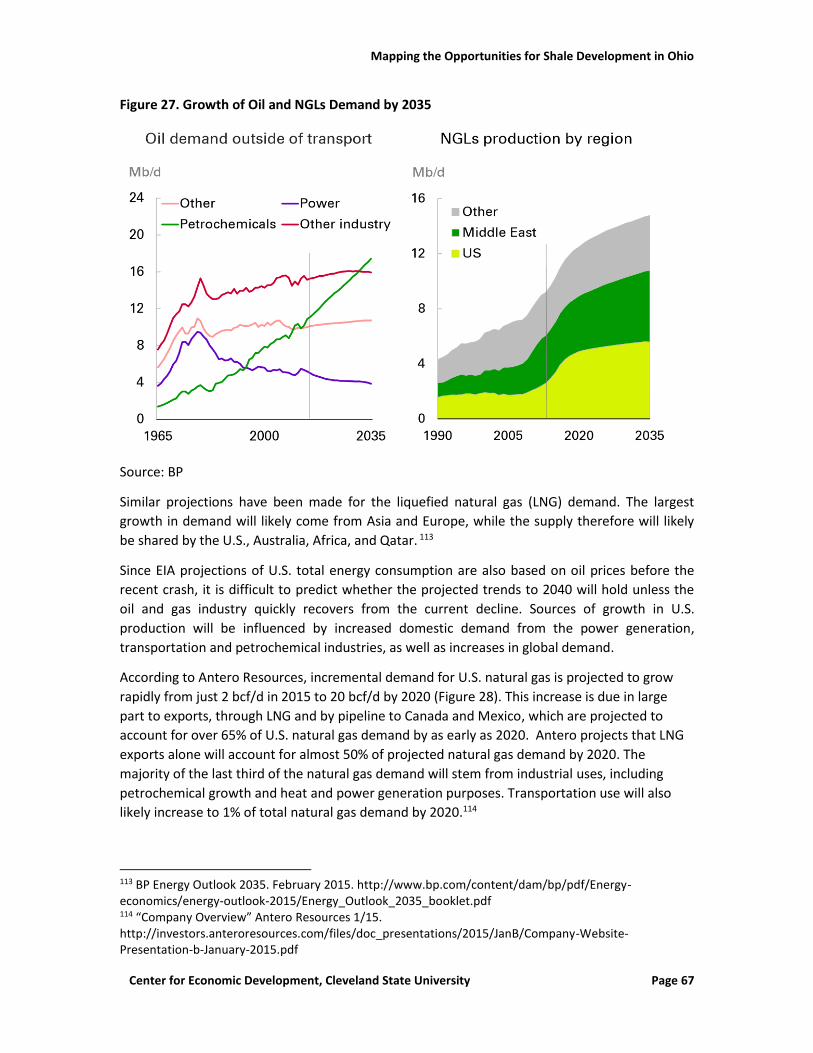
Mapping the Opportunities for Shale Development in Ohio
Center for Economic Development, Cleveland State University Page 67
Figure 27. Growth of Oil and NGLs Demand by 2035
Source: BP
Similar projections have been made for the liquefied natural gas (LNG) demand. The largest
growth in demand will likely come from Asia and Europe, while the supply therefore will likely
be shared by the U.S., Australia, Africa, and Qatar. 113
Since EIA projections of U.S. total energy consumption are also based on oil prices before the
recent crash, it is difficult to predict whether the projected trends to 2040 will hold unless the
oil and gas industry quickly recovers from the current decline. Sources of growth in U.S.
production will be influenced by increased domestic demand from the power generation,
transportation and petrochemical industries, as well as increases in global demand.
According to Antero Resources, incremental demand for U.S. natural gas is projected to grow
rapidly from just 2 bcf/d in 2015 to 20 bcf/d by 2020 (Figure 28). This increase is due in large
part to exports, through LNG and by pipeline to Canada and Mexico, which are projected to
account for over 65% of U.S. natural gas demand by as early as 2020. Antero projects that LNG
exports alone will account for almost 50% of projected natural gas demand by 2020. The
majority of the last third of the natural gas demand will stem from industrial uses, including
petrochemical growth and heat and power generation purposes. Transportation use will also
likely increase to 1% of total natural gas demand by 2020.114
113 BP Energy Outlook 2035. February 2015. http://www.bp.com/content/dam/bp/pdf/Energy-economics/energy-outlook-2015/Energy_Outlook_2035_booklet.pdf 114 “Company Overview” Antero Resources 1/15. http://investors.anteroresources.com/files/doc_presentations/2015/JanB/Company-Website-Presentation-b-January-2015.pdf
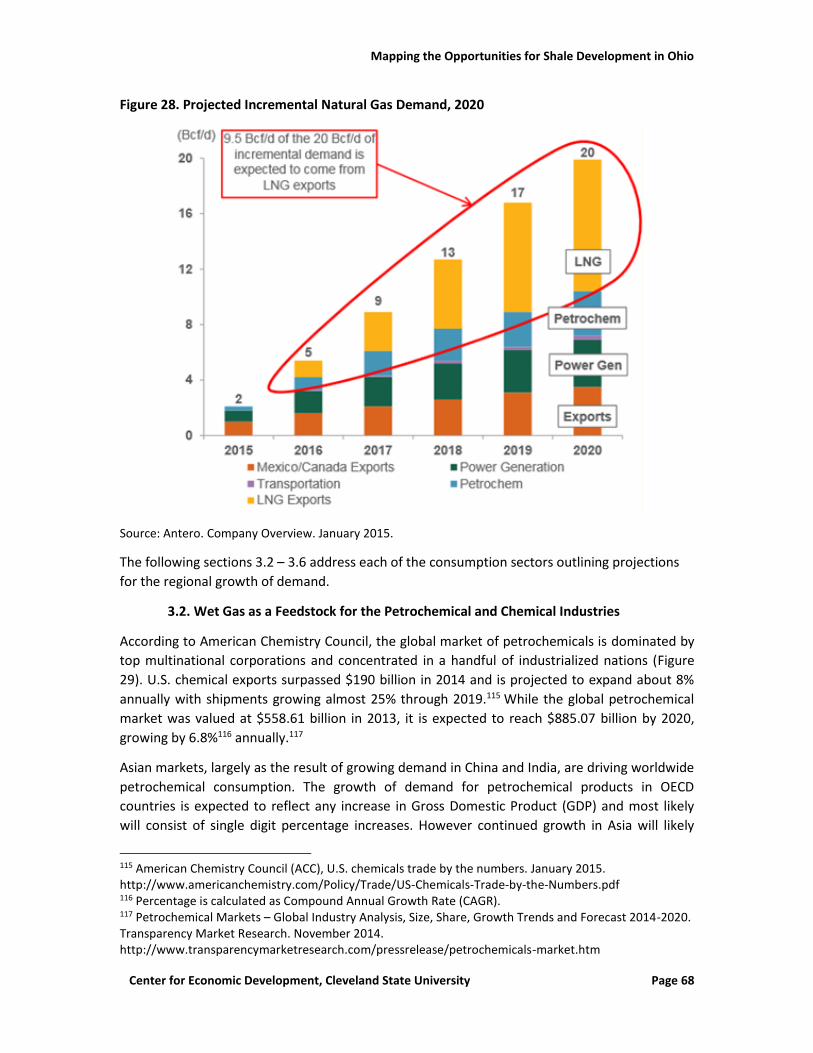
Mapping the Opportunities for Shale Development in Ohio
Center for Economic Development, Cleveland State University Page 68
Figure 28. Projected Incremental Natural Gas Demand, 2020
Source: Antero. Company Overview. January 2015.
The following sections 3.2 – 3.6 address each of the consumption sectors outlining projections
for the regional growth of demand.
3.2. Wet Gas as a Feedstock for the Petrochemical and Chemical Industries
According to American Chemistry Council, the global market of petrochemicals is dominated by
top multinational corporations and concentrated in a handful of industrialized nations (Figure
29). U.S. chemical exports surpassed $190 billion in 2014 and is projected to expand about 8%
annually with shipments growing almost 25% through 2019.115 While the global petrochemical
market was valued at $558.61 billion in 2013, it is expected to reach $885.07 billion by 2020,
growing by 6.8%116 annually.117
Asian markets, largely as the result of growing demand in China and India, are driving worldwide
petrochemical consumption. The growth of demand for petrochemical products in OECD
countries is expected to reflect any increase in Gross Domestic Product (GDP) and most likely
will consist of single digit percentage increases. However continued growth in Asia will likely
115 American Chemistry Council (ACC), U.S. chemicals trade by the numbers. January 2015. http://www.americanchemistry.com/Policy/Trade/US-Chemicals-Trade-by-the-Numbers.pdf 116 Percentage is calculated as Compound Annual Growth Rate (CAGR). 117 Petrochemical Markets – Global Industry Analysis, Size, Share, Growth Trends and Forecast 2014-2020. Transparency Market Research. November 2014. http://www.transparencymarketresearch.com/pressrelease/petrochemicals-market.htm
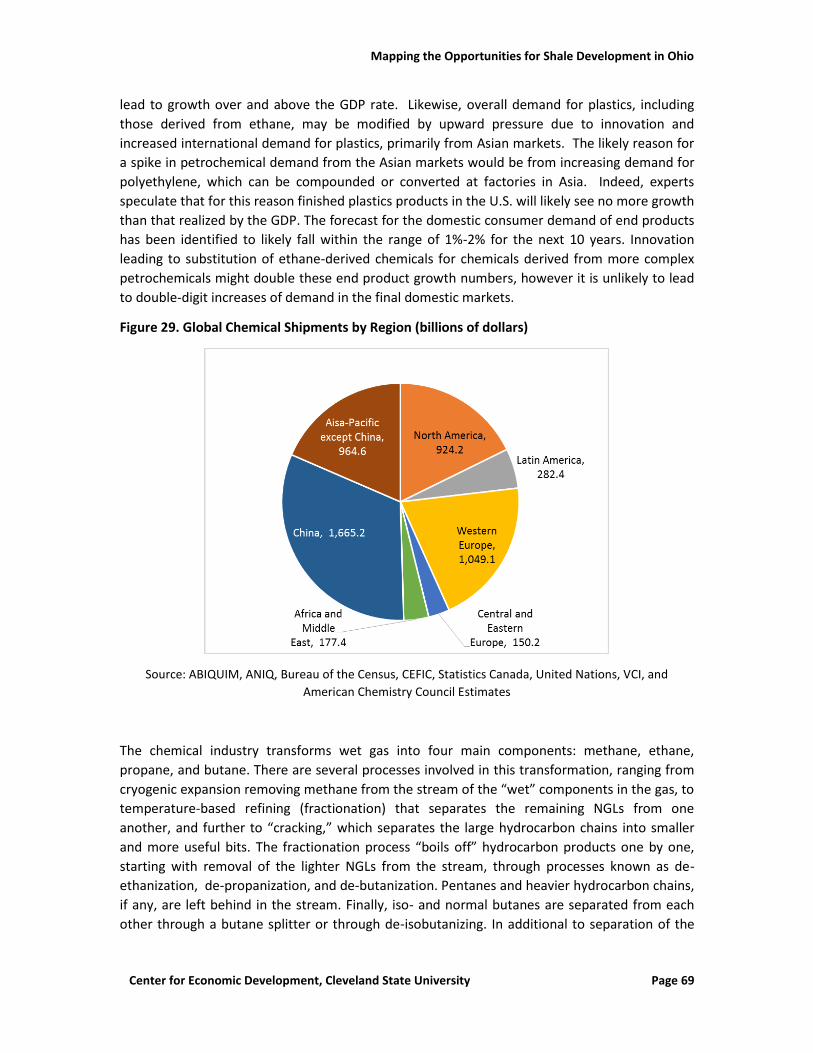
Mapping the Opportunities for Shale Development in Ohio
Center for Economic Development, Cleveland State University Page 69
lead to growth over and above the GDP rate. Likewise, overall demand for plastics, including
those derived from ethane, may be modified by upward pressure due to innovation and
increased international demand for plastics, primarily from Asian markets. The likely reason for
a spike in petrochemical demand from the Asian markets would be from increasing demand for
polyethylene, which can be compounded or converted at factories in Asia. Indeed, experts
speculate that for this reason finished plastics products in the U.S. will likely see no more growth
than that realized by the GDP. The forecast for the domestic consumer demand of end products
has been identified to likely fall within the range of 1%-2% for the next 10 years. Innovation
leading to substitution of ethane-derived chemicals for chemicals derived from more complex
petrochemicals might double these end product growth numbers, however it is unlikely to lead
to double-digit increases of demand in the final domestic markets.
Figure 29. Global Chemical Shipments by Region (billions of dollars)
Source: ABIQUIM, ANIQ, Bureau of the Census, CEFIC, Statistics Canada, United Nations, VCI, and
American Chemistry Council Estimates
The chemical industry transforms wet gas into four main components: methane, ethane,
propane, and butane. There are several processes involved in this transformation, ranging from
cryogenic expansion removing methane from the stream of the “wet” components in the gas, to
temperature-based refining (fractionation) that separates the remaining NGLs from one
another, and further to “cracking,” which separates the large hydrocarbon chains into smaller
and more useful bits. The fractionation process “boils off” hydrocarbon products one by one,
starting with removal of the lighter NGLs from the stream, through processes known as de-
ethanization, de-propanization, and de-butanization. Pentanes and heavier hydrocarbon chains,
if any, are left behind in the stream. Finally, iso- and normal butanes are separated from each
other through a butane splitter or through de-isobutanizing. In additional to separation of the
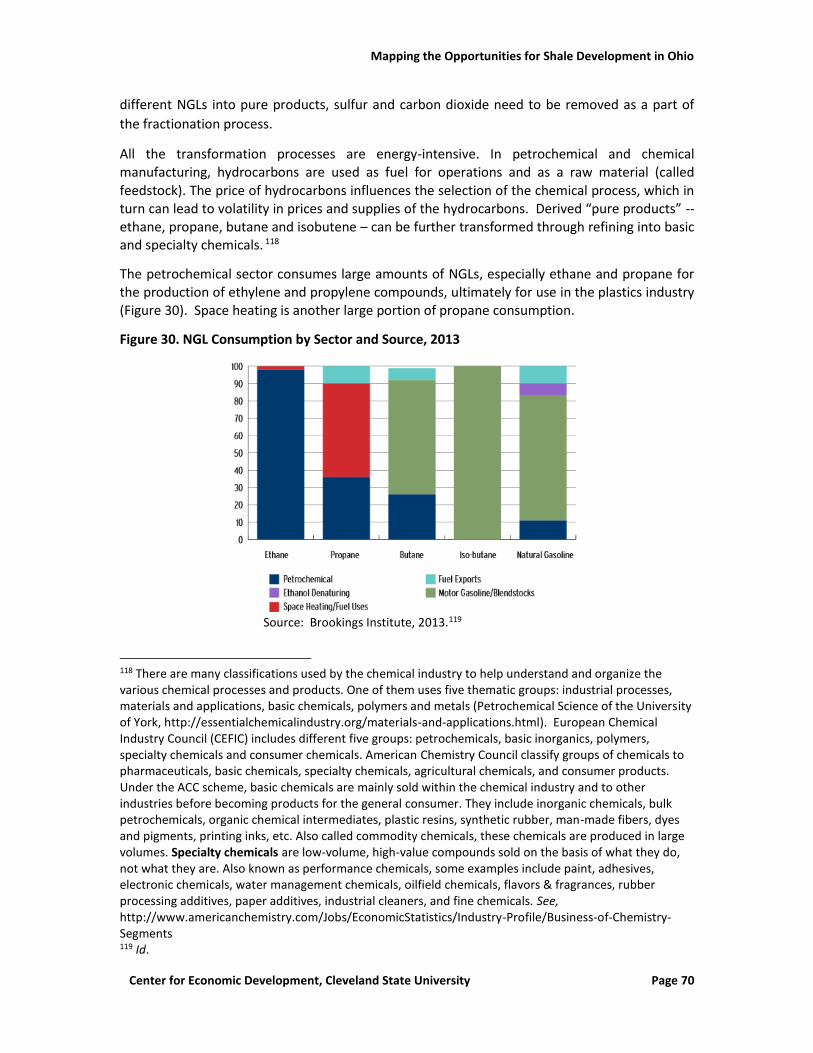
Mapping the Opportunities for Shale Development in Ohio
Center for Economic Development, Cleveland State University Page 70
different NGLs into pure products, sulfur and carbon dioxide need to be removed as a part of
the fractionation process.
All the transformation processes are energy-intensive. In petrochemical and chemical manufacturing, hydrocarbons are used as fuel for operations and as a raw material (called
feedstock). The price of hydrocarbons influences the selection of the chemical process, which in turn can lead to volatility in prices and supplies of the hydrocarbons. Derived “pure products” -- ethane, propane, butane and isobutene – can be further transformed through refining into basic and specialty chemicals. 118
The petrochemical sector consumes large amounts of NGLs, especially ethane and propane for the production of ethylene and propylene compounds, ultimately for use in the plastics industry (Figure 30). Space heating is another large portion of propane consumption.
Figure 30. NGL Consumption by Sector and Source, 2013
Source: Brookings Institute, 2013.119
118 There are many classifications used by the chemical industry to help understand and organize the various chemical processes and products. One of them uses five thematic groups: industrial processes, materials and applications, basic chemicals, polymers and metals (Petrochemical Science of the University of York, http://essentialchemicalindustry.org/materials-and-applications.html). European Chemical Industry Council (CEFIC) includes different five groups: petrochemicals, basic inorganics, polymers, specialty chemicals and consumer chemicals. American Chemistry Council classify groups of chemicals to pharmaceuticals, basic chemicals, specialty chemicals, agricultural chemicals, and consumer products. Under the ACC scheme, basic chemicals are mainly sold within the chemical industry and to other industries before becoming products for the general consumer. They include inorganic chemicals, bulk petrochemicals, organic chemical intermediates, plastic resins, synthetic rubber, man-made fibers, dyes and pigments, printing inks, etc. Also called commodity chemicals, these chemicals are produced in large volumes. Specialty chemicals are low-volume, high-value compounds sold on the basis of what they do, not what they are. Also known as performance chemicals, some examples include paint, adhesives, electronic chemicals, water management chemicals, oilfield chemicals, flavors & fragrances, rubber processing additives, paper additives, industrial cleaners, and fine chemicals. See, http://www.americanchemistry.com/Jobs/EconomicStatistics/Industry-Profile/Business-of-Chemistry-Segments 119 Id.
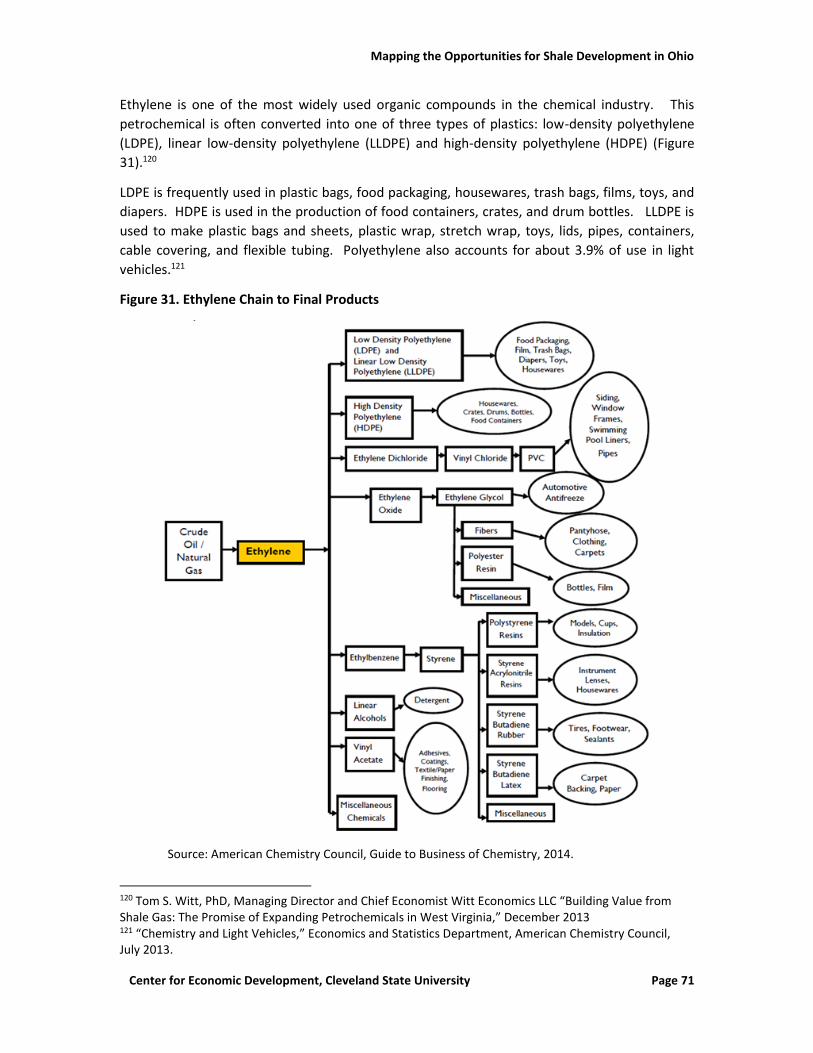
Mapping the Opportunities for Shale Development in Ohio
Center for Economic Development, Cleveland State University Page 71
Ethylene is one of the most widely used organic compounds in the chemical industry. This
petrochemical is often converted into one of three types of plastics: low-density polyethylene
(LDPE), linear low-density polyethylene (LLDPE) and high-density polyethylene (HDPE) (Figure
31).120
LDPE is frequently used in plastic bags, food packaging, housewares, trash bags, films, toys, and
diapers. HDPE is used in the production of food containers, crates, and drum bottles. LLDPE is
used to make plastic bags and sheets, plastic wrap, stretch wrap, toys, lids, pipes, containers,
cable covering, and flexible tubing. Polyethylene also accounts for about 3.9% of use in light
vehicles.121
Figure 31. Ethylene Chain to Final Products
Source: American Chemistry Council, Guide to Business of Chemistry, 2014.
120 Tom S. Witt, PhD, Managing Director and Chief Economist Witt Economics LLC “Building Value from Shale Gas: The Promise of Expanding Petrochemicals in West Virginia,” December 2013 121 “Chemistry and Light Vehicles,” Economics and Statistics Department, American Chemistry Council, July 2013.
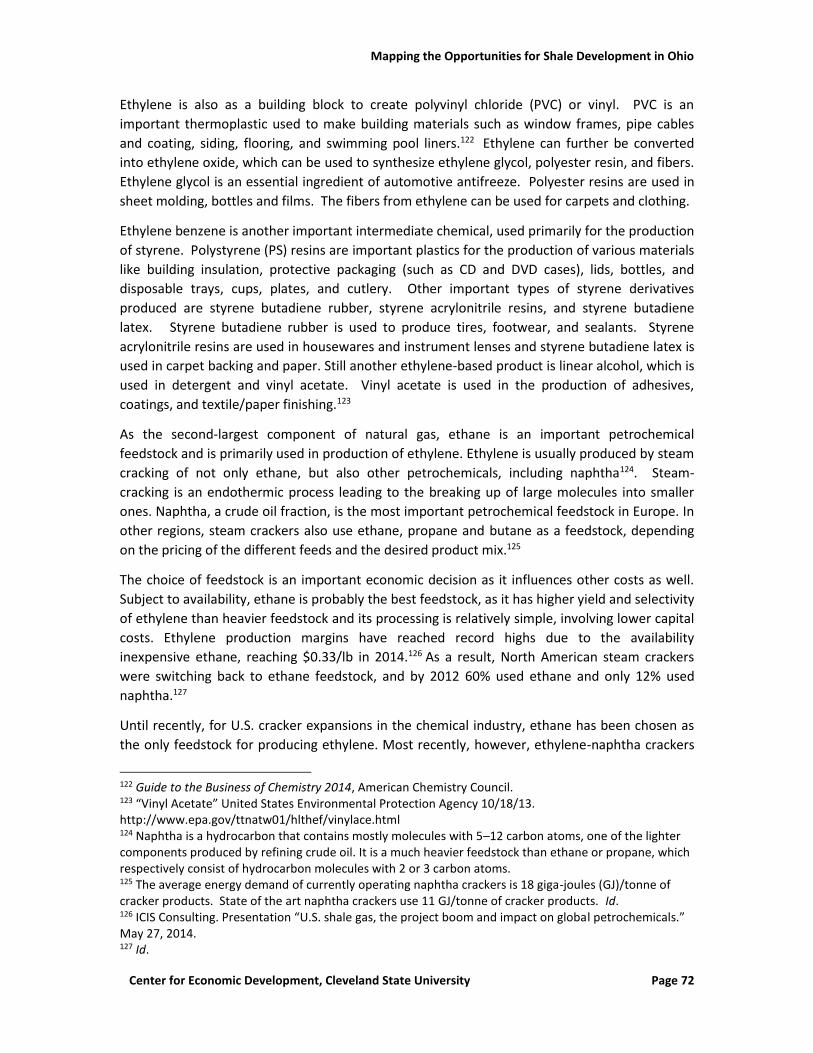
Mapping the Opportunities for Shale Development in Ohio
Center for Economic Development, Cleveland State University Page 72
Ethylene is also as a building block to create polyvinyl chloride (PVC) or vinyl. PVC is an
important thermoplastic used to make building materials such as window frames, pipe cables
and coating, siding, flooring, and swimming pool liners.122 Ethylene can further be converted
into ethylene oxide, which can be used to synthesize ethylene glycol, polyester resin, and fibers.
Ethylene glycol is an essential ingredient of automotive antifreeze. Polyester resins are used in
sheet molding, bottles and films. The fibers from ethylene can be used for carpets and clothing.
Ethylene benzene is another important intermediate chemical, used primarily for the production
of styrene. Polystyrene (PS) resins are important plastics for the production of various materials
like building insulation, protective packaging (such as CD and DVD cases), lids, bottles, and
disposable trays, cups, plates, and cutlery. Other important types of styrene derivatives
produced are styrene butadiene rubber, styrene acrylonitrile resins, and styrene butadiene
latex. Styrene butadiene rubber is used to produce tires, footwear, and sealants. Styrene
acrylonitrile resins are used in housewares and instrument lenses and styrene butadiene latex is
used in carpet backing and paper. Still another ethylene-based product is linear alcohol, which is
used in detergent and vinyl acetate. Vinyl acetate is used in the production of adhesives,
coatings, and textile/paper finishing.123
As the second-largest component of natural gas, ethane is an important petrochemical
feedstock and is primarily used in production of ethylene. Ethylene is usually produced by steam
cracking of not only ethane, but also other petrochemicals, including naphtha124. Steam-
cracking is an endothermic process leading to the breaking up of large molecules into smaller
ones. Naphtha, a crude oil fraction, is the most important petrochemical feedstock in Europe. In
other regions, steam crackers also use ethane, propane and butane as a feedstock, depending
on the pricing of the different feeds and the desired product mix.125
The choice of feedstock is an important economic decision as it influences other costs as well.
Subject to availability, ethane is probably the best feedstock, as it has higher yield and selectivity
of ethylene than heavier feedstock and its processing is relatively simple, involving lower capital
costs. Ethylene production margins have reached record highs due to the availability
inexpensive ethane, reaching $0.33/lb in 2014.126 As a result, North American steam crackers
were switching back to ethane feedstock, and by 2012 60% used ethane and only 12% used
naphtha.127
Until recently, for U.S. cracker expansions in the chemical industry, ethane has been chosen as
the only feedstock for producing ethylene. Most recently, however, ethylene-naphtha crackers
122 Guide to the Business of Chemistry 2014, American Chemistry Council. 123 “Vinyl Acetate” United States Environmental Protection Agency 10/18/13. http://www.epa.gov/ttnatw01/hlthef/vinylace.html 124 Naphtha is a hydrocarbon that contains mostly molecules with 5–12 carbon atoms, one of the lighter components produced by refining crude oil. It is a much heavier feedstock than ethane or propane, which respectively consist of hydrocarbon molecules with 2 or 3 carbon atoms. 125 The average energy demand of currently operating naphtha crackers is 18 giga-joules (GJ)/tonne of cracker products. State of the art naphtha crackers use 11 GJ/tonne of cracker products. Id. 126 ICIS Consulting. Presentation “U.S. shale gas, the project boom and impact on global petrochemicals.” May 27, 2014. 127 Id.
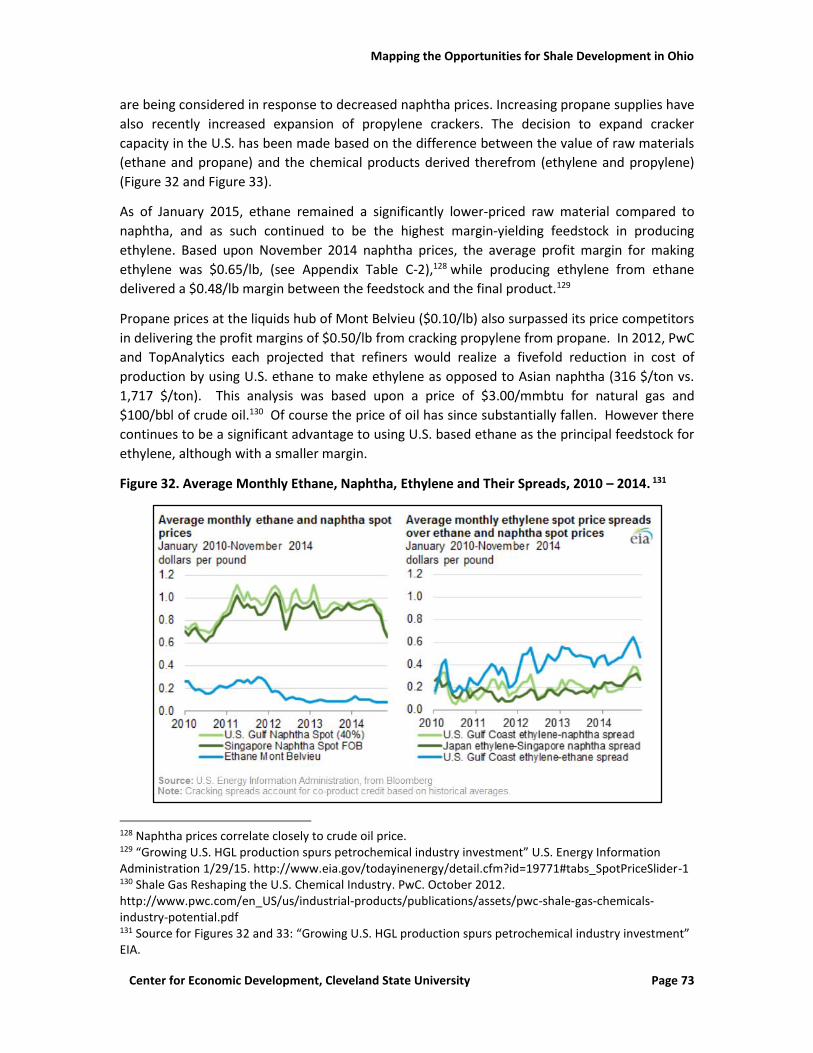
Mapping the Opportunities for Shale Development in Ohio
Center for Economic Development, Cleveland State University Page 73
are being considered in response to decreased naphtha prices. Increasing propane supplies have
also recently increased expansion of propylene crackers. The decision to expand cracker
capacity in the U.S. has been made based on the difference between the value of raw materials
(ethane and propane) and the chemical products derived therefrom (ethylene and propylene)
(Figure 32 and Figure 33).
As of January 2015, ethane remained a significantly lower-priced raw material compared to
naphtha, and as such continued to be the highest margin-yielding feedstock in producing
ethylene. Based upon November 2014 naphtha prices, the average profit margin for making
ethylene was $0.65/lb, (see Appendix Table C-2),128 while producing ethylene from ethane
delivered a $0.48/lb margin between the feedstock and the final product.129
Propane prices at the liquids hub of Mont Belvieu ($0.10/lb) also surpassed its price competitors
in delivering the profit margins of $0.50/lb from cracking propylene from propane. In 2012, PwC
and TopAnalytics each projected that refiners would realize a fivefold reduction in cost of
production by using U.S. ethane to make ethylene as opposed to Asian naphtha (316 $/ton vs.
1,717 $/ton). This analysis was based upon a price of $3.00/mmbtu for natural gas and
$100/bbl of crude oil.130 Of course the price of oil has since substantially fallen. However there
continues to be a significant advantage to using U.S. based ethane as the principal feedstock for
ethylene, although with a smaller margin.
Figure 32. Average Monthly Ethane, Naphtha, Ethylene and Their Spreads, 2010 – 2014. 131
128 Naphtha prices correlate closely to crude oil price. 129 “Growing U.S. HGL production spurs petrochemical industry investment” U.S. Energy Information Administration 1/29/15. http://www.eia.gov/todayinenergy/detail.cfm?id=19771#tabs_SpotPriceSlider-1 130 Shale Gas Reshaping the U.S. Chemical Industry. PwC. October 2012. http://www.pwc.com/en_US/us/industrial-products/publications/assets/pwc-shale-gas-chemicals-industry-potential.pdf 131 Source for Figures 32 and 33: “Growing U.S. HGL production spurs petrochemical industry investment” EIA.
Mapping the Opportunities for Shale Development in Ohio
Center for Economic Development, Cleveland State University Page 74
Figure 33. Average Monthly Propane, Propylene, and Their Spreads, 2010 – 2014.
The ethane molecules follow a series of complex paths after being refined into ethylene, with
the finished product depending upon which path is taken. When ethane is converted to
ethylene in crackers and then to polyethylene, it takes a form of a commodity chemical that
might go through another transformation (becoming a secondary commodity chemical) before it
will be compounded into a plastic mixture (physical mixing of resins with performance-
enhancing additives) ). Compounding companies and other intermediaries thereafter either
produce final plastic products or send the mixture to plastic manufacturers for molding and
stamping into final consumer goods, industrial parts and other products. Polyethylene
produced at or near the cracker facility by the petrochemical company may be sold directly to
compounders or to distribution companies.
Consumer products maintain a traditional segment in the market of chemicals and these
compete for customers by using brands, different distribution channels, demographic niches
and geographies. The economic markets are segmented by such types of final chemical product
as hygiene products, hair care, skin care, cosmetics, body care, perfumes, and packaging. The
Bulk Petrochemicals and Intermediates (including ethane derivatives) occupy 17% of global
chemical shipments; the Consumer Products hold about 9% of global shipments.132
Polyethylene consumption growth can also be analyzed in light of the specific types of
compounds generated. Low Density Polyethylene (LDPE), first developed in 1935, has a density
in the range of 0.910 g/cc (grams per cubic centimeter) to 0.940 g/cc, which results in a
relatively low tensile strength and a relatively high ductility. LDPE tends to be translucent,
132 American Chemistry Council. Guide to Business of Chemistry. 2014.
Mapping the Opportunities for Shale Development in Ohio
Center for Economic Development, Cleveland State University Page 75
making it useful in film applications such in food packaging, which requires high transparency
and moderate strength.133
The major sectors that consume Linear Low Density Polyethylene (LLDPE) are packaging,
construction and automotive, accounting for 80% of the global LDPE demand in 2010. LLDPE is
gradually replacing LDPE in many applications due to its lower cost and higher strength, but
LDPE is still used widely in extrusion coating because of its ease of processing. Demand for LDPE
has been slowing, with a compound annual growth rate (CAGR) of only 2.5% for the period
2000-2010. The growth of LDPE demand can be attributed solely to the Chinese market, which
accounted for 32% of demand in 2010.134
The global market for LLDPE demand, on the other hand, has been moving steadily forward - its
growth driven largely by the developing plastics industries in the Asia-Pacific and Eastern
European countries.135 Global consumption of LLDPE is projected to increase by 4-4.5% annually
through 2017. The Asian region makes up approximately 42% of forecasted total demand, while
the more mature markets of North America and Europe, apparently approaching market
saturation, have experienced a more limited LLDPE demand increase. Accordingly, we might
expect restricted LLDPE capacity additions in these regions. Demand increase is anticipated to
come from the packaging and construction industries. Indeed, capacity additions already
scheduled for the developing markets are likely to further drive the LLDPE industry growth.136
3.3. Natural Gas as Fuel for Transportation
In the United States, 0.01% of natural gas produced is used as fuel for transportation. As an
alternative to gasoline or diesel fuel, natural gas can act as a transportation fuel in a compressed
(CNG) or liquefied (LNG) state. CNG is stored on vehicles in high-pressure cylinders, achieving
comparable fuel economy to a gasoline-powered automobile. LNG is created by super-cooling
natural gas and storing it at cold temperatures while under pressure. While CNG can be used for
a wide variety of applications, LNG is better suited for long-distance travel because of its greater
storage efficiency.137 Because of this, EIA believes that LNG may become a more viable fuel for
freight rail, predicting that it will control 35% of the rail fuel market by 2040.138
As of 2012, there are 15 million NG vehicles operating around the world, 250,000 of which are
operating in the United States. The majority of these vehicles are part of transportation fleets,
but new technology is increasing the potential for individual NG vehicles. The largest barrier to
more widespread NG use in the U.S. is a lack of CNG and LNG refueling stations. NatGasCar, a
Cleveland, Ohio-based company, has developed both a conversion system that allows gasoline-
powered vehicles to operate with CNG, and a home CNG vehicle refueling system. The vehicle
133 Id. 134 Western Plastics (final product distribution company), http://www.wplastics.com/article2853.asp 135 Merchant Research & Consulting Ltd. 136 Plastemart, http://www.plastemart.com/plastic-facts-information.asp?news_id=21390&news=Global-LLDPE-demand-is-moving-steadily-forward 137 “Natural Gas Fuel Basics” U.S. Department of Energy 11/4/13. http://www.afdc.energy.gov/fuels/natural_gas_basics.html 138 “Annual Energy Outlook 2014” U.S. Energy Information Administration 4/14. http://www.eia.gov/forecasts/aeo/pdf/0383%282014%29.pdf
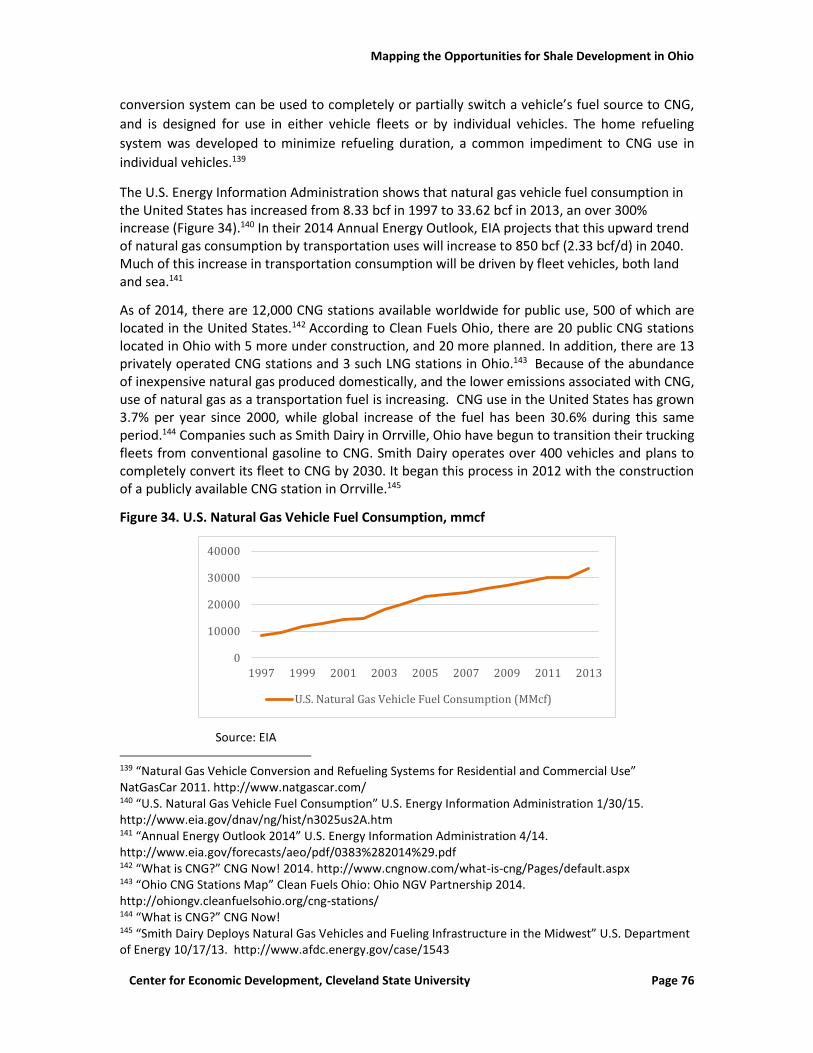
Mapping the Opportunities for Shale Development in Ohio
Center for Economic Development, Cleveland State University Page 76
conversion system can be used to completely or partially switch a vehicle’s fuel source to CNG,
and is designed for use in either vehicle fleets or by individual vehicles. The home refueling
system was developed to minimize refueling duration, a common impediment to CNG use in
individual vehicles.139
The U.S. Energy Information Administration shows that natural gas vehicle fuel consumption in the United States has increased from 8.33 bcf in 1997 to 33.62 bcf in 2013, an over 300% increase (Figure 34).140 In their 2014 Annual Energy Outlook, EIA projects that this upward trend of natural gas consumption by transportation uses will increase to 850 bcf (2.33 bcf/d) in 2040. Much of this increase in transportation consumption will be driven by fleet vehicles, both land and sea.141
As of 2014, there are 12,000 CNG stations available worldwide for public use, 500 of which are located in the United States.142 According to Clean Fuels Ohio, there are 20 public CNG stations located in Ohio with 5 more under construction, and 20 more planned. In addition, there are 13 privately operated CNG stations and 3 such LNG stations in Ohio.143 Because of the abundance of inexpensive natural gas produced domestically, and the lower emissions associated with CNG, use of natural gas as a transportation fuel is increasing. CNG use in the United States has grown 3.7% per year since 2000, while global increase of the fuel has been 30.6% during this same period.144 Companies such as Smith Dairy in Orrville, Ohio have begun to transition their trucking fleets from conventional gasoline to CNG. Smith Dairy operates over 400 vehicles and plans to completely convert its fleet to CNG by 2030. It began this process in 2012 with the construction of a publicly available CNG station in Orrville.145
Figure 34. U.S. Natural Gas Vehicle Fuel Consumption, mmcf
Source: EIA 139 “Natural Gas Vehicle Conversion and Refueling Systems for Residential and Commercial Use” NatGasCar 2011. http://www.natgascar.com/ 140 “U.S. Natural Gas Vehicle Fuel Consumption” U.S. Energy Information Administration 1/30/15. http://www.eia.gov/dnav/ng/hist/n3025us2A.htm 141 “Annual Energy Outlook 2014” U.S. Energy Information Administration 4/14. http://www.eia.gov/forecasts/aeo/pdf/0383%282014%29.pdf 142 “What is CNG?” CNG Now! 2014. http://www.cngnow.com/what-is-cng/Pages/default.aspx 143 “Ohio CNG Stations Map” Clean Fuels Ohio: Ohio NGV Partnership 2014. http://ohiongv.cleanfuelsohio.org/cng-stations/ 144 “What is CNG?” CNG Now! 145 “Smith Dairy Deploys Natural Gas Vehicles and Fueling Infrastructure in the Midwest” U.S. Department of Energy 10/17/13. http://www.afdc.energy.gov/case/1543
0
10000
20000
30000
40000
1997 1999 2001 2003 2005 2007 2009 2011 2013
U.S. Natural Gas Vehicle Fuel Consumption (MMcf)
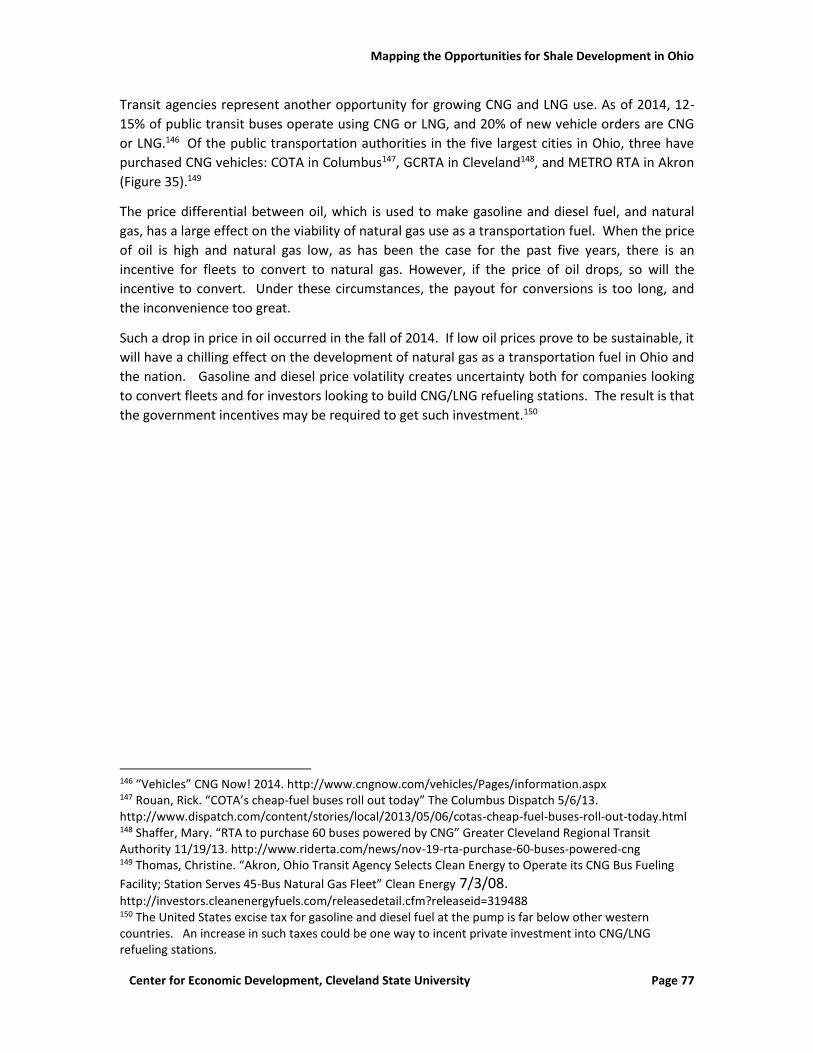
Mapping the Opportunities for Shale Development in Ohio
Center for Economic Development, Cleveland State University Page 77
Transit agencies represent another opportunity for growing CNG and LNG use. As of 2014, 12-
15% of public transit buses operate using CNG or LNG, and 20% of new vehicle orders are CNG
or LNG.146 Of the public transportation authorities in the five largest cities in Ohio, three have
purchased CNG vehicles: COTA in Columbus147, GCRTA in Cleveland148, and METRO RTA in Akron
(Figure 35).149
The price differential between oil, which is used to make gasoline and diesel fuel, and natural
gas, has a large effect on the viability of natural gas use as a transportation fuel. When the price
of oil is high and natural gas low, as has been the case for the past five years, there is an
incentive for fleets to convert to natural gas. However, if the price of oil drops, so will the
incentive to convert. Under these circumstances, the payout for conversions is too long, and
the inconvenience too great.
Such a drop in price in oil occurred in the fall of 2014. If low oil prices prove to be sustainable, it
will have a chilling effect on the development of natural gas as a transportation fuel in Ohio and
the nation. Gasoline and diesel price volatility creates uncertainty both for companies looking
to convert fleets and for investors looking to build CNG/LNG refueling stations. The result is that
the government incentives may be required to get such investment.150
146 “Vehicles” CNG Now! 2014. http://www.cngnow.com/vehicles/Pages/information.aspx 147 Rouan, Rick. “COTA’s cheap-fuel buses roll out today” The Columbus Dispatch 5/6/13. http://www.dispatch.com/content/stories/local/2013/05/06/cotas-cheap-fuel-buses-roll-out-today.html 148 Shaffer, Mary. “RTA to purchase 60 buses powered by CNG” Greater Cleveland Regional Transit Authority 11/19/13. http://www.riderta.com/news/nov-19-rta-purchase-60-buses-powered-cng 149 Thomas, Christine. “Akron, Ohio Transit Agency Selects Clean Energy to Operate its CNG Bus Fueling
Facility; Station Serves 45-Bus Natural Gas Fleet” Clean Energy 7/3/08. http://investors.cleanenergyfuels.com/releasedetail.cfm?releaseid=319488 150 The United States excise tax for gasoline and diesel fuel at the pump is far below other western countries. An increase in such taxes could be one way to incent private investment into CNG/LNG refueling stations.
Mapping the Opportunities for Shale Development in Ohio
Center for Economic Development, Cleveland State University Page 78
Figure 35. CNG Stations in Ohio, October 2014
Source: http://ohiongv.cleanfuelsohio.org/cng-stations/
3.4. Power Production and Heat Generation
Natural gas can be used to produce electricity in one of three ways: (1) steam production from
burning gas, which then generates electricity through a steam turbine; (2) electricity generation
by burning gas in a combustion turbine; or (3) burning gas in a combustion turbine, using the
heat to make steam which will be used by a steam turbine to generate electricity (combined
cycle).151 In 2013 natural gas accounted for 27% of total electricity generation in the United
States – second only to coal.152 However, EIA projects that by 2035 natural gas generation will
surpass all other forms of electricity generation in the United States. Natural gas power plants
have been replacing coal-fired plants in recent years due a combination of low natural gas
prices, coal plant inefficiencies and new emission constraints from environmental regulation. If
coal-fired plants are retired at an increasing pace, EIA predicts that natural gas electricity
generation could overtake coal as early as 2019.153
151 “Natural Gas” U.S. Environmental Protection Agency 9/25/13. http://www.epa.gov/cleanenergy/energy-and-you/affect/natural-gas.html 152 “What is U.S. electricity generation by energy source?” U.S. Energy Information Administration 6/13/14. http://www.eia.gov/tools/faqs/faq.cfm?id=427&t=3 153 “Annual Energy Outlook 2014” U.S. Energy Information Administration 4/14.
Mapping the Opportunities for Shale Development in Ohio
Center for Economic Development, Cleveland State University Page 79
As of the first quarter of 2014, 11 states were using natural gas as their primary source of
electricity generation, with Texas, Florida, and California the leaders. Ohio is 12th in the nation
in natural gas electricity generation, with over 6,000,000 megawatt-hours. This represents a
substantial increase since the first quarter of 2001, when Ohio was 36th in the nation with only
115,000 megawatt-hours.154 As of 2012, there were 30 natural gas power-generating facilities in
Ohio.155 Using an EIA fuel-to-electricity conversion chart, pursuant to which 0.00786 mcf of
natural gas is required to generate one kilowatt-hour of electricity, Ohio required over 47 bcf of
natural gas for electricity generation during the first quarter of 2014.156
During the first six months of 2014, natural gas power generation made up over 50% of new
generating capacity added in the United States. The majority of this growth was seen in Florida,
with substantial natural gas power generation capacity also added in Utah and Texas. 2,179
megawatts of combined cycle electricity generation capacity were added in the first six months
of 2014, representing a 60% increase versus 2013. Overall, however, natural gas power
generation additions were 50% less than the same period in 2013.157 EIA predicts that 73% of
electricity generation capacity additions added by 2040 will be natural gas plants. Natural gas
consumption for electricity generation purposes are projected to increase by 2 tcf during this
time period.158The number and capacities of coal-fired electricity generating power facilities that
are being retired have been growing each year (Figure 36).
According to the EIA, 29 of these facilities were retired in 2010, with a total net summer capacity
of 1,418 MW. By 2012, 85 facilities were being retired with a total capacity of 10,214 MW, or
3.2% of total coal-fired power generation in the United States in 2011. The EIA predicts that
these numbers will continue to grow and that 60,000 MW of capacity will be retired by 2020, or
nearly 20% of coal-fired capacity in 2012. The overwhelming majority of these retirements are
projected to take place before 2016, when the EPA’s Mercury and Air Toxics Standards come
into effect.
154 Molla, Rani. “Coal Still Is Top Source of Electricity in U.S.; Where Does Your State Stand?” The Wall Street Journal 8/14/14. http://blogs.wsj.com/numbers/most-electricity-in-u-s-still-comes-from-coal-where-does-your-state-stand-1705/ 155 “Ohio: State Profile and Energy Estimates” U.S. Energy Information Administration 9/14. http://www.eia.gov/state/?sid=oh#tabs-4 156 “How much coal, natural gas, or petroleum is used to generate a kilowatt-hour of electricity?” U.S. Energy Information Administration 1/15/14. http://www.eia.gov/tools/faqs/faq.cfm?id=667&t=3 157 Lee, April. “Today in Energy: Natural gas, solar, and wind lead power plant capacity additions in first-half 2014” U.S. Energy Information Administration 9/9/14. http://www.eia.gov/todayinenergy/detail.cfm?id=17891 158 “Annual Energy Outlook 2014” U.S. Energy Information Administration 4/14.
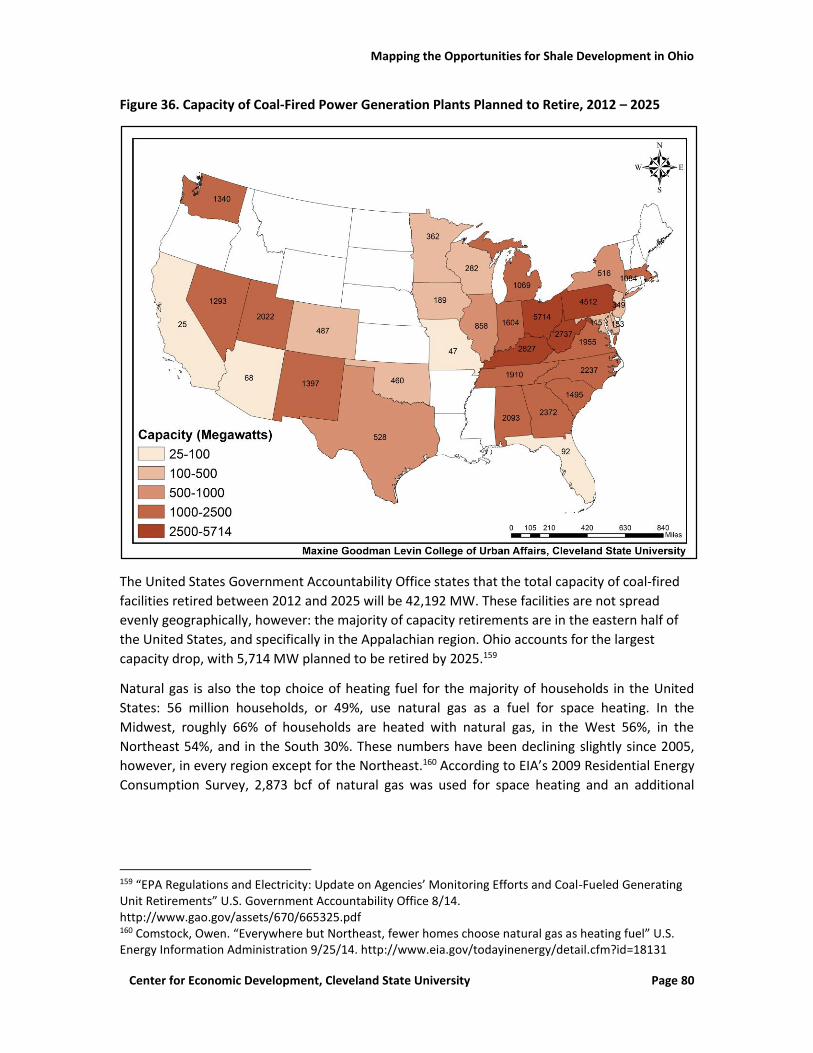
Mapping the Opportunities for Shale Development in Ohio
Center for Economic Development, Cleveland State University Page 80
Figure 36. Capacity of Coal-Fired Power Generation Plants Planned to Retire, 2012 – 2025
The United States Government Accountability Office states that the total capacity of coal-fired
facilities retired between 2012 and 2025 will be 42,192 MW. These facilities are not spread
evenly geographically, however: the majority of capacity retirements are in the eastern half of
the United States, and specifically in the Appalachian region. Ohio accounts for the largest
capacity drop, with 5,714 MW planned to be retired by 2025.159
Natural gas is also the top choice of heating fuel for the majority of households in the United
States: 56 million households, or 49%, use natural gas as a fuel for space heating. In the
Midwest, roughly 66% of households are heated with natural gas, in the West 56%, in the
Northeast 54%, and in the South 30%. These numbers have been declining slightly since 2005,
however, in every region except for the Northeast.160 According to EIA’s 2009 Residential Energy
Consumption Survey, 2,873 bcf of natural gas was used for space heating and an additional
159 “EPA Regulations and Electricity: Update on Agencies’ Monitoring Efforts and Coal-Fueled Generating Unit Retirements” U.S. Government Accountability Office 8/14. http://www.gao.gov/assets/670/665325.pdf 160 Comstock, Owen. “Everywhere but Northeast, fewer homes choose natural gas as heating fuel” U.S. Energy Information Administration 9/25/14. http://www.eia.gov/todayinenergy/detail.cfm?id=18131
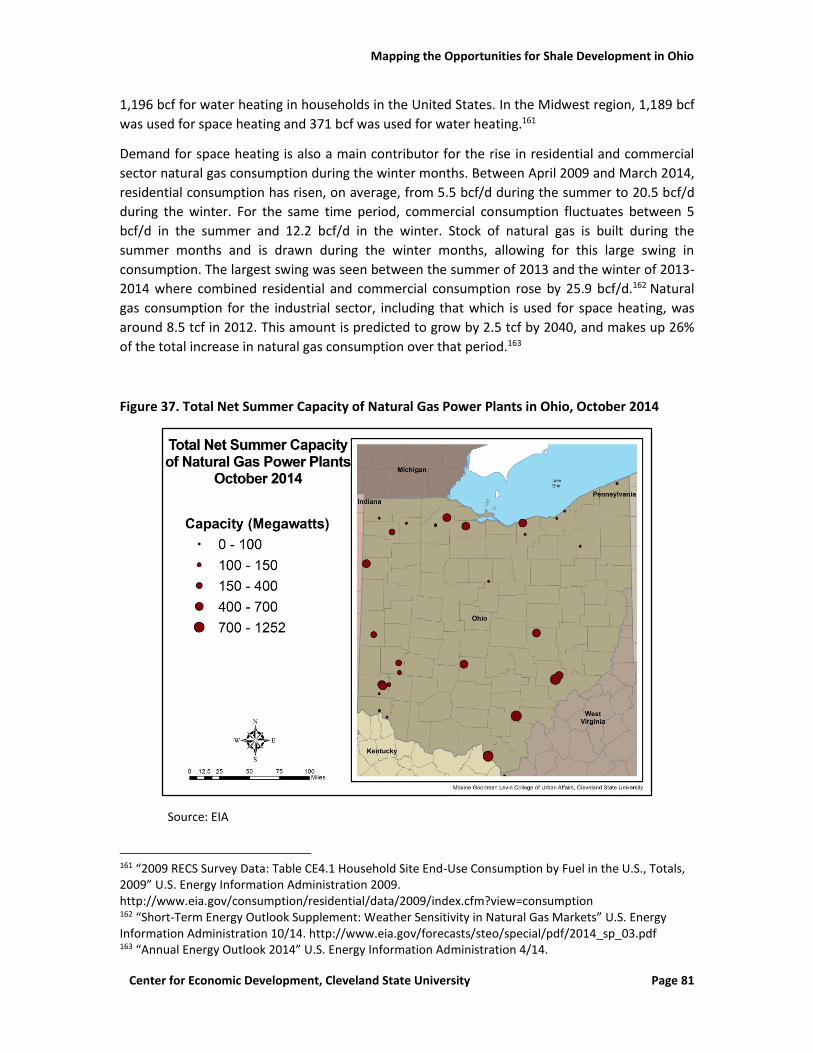
Mapping the Opportunities for Shale Development in Ohio
Center for Economic Development, Cleveland State University Page 81
1,196 bcf for water heating in households in the United States. In the Midwest region, 1,189 bcf
was used for space heating and 371 bcf was used for water heating.161
Demand for space heating is also a main contributor for the rise in residential and commercial
sector natural gas consumption during the winter months. Between April 2009 and March 2014,
residential consumption has risen, on average, from 5.5 bcf/d during the summer to 20.5 bcf/d
during the winter. For the same time period, commercial consumption fluctuates between 5
bcf/d in the summer and 12.2 bcf/d in the winter. Stock of natural gas is built during the
summer months and is drawn during the winter months, allowing for this large swing in
consumption. The largest swing was seen between the summer of 2013 and the winter of 2013-
2014 where combined residential and commercial consumption rose by 25.9 bcf/d.162 Natural
gas consumption for the industrial sector, including that which is used for space heating, was
around 8.5 tcf in 2012. This amount is predicted to grow by 2.5 tcf by 2040, and makes up 26%
of the total increase in natural gas consumption over that period.163
Figure 37. Total Net Summer Capacity of Natural Gas Power Plants in Ohio, October 2014
Source: EIA
161 “2009 RECS Survey Data: Table CE4.1 Household Site End-Use Consumption by Fuel in the U.S., Totals, 2009” U.S. Energy Information Administration 2009. http://www.eia.gov/consumption/residential/data/2009/index.cfm?view=consumption 162 “Short-Term Energy Outlook Supplement: Weather Sensitivity in Natural Gas Markets” U.S. Energy Information Administration 10/14. http://www.eia.gov/forecasts/steo/special/pdf/2014_sp_03.pdf 163 “Annual Energy Outlook 2014” U.S. Energy Information Administration 4/14.
Mapping the Opportunities for Shale Development in Ohio
Center for Economic Development, Cleveland State University Page 82
3.5. Gas to Liquids Technology Development
Gas to liquids (GTL) is a process by which natural gas is converted into synthetic liquid fuels,
such as diesel fuel and gasoline. New technology, including the use of advanced catalysts, has
increased the efficacy of GTL plants and has allowed for the creation of products of a higher
caliber. Through 2014, the abundant supply of domestically produced natural gas through shale
development, the rise in the price ratio between crude oil and natural gas up to early 2015, and
the need for high-quality, low-emission products had enabled GTL to become a viable endeavor.
However, in 2015 the price ratio between crude oil and natural gas has declined, making GTL
less attractive.
Gas to liquids can be established at several points along the gas value chain. It can be
complementary to or replace midstream natural gas processing, or it can be sold in the
downstream markets.164 A study from the International Journal of Alternative Propulsion has
expressed the view that GTL processes not only have lower emissions than those of coal to
liquid (CTL) or biomass to liquid (BTL), but also represent a more economically feasible
alternative in regions where natural gas is abundant.165 The Louisiana Department of Natural
Resources is predicting that there will be a market for more than 10 new GTL plants, each
valued at $12-20 billion.166 However, the U.S. Energy Information Administration does not
believe that GTL will have much of an effect on the total amount of liquids produced
domestically. The EIA has expressed the view that due to high costs and price competition with
crude oil production, gas to liquids will remain only a small portion of domestic liquids
production.167 Recent drops in oil prices have further eroded the near term economic
opportunity associated with GTL plants.
Historically, gas-to-liquid facilities have been constructed in locations abroad, due either to an
abundance of very inexpensive natural gas (Qatar, Malaysia, and Nigeria) or to historic political
isolation (South Africa). Due to the success of the majority of these facilities, and especially
Shell’s Pearl GTL project in Qatar, and due to the abundance of inexpensive shale gas, North
America is now becoming a focus in the implementation of GTL. The international energy
company Sasol is planning to construct an $11-14 billion 96,000 bbl/d GTL facility in Louisiana by
2016.168 Shell initially expressed interest in constructing a similar facility in Louisiana, however
the plans were discontinued, citing high costs and market uncertainty.169
164 Hobbs, H. O. Jr. “Gas-To-Liquids Plants Offer Great ROI” The American Oil & Gas Reporter 5/12. 165 Bertucco, Alberto and Sudiro, Maria. “Production of synthetic gasoline and diesel fuels by alternative processes using natural gas, coal and biomass: process simulation and economic analysis” International Journal of Alternative Propulsion 2008. http://www.inderscience.com/storage/f635491187110212.pdf 166 O’Brien, Edward. “Gas to Liquids Plants: Turning Louisiana Natural Gas into Marketable Liquid Fuels” Louisiana Department of Natural Resources/ Technology Assessment Division 11/13. http://dnr.louisiana.gov/assets/TAD/newsletters/2013/2013-11_topic_1.pdf 167 “Annual Energy Outlook 2014” U.S. Energy Information Administration 4/14. 168 Forbes, Alex. “Gas-to-Liquids- on the threshold of a new era?” GasTechNews 9/18/13. http://www.gastechnews.com/processing-technology/gas-to-liquids-on-the-threshold-of-a-new-era/ 169 Mallik, Arup and Mantri, Vishakh. “Gas-to-liquids plants face challenges in the U.S. market" U.S. Energy Information Administration 2/19/14.
Mapping the Opportunities for Shale Development in Ohio
Center for Economic Development, Cleveland State University Page 83
Smaller companies, such as Velocys, are also in the process of GTL and Biomass to Liquid (BTL)
research and development. The Central Ohio-based company has begun constructing and selling
small-scale GTL modules, or reactors, which can create diesel fuel on-site, using a natural gas
feedstock.170 These small operations represent a lower-cost and potentially lower-risk GTL
alternative to the large-scale facility that Sasol is planning. Small-scale operations may also
match better with the scattered way shale gas is distributed geographically. When infrastructure
cannot keep up with production in these areas, the natural gas could potentially be converted to
fuel using small-scale GTL facilities.171
Velocys anticipates it will be supplying Calumet Specialty Products with 1,000 bbl/d of fuel on-
site in Karns City in Central Pennsylvania.172 In June 2014 Velocys also announced that it had
acquired Houston-based Pinto Energy and with it, Pinto’s plans to construct a $300 million GTL
facility in Ashtabula, Ohio, capable of producing at least 10,000 bbl/d of fuel.173 The plant is
scheduled for completion in 2016. Additional expansions of up to 7,000 bbl/d of fuel and
industrial wax production at this facility will be possible.174
3.6. International Export of Natural Gas
The Natural Gas Act of 1938 states that authorization from the United States Department of
Energy must be granted in order to export or import natural gas to or from a foreign country.175
Shale gas development, and the associated drop in natural gas price due to an oversupply, is
spurring a push to export natural gas to locations abroad. LNG terminals that were intended to
import natural gas just a few years ago are now being converted to export it. The EIA projects
that the U.S. will become a net exporter of natural gas by 2020, and that net exports of natural
gas will total 5.8 tcf in 2040.176 For the first nine months of 2014, natural gas averaged $4.47 per
mmbtu in the United States. Through the process of liquefaction and shipping, final prices for
exported natural gas would rise to $9.14 per mmbtu in the Americas, $9.64 in Europe, and
$11.64 in Asia. For example, Cheniere’s Sabine Pass LNG export facility charges a liquefaction fee
of $3.50 per mmbtu, adds a 15% markup ($5.14), and then charges a transport fee dependent
upon destination ($.50 to the Americas, $1.00 to Europe, and $3.00 to Asia).177 The main
method of exporting natural gas is through a process in which the gas is converted into a liquid
170 Gearino, Dan. “Battelle spinoff taps old idea to turn natural gas into diesel” The Columbus Dispatch 5/3/13. http://www.dispatch.com/content/stories/business/2013/05/03/company-taps-old-idea-to-profit-on-natural-gas.html 171 Kelly-Detwiler, Peter. “Small Gas-To-Liquids Plants Get a Huge Boost” Forbes 3/28/14. 172 Hargreaves, Neville. “Making Distributed Gas to Liquids a Reality” Oxford Catalysts/Velocys 10/4/12. http://www.velocys.com/arcv/press/ppt/SMI%204%20Oct%202012%20Velocys_rev1.pdf 173 “Acquisition of Pinto Energy and Ashtabula GTL Project” Velocys 6/25/14. http://www.velocys.com/financial/nr/nr140625.php 174 Shingler, Dan. “Ashtabula gas-to-liquids plant could be just the first for Ohio company and its Texas partner” Crain’s Business Cleveland 10/4/13. 175 “Natural Gas Regulation” Energy.gov. http://energy.gov/fe/services/natural-gas-regulation 176 “Annual Energy Outlook 2014” U.S. Energy Information Administration 4/14. 177 Shauk, Zain. “U.S. Natural Gas Exports Will Fire Up in 2015” Bloomberg Businessweek 11/6/14. http://www.businessweek.com/articles/2014-11-06/u-dot-s-dot-natural-gas-exports-will-fire-up-in-2015
Mapping the Opportunities for Shale Development in Ohio
Center for Economic Development, Cleveland State University Page 84
through super cooling. This Liquefied Natural Gas (LNG) has a greatly reduced volume, making it
easier to store and export via ship.178
As of December 2014, four LNG export facilities had been approved by the United States Federal
Energy Regulatory Commission (FERC). Three of these are located in the Gulf Coast region:
Cheniere’s Sabine Pass facility in Sabine, Louisiana, Sempra/Cameron’s export terminal in
Hackberry, Louisiana, and the Freeport LNG facility in Freeport, Texas. The first LNG export
facility to receive approval outside of the Gulf Coast region was Dominion’s Cove Point terminal
in Maryland. Cove Point will have a capacity to export the equivalent of 0.82 bcf/d of natural
gas179, and will begin these shipments in 2017.180 The export facility will draw gas from the
Marcellus Shale using Dominion’s existing interstate pipeline network.181
As is the case with natural gas’ viability as a transportation fuel, the possibility of LNG exports
greatly depends on the price of crude oil. As oil prices drop, so too does the likelihood of LNG
exports. This is especially true for exports to Asia, where natural gas prices are frequently linked
to crude oil prices. The LNG export facilities that have already been approved by FERC and are
currently under construction are at an advantage because they have most likely already lined up
long-term contracts with buyers abroad.182 However, United States producers of LNG may not
suffer the same setbacks as producers elsewhere in the world because contracts signed by U.S.
companies are generally linked with domestic natural gas prices in the U.S., not with oil. In
addition, many current and proposed LNG facility projects in the United States involve the
conversion or repurposing of existing LNG import terminals. By utilizing some of the existing
infrastructure, LNG producers can begin exporting more inexpensively.183 Nevertheless, the
drop in oil global oil prices in the fall of 2014 threatens the near term viability of LNG export
economics.
As of 2009, there were 31 locations in the United States where gas was exported to Canada or
Mexico via pipeline. Export capacity to both countries has greatly increased since 1990, to 4.3
bcf/d and 3.6 bcf/d, respectively.184 There are five export points located in the eastern half of
the country: Sault Ste. Marie, Detroit, and St. Clair River (Sarnia) in Michigan; Niagara Falls in
178 “Liquefied Natural Gas: Exports- America’s Opportunity and Advantage” American Petroleum Institute 11/14. http://www.api.org/~/media/files/policy/lng-exports/lng-primer/liquefied-natural-gas-exports-highres.pdf 179 “North American LNG Import/Export Terminals: Approved” Federal Energy Regulatory Commission 12/3/14. http://ferc.gov/industries/gas/indus-act/lng/lng-approved.pdf 180 Chediak, Mark and Polson, Jim. “Dominion Cove Point LNG Terminal Wins Federal Approval” Bloomberg 9/30/14. http://www.bloomberg.com/news/2014-09-30/dominion-cove-point-lng-terminal-wins-federal-approval.html 181 “LNG exports: Marcellus Shale goes global” State Impact 12/18/12. http://stateimpact.npr.org/pennsylvania/tag/lng-exports/ 182 Dlouhy, Jennifer A. “Lower oil prices could pinch natural gas export plants” Houston Chronicle 12/17/14. http://www.houstonchronicle.com/business/energy/article/Lower-oil-prices-could-pinch-natural-gas-export-5964433.php 183 Kelly, Ross. “Oil Plunge Dims Outlook for LNG Projects” NASDAQ 12/11/14. http://www.nasdaq.com/article/oil-plunge-dims-outlook-for-lng-projects-20141211-00054 184 “Natural Gas Import/Export Pipelines” U.S. Energy Information Administration 2009. http://www.eia.gov/pub/oil_gas/natural_gas/analysis_publications/ngpipeline/impex.html
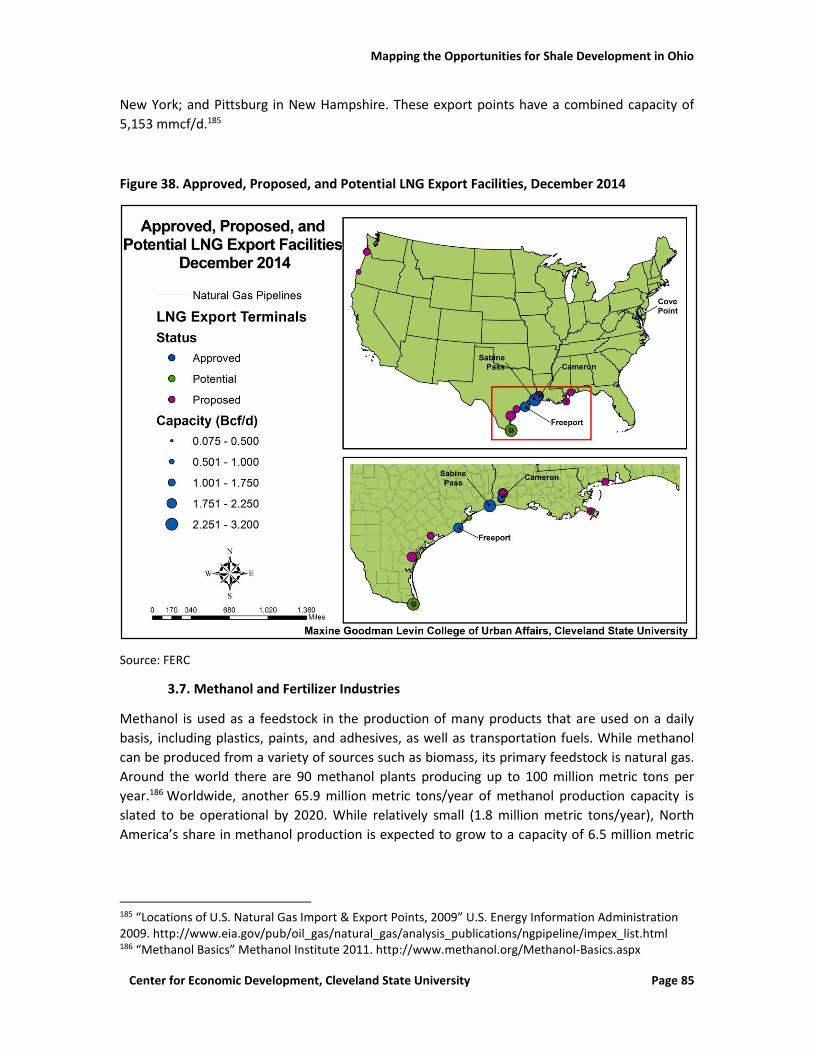
Mapping the Opportunities for Shale Development in Ohio
Center for Economic Development, Cleveland State University Page 85
New York; and Pittsburg in New Hampshire. These export points have a combined capacity of
5,153 mmcf/d.185
Figure 38. Approved, Proposed, and Potential LNG Export Facilities, December 2014
Source: FERC
3.7. Methanol and Fertilizer Industries
Methanol is used as a feedstock in the production of many products that are used on a daily
basis, including plastics, paints, and adhesives, as well as transportation fuels. While methanol
can be produced from a variety of sources such as biomass, its primary feedstock is natural gas.
Around the world there are 90 methanol plants producing up to 100 million metric tons per
year.186 Worldwide, another 65.9 million metric tons/year of methanol production capacity is
slated to be operational by 2020. While relatively small (1.8 million metric tons/year), North
America’s share in methanol production is expected to grow to a capacity of 6.5 million metric
185 “Locations of U.S. Natural Gas Import & Export Points, 2009” U.S. Energy Information Administration 2009. http://www.eia.gov/pub/oil_gas/natural_gas/analysis_publications/ngpipeline/impex_list.html 186 “Methanol Basics” Methanol Institute 2011. http://www.methanol.org/Methanol-Basics.aspx
Mapping the Opportunities for Shale Development in Ohio
Center for Economic Development, Cleveland State University Page 86
tons by 2020.187 In 2012, the global methanol demand was 62 million tons, of which the United
States made up 10%. With shale development causing an abundance of cheap natural gas,
methanol production has become more profitable in North America. In addition, demand for
methanol has increased, insofar as it is considered to be a cleaner-burning fuel.188 The majority
of methanol plants, both existing and proposed, in the United States are located in the Gulf
Coast region.189 As of October 2014 there are no methanol plants in Ohio, and no public
announcements of plans to build any.
Fertilizer production is broken down into three categories by crop nutrients: nitrogen,
phosphorus, and potash. Out of the three, nitrogen-based fertilizer requires natural gas as a
feedstock during production.190 Each ton of fertilizer (ammonia) that is produced requires
roughly 34 mcf of natural gas. The supply of natural gas makes up the largest share of costs
associated with fertilizer production.191 The American Oil & Gas Reporter states that shale gas
development is creating a “renaissance” for nitrogen fertilizer production in the United States,
contrasting the current situation to the period between 1999 and 2007, when capacity was
almost cut in half. It is anticipated that 6 million tons of ammonia will be added to the United
States’ capacity by 2016.192
As of 2012 there were 53 nitrogen fertilizer production sites in 29 states across the U.S.,
represented by 30 companies. Three of these production sites are located in Ohio: Agrium U.S.
Inc. in North Bend (near Cincinnati), PCS Nitrogen Fertilizer, L.P. in Lima, and USX Corporation in
Lorain.193 Agrium’s North Bend facility has a production capacity of 187,393 tons of nitric acid
per year,194 a material that is combined with ammonia to produce ammonium nitrate.195
Because nitric acid production itself requires 0.32 tons of ammonia per ton of nitric acid, the
creation of ammonium nitrate depends heavily on a supply of natural gas.196 Using this figure,
Agrium’s North Bend facility requires 2 bcf/year, or 5.5 mmcf/d of natural gas.
PCS’s facility in Lima has the capacity to produce 661,387 tons of ammonia, 330,693 tons of urea
(a nitrogen fertilizer product that requires .64 tons of ammonia/ton of urea197), 220,462 tons of
nitrogen solutions, and 110,231 tons of nitric acid.198 From ammonia, urea, and nitric acid
187 Morris, Gregory DL. “U.S. Methanol on the Comeback” The American Oil & Gas Reporter 4/13. http://www.aogr.com/web-exclusives/exclusive-story/u.s.-methanol-on-the-comeback 188 Krishnamurthy, Krithika and Mukhopadhyay, Bhaswati. “Analysis: Cheap gas fuels North American methanol expansion” Reuters 3/21/13. http://www.reuters.com/article/2013/03/21/us-methanol-imports-idUSBRE92K14220130321 189 “U.S. Methanol on the Comeback” The American Oil & Gas Reporter. 190 “U.S. Fertilizer Production and Mining Facilities at a Glance” The Fertilizer Institute. 191 “Key Fertilizer Products” Fertilizer101 2013. http://www.fertilizer101.org/science/?storyid=9 192 Morris, Gregory DL. “New Capacity Bolstering Gas Demand” The American Oil & Gas Reporter 2/13. http://www.aogr.com/web-exclusives/exclusive-story/new-capacity-bolstering-gas-demand 193 “U.S. Fertilizer production and Mining Facilities at a Glance” The Fertilizer Institute 194 “Fact Book 2013-2014” Agrium 1/14. http://www.agrium.com/includes/2014_Agrium_Fact_Book.pdf 195 Fertilizer101 “Key Fertilizer Products” 196 “Fact Book 2013-2014” Agrium. 197 “Fact Book 2013-2014” Agrium. 198 “Facilities & Investments: Lima” PotashCorp 2/28/14. http://www.potashcorp.com/about/facilities/nitrogen/lima/
Mapping the Opportunities for Shale Development in Ohio
Center for Economic Development, Cleveland State University Page 87
production, the PCS Lima facility requires 30.9 bcf/year, or 84.6 mmcf/d of natural gas. The Lima
facility is currently undergoing a $190 million expansion, scheduled to come online by late
2015.199 Spurred by the low cost of domestically-produced natural gas, this expansion will
increase ammonia production by about 100,000 tonnes and urea production by 80,000
tonnes.200
4. PROSPECTS FOR OHIO DOWNSTREAM DEVELOPMENT
In the national chemical industry, Ohio is ranked #6 by volume of producing chemicals. The chemical industry comprises the second largest industry of the manufacturing base of Ohio, employing more than 44,000 people with average wages of $73,950, exceeding the average manufacturing wage by 33%. Ohio ships $6.5 billion in chemical products to customers outside the state.201 Plastic products have become a major part of our daily life. We drive vehicles that, on average, contain 350 pounds of polymers. Each light vehicle in North America comes with about 18 pounds of polyethylene, which is more than 5% of total plastic/composites in a car. Our cellular phones are housed in plastic cases that never leave our side. Water bottles have become a part of our daily hydration routine. We are surrounded by microwaves, medical devices, pharmaceuticals, large appliances, food storage containers and wraps, small electronics, computers and a myriad of other products that contain plastics in their essential parts and structural covers. A strong economic base in the chemical industry positions Ohio to provide a large customer base for prospective downstream segments of the oil and gas industry, with a petrochemical cluster at its core. U.S. Production of ethylene – a major component of plastic -- grew from 22,977 thousands of metric tons in 2003 to 25,035 thousands of metric tons in 2013. Just ethane production from U.S. gas plants alone almost doubled since shale development began, growing from 581 thousand barrels per day in December 2008 to 1,087 mbbl/d in May 2015. Between 2014 and 2018, ethylene crackers using ethane will increase their feedstock capacity by nearly 600,000 barrels per day (not accounting for crackers announced in the Appalachian Region).202
199 Brown, Trevor. “Lima, OH- PotashCorp” AmmoniaIndustry.com 1/31/14. http://ammoniaindustry.com/lima-oh-potashcorp/ 200 “Food Matters: 2013 Annual Integrated Report” PotashCorp 2013. http://potashcorp.s3.amazonaws.com/2013_PotashCorp_Annual_Integrated_Report.pdf 201 ACC. http://ex.democracydata.com/ACHEMC/sites/ImpactChem/docs/Ohio.pdf 202 Growing U.S. HGL production spurs petrochemical industry investment. EIA. January 29, 2015. http://www.eia.gov/todayinenergy/detail.cfm?id=19771
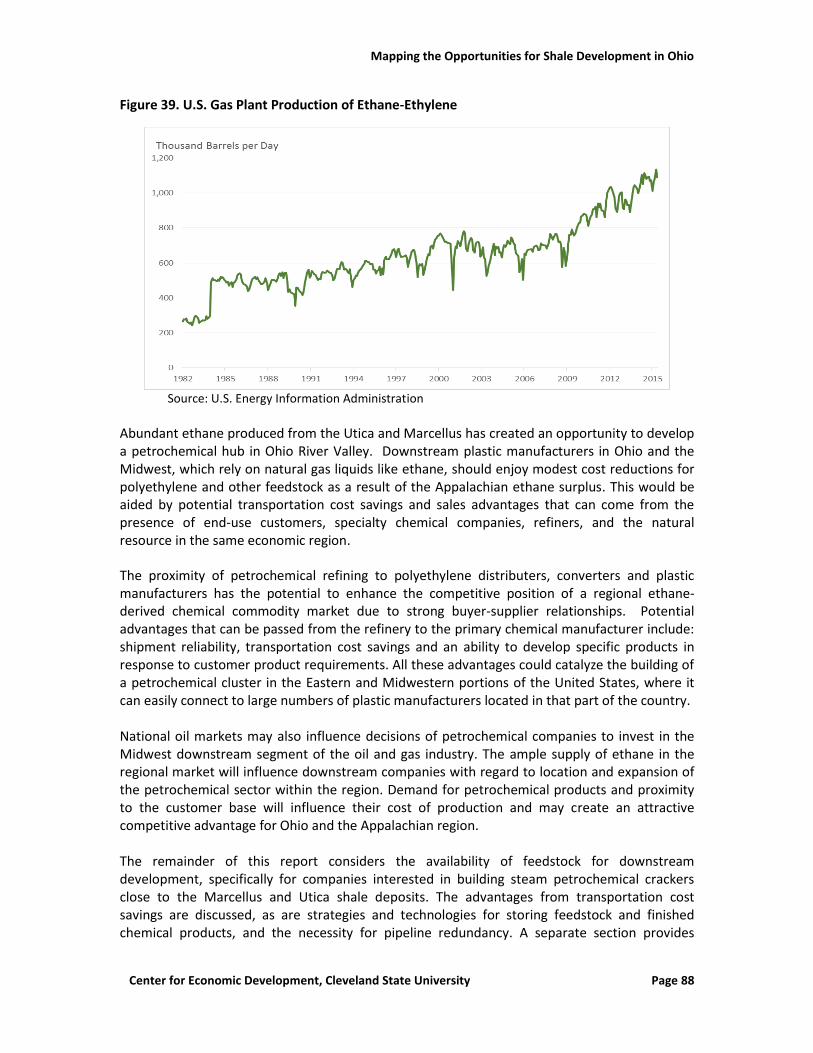
Mapping the Opportunities for Shale Development in Ohio
Center for Economic Development, Cleveland State University Page 88
Figure 39. U.S. Gas Plant Production of Ethane-Ethylene
Source: U.S. Energy Information Administration Abundant ethane produced from the Utica and Marcellus has created an opportunity to develop a petrochemical hub in Ohio River Valley. Downstream plastic manufacturers in Ohio and the Midwest, which rely on natural gas liquids like ethane, should enjoy modest cost reductions for polyethylene and other feedstock as a result of the Appalachian ethane surplus. This would be aided by potential transportation cost savings and sales advantages that can come from the presence of end-use customers, specialty chemical companies, refiners, and the natural resource in the same economic region. The proximity of petrochemical refining to polyethylene distributers, converters and plastic manufacturers has the potential to enhance the competitive position of a regional ethane-derived chemical commodity market due to strong buyer-supplier relationships. Potential advantages that can be passed from the refinery to the primary chemical manufacturer include: shipment reliability, transportation cost savings and an ability to develop specific products in response to customer product requirements. All these advantages could catalyze the building of a petrochemical cluster in the Eastern and Midwestern portions of the United States, where it can easily connect to large numbers of plastic manufacturers located in that part of the country. National oil markets may also influence decisions of petrochemical companies to invest in the Midwest downstream segment of the oil and gas industry. The ample supply of ethane in the regional market will influence downstream companies with regard to location and expansion of the petrochemical sector within the region. Demand for petrochemical products and proximity to the customer base will influence their cost of production and may create an attractive competitive advantage for Ohio and the Appalachian region. The remainder of this report considers the availability of feedstock for downstream development, specifically for companies interested in building steam petrochemical crackers close to the Marcellus and Utica shale deposits. The advantages from transportation cost savings are discussed, as are strategies and technologies for storing feedstock and finished chemical products, and the necessity for pipeline redundancy. A separate section provides
Mapping the Opportunities for Shale Development in Ohio
Center for Economic Development, Cleveland State University Page 89
information on the role of long term contracts in securing feedstock for downstream development. The discussion of the supply side of regional markets is complemented by addressing the potential regional demand for ethylene-based chemical manufacturing operations located in the region. This analysis is continued with an explanation of the economics of petrochemical feedstock in the oil and gas downstream sector. The section concludes by illustrating promising industry interactions that can foster development, and then by considering the timing of investment decisions required for Ohioans to see substantial benefits from the development of the state’s oil and gas resources.
4.1 Regional Market for Oil and Gas Products
A number of supply and demand factors will affect further development of the Utica shale and the downstream segment of the oil and gas industry. An understanding of how decisions are made by companies looking to invest in mid and downstream businesses is the first step to evaluating the potential for the development of petrochemical industries in Ohio. Prices for oil and its derivative products are set by supply and demand conditions on global markets. Those prices are influenced by a number of national oil companies as well as large transnational companies that refine and market oil, such as ExxonMobil, Shell, BP, Chevron, and TOTAL. The Utica and Marcellus, on the other hand, are being developed by a different group of mid-sized independent oil and gas companies. Moreover, the markets for natural gas and natural gas liquids, while being constrained by global price movements in both gas and oil, are more regional in terms of end-use markets. The Utica, being rich in natural gas and natural gas liquids, may provide these companies with an opportunity to mitigate the effects of falling oil prices by expanding their operations into natural gas development and into downstream market opportunities in heating, electricity generation, and industrial consumer plastics. The regional nature of the natural gas market is primarily due to the reliance upon local infrastructure, which controls the cost and complexity of transporting natural gas. The most important market for local natural gas producers are spot markets. Even when long-term contracts can be negotiated, prices are commonly tied to some regional spot market. The investment decisions of large vertically integrated international exploration and production (E&P) companies account for most of the product development chain (E&P, midstream, downstream and frequently product distribution) will often make decisions based upon the total profitability of the company. Accordingly, they could make investments that might not appear at first blush to be attractive based upon local factors alone. An integrated company may, for instance, find that low oil and gas prices benefit its downstream product prices. Smaller companies that operate only in E&P or are integrated only across E&P and midstream operations may be more affected by the falling oil prices. Moreover, with a smaller scale in operations, these companies typically have less equity and profit margin for price risk protection. Mid-sized companies can take advantage of the geographic proximity of the supply of NGLs in the Appalachian basin and end-users. The density of both population and industry in the industrial Northeast, Midwest, and upper South creates a regionalized pool of demand and potential competitive advantage. However, existing petrochemical hubs in the Gulf Coast region announced a number of expansion projects benefiting from existing pipeline and storage
Mapping the Opportunities for Shale Development in Ohio
Center for Economic Development, Cleveland State University Page 90
infrastructure.203 At the same time, due to a significant amount of valuable petrochemical feedstock now being required in Northeastern United States, and due to the proximity to manufacturing customers therewith, a number of companies were targeting new ethane refining locations within the ethane-rich Marcellus-Utica region. A few companies have decided that it might be feasible to locate petrochemical operations in the Appalachian basin region. The reasons for these decisions included an assessment of likely regional feedstock advantages and the existing regional petrochemical product demand. As of 2015, those companies include: Shell Chemical LP (a subsidiary of Royal Dutch Shell PLC); the Brazilian company Braskem together with The Appalachian Shale Cracker Enterprise LLC, a subsidiary of Brazilian-based Odebrecht; PTT Global, a company headquartered in Thailand, along with a Japanese investment company, Marubeni Corporation; and Houston-based Appalachian Resins, Inc. It is only after each company made its decision that a cracker may be feasible in the region, did the site-selection process come into play.
The petrochemical companies considered additional factors for the location of ethane crackers.
While choosing a site for an ethane cracker, Shell indicated that it was looking “at various
factors to select the preferred site, including good access to liquids-rich natural gas resources;
water, road and rail transportation infrastructure; power grids; economics; and sufficient
acreage to accommodate facilities for a world-scale petrochemical complex and potential future
expansions.”204 The result was the selection of an industrial site on the Ohio River northwest of
Pittsburgh. The following discussion addresses the more important of these factors.
4.2. Availability of Feedstock
Ethylene makes up approximately 80% of the products derived from ethane cracking. The
availability of only one principal product on the back end of ethane crackers increases the
investment risk because the investment is large, the plant is inflexible, and the company is
selling into only one product market. Ethylene can also be produced from propane cracking,
which renders a product consisting of approximately 30% ethylene. Ethane cracking is, as a
result, the preferable procedure to produce ethylene, especially since cracking heavier
feedstock (including oil) requires heavier, larger and more expensive equipment, producing
smaller quantities of the products.
The four announced cracker construction projects in the tri-state region have envisioned
ethylene production from ethane. Usually it takes about 5 years to build a cracker plant from
the engineering phase to the starting date of operations. It takes from 1 to 3 years to identify
the opportunity, undertake the financial and risk analysis, select a site, and engineer and design
the plant. Common hindrances that run parallel with selection and assessment include securing
the ethane supply, receiving some form of purchase commitments from customers, and
203 Comparably cheap and available capital during the recovery from the financial recession of 2007-2009 has enabled companies to commit to a number of new and expansion projects in the petrochemical industry. While ethane refining projects must compete with other oil and gas capital-intensive projects, the Study Team looked closely only at potential for expansions for ethane processing capacity, due to the potential for a large and long term supply of that product in the region. A list of committed projects as of the spring of 2005 are listed in Appendix Table C-1. 204 Adam Burns, Site Selection, March 2012, http://www.siteselection.com/theEnergyReport/2012/mar/petrochemicals.cfm?s=ra
Mapping the Opportunities for Shale Development in Ohio
Center for Economic Development, Cleveland State University Page 91
obtaining all necessary permits. In addition, each company will regularly assess the market and
adjust its plans in response to changes in the world market and the actions and investments of
its competitors.
Royal Dutch Shell of Monaca (Beaver County, PA) has been developing plans to build a $3 billion
ethane cracker in that region for four years. In 2012, Shell announced it was considering a site at
a former zinc smelter facility in Potter Township, Beaver County, for an ethane cracker. The
State of Pennsylvania offered state tax credits and committed to pay the costs of cleaning up the
site. The final investment decision on the project has not been announced as of early Fall
2015.205 If completed, the cracker is projected to take approximately 105 thousand barrels a day
(mbbl/d) of ethane and crack it into ethylene.206
Since the Pittsburgh area does not meet EPA clean air standards for particulate pollution and
ground level ozone, Shell must demonstrate that its plant would not make the region’s air
quality worse. The company will have to purchase air pollution reduction credits from other
facilities in the region and use the best available pollution control technologies to meet its
permit requirements.207
Shell officials believe this project could create 10,000 construction jobs and 400 permanent
operational jobs, while producing 1.6 million tons of polyethylene pellets per year to be used for
manufacturing plastics, tires, antifreeze and other products.208
The Brazilian company Braskem and the Appalachian Shale Cracker Enterprise LLC, a subsidiary
of Brazilian-based Odebrecht, have been planning to build an ethane cracker, three
polyethylene plants (plus associated infrastructure for water treatment and energy co-
generation) on a 363-acre property near Parkersburg, (Wood County), WV. If built, the $5
billion209 ASCENT plant would use about 60 mbbl/d of ethane, and would permanently employ
about 325 operational workers.
205 Marcellus Drilling News, http://marcellusdrilling.com/2014/11/shell-finally-buys-site-for-cracker-plant-in-beaver-county-pa/ 206 Anya Litvak, Pittsburgh Post-Gazette. November 7, 2014, http://powersource.post-gazette.com/powersource/companies-powersource/2014/11/07/Shell-to-buy-Horsehead-plant-in-Beaver-County/stories/201411070073. 207 According to Mark Gorog of DEP’s Bureau of Air Quality. The plant will be permitted to release 30.5 tons of hazardous air pollutants, as well as hundreds of tons of particulate matter and volatile organic compounds, according to the DEP. The plant will be permitted to emit 2.248 million tons of carbon dioxide equivalent. Found in: “Shell’s cracker air emissions plan gets hearing,” State Impact, May 6, 2015. http://stateimpact.npr.org/pennsylvania/2015/05/06/shells-cracker-air-emissions-plan-gets-hearing/ 208 “Shale Play, Pennsylvania to issue air permit for planned ethane cracker plant,” March 29, 2015. http://shaleplayohiovalley.com/page/content.detail/id/511204/Pennsylvania-to-Issue-Air-Permit-for-Planned-Ethane-Cracker-Plant.html?nav=5005#sthash.Zs4DeFZV.dpuf, retrieved April 14, 2015. 209 “Some sources claim the cost of the project at #3.8 billion,” The Business Journal, Youngstown, Ohio, April 27, 2015, http://businessjournaldaily.com/appalachian-resins-ceo-says-small-cracker-moving-forward/
Mapping the Opportunities for Shale Development in Ohio
Center for Economic Development, Cleveland State University Page 92
Lately, multiple publications have quoted Braskem America CEO Fernando Musa to the effect
that Braskem is re-evaluating its plans for developing the proposed plant.210 The steep decline
in crude oil prices has made Appalachian ethane less attractive to chemical companies; the
advantage of producing ethylene from NGL versus from naphtha was $600 per metric ton before
oil prices collapsed. In the spring of 2015 the spread was only $150 per metric ton. One option
for Braskem is that the company might reconfigure its plant to crack both ethane and propane
as opposed to ethane only. Regardless, it is unlikely that a plant will start up before 2020,
according to Mr. Musa.211
In spring 2015, Thailand’s biggest chemical company, PTT Global, and a Japanese investment
company, Marubeni Corp., confirmed their intentions to build a $5.7 billion dollar ethane
cracker in the Appalachian basin. Officials believe the project could create thousands of
temporary jobs during the construction phase and hundreds of full-time permanent jobs once it
is online. The partnership has selected a site in Belmont County, Ohio as the prospective site of a
one-million-ton olefin cracker that will use ethane from the Marcellus and Utica shale as
feedstock.
The Thai/Japanese partnership is expected to make a final investment decision on the Belmont
County ethane cracker by 2016, spending about $150 million over the next few years to
determine the viability of the project. The company is looking to select one of five potential
partners that are interested in the project to jointly invest in a propylene oxide project in
Thailand with an estimated cost of about $1 billion and capacity of 200,000 tons a year. PTT
Global, one of the world's top 10 ethylene makers, has set an investment budget of $4.5 billion
for 2015-2019.212 If built, this facility may take approximately 35-40 mbbl/d of ethane.
A fourth potential cracker for the Marcellus-Utica region has been announced by Houston-based
Appalachian Resins, Inc. (AR). AR hopes to build a cracker in the Appalachian basin to take
advantage of both the proximity of the feedstock and the polyethylene downstream market,
much of which can be found within a 500-mile radius. As of May 2015, AR planned to lease
approximately 50 acres of land in Salem Township (Monroe County), Ohio, to build an
integrated 600 million pound-per-year ethylene/polyethylene production facility. AR would
require about 18 mbbl/d for this $1.3 billion integrated facility, and would produce different
grades of ethylene switching between HDPE and LLDPE. The company projects to permanently
employ 125 people, and intends to improve regional rail facilities to facilitate a more efficient
supply chain. AR positions this plant as “less than world-scale.” AR’s proposed financial model
210 HIS Chemical Week, April 15, 2015. http://www.chemweek.com/home/top_of_the_news/69458.html; Energy Inc. April 21, 2015, http://www.bizjournals.com/pittsburgh/blog/energy/2015/04/west-virginia-ethane-cracker-project-postponed.html?ana=e_pit_nrg&u=/nn4SOaHmim+Om/Ks6Ga7Q019c0f34&t=1427828611 211 Id. 212 Columbus Business First, April 20, 2015, http://www.bizjournals.com/columbus/blog/2015/04/exclusive-thai-company-has-eyes-on-ohio-for.html; May 18, 2015, http://www.bizjournals.com/columbus/blog/ohio-energy-inc/2015/05/ohio-cracker-plants-backers-seeking-3rd-partner.html; Reuters Africa, May 15, 2015, http://af.reuters.com/article/energyOilNews/idAFL3N0Y64QZ20150515; Shale Play, April 30, 2015, http://shaleplayohiovalley.com/page/content.detail/id/511238/Ethane-Cracker-Plant-in-Belmont-County-Would-Add-Pollution-to-Ohio-Valley.html#sthash.fkirHkHV.dpuf.

Mapping the Opportunities for Shale Development in Ohio
Center for Economic Development, Cleveland State University Page 93
resembles that used by pipeline companies, operating on a “tariff” basis. The $400 million
polyethylene plant will operate based on long-term contracts with the co-located ethylene
plant. 213
The cumulative ethane cracking capacity of the four announced crackers adds up to about 223
mbbl/d, as early as 2020. As set forth in Section 2 above, industry ethane production
projections (spring 2015) for the wet gas regions of the Utica and the Marcellus for 2020 is
anticipated to be around 638 mbbl/d by 2020 (assuming 20% ethane rejection).214 So the
crackers, if all built, would use around one-third of the locally available ethane. Importantly, at
least two of the prospective petrochemical companies have indicated that they have secured
significant amounts of feedstock through long-term contracts with regional producing and
midstream companies.215 This speaks to the confidence producers and midstream companies
have that Marcellus and Utica wet gas drilling and midstream infrastructure can be ramped up
to accommodate greater volume requirements.
Ethane prices have been historically more closely associated with natural gas than with oil or
gasoline prices, unlike other natural gas liquids (Figure 40). This is primarily due to the fact that
the alternative market for ethane is usually rejection – meaning it is sold along with methane. It
is also due to the fact that ethane has the same fundamental issues that methane has with
regard to storage and transportation: marketing ethane requires more careful planning than
other NGLs and an extensive pipeline system.
Figure 40. Natural Gas Liquids Spot Prices
Source: EIA. August 19, 2015.
213 APAG, accessed 4/28/2015, http://apeg.com/tag/appalachian-resins/ and Plastic News, 02/08/2013, http://www.plasticsnews.com/article/20130208/NEWS/130209931/new-west-virginia-polyethylene-plant-would-target-shale-gas. 214 See supra p. 57. Note also that there may be processing and fractionation constraints on the total available production, and that there will also be around 460 mbbl/d take away capacity. See following section. 215 Oil and Gas Journal, March 28, 2014. http://www.ogj.com/articles/2014/03/ethane-supply-secured-for-proposed-w-va-ethylene-cracker.html
Mapping the Opportunities for Shale Development in Ohio
Center for Economic Development, Cleveland State University Page 94
Almost 100% of the ethane production in the U.S. and Canada is processed from natural gas.
About 75% of NGLs in the U.S. is produced from natural gas (about 60% is, globally). The rest
comes from processing oil.
Since 2009, expanding shale development has brought much larger volumes of ethane to the
marketplace. However comparatively modest growth in plastic manufacturing, the primary
consumer of ethane, has not created significant new demand. Moreover, more efficient gas
producing technologies have been deployed in shale basins, further increasing production, while
operators have shifted away from dry gas into price-premium NGL plays, causing yet more
ethane to be brought into the market. The result has been a significant decrease in ethane
prices. This issue became more profound for Appalachian Basin producers who have been
realizing a relatively high content of ethane in their production, no local outlet for ethane, and
limited pipeline infrastructure for take-away capacity.
Technologies to process natural gas vary from the less efficient -- those deployed in “lean oil”
plants -- to the ultra-efficient -- those that deploy cryogenic processes. Using oil plants to
recover NGLs is the least efficient method for recovery of ethane; recovery is typically about 15-
30% of available ethane. Oil plants are, however, more efficient for propane (65-75%), butanes
and C5+ (99%) extraction from NGLs.
The most efficient strategy – and the one employed in the Appalachian basin – is the use of
cryogenic plants. These plants can recover nearly 100% of propane, butane and C5+
hydrocarbons, and can also recover about 85-90% ethane. The latter plants are also the more
expensive to build.
Natural gas liquids require special conditions for transportation and storage. The liquid state
requires the maintenance of high pressure and low temperatures. The liquids are highly
flammable and require special trucks, ships, and storage facilities made from enhanced steel
and insulation.
The decision to extract ethane must account for transportation and fractionation (T&F) costs
incurred subsequent to cryogenic processing (extracting NGLs from the natural gas stream). The
so-called “frac spread” (the difference between the revenue received from selling
undifferentiated NGLs and the value received from selling purity products, such as ethane,
propane, butane, and natural gasoline) may vary by as much as $2/mmbtu. In 2012, for
example, T&F costs reduced the actual price of ethane realized from $2.50/mmbtu to
$0.59/mmbtu between Kansas and Wyoming.
Importantly, the largest T&F costs in the lower 48 states for delivery of ethane to the nearest
hub is associated with the Marcellus and Utica: T&F costs from the Appalachian Basin to Mont
Belvieu are around $0.28-0.30/gal. Of this cost, transportation is most significant for the
Utica/Marcellus. In 2013/14 the Marcellus and Utica basin had the highest ethane delivery cost
to cracker facilities among U.S. shale plays ($0.15/gal). Between transportation costs, a lack of
pipeline take-away capacity, and a lack of local markets, ethane rejection will likely continue
until at least 2018. Of course, saving these high transportation costs is a motive for building
cracker facilities in the Appalachian Basin region and for serving the dense network of customers
that are already located in the region.
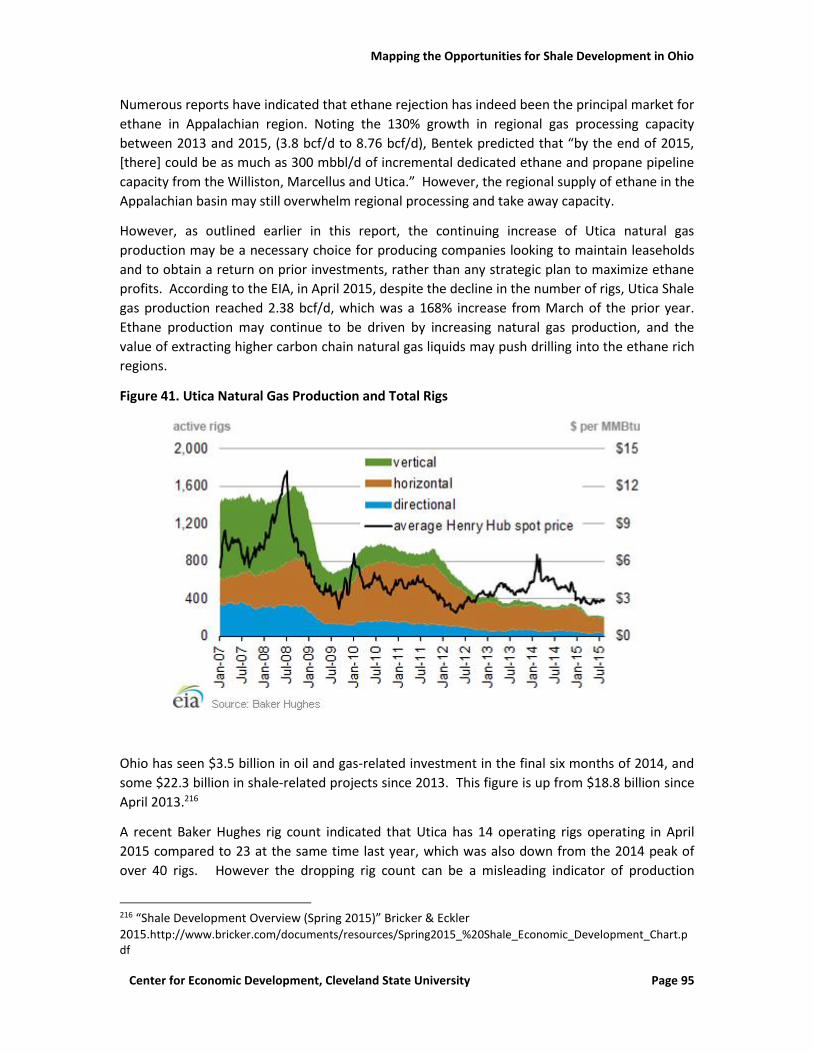
Mapping the Opportunities for Shale Development in Ohio
Center for Economic Development, Cleveland State University Page 95
Numerous reports have indicated that ethane rejection has indeed been the principal market for
ethane in Appalachian region. Noting the 130% growth in regional gas processing capacity
between 2013 and 2015, (3.8 bcf/d to 8.76 bcf/d), Bentek predicted that “by the end of 2015,
[there] could be as much as 300 mbbl/d of incremental dedicated ethane and propane pipeline
capacity from the Williston, Marcellus and Utica.” However, the regional supply of ethane in the
Appalachian basin may still overwhelm regional processing and take away capacity.
However, as outlined earlier in this report, the continuing increase of Utica natural gas
production may be a necessary choice for producing companies looking to maintain leaseholds
and to obtain a return on prior investments, rather than any strategic plan to maximize ethane
profits. According to the EIA, in April 2015, despite the decline in the number of rigs, Utica Shale
gas production reached 2.38 bcf/d, which was a 168% increase from March of the prior year.
Ethane production may continue to be driven by increasing natural gas production, and the
value of extracting higher carbon chain natural gas liquids may push drilling into the ethane rich
regions.
Figure 41. Utica Natural Gas Production and Total Rigs
Ohio has seen $3.5 billion in oil and gas-related investment in the final six months of 2014, and
some $22.3 billion in shale-related projects since 2013. This figure is up from $18.8 billion since
April 2013.216
A recent Baker Hughes rig count indicated that Utica has 14 operating rigs operating in April
2015 compared to 23 at the same time last year, which was also down from the 2014 peak of
over 40 rigs. However the dropping rig count can be a misleading indicator of production
216 “Shale Development Overview (Spring 2015)” Bricker & Eckler 2015.http://www.bricker.com/documents/resources/Spring2015_%20Shale_Economic_Development_Chart.pdf
Mapping the Opportunities for Shale Development in Ohio
Center for Economic Development, Cleveland State University Page 96
activity. A big reason for the decreased rig count is attributable to the marked increased Utica’s
drilling productivity. Producers have not only been optimizing production strategies as they
learn about the Utica, they have also been drilling increasingly longer laterals in each well,
thereby dramatically improving per well recovery rates. The typical well in the Utica was
producing around 6.1 mmcf/d in April 2015 -- an improvement of 108% over the prior 12
months. This increasing supply of natural gas and ethane, together with a potential ethane take
away capacity shortfall, have created a positive outlook for building new cracking capacity
within the region.
HIS Chemical’s experts have postulated that since Shell already owns and operates four U.S.
steam crackers and associated plants in Deer Park (TX) and Norco (LA), Shell’s cracker planned in
Pennsylvania will be a commercial success. HIS Chemical has suggested that due to the absence
of storage facilities in the region and a need for increased reliability of feedstock, there is a need
for at least two Appalachian-based crackers. Their experts have indicated that the Appalachian
basin represents the classical “trapped ethane problem” where solutions are to either build a
cracker on site and ship derivatives, or to build new pipeline capacity to transport the ethane, or
both.
While the ability to secure feedstock is an important factor in site selection decisions for
cracking facilities, there are two other frequently-posed questions by suppliers, economic
development organizations, and governments: 1) might the completion of multiple pipeline
projects, which enhance the take-away capacity of ethane, jeopardize the supply of the
feedstock for the prospective crackers? And, 2) how might the deficiency of traditional
petrochemical industry infrastructure (i.e. storage facilities and connecting pipelines) affect the
prospects of developing a petrochemical cluster?
4.3. Transportation, Storage, and Pipeline Redundancy
In the United States, the majority of Natural Gas Liquids are transported by pipeline. However,
when pipeline capacity is limited, NGLs can be transported via truck or rail. Heavier NGLs are
more likely to be transported in this manner. Ethane’s high vapor pressure, on the other hand,
inhibits its ability to be transported economically by truck or rail.217 As a result, delivery of
ethane can be problematic for both the producing companies and the end users that rely upon
it. Neither the transportation nor the storage of ethane is simple.
The construction of a downstream oil and gas industry should enable the region to realize
significant transportation cost advantages. As noted by PolymerOhio in a recent study, “[t]he
logistic advantage for a regional cracker is based on avoiding the ethane pipeline transportation
costs to the gulf coast and the subsequent freight cost of shipping the polymer back to the Ohio
region.”218 This advantage will inure primarily to the owners of the crackers and presumably
217 The process of transporting Marcellus produced ethane to the Gulf Coast on a converted LNG cargo ship is also being explored by midstream companies. See “Natural Gas Liquids (NGLs)” Resource & Supply Task Group 9/15/11. 218 Impact Assessment of Shale Gas Development on Investment and Growth in Ohio’s Polymer Industry. PolymerOhio Inc. September 2014. P.20.

Mapping the Opportunities for Shale Development in Ohio
Center for Economic Development, Cleveland State University Page 97
some portion of this cost savings will be passed down to their customer chain as part of the
cracker’s competitive advantage over more distant companies. The annual transportation and
logistics savings generated by one regional world-class cracker is anticipated to be in a range of
$100 million.219 However this savings in transportation cost for ethane/ethylene may be offset in
part by a lack of ethane storage facilities in the Midwest.
Storage and transportation of ethane ends up being similar to that for methane, except that
there is much less infrastructure dedicated to ethane. The more commonly known strategies for
storing natural gas involve pumping gas into natural gas storage facilities. Storage for ethane is
needed for the same reasons it is needed for methane: it serves as an insurance against
unexpected market events, such as interruptions in production, pipeline mechanical failure, and
natural disasters, and, to a lesser extent, weather-related consumption spikes. Both capacity
and location of the facility are important to avoid supply interruption.220
As of December 2013, total United States domestic natural gas storage capacity was over 9,100
bcf,221 located in more than 400 facilities across the country.222 There are three types of natural
gas storage facilities: depleted natural gas reservoirs, aquifers, and salt caverns. Depleted
natural gas reservoirs make up the largest share of storage in the United States, at over 80%,
and also comprise the majority of facilities in the Appalachian region. Natural gas storage can
be graded based on its rate of deliverability, or how fast gas can be withdrawn, and its cycling
capability, or the speed at which natural gas can be injected into/ withdrawn from storage.
Because gas generally flows through pipelines at 15 miles per hour, it can take days to reach an
intended destination. For this reason, storage facilities located near market areas are the most
valuable.223
219 Id. 220 “C. Mitchell, “Catch a Hydrocarbon, Put it in Your Cavern, Save It for a Wintry Day,” RBN Energy, LLC, April 8, 2013, found at: https://rbnenergy.com/catch-a-hydrocarbon-put-it-in-your-cavern-save-it-for-a-wintry-day-natural-gas-storage 221 “Oil & Natural Gas Transportation & Storage Infrastructure: Status, Trends, & Economic Benefits” IHS Global Inc. 12/13. 222 “Energy: Securing Our Natural Gas Supply Chain” American Petroleum Institute. 223 “Energy Primer: A Handbook of Energy Market Basics” Office of Enforcement, Federal Energy Regulatory Commission 7/12. Salt cavern storage is also found in Ohio. Most aquifer storage in the United States exists west of Ohio. This type of storage is the most expensive of the three because the “base gas” required is over 50% of the total gas in storage. Base gas is that amount of gas permanently required in a reservoir to maintain adequate pressure and the ability to withdraw the “working” gas. Id.
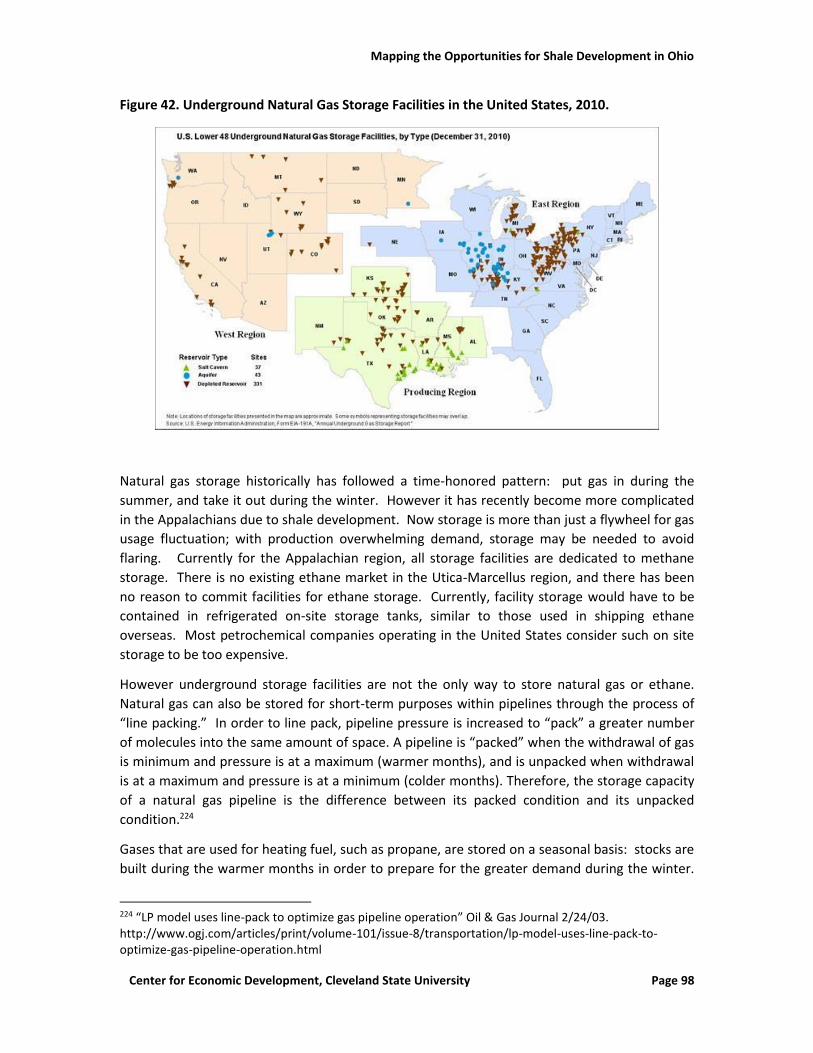
Mapping the Opportunities for Shale Development in Ohio
Center for Economic Development, Cleveland State University Page 98
Figure 42. Underground Natural Gas Storage Facilities in the United States, 2010.
Natural gas storage historically has followed a time-honored pattern: put gas in during the
summer, and take it out during the winter. However it has recently become more complicated
in the Appalachians due to shale development. Now storage is more than just a flywheel for gas
usage fluctuation; with production overwhelming demand, storage may be needed to avoid
flaring. Currently for the Appalachian region, all storage facilities are dedicated to methane
storage. There is no existing ethane market in the Utica-Marcellus region, and there has been
no reason to commit facilities for ethane storage. Currently, facility storage would have to be
contained in refrigerated on-site storage tanks, similar to those used in shipping ethane
overseas. Most petrochemical companies operating in the United States consider such on site
storage to be too expensive.
However underground storage facilities are not the only way to store natural gas or ethane.
Natural gas can also be stored for short-term purposes within pipelines through the process of
“line packing.” In order to line pack, pipeline pressure is increased to “pack” a greater number
of molecules into the same amount of space. A pipeline is “packed” when the withdrawal of gas
is minimum and pressure is at a maximum (warmer months), and is unpacked when withdrawal
is at a maximum and pressure is at a minimum (colder months). Therefore, the storage capacity
of a natural gas pipeline is the difference between its packed condition and its unpacked
condition.224
Gases that are used for heating fuel, such as propane, are stored on a seasonal basis: stocks are
built during the warmer months in order to prepare for the greater demand during the winter.
224 “LP model uses line-pack to optimize gas pipeline operation” Oil & Gas Journal 2/24/03. http://www.ogj.com/articles/print/volume-101/issue-8/transportation/lp-model-uses-line-pack-to-optimize-gas-pipeline-operation.html
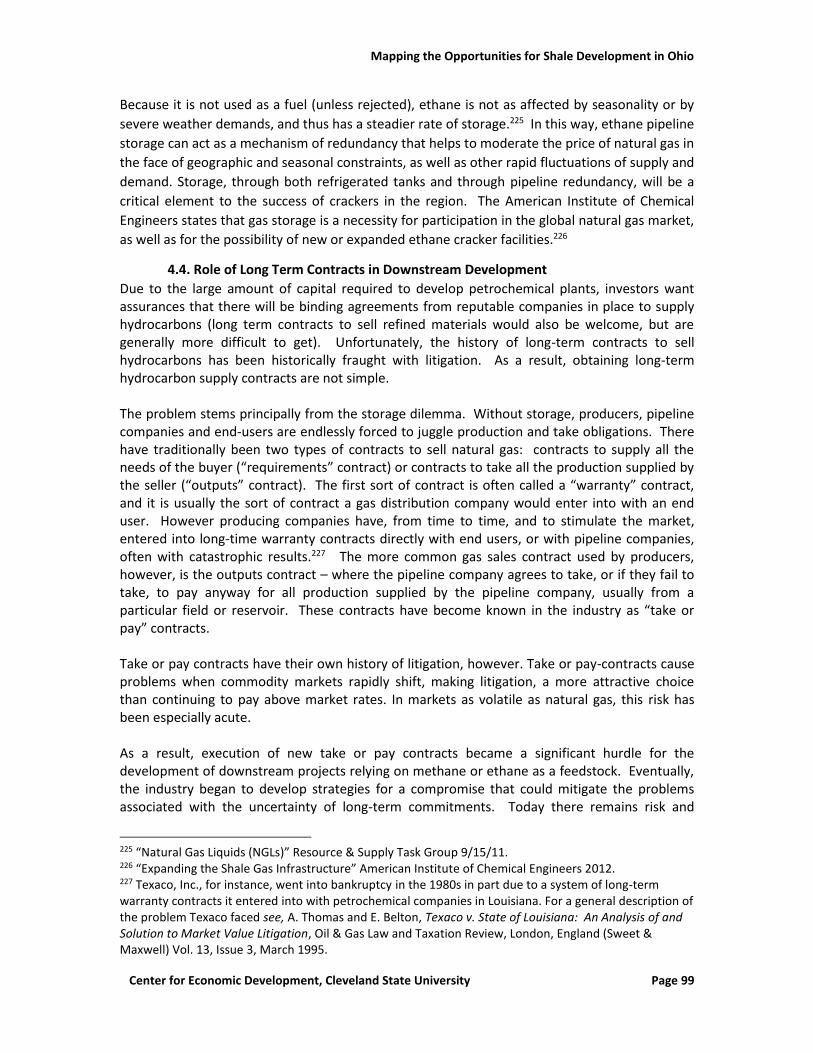
Mapping the Opportunities for Shale Development in Ohio
Center for Economic Development, Cleveland State University Page 99
Because it is not used as a fuel (unless rejected), ethane is not as affected by seasonality or by
severe weather demands, and thus has a steadier rate of storage.225 In this way, ethane pipeline
storage can act as a mechanism of redundancy that helps to moderate the price of natural gas in
the face of geographic and seasonal constraints, as well as other rapid fluctuations of supply and
demand. Storage, through both refrigerated tanks and through pipeline redundancy, will be a
critical element to the success of crackers in the region. The American Institute of Chemical
Engineers states that gas storage is a necessity for participation in the global natural gas market,
as well as for the possibility of new or expanded ethane cracker facilities.226
4.4. Role of Long Term Contracts in Downstream Development
Due to the large amount of capital required to develop petrochemical plants, investors want assurances that there will be binding agreements from reputable companies in place to supply hydrocarbons (long term contracts to sell refined materials would also be welcome, but are generally more difficult to get). Unfortunately, the history of long-term contracts to sell hydrocarbons has been historically fraught with litigation. As a result, obtaining long-term hydrocarbon supply contracts are not simple. The problem stems principally from the storage dilemma. Without storage, producers, pipeline companies and end-users are endlessly forced to juggle production and take obligations. There have traditionally been two types of contracts to sell natural gas: contracts to supply all the needs of the buyer (“requirements” contract) or contracts to take all the production supplied by the seller (“outputs” contract). The first sort of contract is often called a “warranty” contract, and it is usually the sort of contract a gas distribution company would enter into with an end user. However producing companies have, from time to time, and to stimulate the market, entered into long-time warranty contracts directly with end users, or with pipeline companies, often with catastrophic results.227 The more common gas sales contract used by producers, however, is the outputs contract – where the pipeline company agrees to take, or if they fail to take, to pay anyway for all production supplied by the pipeline company, usually from a particular field or reservoir. These contracts have become known in the industry as “take or pay” contracts. Take or pay contracts have their own history of litigation, however. Take or pay-contracts cause problems when commodity markets rapidly shift, making litigation, a more attractive choice than continuing to pay above market rates. In markets as volatile as natural gas, this risk has been especially acute. As a result, execution of new take or pay contracts became a significant hurdle for the development of downstream projects relying on methane or ethane as a feedstock. Eventually, the industry began to develop strategies for a compromise that could mitigate the problems associated with the uncertainty of long-term commitments. Today there remains risk and
225 “Natural Gas Liquids (NGLs)” Resource & Supply Task Group 9/15/11. 226 “Expanding the Shale Gas Infrastructure” American Institute of Chemical Engineers 2012. 227 Texaco, Inc., for instance, went into bankruptcy in the 1980s in part due to a system of long-term warranty contracts it entered into with petrochemical companies in Louisiana. For a general description of the problem Texaco faced see, A. Thomas and E. Belton, Texaco v. State of Louisiana: An Analysis of and Solution to Market Value Litigation, Oil & Gas Law and Taxation Review, London, England (Sweet & Maxwell) Vol. 13, Issue 3, March 1995.
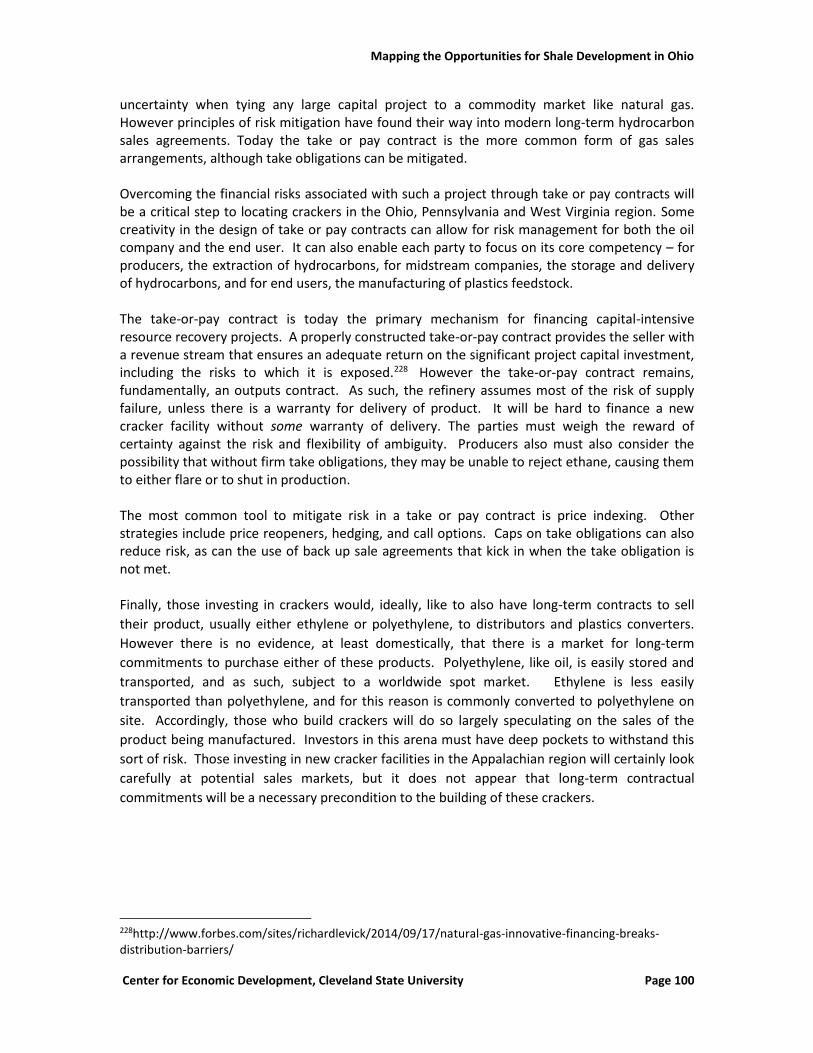
Mapping the Opportunities for Shale Development in Ohio
Center for Economic Development, Cleveland State University Page 100
uncertainty when tying any large capital project to a commodity market like natural gas. However principles of risk mitigation have found their way into modern long-term hydrocarbon sales agreements. Today the take or pay contract is the more common form of gas sales arrangements, although take obligations can be mitigated. Overcoming the financial risks associated with such a project through take or pay contracts will be a critical step to locating crackers in the Ohio, Pennsylvania and West Virginia region. Some creativity in the design of take or pay contracts can allow for risk management for both the oil company and the end user. It can also enable each party to focus on its core competency – for producers, the extraction of hydrocarbons, for midstream companies, the storage and delivery of hydrocarbons, and for end users, the manufacturing of plastics feedstock. The take-or-pay contract is today the primary mechanism for financing capital-intensive resource recovery projects. A properly constructed take-or-pay contract provides the seller with a revenue stream that ensures an adequate return on the significant project capital investment, including the risks to which it is exposed.228 However the take-or-pay contract remains, fundamentally, an outputs contract. As such, the refinery assumes most of the risk of supply failure, unless there is a warranty for delivery of product. It will be hard to finance a new cracker facility without some warranty of delivery. The parties must weigh the reward of certainty against the risk and flexibility of ambiguity. Producers also must also consider the possibility that without firm take obligations, they may be unable to reject ethane, causing them to either flare or to shut in production. The most common tool to mitigate risk in a take or pay contract is price indexing. Other strategies include price reopeners, hedging, and call options. Caps on take obligations can also reduce risk, as can the use of back up sale agreements that kick in when the take obligation is not met. Finally, those investing in crackers would, ideally, like to also have long-term contracts to sell
their product, usually either ethylene or polyethylene, to distributors and plastics converters.
However there is no evidence, at least domestically, that there is a market for long-term
commitments to purchase either of these products. Polyethylene, like oil, is easily stored and
transported, and as such, subject to a worldwide spot market. Ethylene is less easily
transported than polyethylene, and for this reason is commonly converted to polyethylene on
site. Accordingly, those who build crackers will do so largely speculating on the sales of the
product being manufactured. Investors in this arena must have deep pockets to withstand this
sort of risk. Those investing in new cracker facilities in the Appalachian region will certainly look
carefully at potential sales markets, but it does not appear that long-term contractual
commitments will be a necessary precondition to the building of these crackers.
228http://www.forbes.com/sites/richardlevick/2014/09/17/natural-gas-innovative-financing-breaks-distribution-barriers/
Mapping the Opportunities for Shale Development in Ohio
Center for Economic Development, Cleveland State University Page 101
4.5. Access to Downstream: Concentration of Existing Chemical Manufacturing
The second most important factor of a cracker site selection decision is access to consumers of
ethylene or polyethylene. At least two crackers, Shell’s Beaver County plant and The
Appalachian Shale Cracker Enterprise, announced building a number of polyethylene and
monoethylene glycol production units adjacent to the ethane crackers. Their targeted market of
consumers is identified as the Northeast region of the United States.
It is useful to understand who the immediate consumers of the cracker products are, and what
the challenges are to securing a market of customers five to six years ahead of the first product
production. Understanding of and appreciation for the complexity of the components of the
final plastic products market come from examining the complex relationships illustrated in a
Department of Energy chart, set forth herein as Figure 43. The finished products and consumer
goods rarely use a single input from assorted petroleum feedstock. Noticeably missing from the
DOE’s figure is polyethylene – the principal chemical ultimately made from ethane crackers. The
diagram’s main utility is in understanding sequence of consumers located along the plastic
product chains.
Figure 43. Products from Petroleum Feedstock
Source: Department of Energy.
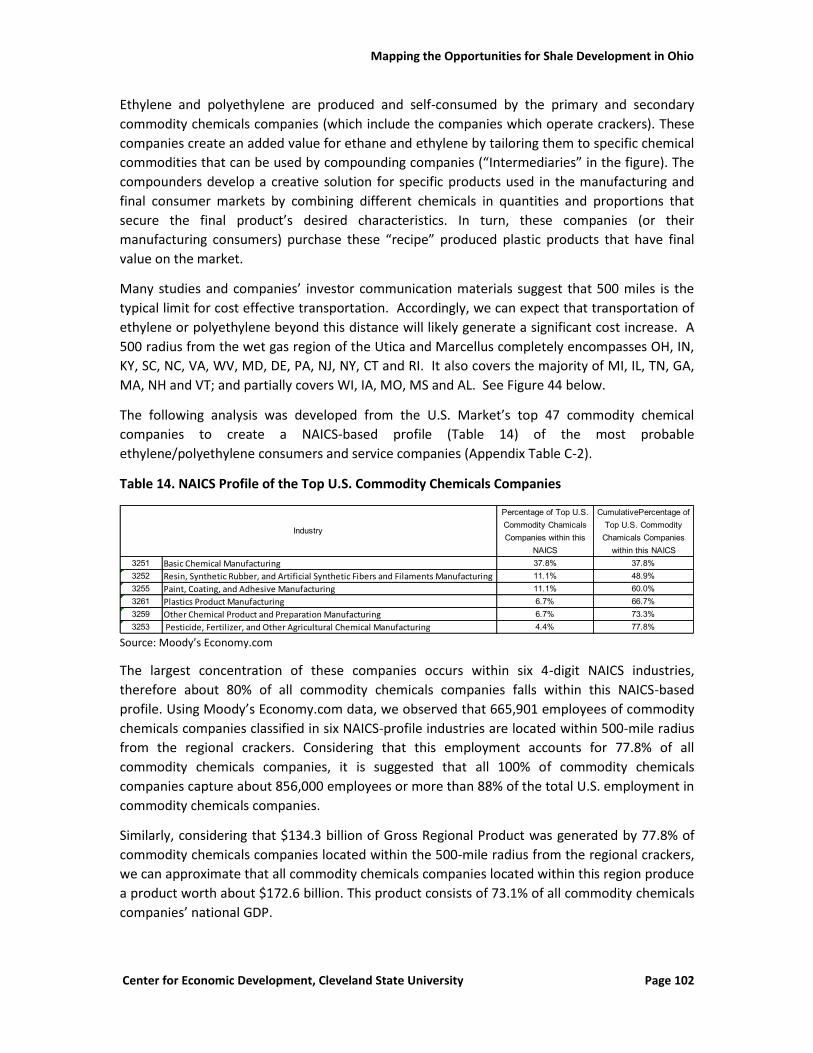
Mapping the Opportunities for Shale Development in Ohio
Center for Economic Development, Cleveland State University Page 102
Ethylene and polyethylene are produced and self-consumed by the primary and secondary
commodity chemicals companies (which include the companies which operate crackers). These
companies create an added value for ethane and ethylene by tailoring them to specific chemical
commodities that can be used by compounding companies (“Intermediaries” in the figure). The
compounders develop a creative solution for specific products used in the manufacturing and
final consumer markets by combining different chemicals in quantities and proportions that
secure the final product’s desired characteristics. In turn, these companies (or their
manufacturing consumers) purchase these “recipe” produced plastic products that have final
value on the market.
Many studies and companies’ investor communication materials suggest that 500 miles is the
typical limit for cost effective transportation. Accordingly, we can expect that transportation of
ethylene or polyethylene beyond this distance will likely generate a significant cost increase. A
500 radius from the wet gas region of the Utica and Marcellus completely encompasses OH, IN,
KY, SC, NC, VA, WV, MD, DE, PA, NJ, NY, CT and RI. It also covers the majority of MI, IL, TN, GA,
MA, NH and VT; and partially covers WI, IA, MO, MS and AL. See Figure 44 below.
The following analysis was developed from the U.S. Market’s top 47 commodity chemical
companies to create a NAICS-based profile (Table 14) of the most probable
ethylene/polyethylene consumers and service companies (Appendix Table C-2).
Table 14. NAICS Profile of the Top U.S. Commodity Chemicals Companies
Source: Moody’s Economy.com
The largest concentration of these companies occurs within six 4-digit NAICS industries,
therefore about 80% of all commodity chemicals companies falls within this NAICS-based
profile. Using Moody’s Economy.com data, we observed that 665,901 employees of commodity
chemicals companies classified in six NAICS-profile industries are located within 500-mile radius
from the regional crackers. Considering that this employment accounts for 77.8% of all
commodity chemicals companies, it is suggested that all 100% of commodity chemicals
companies capture about 856,000 employees or more than 88% of the total U.S. employment in
commodity chemicals companies.
Similarly, considering that $134.3 billion of Gross Regional Product was generated by 77.8% of
commodity chemicals companies located within the 500-mile radius from the regional crackers,
we can approximate that all commodity chemicals companies located within this region produce
a product worth about $172.6 billion. This product consists of 73.1% of all commodity chemicals
companies’ national GDP.
Percentage of Top U.S.
Commodity Chamicals
Companies within this
NAICS
CumulativePercentage of
Top U.S. Commodity
Chamicals Companies
within this NAICS
3251 Basic Chemical Manufacturing 37.8% 37.8%
3252 Resin, Synthetic Rubber, and Artificial Synthetic Fibers and Filaments Manufacturing 11.1% 48.9%
3255 Paint, Coating, and Adhesive Manufacturing 11.1% 60.0%
3261 Plastics Product Manufacturing 6.7% 66.7%
3259 Other Chemical Product and Preparation Manufacturing 6.7% 73.3%
3253 Pesticide, Fertilizer, and Other Agricultural Chemical Manufacturing 4.4% 77.8%
Industry
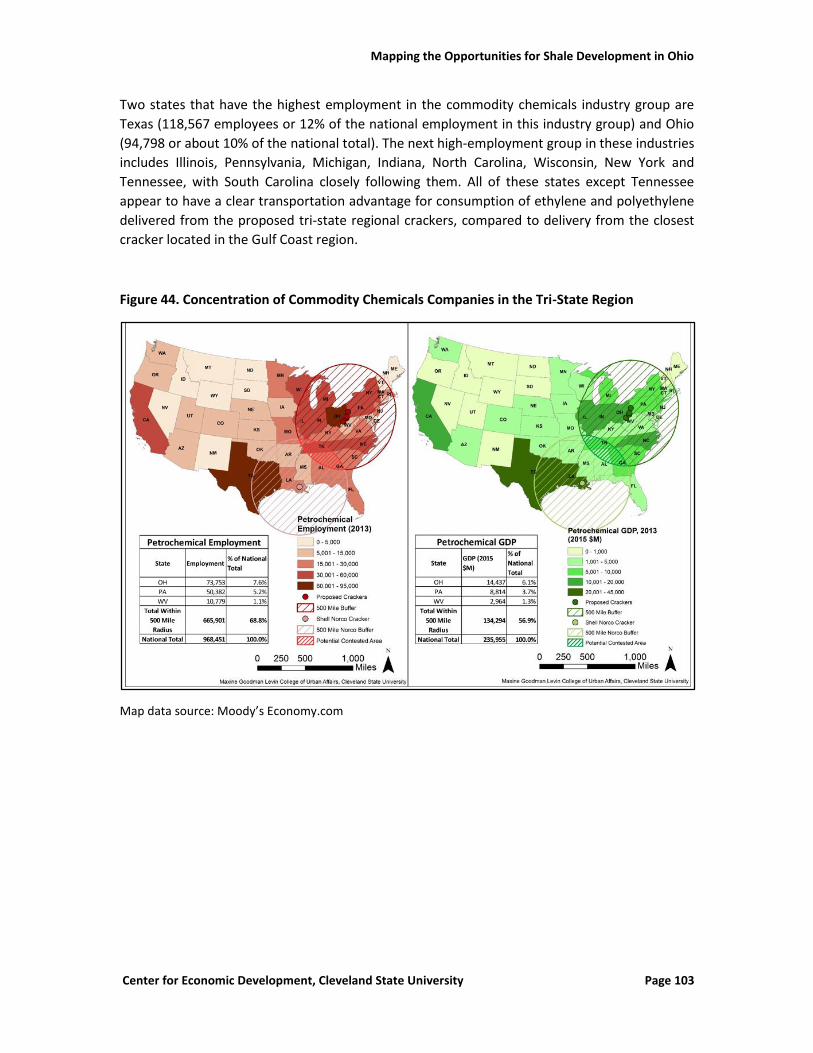
Mapping the Opportunities for Shale Development in Ohio
Center for Economic Development, Cleveland State University Page 103
Two states that have the highest employment in the commodity chemicals industry group are
Texas (118,567 employees or 12% of the national employment in this industry group) and Ohio
(94,798 or about 10% of the national total). The next high-employment group in these industries
includes Illinois, Pennsylvania, Michigan, Indiana, North Carolina, Wisconsin, New York and
Tennessee, with South Carolina closely following them. All of these states except Tennessee
appear to have a clear transportation advantage for consumption of ethylene and polyethylene
delivered from the proposed tri-state regional crackers, compared to delivery from the closest
cracker located in the Gulf Coast region.
Figure 44. Concentration of Commodity Chemicals Companies in the Tri-State Region
Map data source: Moody’s Economy.com
Mapping the Opportunities for Shale Development in Ohio
Center for Economic Development, Cleveland State University Page 104
Although not all commodity chemicals companies are consumers of large volumes of ethylene
and polyethylene, they interact based on providing multiple services one to other. Among those
services are the creation of compounding solutions and the manufacturing of products based on
solutions created by others. Other such services include the supply of specialty chemicals,
testing product and chemical solutions for specific properties, indentifying chemical
compositions of off-spec production and many others. The main benefit expected by small
regional consumers of polyethylene is the addition of regional commodity chemicals companies
that can provide all these services to a broader consumer base.
While there is, in 2015, no concentration of large consumers of polyethylene in the region, there
are local companies that consume non-virgin polyethylene (recycled, scrap or off-spec). This
market follows the virgin polyethylene market dynamic with about 6 months lag. The feedstock
for the local secondary-polyethylene users is tightening due to increased volumes of recycled
polyethylene exported to China.
One major challenge for cracker companies is in the time mismatch between building a new
cracker and the ability of cracker companies to receive commitments from prospective
consumers to buy their future product. These two events are about 5-6 years apart.
Downstream chemicals companies normally buy their feedstock on the commodity markets and
largerly care only about total price with delivery. Further, they maintain a feedstock inventory
at most for the next two months. No long-term commitments to purchase polyethylene from
downstream distributors or converters will be forthcoming, leaving the petrochemical refiner to
speculate on market conditions many years out.
However, according to cracker companies,229 petrochemical refiners will have an ability to tailor
the quality of their products to specific Stock Keeping Units (SKUs – unique identifiers for each
distinct product and service that can be purchased in business). There are hundreds of SKUs in
the purchasing inventory of distribution and compounding companies and there may be high
demand for specific products. Another advantage the cracker companies can provide while
penetrating regional consumer market is to share the transportation cost advantage crackers
will receive from midstream companies with them, by supplying ethane to crackers locally (e.g. a
supply contract based upon a price below spot market prices). As of today, the transportation
and fractionation (T&F) of ethane to existing hubs cost the midstream companies, on average,
18c/mcf, which often creates a negative base price for the regional producers. The negative
price base is calculated as the T&F cost deducted from the hub selling on the btu-equivalent
bases.230 They are forced to accept the negative base price after maxing out rejected ethane
volume. However it is unlikely that any purchasers of polyethylene will commit 5-6 years out.
229 Interviews with representatives of regional cracker companies. 230 For example, if the hub price of ethane to natural gas based on btu ration is 1.03 then after adjustment for about 10 cents a gallon of F&T, this ratio drops to 0.6 of the btu equivalent price of natural gas at the plant tailgate. Oil and Gas Financial Journal, January 7, 2013.
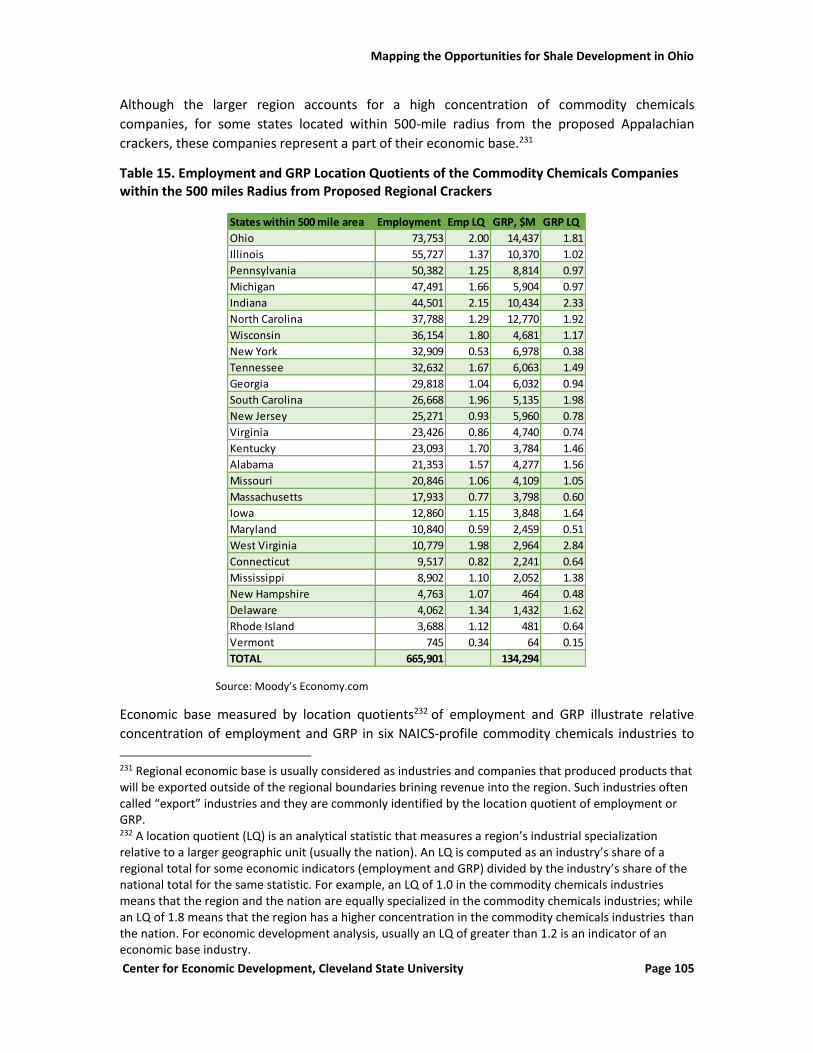
Mapping the Opportunities for Shale Development in Ohio
Center for Economic Development, Cleveland State University Page 105
Although the larger region accounts for a high concentration of commodity chemicals
companies, for some states located within 500-mile radius from the proposed Appalachian
crackers, these companies represent a part of their economic base.231
Table 15. Employment and GRP Location Quotients of the Commodity Chemicals Companies within the 500 miles Radius from Proposed Regional Crackers
Source: Moody’s Economy.com
Economic base measured by location quotients232 of employment and GRP illustrate relative
concentration of employment and GRP in six NAICS-profile commodity chemicals industries to
231 Regional economic base is usually considered as industries and companies that produced products that will be exported outside of the regional boundaries brining revenue into the region. Such industries often called “export” industries and they are commonly identified by the location quotient of employment or GRP. 232 A location quotient (LQ) is an analytical statistic that measures a region’s industrial specialization relative to a larger geographic unit (usually the nation). An LQ is computed as an industry’s share of a regional total for some economic indicators (employment and GRP) divided by the industry’s share of the national total for the same statistic. For example, an LQ of 1.0 in the commodity chemicals industries means that the region and the nation are equally specialized in the commodity chemicals industries; while an LQ of 1.8 means that the region has a higher concentration in the commodity chemicals industries than the nation. For economic development analysis, usually an LQ of greater than 1.2 is an indicator of an economic base industry.
States within 500 mile area Employment Emp LQ GRP, $M GRP LQ
Ohio 73,753 2.00 14,437 1.81
Illinois 55,727 1.37 10,370 1.02
Pennsylvania 50,382 1.25 8,814 0.97
Michigan 47,491 1.66 5,904 0.97
Indiana 44,501 2.15 10,434 2.33
North Carolina 37,788 1.29 12,770 1.92
Wisconsin 36,154 1.80 4,681 1.17
New York 32,909 0.53 6,978 0.38
Tennessee 32,632 1.67 6,063 1.49
Georgia 29,818 1.04 6,032 0.94
South Carolina 26,668 1.96 5,135 1.98
New Jersey 25,271 0.93 5,960 0.78
Virginia 23,426 0.86 4,740 0.74
Kentucky 23,093 1.70 3,784 1.46
Alabama 21,353 1.57 4,277 1.56
Missouri 20,846 1.06 4,109 1.05
Massachusetts 17,933 0.77 3,798 0.60
Iowa 12,860 1.15 3,848 1.64
Maryland 10,840 0.59 2,459 0.51
West Virginia 10,779 1.98 2,964 2.84
Connecticut 9,517 0.82 2,241 0.64
Mississippi 8,902 1.10 2,052 1.38
New Hampshire 4,763 1.07 464 0.48
Delaware 4,062 1.34 1,432 1.62
Rhode Island 3,688 1.12 481 0.64
Vermont 745 0.34 64 0.15
TOTAL 665,901 134,294
Mapping the Opportunities for Shale Development in Ohio
Center for Economic Development, Cleveland State University Page 106
employment and GDP of these industries in the U.S. (Table 15). Half of the states on this list of
26 states within the 500 mile radius have the location quotient of the Commodity Chemicals
Companies greater than 1.2, which indicates this industry is a part of that state’s economic base.
Indiana has the highest LQ of employment at 2.09, and Ohio and West Virginia follow with 1.94.
These states also have the highest location quotients of produced GRP, (IN – 2.19, OH – 1.88 and
WV – 1.71). Only 5 states (including the aforementioned three) have the location quotient of
GRP above 1.2 and 5 more states have GRP LQ between 1.1 and 1.18, which is considered as a
marginal evidence of industry’s concentration due to a possible “noise” in the data. High
employment and GRP LQs for commodity chemical industries in a large number of states
indicate that there already exists an agglomeration effect for company co-location. Such
agglomeration suggests the existence of common infrastructure, workforce, supply chains, and
research services.
While the markets for polyethylene is very important to prospective crackers, falling oil prices
have reduced the profit margin to produce ethylene/polyethylene from ethane compared to
that produced from naphtha. The comparison between ethane and naptha as a feedstock for
ethylene is complicated by the differences in the percentage of produced ethylene per unit of
ethane and comparable unit of naphtha. Moreover, additional naphtha-derived products and
their growing U.S. demand further complicate the calculations. The result is that a straight
comparison of the costs of natural gas and oil on an mmbtu basis may be not be fully indicative
of the value proposition of ethane vs. naptha.
4.6. Economics of Petrochemical Feedstock Building ethane crackers in the tri-state region may significantly improve the economics of
ethane recovery for local producers. However, building such plants is expensive and time
consuming. To predict a successful capital cost recovery, petrochemical companies must
estimate ethylene spot price spreads based upon ethane and naphtha spot prices. Since the
collapse of oil prices in the last quarter of 2014, the economics of ethylene production costs for
major feedstock has changed.
Feedstock flexibility and the ability to make fast feedstock adjustments are seen as major
mitigating factors for the risk of price volatility of oil and related commodities.233 Ethane, as a
feedstock for the petrochemical industry, is a simple molecule that primarily produces ethylene.
“Roughly 80 percent of ethane fed into a cracker is converted to ethylene,” 234 with the
remainder turned into fuel gas including methane, hydrogen and carbon monoxide. More
complex molecules, like gas oil and naphtha, cracks into a more complex variety of intermediate
chemical by-products.
233 Dan Lippe. “Falling Oil Prices will Disrupt Feed Cost Differentials.” Petral Consulting Co., 03/02/2015. 234 Thompson, Jesse. “Shale Revolution Feeds Petrochemical Profits as Production Adapts.” Southwest Economy. Federal Reserve Bank of Dallas. Fourth Quarter. 2013. P.16.
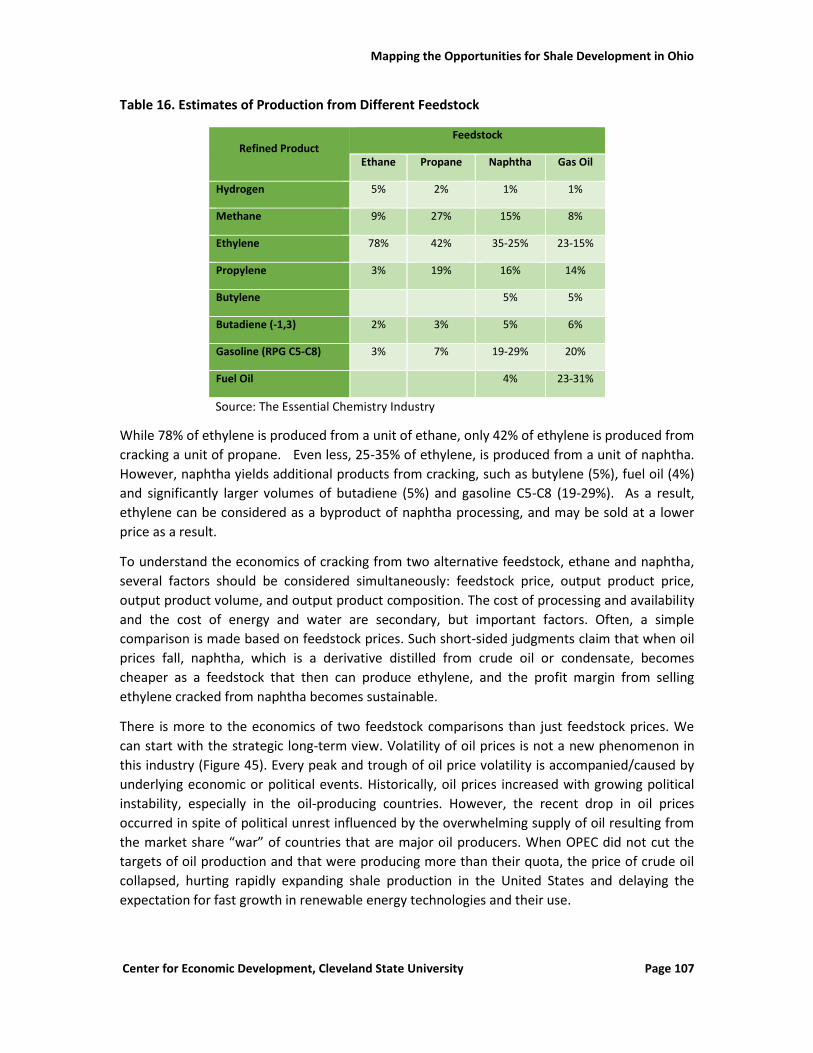
Mapping the Opportunities for Shale Development in Ohio
Center for Economic Development, Cleveland State University Page 107
Table 16. Estimates of Production from Different Feedstock
Refined Product Feedstock
Ethane Propane Naphtha Gas Oil
Hydrogen 5% 2% 1% 1%
Methane 9% 27% 15% 8%
Ethylene 78% 42% 35-25% 23-15%
Propylene 3% 19% 16% 14%
Butylene 5% 5%
Butadiene (-1,3) 2% 3% 5% 6%
Gasoline (RPG C5-C8) 3% 7% 19-29% 20%
Fuel Oil 4% 23-31%
Source: The Essential Chemistry Industry
While 78% of ethylene is produced from a unit of ethane, only 42% of ethylene is produced from
cracking a unit of propane. Even less, 25-35% of ethylene, is produced from a unit of naphtha.
However, naphtha yields additional products from cracking, such as butylene (5%), fuel oil (4%)
and significantly larger volumes of butadiene (5%) and gasoline C5-C8 (19-29%). As a result,
ethylene can be considered as a byproduct of naphtha processing, and may be sold at a lower
price as a result.
To understand the economics of cracking from two alternative feedstock, ethane and naphtha,
several factors should be considered simultaneously: feedstock price, output product price,
output product volume, and output product composition. The cost of processing and availability
and the cost of energy and water are secondary, but important factors. Often, a simple
comparison is made based on feedstock prices. Such short-sided judgments claim that when oil
prices fall, naphtha, which is a derivative distilled from crude oil or condensate, becomes
cheaper as a feedstock that then can produce ethylene, and the profit margin from selling
ethylene cracked from naphtha becomes sustainable.
There is more to the economics of two feedstock comparisons than just feedstock prices. We
can start with the strategic long-term view. Volatility of oil prices is not a new phenomenon in
this industry (Figure 45). Every peak and trough of oil price volatility is accompanied/caused by
underlying economic or political events. Historically, oil prices increased with growing political
instability, especially in the oil-producing countries. However, the recent drop in oil prices
occurred in spite of political unrest influenced by the overwhelming supply of oil resulting from
the market share “war” of countries that are major oil producers. When OPEC did not cut the
targets of oil production and that were producing more than their quota, the price of crude oil
collapsed, hurting rapidly expanding shale production in the United States and delaying the
expectation for fast growth in renewable energy technologies and their use.
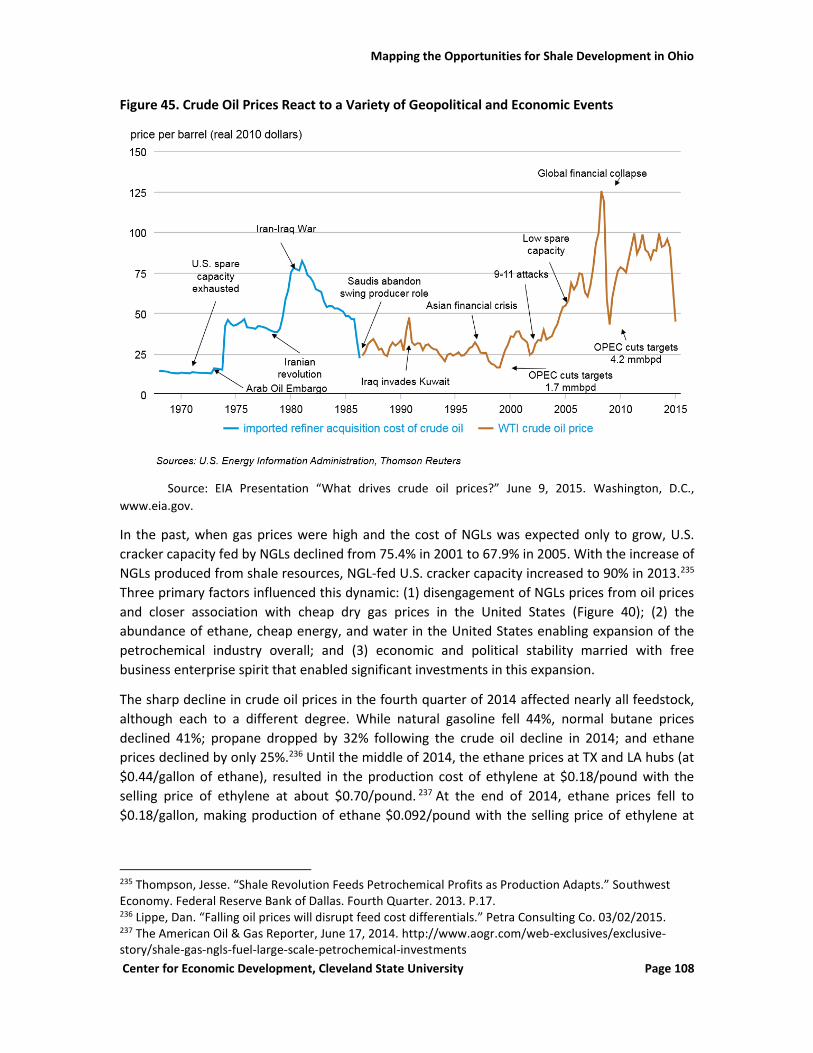
Mapping the Opportunities for Shale Development in Ohio
Center for Economic Development, Cleveland State University Page 108
Figure 45. Crude Oil Prices React to a Variety of Geopolitical and Economic Events
Source: EIA Presentation “What drives crude oil prices?” June 9, 2015. Washington, D.C.,
www.eia.gov.
In the past, when gas prices were high and the cost of NGLs was expected only to grow, U.S.
cracker capacity fed by NGLs declined from 75.4% in 2001 to 67.9% in 2005. With the increase of
NGLs produced from shale resources, NGL-fed U.S. cracker capacity increased to 90% in 2013.235
Three primary factors influenced this dynamic: (1) disengagement of NGLs prices from oil prices
and closer association with cheap dry gas prices in the United States (Figure 40); (2) the
abundance of ethane, cheap energy, and water in the United States enabling expansion of the
petrochemical industry overall; and (3) economic and political stability married with free
business enterprise spirit that enabled significant investments in this expansion.
The sharp decline in crude oil prices in the fourth quarter of 2014 affected nearly all feedstock,
although each to a different degree. While natural gasoline fell 44%, normal butane prices
declined 41%; propane dropped by 32% following the crude oil decline in 2014; and ethane
prices declined by only 25%.236 Until the middle of 2014, the ethane prices at TX and LA hubs (at
$0.44/gallon of ethane), resulted in the production cost of ethylene at $0.18/pound with the
selling price of ethylene at about $0.70/pound. 237 At the end of 2014, ethane prices fell to
$0.18/gallon, making production of ethane $0.092/pound with the selling price of ethylene at
235 Thompson, Jesse. “Shale Revolution Feeds Petrochemical Profits as Production Adapts.” Southwest Economy. Federal Reserve Bank of Dallas. Fourth Quarter. 2013. P.17. 236 Lippe, Dan. “Falling oil prices will disrupt feed cost differentials.” Petra Consulting Co. 03/02/2015. 237 The American Oil & Gas Reporter, June 17, 2014. http://www.aogr.com/web-exclusives/exclusive-story/shale-gas-ngls-fuel-large-scale-petrochemical-investments
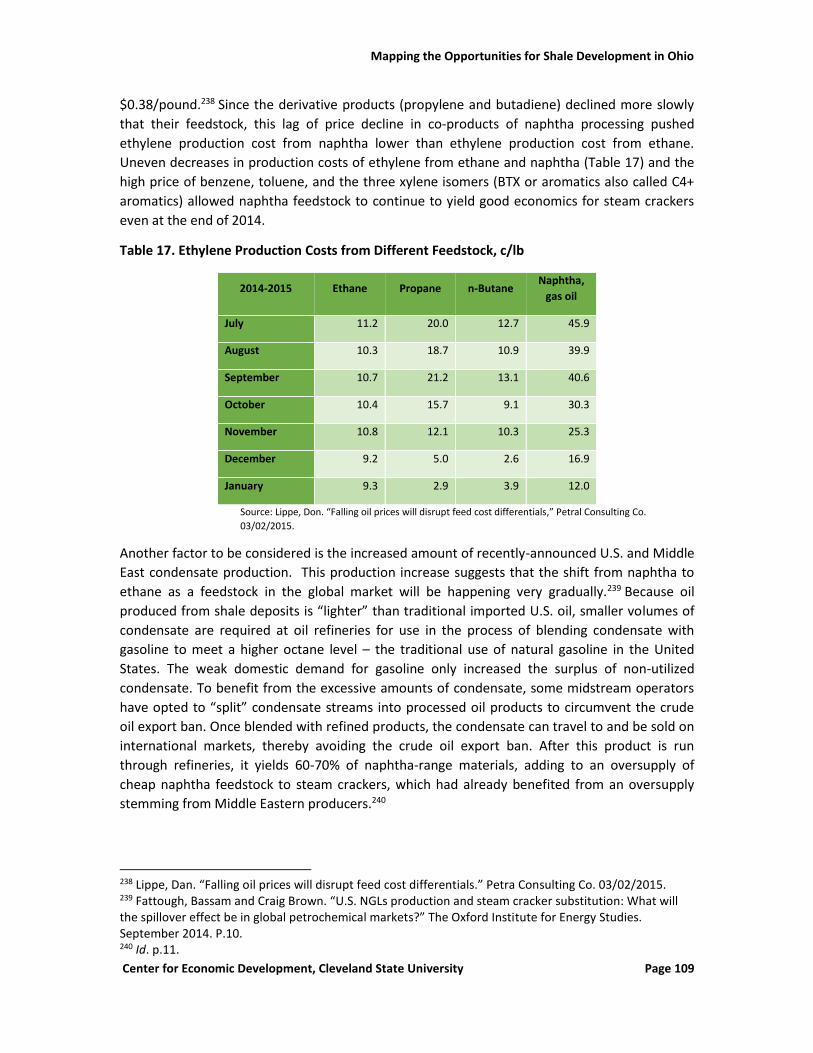
Mapping the Opportunities for Shale Development in Ohio
Center for Economic Development, Cleveland State University Page 109
$0.38/pound.238 Since the derivative products (propylene and butadiene) declined more slowly
that their feedstock, this lag of price decline in co-products of naphtha processing pushed
ethylene production cost from naphtha lower than ethylene production cost from ethane.
Uneven decreases in production costs of ethylene from ethane and naphtha (Table 17) and the
high price of benzene, toluene, and the three xylene isomers (BTX or aromatics also called C4+
aromatics) allowed naphtha feedstock to continue to yield good economics for steam crackers
even at the end of 2014.
Table 17. Ethylene Production Costs from Different Feedstock, c/lb
2014-2015 Ethane Propane n-Butane Naphtha,
gas oil
July 11.2 20.0 12.7 45.9
August 10.3 18.7 10.9 39.9
September 10.7 21.2 13.1 40.6
October 10.4 15.7 9.1 30.3
November 10.8 12.1 10.3 25.3
December 9.2 5.0 2.6 16.9
January 9.3 2.9 3.9 12.0
Source: Lippe, Don. “Falling oil prices will disrupt feed cost differentials,” Petral Consulting Co.
03/02/2015.
Another factor to be considered is the increased amount of recently-announced U.S. and Middle
East condensate production. This production increase suggests that the shift from naphtha to
ethane as a feedstock in the global market will be happening very gradually.239 Because oil
produced from shale deposits is “lighter” than traditional imported U.S. oil, smaller volumes of
condensate are required at oil refineries for use in the process of blending condensate with
gasoline to meet a higher octane level – the traditional use of natural gasoline in the United
States. The weak domestic demand for gasoline only increased the surplus of non-utilized
condensate. To benefit from the excessive amounts of condensate, some midstream operators
have opted to “split” condensate streams into processed oil products to circumvent the crude
oil export ban. Once blended with refined products, the condensate can travel to and be sold on
international markets, thereby avoiding the crude oil export ban. After this product is run
through refineries, it yields 60-70% of naphtha-range materials, adding to an oversupply of
cheap naphtha feedstock to steam crackers, which had already benefited from an oversupply
stemming from Middle Eastern producers.240
238 Lippe, Dan. “Falling oil prices will disrupt feed cost differentials.” Petra Consulting Co. 03/02/2015. 239 Fattough, Bassam and Craig Brown. “U.S. NGLs production and steam cracker substitution: What will the spillover effect be in global petrochemical markets?” The Oxford Institute for Energy Studies. September 2014. P.10. 240 Id. p.11.
Mapping the Opportunities for Shale Development in Ohio
Center for Economic Development, Cleveland State University Page 110
Switching from naphtha to ethane feedstock in North America caused a shortage of the supply
of propylene, butadiene, and other higher C-chain, C4+ aromatics. This shortage started even
before the shale revolution in the United States, and was accompanied by a decreased amount
of these already-in-short-supply chemicals. Moreover, lighter low-cost shale oil is an average
12.5% lower in aromatics content than the typical historical U.S. refinery mix. According to
research conducted by Platts,241 the total U.S. supply of aromatics has dropped an estimated
55% and caused a significant increase in prices for C4+ aromatics.
The market responded to the shortages of butadiene and BTX not only by price growth, but also
by attracting more imports of these chemicals to the U.S. For the long run, there has been
announcements of new construction and an expansion of propylene crackers that will yield
greater amounts of higher C-chain chemicals in the United States.242 Attractive prices for C4+
aromatics also encouraged competition for substitutes made from NGL-based ethylene.243
Cheap feedstock of naphtha produced from crude oil, the additional supply of condensate from
the Middle East and the United States, and the attractiveness of C4+ aromatics’ prices will
continue to keep naphtha-based crackers profitable and accelerate the change from naphtha to
ethane as a main feedstock for ethylene-producing crackers in the United States (but not
globally).
While the naphtha crackers remain profitable due to the factors described above, a few points
need to be made about the advantage North America has in the switch to ethane-based
crackers. The yield of ethylene from different feedstock varies significantly by volume. To
produce the same amount of ethylene, a smaller amount of ethane is required compared to
naphtha. According to industry data, it takes about 1.302 metric tons of ethane to yield 1 ton of
ethylene compared with 3.3 tons of naphtha to yield the same amount of ethylene.244
According to some industry specialists opinions,245 only a lack of sufficient NGLs resources
outside of the Middle East and recently the U.S., made naphtha as a traditional steam crackers
feedstock for ethylene production.
Another advantage of building ethane crackers in the United States, and in the
Appalachian/Mid-Ohio Valley in particular, is the availability of relatively cheap electricity and
the abundance of water, both for transportation and cooling in chemical processing. When
discussing new Middle East, Chinese and Indian chemical processing facilities, the cost of energy
241 Allen, Kevin. “Impact of shale plays on U.S. aromatics production and pricing.” Platts U.S., January 10, 2013. P.2. https://www.platts.com/IM.Platts.Content/InsightAnalysis/IndustrySolutionPapers/aromatics-shale-revolution.pdf 242 Six new propylene crackers and expansion construction projects were announced in Texas, including those by the following companies: Enterprise Products, C3 Petrochemicals, Dow Chemicals, Formosa Plastics and PetroLogistics. Williams Co. announced a propylene cracker in Canada. 243 Thompson, Jesse. “Shale Revolution Feeds Petrochemical Profits as Production Adapts.” Southwest Economy. Federal Reserve Bank of Dallas. Fourth Quarter. 2013. P.17. 244 “Petrochemicals: Preparing for a super cycle”. Morgan Stanley. October 18, 2010. In Fattough, Bassam and Craig Brown. “U.S. NGLs production and steam cracker substitution: What will the spillover effect be in global petrochemical markets?” The Oxford Institute for Energy Studies. September 2014. P.6. 245 Interviews with petrochemical and chemical companies in Ohio and West Virginia.
Mapping the Opportunities for Shale Development in Ohio
Center for Economic Development, Cleveland State University Page 111
and water are often omitted. However, the chemical industry is one of heaviest users of
electricity, heat, and water and these resources are expensive outside of the United States.246
Finally, while the fall of oil prices eased competitive pressure on naphtha-based crackers,
especially in Europe, the decreased cost of crude oil will not last long. Alleviated competitive
pressure may only delay a strategic decision to import U.S. ethane and refit naphtha-based
crackers for ethane as a feedstock. Moreover, many naphtha-fed crackers are based on older
technologies and use old equipment. What seems to be the significant advantage of low
naphtha prices today might prove to be a disadvantage in the future.
Low ethane prices and sustained oil, gas, and NGL production during the first half of 2015
proved the resiliency of U.S. shale oil and gas producers. This resiliency is rooted in high
productivity and continued innovation. Low ethane prices and sustained volumes of NGLs from
Marcellus and Utica will attract petrochemical producers. The benefits of being the first mover
will be significantly greater than for those who enter this region to crack ethane later. The
advantage will be built through lower-cost feedstock, better availability of skilled labor, easier
access to transportation contracts and greater pool of local customers for polyethylene. Greater
flexibility of feedstock might be an answer for current changing economics of spread between
the cost of ethylene production and the selling price of ethylene and polyethylene.
4.7. Main Nodes of Ohio Development and Critical Investment Decisions
There is a significant mismatch measured in time and cost that exists between building natural
gas processing capacities connected to take away pipelines and building petrochemical
production plants (i.e. crackers). The natural gas processing capacity can be built quickly and is
closely aligned with pace of drilling and production. Indeed, gas processing facilities are often
owned by producing companies, usually as part of a consortium with companies that specialize
in processing or gas gathering. It takes between 12 to 18 months to construct a natural gas
processing plant. Units arrive on skids in pre-made segments that have a processing capacity of
200,000 mcf/d per segment. The processing capacity is built ahead of the scheduled drilling and
expected production, and can be closely coordinated to ensure it matches production volumes.
Likewise, fractionation plants downstream of the processing plants can also be quickly built and
brought on line in response to production. Unlike gas processing, capacity for fractionation is
measured in liquid volumes (usually 75 mbbl/d as a standard unit), while costs are around $250-
$260 million/unit.
However fractionation must be accompanied by the capability of taking the pure products (i.e.
natural gas liquids separated into single chemicals) to market. For ethane, this means building a
pipeline system, since ethane is a gas at normal temperatures and pressures. The demand for
pure product pipelines in Utica/Marcellus basin soared in 2013-2014, especially for ethane.
246 Alexander, Serena E., Wendy A. Kellogg, Iryna V. Lendel, Andrew R. Thomas, Nicholas C. Zingale. “Water Resources Shaping Ohio’s Future: Water Efficiency Manual for Industrial, Commercial, and Institutional Facilities. Prepared for the Ohio Lake Erie Commission and Ohio Department of Natural resources,” Center for Economic Development, Cleveland State University. May 2014. Additional sources: Interviews of petrochemical and chemical companies.
Mapping the Opportunities for Shale Development in Ohio
Center for Economic Development, Cleveland State University Page 112
The required construction time for take-away pipelines corresponds to the time needed to build
natural gas processing and fractionation plants, or 18 to 24 months. Each pipeline project costs
less than $1 billion, varying significantly from project to project. For example, Sunoco’s
combined Mariner projects are expected to cost $600 million. The bottom line is that all
necessary midstream infrastructure to process, fractionate and take away ethane and other
pure products can be brought on line within a few years of the time that a major new
production basin has been identified.
An ethane cracker, on the other hand, might take 5 to 6 years to plan and build, with the cost
varying from $3 billion to $6 billion. In addition, regulatory requirements may extend the
timeline and/or incur additional costs. Herein lies the mismatch: those hoping to see a
petrochemical cluster develop around ethane cracker facilities must hope that ethane
production and processing continues to outpace take away capacity, and that petrochemical
companies bet large amounts of money on this scenario continuing many years out. The best
way to ensure that ethane is husbanded for local use is through firm long-term contracts
between production and petrochemical companies.
Five pipeline projects are scheduled to come online by 2018 that will create significant
additional take away capacity for Utica and Marcellus natural gas liquids, including ethane. The
projects include: Sunoco Logistics’ Mariner West, which will take ethane up to petrochemical
plants in Sarnia, Canada; Sunoco’s Mariner East, designed to take propane and eventually
ethane to the Marcus Hook facility in Philadelphia; Appalachia to Texas Express (ATEX), built to
transport ethane to petrochemical plants in Mont Belvieu, Texas; Kinder Morgan’s Utopia
pipeline to Windsor, Ontario; and a project by MarkWest Energy Partners and Kinder Morgan
Inc. that will transport mixed Y-grade (C3 and up) liquids to Mont Belvieu. Moreover, having
already-acquired right-of-ways permits, pipelines will have ability to expand capacity in the
future.
Notwithstanding this risk, industry production projections through the spring of 2015 for ethane
continue to indicate a strong capability of supplying multiple crackers in the Appalachian basin.
Yet this does not end the inquiry for petrochemical companies. Falling oil prices have reduced
feedstock spread between ethane and naphtha, and this may delay decisions to move forward
with construction of these crackers. Tighter capital availability, a stronger U.S. dollar, and a
drastic decrease in U.S. rig counts have added to market volatility. Market stability is a critical
component to evaluating manufacturing expansion opportunities. Some experts suggest that if
the crackers would be already built and running, they would be profitable even at the current
low oil prices. However, a different equation is in play when these companies need to
demonstrate a positive cash-flow for paying off capital investment to their investors.
It appears, then, that ethane volume and ethane prices will be an inducement for and not an
impediment to building ethane crackers in the region. Moreover, with earlier announcements
by Shell and other petrochemical companies confirming that significant amount of the necessary
ethane supply may be under contract for delivery, availability feedstock should not be a
consideration preventing companies from moving ahead with building processes. Delays (or
cancellation) in building are more likely to be caused by the decreasing spread between
Mapping the Opportunities for Shale Development in Ohio
Center for Economic Development, Cleveland State University Page 113
different ethylene feedstock and, as a result, a decreased margin between
ethylene/polyethylene prices and ethylene cost, holding a constant processing cost.
Investment decisions for cracker plants and other petrochemical facilities that rely on feedstock
from the Utica and Marcellus shale production must be made in time to ensure that available
production is not committed to other out-of-region processing opportunities. Moreover, the
petrochemical refiner would like to capture feedstock commitment during the point in time
when the production is peaking, especially if it is in a surplus status, thereby ensuring it gets
depressed prices. The refiner would also like to have its plant fully operational at such time
that production exceeds the take-away capacity. For ethane, it should also be operating at a
time when natural gas prices are also depressed, ensuring that the rejection market is not more
attractive than the ethane market.
Those conditions generally exist now, for the Utica and the Marcellus region. Production will
likely not peak until 2020, however, so there is a good chance they will continue to exist until
then. More importantly, in 2020, barring any additional new take away capacity being built
beyond that already planned, the ethane surplus will be at its peak. According to current
industry projections, ethane production capability will be around 638.4 mbbl/d in the basin
(assuming 20% rejection), while take away capacity will be at only about 460 mbbl/d.
For a large petrochemical plant to be fully operational by 2020, its owner will need to begin
work on it no later than 2016. Estimates given to the Study Team for a new cracker facility have
been around 4-5 years to be built and fully operational. One key moment required to justify the
beginning of work will be when the petrochemical company obtains sufficient and firm
feedstock supply commitments. It should trigger investment. Such commitments are also likely
to head off additional pipeline take away infrastructure build out. Accordingly, acquisition of
firm commitments should be fully developed by 2015-16.
If they are not, any time before contractual commitments are made to build or to supply new
take away infrastructure should be sufficient. Once contractual commitments are made to take
away the excess ethane, it will be increasingly difficult to get firm supply commitments for the
petrochemical plant, and there will be increased competition for locally produced ethane.
A timeline of the key infrastructure events is set forth below, along with an estimate of key time
frames for decision making on commitments to supply and build petrochemical facilities. An
additional key consideration will be the timing and extent of the build out of natural gas take
away capacity, which may, in turn, provide additional rejection capacity. In 2014, there was
insufficient natural gas take away capacity in the Appalachian basin, leading to a discrepancy
between local prices and Henry Hub prices. There are, however, a number of natural gas take
away projects in process, including some pipeline reversals, which will alleviate this by 2020. So
ethane rejection will become an increasingly viable alternative market for ethane over time.
Accordingly, petrochemical companies that wish to head off additional natural gas take away
development before 2020 may need to tie up ethane supplies by 2017-18.
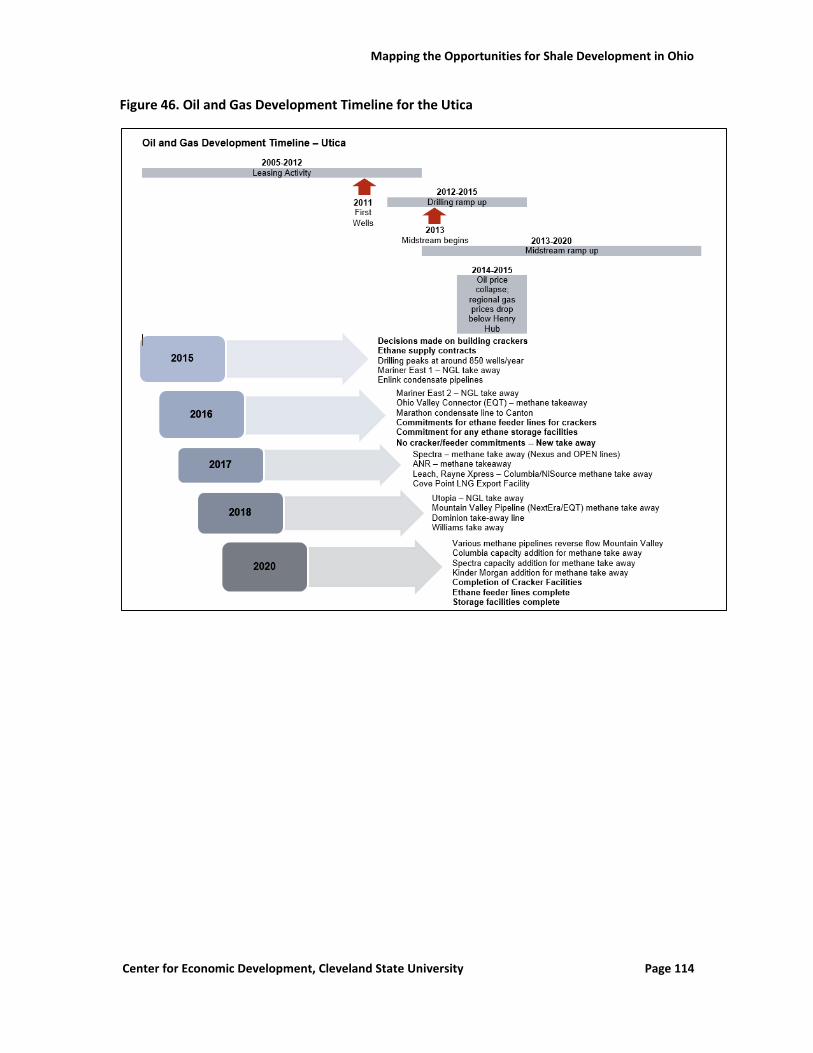
Mapping the Opportunities for Shale Development in Ohio
Center for Economic Development, Cleveland State University Page 114
Figure 46. Oil and Gas Development Timeline for the Utica
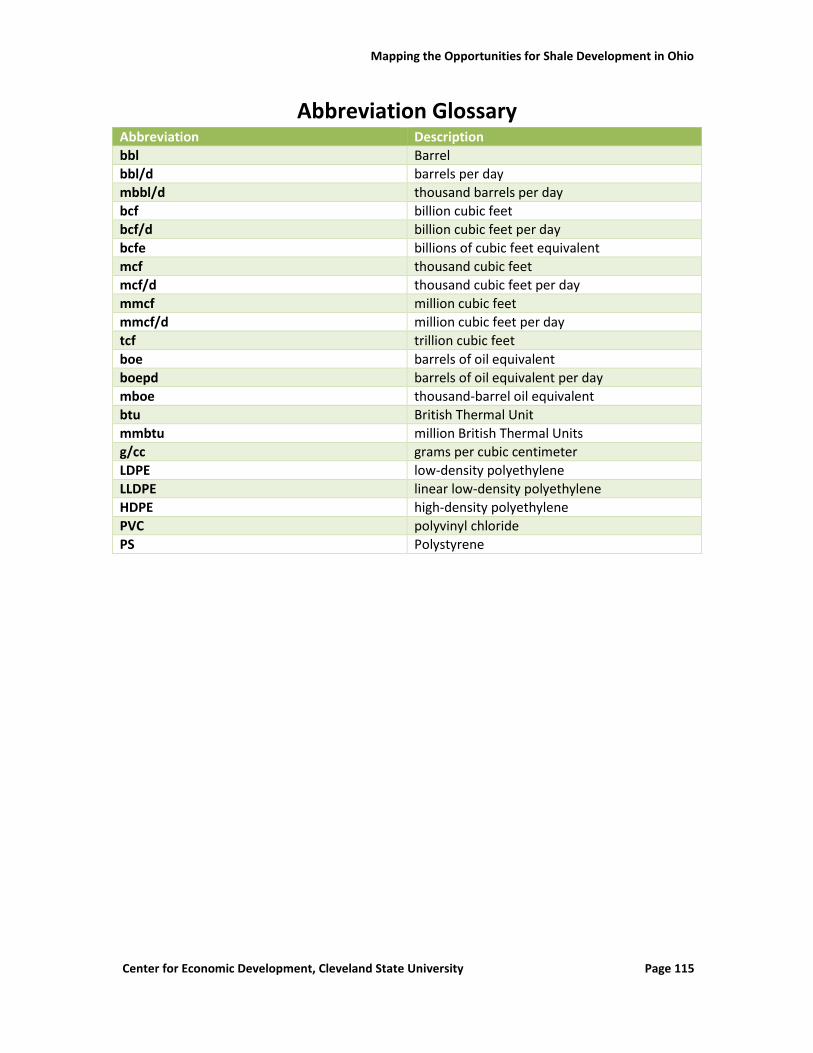
Mapping the Opportunities for Shale Development in Ohio
Center for Economic Development, Cleveland State University Page 115
Abbreviation Glossary Abbreviation Description
bbl Barrel
bbl/d barrels per day
mbbl/d thousand barrels per day
bcf billion cubic feet
bcf/d billion cubic feet per day
bcfe billions of cubic feet equivalent
mcf thousand cubic feet
mcf/d thousand cubic feet per day
mmcf million cubic feet
mmcf/d million cubic feet per day
tcf trillion cubic feet
boe barrels of oil equivalent
boepd barrels of oil equivalent per day
mboe thousand-barrel oil equivalent
btu British Thermal Unit
mmbtu million British Thermal Units
g/cc grams per cubic centimeter
LDPE low-density polyethylene
LLDPE linear low-density polyethylene
HDPE high-density polyethylene
PVC polyvinyl chloride
PS Polystyrene
Mapping the Opportunities for Shale Development in Ohio
Center for Economic Development, Cleveland State University Page 116
APPENDIX A
Table A-1. Comparison of natural gas projections, 2025 (tcf)
Figure A-1. Marcellus Area Spot Natural Gas Trading Points.
Figure A-2. TCO Appalachia and Henry Hub Natural Gas Prices
Figure A-3. Daily Spot Natural Gas Prices at the Tennessee Gas Pipeline Zone 4 Marcellus and
Henry Hub Trading Points. 1/1/2012 – 7/23/2012.
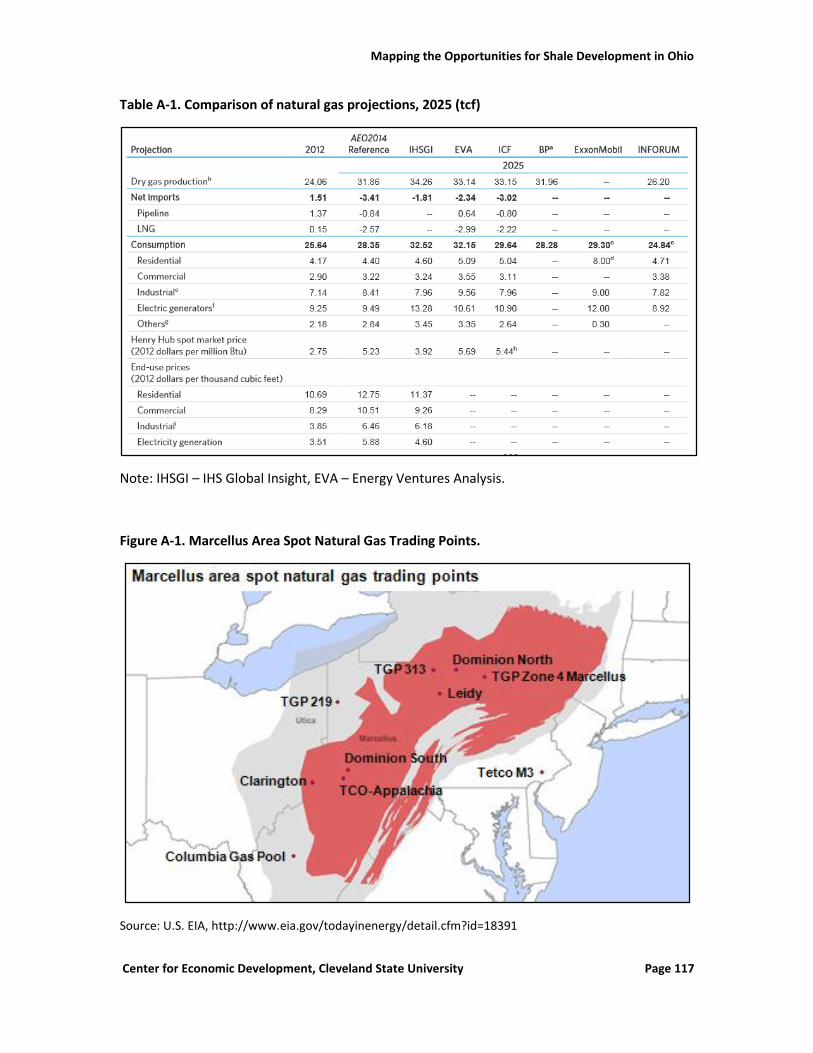
Mapping the Opportunities for Shale Development in Ohio
Center for Economic Development, Cleveland State University Page 117
Table A-1. Comparison of natural gas projections, 2025 (tcf)
Note: IHSGI – IHS Global Insight, EVA – Energy Ventures Analysis.
Figure A-1. Marcellus Area Spot Natural Gas Trading Points.
Source: U.S. EIA, http://www.eia.gov/todayinenergy/detail.cfm?id=18391
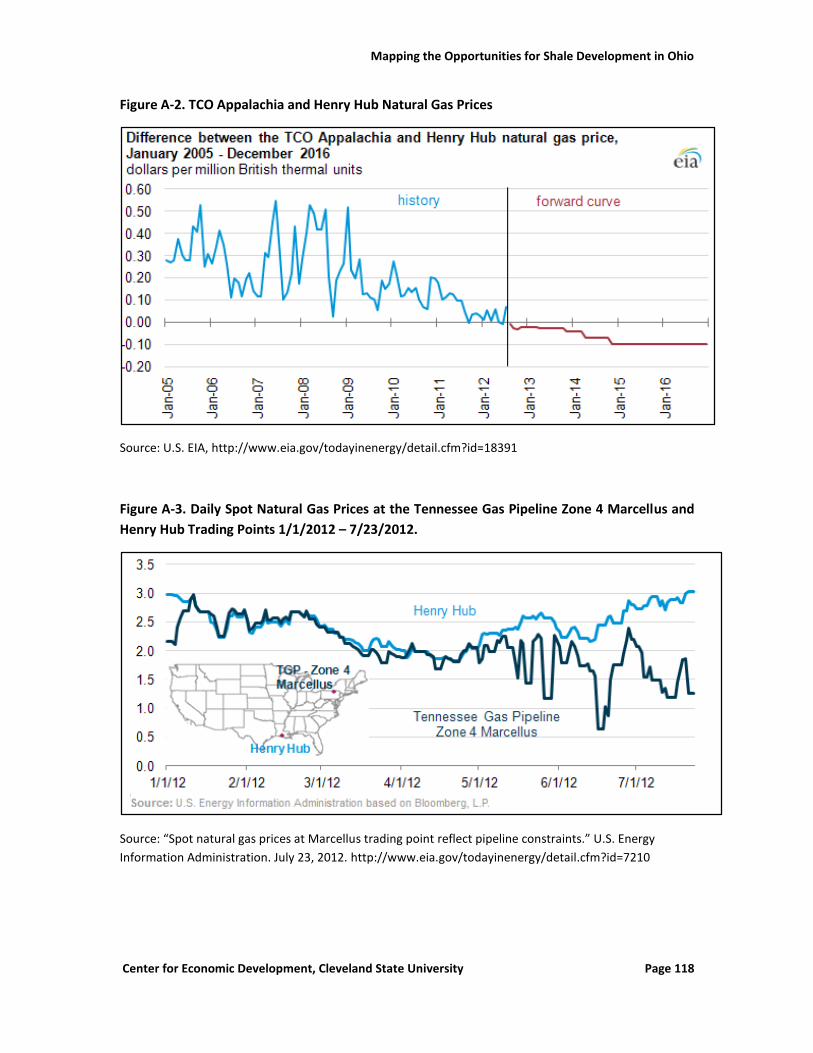
Mapping the Opportunities for Shale Development in Ohio
Center for Economic Development, Cleveland State University Page 118
Figure A-2. TCO Appalachia and Henry Hub Natural Gas Prices
Source: U.S. EIA, http://www.eia.gov/todayinenergy/detail.cfm?id=18391
Figure A-3. Daily Spot Natural Gas Prices at the Tennessee Gas Pipeline Zone 4 Marcellus and
Henry Hub Trading Points 1/1/2012 – 7/23/2012.
Source: “Spot natural gas prices at Marcellus trading point reflect pipeline constraints.” U.S. Energy
Information Administration. July 23, 2012. http://www.eia.gov/todayinenergy/detail.cfm?id=7210
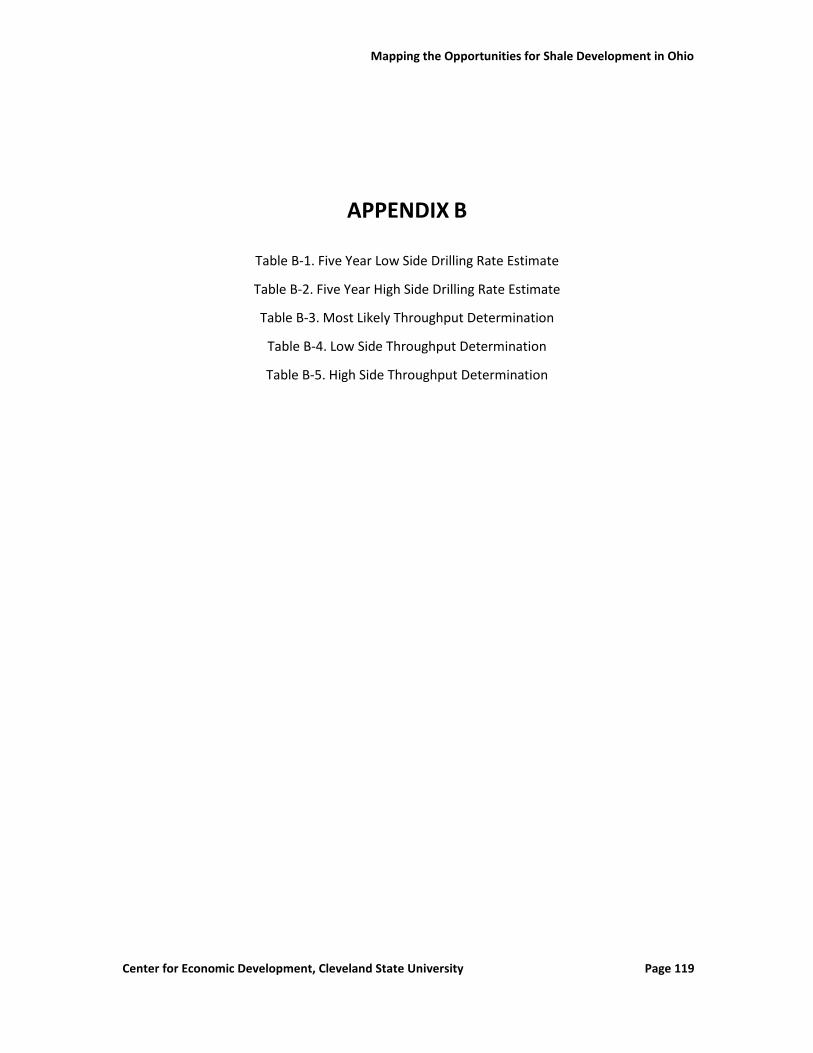
Mapping the Opportunities for Shale Development in Ohio
Center for Economic Development, Cleveland State University Page 119
APPENDIX B
Table B-1. Five Year Low Side Drilling Rate Estimate
Table B-2. Five Year High Side Drilling Rate Estimate
Table B-3. Most Likely Throughput Determination
Table B-4. Low Side Throughput Determination
Table B-5. High Side Throughput Determination
Mapping the Opportunities for Shale Development in Ohio
Center for Economic Development, Cleveland State University Page 120
Table B-1. Five Year Low Side Drilling Rate Estimate
Year Rig Count Drill Time Wells/Year Total Wells
2011-2013 364
2014 45 28.4 593 957
2015 45 25 584 1541
2016 45 22 664 2205
2017 45 22 664 2869
2018 45 22 664 3533
2019 45 22 664 4197
Table B-2. Five Year High Side Drilling Rate Estimate
Year Rig Count Drill Time Wells/Year Total Wells
2011-2013 364
2014 45 28.4 593 957
2015 50 25 730 1687
2016 55 22 913 2600
2017 60 22 995 3595
2018 60 22 995 4590
2019 60 22 995 5585
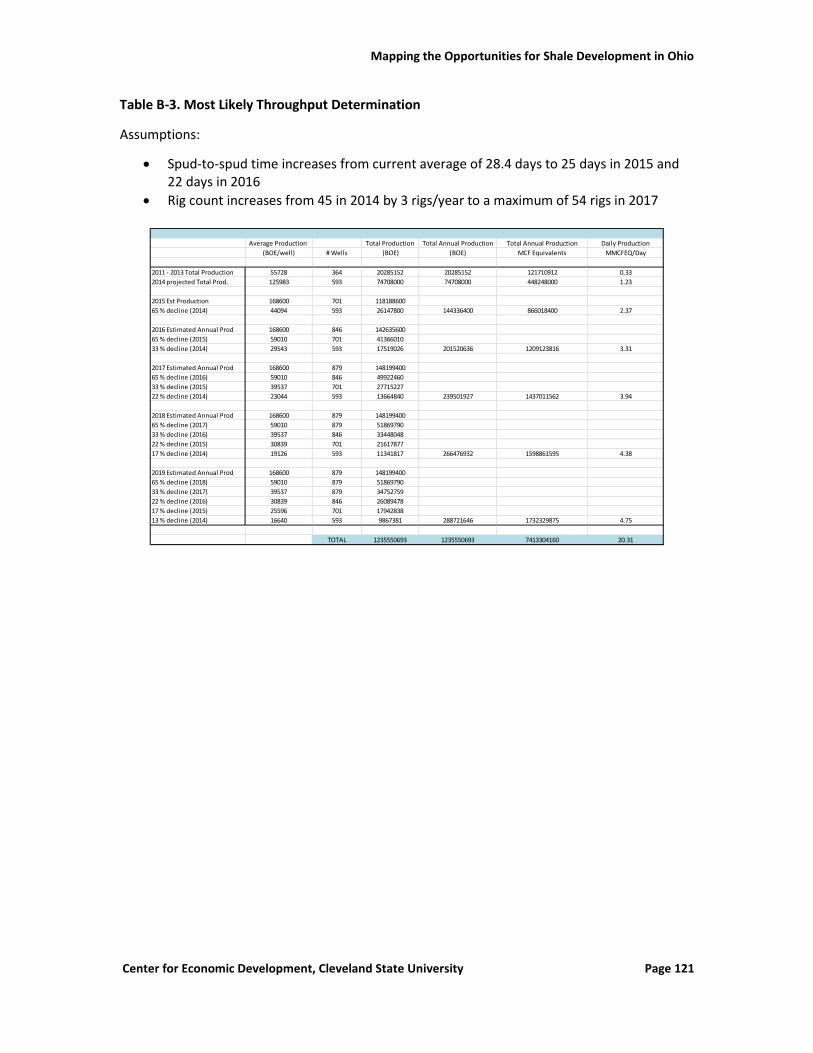
Mapping the Opportunities for Shale Development in Ohio
Center for Economic Development, Cleveland State University Page 121
Table B-3. Most Likely Throughput Determination
Assumptions:
Spud-to-spud time increases from current average of 28.4 days to 25 days in 2015 and 22 days in 2016
Rig count increases from 45 in 2014 by 3 rigs/year to a maximum of 54 rigs in 2017
Average Production Total Production Total Annual Production Total Annual Production Daily Production
(BOE/well) # Wells (BOE) (BOE) MCF Equivalents MMCFEQ/Day
2011 - 2013 Total Production 55728 364 20285152 20285152 121710912 0.33
2014 projected Total Prod. 125983 593 74708000 74708000 448248000 1.23
2015 Est Production 168600 701 118188600
65 % decline (2014) 44094 593 26147800 144336400 866018400 2.37
2016 Estimated Annual Prod 168600 846 142635600
65 % decline (2015) 59010 701 41366010
33 % decline (2014) 29543 593 17519026 201520636 1209123816 3.31
2017 Estimated Annual Prod 168600 879 148199400
65 % decline (2016) 59010 846 49922460
33 % decline (2015) 39537 701 27715227
22 % decline (2014) 23044 593 13664840 239501927 1437011562 3.94
2018 Estimated Annual Prod 168600 879 148199400
65 % decline (2017) 59010 879 51869790
33 % decline (2016) 39537 846 33448048
22 % decline (2015) 30839 701 21617877
17 % decline (2014) 19126 593 11341817 266476932 1598861595 4.38
2019 Estimated Annual Prod 168600 879 148199400
65 % decline (2018) 59010 879 51869790
33 % decline (2017) 39537 879 34752759
22 % decline (2016) 30839 846 26089478
17 % decline (2015) 25596 701 17942838
13 % decline (2014) 16640 593 9867381 288721646 1732329875 4.75
TOTAL 1235550693 1235550693 7413304160 20.31
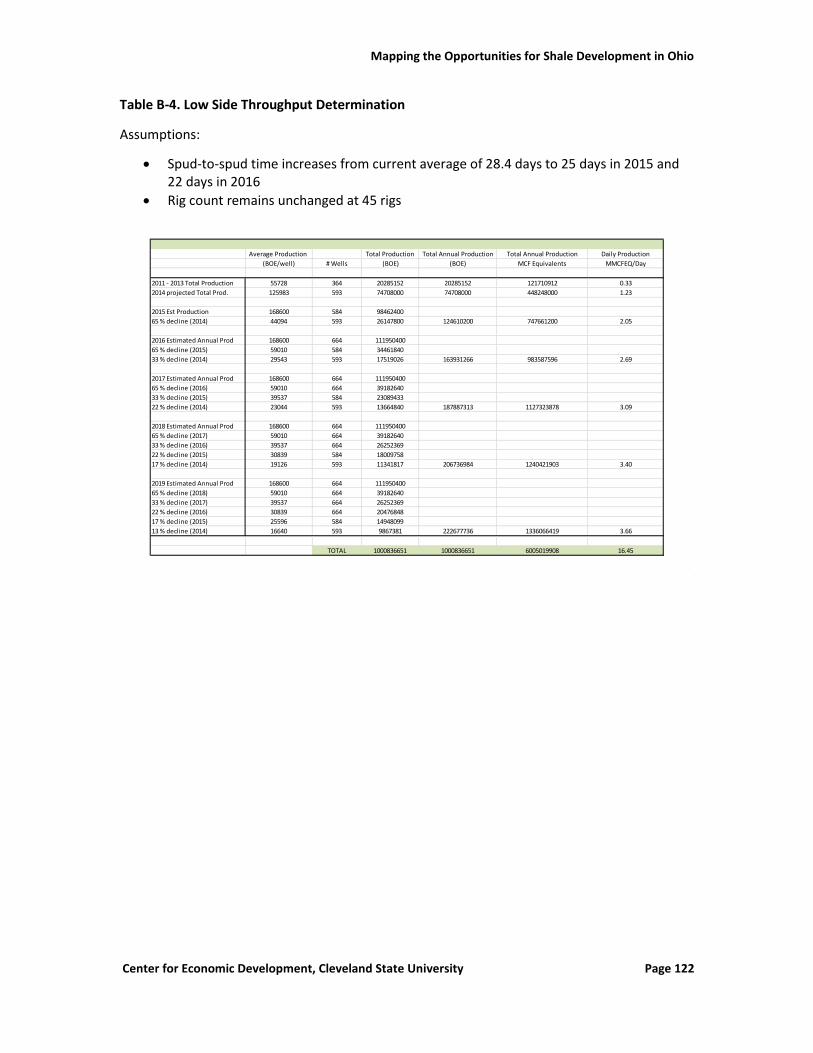
Mapping the Opportunities for Shale Development in Ohio
Center for Economic Development, Cleveland State University Page 122
Table B-4. Low Side Throughput Determination
Assumptions:
Spud-to-spud time increases from current average of 28.4 days to 25 days in 2015 and 22 days in 2016
Rig count remains unchanged at 45 rigs
Average Production Total Production Total Annual Production Total Annual Production Daily Production
(BOE/well) # Wells (BOE) (BOE) MCF Equivalents MMCFEQ/Day
2011 - 2013 Total Production 55728 364 20285152 20285152 121710912 0.33
2014 projected Total Prod. 125983 593 74708000 74708000 448248000 1.23
2015 Est Production 168600 584 98462400
65 % decline (2014) 44094 593 26147800 124610200 747661200 2.05
2016 Estimated Annual Prod 168600 664 111950400
65 % decline (2015) 59010 584 34461840
33 % decline (2014) 29543 593 17519026 163931266 983587596 2.69
2017 Estimated Annual Prod 168600 664 111950400
65 % decline (2016) 59010 664 39182640
33 % decline (2015) 39537 584 23089433
22 % decline (2014) 23044 593 13664840 187887313 1127323878 3.09
2018 Estimated Annual Prod 168600 664 111950400
65 % decline (2017) 59010 664 39182640
33 % decline (2016) 39537 664 26252369
22 % decline (2015) 30839 584 18009758
17 % decline (2014) 19126 593 11341817 206736984 1240421903 3.40
2019 Estimated Annual Prod 168600 664 111950400
65 % decline (2018) 59010 664 39182640
33 % decline (2017) 39537 664 26252369
22 % decline (2016) 30839 664 20476848
17 % decline (2015) 25596 584 14948099
13 % decline (2014) 16640 593 9867381 222677736 1336066419 3.66
TOTAL 1000836651 1000836651 6005019908 16.45
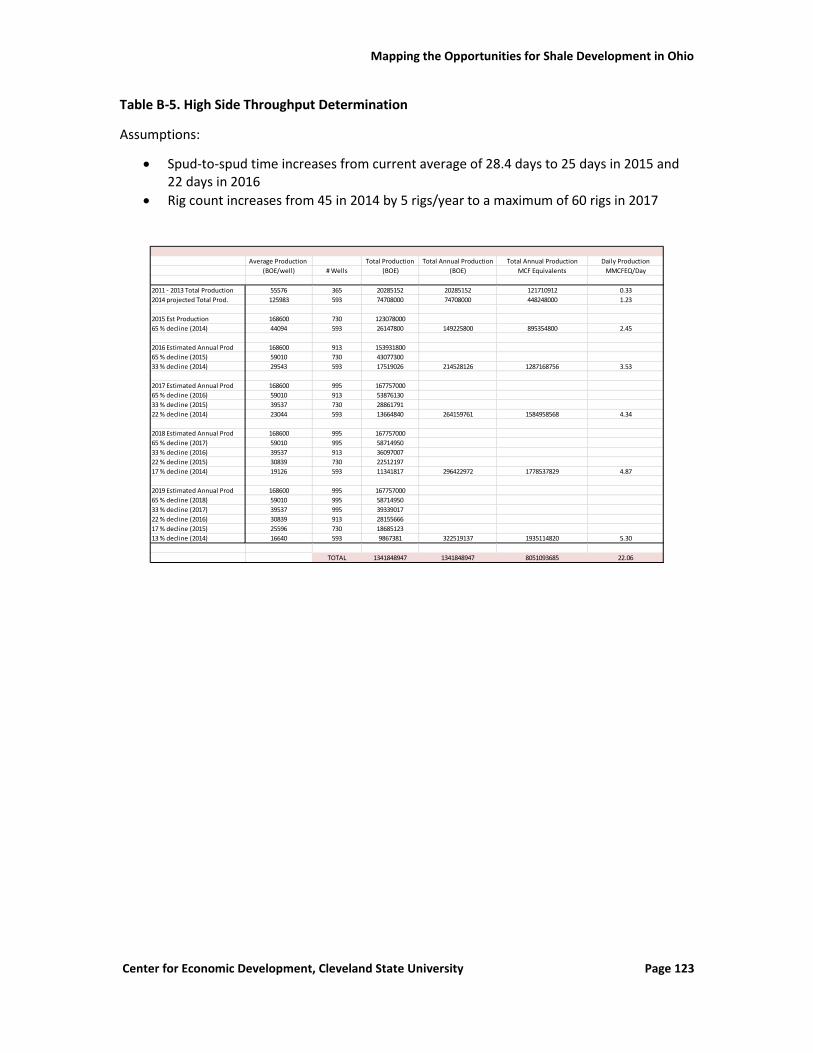
Mapping the Opportunities for Shale Development in Ohio
Center for Economic Development, Cleveland State University Page 123
Table B-5. High Side Throughput Determination
Assumptions:
Spud-to-spud time increases from current average of 28.4 days to 25 days in 2015 and 22 days in 2016
Rig count increases from 45 in 2014 by 5 rigs/year to a maximum of 60 rigs in 2017
Average Production Total Production Total Annual Production Total Annual Production Daily Production
(BOE/well) # Wells (BOE) (BOE) MCF Equivalents MMCFEQ/Day
2011 - 2013 Total Production 55576 365 20285152 20285152 121710912 0.33
2014 projected Total Prod. 125983 593 74708000 74708000 448248000 1.23
2015 Est Production 168600 730 123078000
65 % decline (2014) 44094 593 26147800 149225800 895354800 2.45
2016 Estimated Annual Prod 168600 913 153931800
65 % decline (2015) 59010 730 43077300
33 % decline (2014) 29543 593 17519026 214528126 1287168756 3.53
2017 Estimated Annual Prod 168600 995 167757000
65 % decline (2016) 59010 913 53876130
33 % decline (2015) 39537 730 28861791
22 % decline (2014) 23044 593 13664840 264159761 1584958568 4.34
2018 Estimated Annual Prod 168600 995 167757000
65 % decline (2017) 59010 995 58714950
33 % decline (2016) 39537 913 36097007
22 % decline (2015) 30839 730 22512197
17 % decline (2014) 19126 593 11341817 296422972 1778537829 4.87
2019 Estimated Annual Prod 168600 995 167757000
65 % decline (2018) 59010 995 58714950
33 % decline (2017) 39537 995 39339017
22 % decline (2016) 30839 913 28155666
17 % decline (2015) 25596 730 18685123
13 % decline (2014) 16640 593 9867381 322519137 1935114820 5.30
TOTAL 1341848947 1341848947 8051093685 22.06
Mapping the Opportunities for Shale Development in Ohio
Center for Economic Development, Cleveland State University Page 124
APPENDIX C Figure C-1. Industrialization and Growing Power Demand
Figure C-2. Average Monthly WE Crude Oil and Naphtha Prices, 2008-2014
Figure C-3. Products from Petroleum Feedstock
Table C-1. Existing and Proposed Cracker Capacities in the United States, 2014
Figure C-4. European Polymer Prices, 2014-2015
Table C-2. Top U.S. Commodity Chemicals Companies
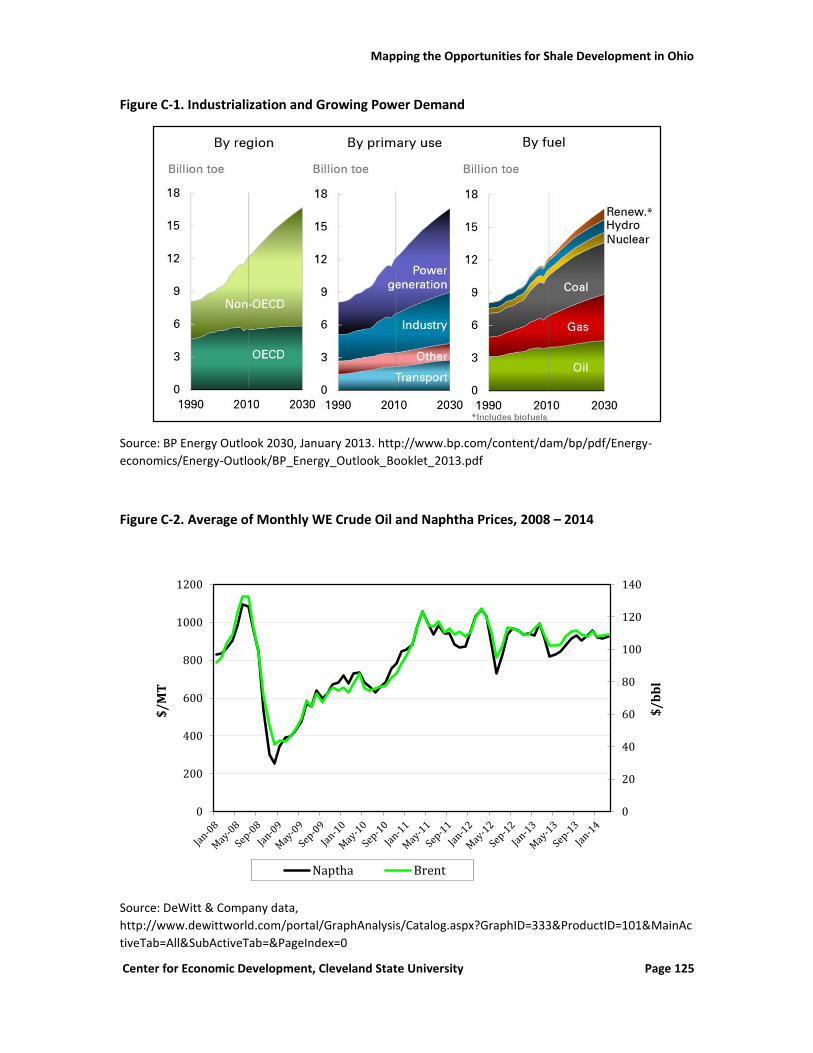
Mapping the Opportunities for Shale Development in Ohio
Center for Economic Development, Cleveland State University Page 125
Figure C-1. Industrialization and Growing Power Demand
Source: BP Energy Outlook 2030, January 2013. http://www.bp.com/content/dam/bp/pdf/Energy-
economics/Energy-Outlook/BP_Energy_Outlook_Booklet_2013.pdf
Figure C-2. Average of Monthly WE Crude Oil and Naphtha Prices, 2008 – 2014
Source: DeWitt & Company data,
http://www.dewittworld.com/portal/GraphAnalysis/Catalog.aspx?GraphID=333&ProductID=101&MainAc
tiveTab=All&SubActiveTab=&PageIndex=0
0
20
40
60
80
100
120
140
0
200
400
600
800
1000
1200
$/
bb
l
$/
MT
Naptha Brent
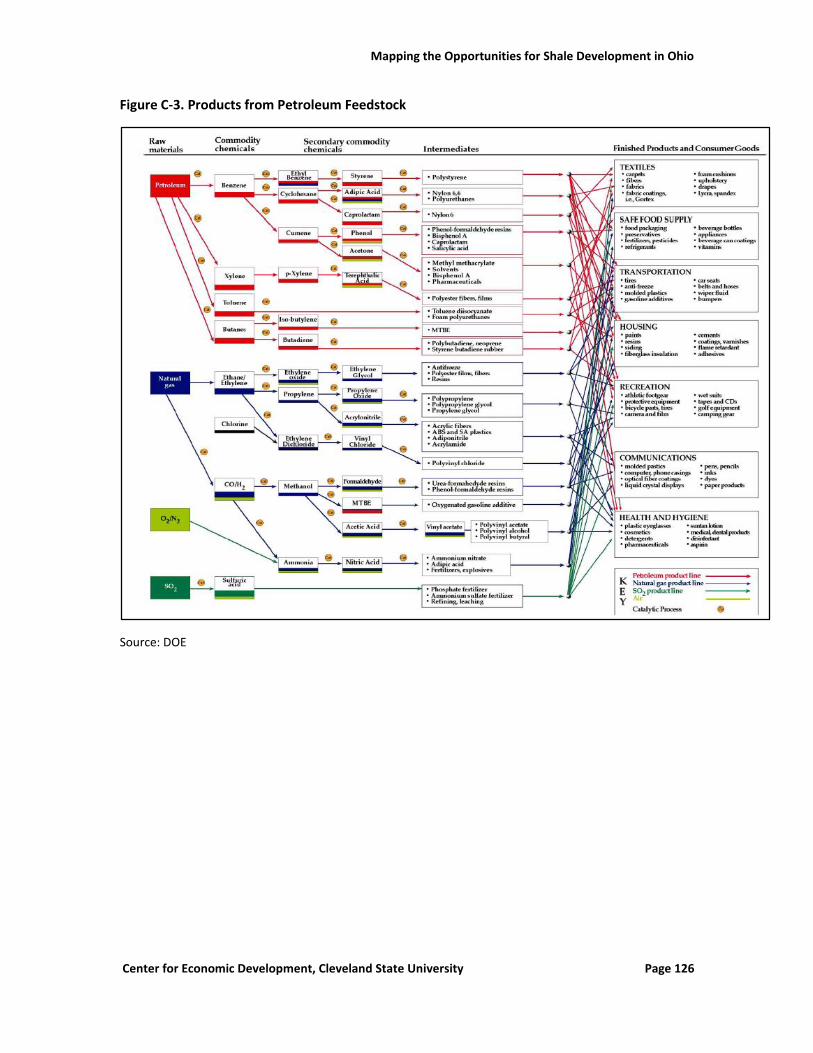
Mapping the Opportunities for Shale Development in Ohio
Center for Economic Development, Cleveland State University Page 126
Figure C-3. Products from Petroleum Feedstock
Source: DOE
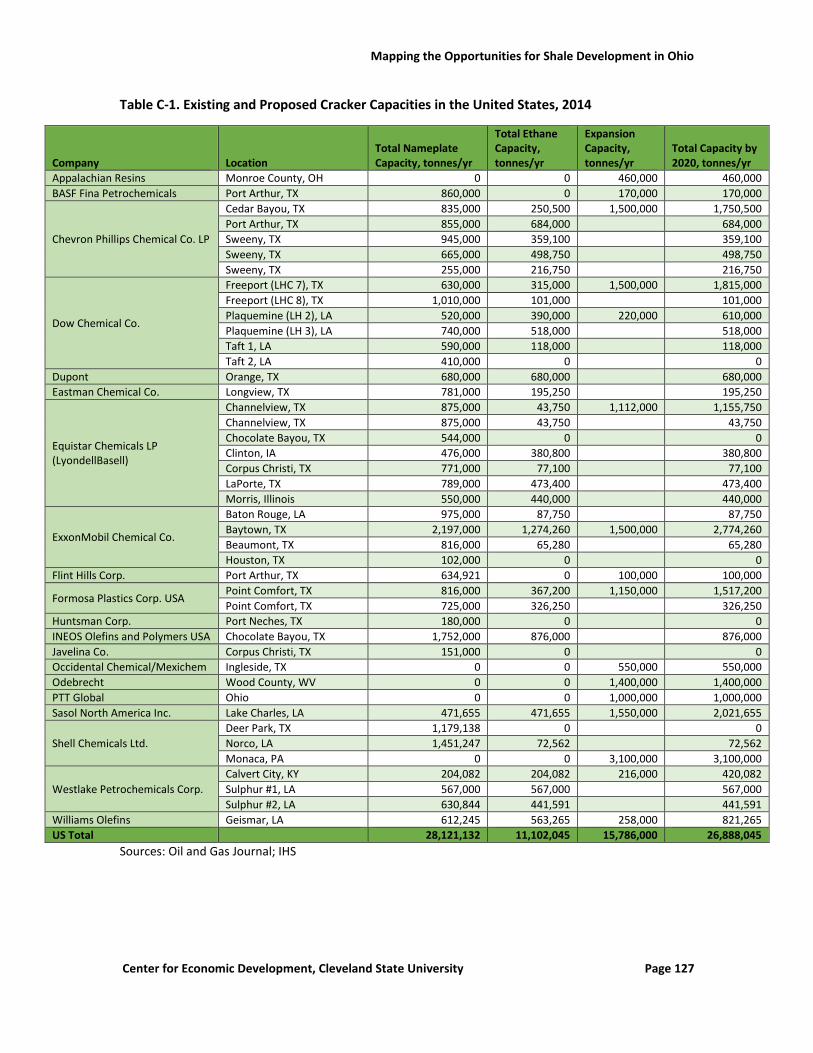
Mapping the Opportunities for Shale Development in Ohio
Center for Economic Development, Cleveland State University Page 127
Table C-1. Existing and Proposed Cracker Capacities in the United States, 2014
Company Location Total Nameplate Capacity, tonnes/yr
Total Ethane Capacity, tonnes/yr
Expansion Capacity, tonnes/yr
Total Capacity by 2020, tonnes/yr
Appalachian Resins Monroe County, OH 0 0 460,000 460,000
BASF Fina Petrochemicals Port Arthur, TX 860,000 0 170,000 170,000
Chevron Phillips Chemical Co. LP
Cedar Bayou, TX 835,000 250,500 1,500,000 1,750,500
Port Arthur, TX 855,000 684,000 684,000
Sweeny, TX 945,000 359,100 359,100
Sweeny, TX 665,000 498,750 498,750
Sweeny, TX 255,000 216,750 216,750
Dow Chemical Co.
Freeport (LHC 7), TX 630,000 315,000 1,500,000 1,815,000
Freeport (LHC 8), TX 1,010,000 101,000 101,000
Plaquemine (LH 2), LA 520,000 390,000 220,000 610,000
Plaquemine (LH 3), LA 740,000 518,000 518,000
Taft 1, LA 590,000 118,000 118,000
Taft 2, LA 410,000 0 0
Dupont Orange, TX 680,000 680,000 680,000
Eastman Chemical Co. Longview, TX 781,000 195,250 195,250
Equistar Chemicals LP (LyondellBasell)
Channelview, TX 875,000 43,750 1,112,000 1,155,750
Channelview, TX 875,000 43,750 43,750
Chocolate Bayou, TX 544,000 0 0
Clinton, IA 476,000 380,800 380,800
Corpus Christi, TX 771,000 77,100 77,100
LaPorte, TX 789,000 473,400 473,400
Morris, Illinois 550,000 440,000 440,000
ExxonMobil Chemical Co.
Baton Rouge, LA 975,000 87,750 87,750
Baytown, TX 2,197,000 1,274,260 1,500,000 2,774,260
Beaumont, TX 816,000 65,280 65,280
Houston, TX 102,000 0 0
Flint Hills Corp. Port Arthur, TX 634,921 0 100,000 100,000
Formosa Plastics Corp. USA Point Comfort, TX 816,000 367,200 1,150,000 1,517,200
Point Comfort, TX 725,000 326,250 326,250
Huntsman Corp. Port Neches, TX 180,000 0 0
INEOS Olefins and Polymers USA Chocolate Bayou, TX 1,752,000 876,000 876,000
Javelina Co. Corpus Christi, TX 151,000 0 0
Occidental Chemical/Mexichem Ingleside, TX 0 0 550,000 550,000
Odebrecht Wood County, WV 0 0 1,400,000 1,400,000
PTT Global Ohio 0 0 1,000,000 1,000,000
Sasol North America Inc. Lake Charles, LA 471,655 471,655 1,550,000 2,021,655
Shell Chemicals Ltd.
Deer Park, TX 1,179,138 0 0
Norco, LA 1,451,247 72,562 72,562
Monaca, PA 0 0 3,100,000 3,100,000
Westlake Petrochemicals Corp.
Calvert City, KY 204,082 204,082 216,000 420,082
Sulphur #1, LA 567,000 567,000 567,000
Sulphur #2, LA 630,844 441,591 441,591
Williams Olefins Geismar, LA 612,245 563,265 258,000 821,265
US Total 28,121,132 11,102,045 15,786,000 26,888,045
Sources: Oil and Gas Journal; IHS
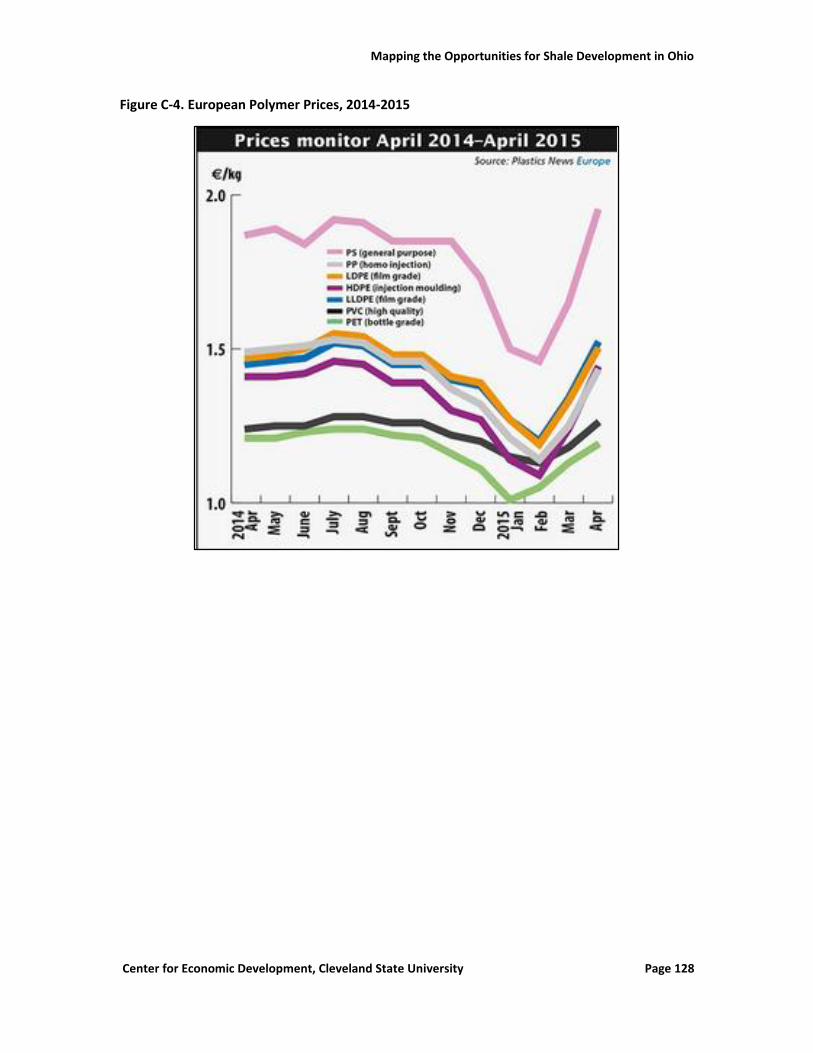
Mapping the Opportunities for Shale Development in Ohio
Center for Economic Development, Cleveland State University Page 128
Figure C-4. European Polymer Prices, 2014-2015
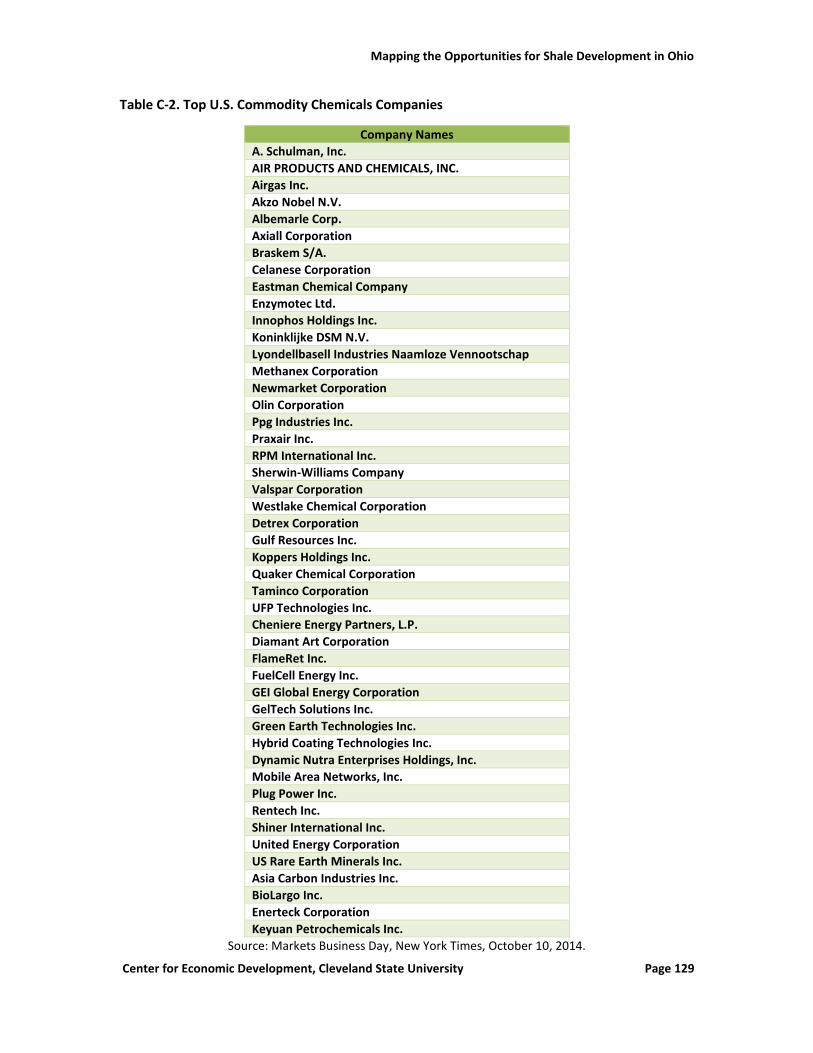
Mapping the Opportunities for Shale Development in Ohio
Center for Economic Development, Cleveland State University Page 129
Table C-2. Top U.S. Commodity Chemicals Companies
Company Names
A. Schulman, Inc.
AIR PRODUCTS AND CHEMICALS, INC.
Airgas Inc.
Akzo Nobel N.V.
Albemarle Corp.
Axiall Corporation
Braskem S/A.
Celanese Corporation
Eastman Chemical Company
Enzymotec Ltd.
Innophos Holdings Inc.
Koninklijke DSM N.V.
Lyondellbasell Industries Naamloze Vennootschap
Methanex Corporation
Newmarket Corporation
Olin Corporation
Ppg Industries Inc.
Praxair Inc.
RPM International Inc.
Sherwin-Williams Company
Valspar Corporation
Westlake Chemical Corporation
Detrex Corporation
Gulf Resources Inc.
Koppers Holdings Inc.
Quaker Chemical Corporation
Taminco Corporation
UFP Technologies Inc.
Cheniere Energy Partners, L.P.
Diamant Art Corporation
FlameRet Inc.
FuelCell Energy Inc.
GEI Global Energy Corporation
GelTech Solutions Inc.
Green Earth Technologies Inc.
Hybrid Coating Technologies Inc.
Dynamic Nutra Enterprises Holdings, Inc.
Mobile Area Networks, Inc.
Plug Power Inc.
Rentech Inc.
Shiner International Inc.
United Energy Corporation
US Rare Earth Minerals Inc.
Asia Carbon Industries Inc.
BioLargo Inc.
Enerteck Corporation
Keyuan Petrochemicals Inc.
Source: Markets Business Day, New York Times, October 10, 2014.