Embed Size (px)
Citation preview

Perceptions, reality and devolution Ben Page, Chief Executive, Ipsos MORI
[email protected] 020 7347 3000

Labour need a 9.6% swing in England in 2020 to win
ELECTORAL ARITHMETIC IN 2020
House of Commons 2015
2.8 1.1
1.7 1.2
4.8
5.4 4.0
1.8 3.2
5.1
11.3
3.0 2.7
0.9 2.1
1.8 2.0
10.2
0.3
1945
1951
1959
1966
1974 (Feb)
1979
1987
1997
2005
2015
Swing to Con
Swing to Lab

3 3
Most predictions are wrong

4 4

The election, the polls, and aftermath
Ben Page, Chief Executive, Ipsos MORI
[email protected] @benatipsosmori

Taking a hammering…

Exit poll - 316 Result - 331
Exit poll - 239 Result - 232
Exit poll - 10 Result - 8
Exit poll - 58
Result - 21
Exit poll - 2 Result - 1
Exit poll - 2 Result - 1
Result - 56
Exit poll - 23
Source: Ipsos MORI/GfK NOP for BBC/ITV News/Sky News
Asking what did do,
rather than what
will…

We got highest
Conservative
share and
lowest error on
this key
calculation of
who would be
largest party…
Average percentage point error on
Conservative/Labour vote share

Lots of social media activity by the young, fewer votes

So what’s worrying voters and residents?
Base: representative sample of c.1,000 British adults age 18+ each month, interviewed face-to-face in home
What do you see as the most/other important issues facing Britain today?
Source: Ipsos MORI Issues Index
0
10
20
30
40
50
60
70
May1997
May1998
May1999
May2000
May2001
May2002
May2003
May2004
May2005
May2006
May2007
May2008
May2009
May2010
May2011
May2012
May2013
May2014
May2015
NHS UNEMPLOYMENT
CRIME/LAW &
ORDER ECONOMY IMMIGRATION*
*Up until September 2014 the code was race relations/immigration/immigrants

Cameron becomes PM
Education / Schools not a problem What do you see as the most/other important issues facing Britain today?
Source: Ipsos MORI Issues Index
0
10
20
30
40
50
May1997
May1998
May1999
May2000
May2001
May2002
May2003
May2004
May2005
May2006
May2007
May2008
May2009
May2010
May2011
May2012
May2013
May2014
May2015
Introduction of means-tested tuition
fees. Education most important issue.
First City Academies
introduced
Lowest score since
Dec 1985 (9%)
Labour’s second term - pledge to
improve failing secondary schools
April 2011 – Pupil
Premium introduced
Base: representative sample of c.1,000 British adults age 18+ each month, interviewed face-to-face in home

Cameron becomes PM
Issues Facing Britain:
Defence / Foreign Affairs / International terrorism What do you see as the most/other important issues facing Britain today?
Source: Ipsos MORI Issues Index
0
10
20
30
40
50
60
70
May1997
May1998
May1999
May2000
May2001
May2002
May2003
May2004
May2005
May2006
May2007
May2008
May2009
May2010
May2011
May2012
May2013
May2014
May2015
9/11 London
Bombs
Invasion of Iraq –
protests across Europe
Failed terror
attacks in London
and Glasgow
UK withdraws
from Iraq
War in
Kosovo
Parliamentary vote
against action in Syria
NATO bombing
in Libya
Rise of
ISIS
Base: representative sample of c.1,000 British adults age 18+ each month, interviewed face-to-face in home

Cameron becomes PM
Poverty/inequality? What do you see as the most/other important issues facing Britain today?
Source: Ipsos MORI Issues Index
0
5
10
15
20
May1998
May1999
May2000
May2001
May2002
May2003
May2004
May2005
May2006
May2007
May2008
May2009
May2010
May2011
May2012
May2013
May2014
May2015
Sept 1999:
Alastair Darling – “one child in
three” living in poverty
July 2014:
highest score
recorded (18%)
January 2005:
Make Poverty History campaign
launched on New Year’s Day
Base: representative sample of c.1,000 British adults age 18+ each month, interviewed face-to-face in home

Cameron becomes PM
Record concern about housing What do you see as the most/other important issues facing Britain today?
Source: Ipsos MORI Issues Index
0
5
10
15
20
25
30
May1997
May1998
May1999
May2000
May2001
May2002
May2003
May2004
May2005
May2006
May2007
May2008
May2009
May2010
May2011
May2012
May2013
May2014
May2015
A8 Countries
join the EU
House prices
rising at fastest
rate in 10 years
Highest score since
October 1974 (20%)
Base: representative sample of c.1,000 British adults age 18+ each month, interviewed face-to-face in home

People do not think they are being affected by cuts AS YOU MAY KNOW, THE GOVERNMENT HAS ANNOUNCED A NUMBER OF SPENDING CUTS TO HELP REDUCE THE NATIONAL DEBT TO WHAT EXTENT, IF AT ALL, HAVE YOU AND YOUR
FAMILY BEEN AFFECTED BY THE CUTS SO FAR?
Base: 1,001 British adults 18+, 8th – 11th August 2015 Source: Ipsos MORI
8%
8%
25%
15%
49%
39%
10%
37%
8%
2%
November 2012
August 2015
A great deal A fair amount Not very much Not at all Don't know
76% 23%
59% 33%

And concern about future effects of cuts decreased significantly…
AND HOW CONCERNED, IF AT ALL, ARE YOU ABOUT THE EFFECTS OF THE CUTS
ON YOU AND YOUR FAMILY IN THE NEXT 12 MONTHS?
Base: 1,001 British adults 18+, 8th – 11th August 2015 Source: Ipsos MORI
19%
19%
42%
27%
28%
30%
5%
22%
6%
1%
November 2012
August 2015
A great deal A fair amount Not very much Not at all Don't know
52% 46%
33% 61%

This is despite people being more likely to think services have got worse than better
Base: 1,006 British adults 18+, 11th – 13th September 2015
THINKING ABOUT PUBLIC SERVICES OVERALL, DO YOU THINK THE QUALITY OF PUBLIC SERVICES HAS GOT BETTER OR WORSE IN THE LAST FIVE YEARS OR HAS IT STAYED THE SAME?
Source: Ipsos MORI/2013 BBC Bailout Anniversary poll
3%
4%
12%
12%
42%
39%
20%
23%
20%
20%
3%
3%
September 2013
September 2015
Got much better Got a little better Stayed the same Got a little worse Got much worse Don’t know
16%
40% 15%
43%

And most still disagree the government has the right policies for public services
On balance, do you agree or disagree with the following statements?
In the long term, this government’s policies will improve the state of Britain's
public services.
Base: c. 1,000 British adults 18+ every month Source: Ipsos MORI
0
10
20
30
40
50
60
70Jun
-01
Nov-0
1
Ap
r-02
Se
p-0
2
Fe
b-0
3
Jul-
03
Dec-0
3
Ma
y-0
4
Oct-
04
Ma
r-0
5
Au
g-0
5
Jan
-06
Jun
-06
Nov-0
6
Ap
r-07
Se
p-0
7
Fe
b-0
8
Jul-
08
Dec-0
8
Ma
y-0
9
Oct-
09
Ma
r-1
0
Au
g-1
0
Jan
-11
Jun
-11
Nov-1
1
Ap
r-12
Se
p-1
2
Fe
b-1
3
Jul-
13
Dec-1
3
Ma
y-1
4
Oct-
14
Ma
r-1
5
Au
g-1
5
56
37 Agree
Disagree

Public is seeing more decline in quality of health and social care than
they were two years ago
19
4%
2%
11%
7%
11%
10%
7%
11%
16%
17%
18%
17%
22%
27%
36%
34%
41%
33%
10%
16%
14%
19%
14%
19%
12%
20%
16%
16%
14%
19%
44%
24%
7%
7%
2%
3%
2013
2015
2013
2015
2013
2015
Got much better Got a little better Stayed the same Got a little worse Got much worse Don’t know
GP
surgeries
Hospitals
Care for the
elderly
Base: 1,006 British adults 18 11th – 13th September 2015, Source: Ipsos MORI/2013 BBC Bailout Anniversary poll
DO YOU THINK [EACH SERVICE] HAS GOT BETTER OR WORSE IN THE LAST FIVE YEARS, OR HAS IT STAYED THE SAME? IS THAT MUCH OR A LITTLE BETTER/WORSE?
27% 38%
29% 28%
24% 35%
27% 30%
13% 36%
11% 22%

Users also on balance negative – more so in the case of care for the
elderly
9%
5%
11%
7%
10%
10%
13%
17%
16%
19%
19%
17%
27%
30%
36%
33%
42%
32%
13%
15%
15%
19%
14%
20%
19%
26%
17%
17%
14%
19%
12%
7%
5%
5%
1%
2%
2013 (210)
2015 (172)
2013 (888)
2015 (807)
2013 (938)
2015 (904)
Got much better Got a little better Stayed the same Got a little worse Got much worse Don’t know
Users of
GP
surgeries
Users of
hospitals
Users of
care for the
elderly
Base: All whose household benefits from named service 11th – 13th September 2015, Source: Ipsos MORI/2013 BBC Bailout Anniversary poll
DO YOU THINK [EACH SERVICE] HAS GOT BETTER OR WORSE IN THE LAST FIVE YEARS, OR HAS IT STAYED THE SAME? IS THAT MUCH OR A LITTLE BETTER/WORSE? (ALL WHOSE HOUSEHOLD BENEFITS FROM SERVICE)
27% 39%
29% 28%
26% 36%
27% 32%
22% 41%
22% 32%

Anxiety about the NHS takes off…..
Base: c.1,000 British adults each month
21 THINKING ABOUT THE QUALITY OF THE NHS OVER THE NEXT FEW YEARS DO YOU EXPECT IT TO…?
Source: Ipsos MORI
0
10
20
30
40
50
60M
ar-
02
Oct-
02
Ma
y-0
3
Dec-0
3
Jul-
04
Fe
b-0
5
Se
p-0
5
Ap
r-06
Nov-0
6
Jun
-07
Jan
-08
Au
g-0
8
Ma
r-0
9
Oct-
09
Ma
y-1
0
Dec-1
0
Jul-
11
Fe
b-1
2
Se
p-1
2
Ap
r-13
Nov-1
3
Jun
-14
Jan
-15
Au
g-1
5
55
19 Better
Worse

We’re evenly split of whether education will to get better, worse
or stay the same THINKING ABOUT THE QUALITY OF EDUCATION OVER THE NEXT FEW YEARS DO YOU EXPECT IT TO…?
Base: 1,001 British adults 18+, 8th – 11th August 2015, Source: Ipsos MORI
5%
26%
32%
23%
9%
5%
Get much better Get a little better Stay the same Get a little worse Get much worse Don’t know
31%
32%

LOCAL SERVICES AND INFRASTRUCTURE?

13%
10%
27%
26%
7%
6%
8%
8%
16%
12%
21%
22%
12%
16%
12%
11%
45%
51%
37%
34%
54%
47%
58%
57%
11%
13%
6%
8%
10%
12%
9%
10%
12%
12%
6%
7%
11%
14%
8%
10%
3%
2%
3%
3%
5%
5%
4%
5%
2013
Aug-15
2013
Sep-15
2013
Aug-15
2013
Aug-15
Got much better Got a little better Stayed the same Got a little worse Got much worse Don’t know
Street
lighting
Refuse
collection
Street
cleaning
Recycling
collection
No big shifts in views of local street scene services – just slight increases
in people saying they’ve got worse
24
Base: c.1,000 British adults 18+, 8th – 11th August 2015, and 11th – 13th September 2015
Source: Ipsos MORI/2013 BBC Bailout
Anniversary poll
DO YOU THINK [EACH SERVICE] HAS GOT BETTER OR WORSE IN THE LAST FIVE YEARS, OR HAS IT STAYED THE SAME? IS THAT MUCH OR A LITTLE BETTER/WORSE?
19% 20%
20% 17%
19%
26%
22%
15%
22%
21%
48%
25%
48% 12%
29% 23%

15%
12%
9%
7%
14%
10%
18%
20%
11%
12%
11%
14%
44%
46%
35%
35%
38%
33%
9%
10%
9%
14%
4%
9%
6%
6%
7%
9%
3%
6%
8%
6%
29%
23%
30%
29%
2013
Aug-15
2013
Sep-15
2013
Aug-15
Got much better Got a little better Stayed the same Got a little worse Got much worse Don’t know
Leisure
centres
Parks and open
spaces
Libraries
Slightly greater shifts towards thinking leisure centres and libraries
have got worse – but relatively few noticing changes
25
Base: 1,001 British adults 18+, 8th – 11th August 2015, and 11th – 13th September 2015 Source: Ipsos MORI/2013 BBC Bailout Anniversary poll
DO YOU THINK [EACH SERVICE] HAS GOT BETTER OR WORSE IN THE LAST FIVE YEARS, OR HAS IT STAYED THE SAME? IS THAT MUCH OR A LITTLE BETTER/WORSE?
24% 15%
25% 7%
20%
23%
33%
16%
19%
16%
32%
15%
4%
4%
8%
8%
7%
10%
13%
11%
20%
28%
39%
37%
18%
18%
11%
14%
49%
39%
8%
11%
2%
2%
20%
20%
2013
Aug-15
2013
Aug-15
Got much better Got a little better Stayed the same Got a little worse Got much worse Don’t know
Bus services
Road
maintenance
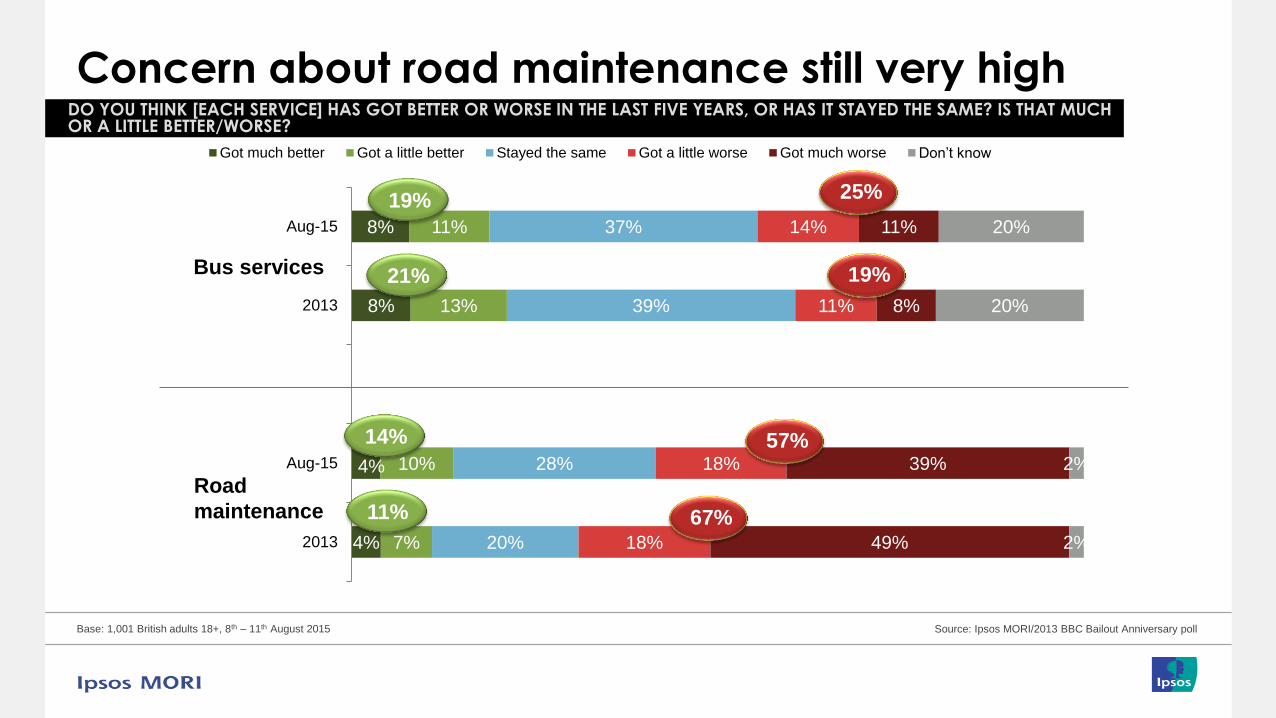
Concern about road maintenance still very high
Base: 1,001 British adults 18+, 8th – 11th August 2015 Source: Ipsos MORI/2013 BBC Bailout Anniversary poll
DO YOU THINK [EACH SERVICE] HAS GOT BETTER OR WORSE IN THE LAST FIVE YEARS, OR HAS IT STAYED THE SAME? IS THAT MUCH OR A LITTLE BETTER/WORSE?
19% 25%
21% 19%
11%
57% 14%
67%

Expectations split on future of public transport THINKING ABOUT PUBLIC TRANSPORT OVER THE NEXT FEW YEARS DO YOU EXPECT IT TO…?
Base: 1,001 British adults 18+, 8th – 11th August 2015, Source: Ipsos MORI
5%
21%
36%
24%
8%
6%
Get much better Get a little better Stay the same Get a little worse Get much worse Don’t know
26%
32%

LOCAL POLICING UNDER PRESSURE

5%
3%
10%
9%
43%
39%
15%
21%
13%
18%
13%
10%
2013
Sep-15
Got much better Got a little better Stayed the same Got a little worse Got much worse Don’t know
The police
More worried about policing
Base: 1,001 British adults 18+, 11th – 13th September 2015 Source: Ipsos MORI/2013 BBC Bailout Anniversary poll
DO YOU THINK [EACH SERVICE] HAS GOT BETTER OR WORSE IN THE LAST FIVE YEARS, OR HAS IT STAYED THE SAME? IS THAT MUCH OR A LITTLE BETTER/WORSE?
12% 39%
28% 15%

A third also expect local policing to get worse in the next few years THINKING ABOUT THE WAY YOUR AREA IS POLICED OVER THE NEXT FEW YEARS DO YOU EXPECT IT TO…?
Base: 1,001 British adults 18+, 8th – 11th August 2015, Source: Ipsos MORI
3% 12%
46%
26%
9%
4%
Get much better Get a little better Stay the same Get a little worse Get much worse Don’t know
15%
35%

31%
27%
16%
21%
12%
18%
16%
15%
21%
16%
4%
3%
Strongly agree Tend to agree Neither agree nor disagree
Tend to disagree Strongly disagree Don’t know
2015
2013
Base: 1,006 British adults 18+, 11th – 13th September 2015, Source: Ipsos MORI/2013 BBC Bailout
Anniversary poll
TO WHAT EXTENT DO YOU AGREE OR DISAGREE WITH THE FOLLOWING STATEMENTS?
People more likely to agree than disagree that cuts to welfare
gone too far…
I THINK CUTS TO WELFARE AND BENEFITS HAVE GONE TOO FAR
48% 31%
37% 47%

29%
22%
30%
25%
11%
16%
9%
17%
16%
17%
6%
3%
Strongly agree Tend to agree Neither agree nor disagree
Tend to disagree Strongly disagree Don’t know
2015
2013
Base: 1,006 British adults 18+, 11th – 13th September 2015 Source: Ipsos MORI/2013 BBC Bailout Anniversary poll
TO WHAT EXTENT DO YOU AGREE OR DISAGREE WITH THE FOLLOWING STATEMENTS?
…although they also think the cuts have been necessary – but less so
than in 2013
I THINK REDUCTIONS IN SOCIAL WELFARE BENEFITS HAVE BEEN NECESSARY
But people are not
always consistent:
eg 37% of those
who think welfare
cuts have gone too
far also think that
the reductions in
benefits have been
necessary
47% 34%
25% 59%

CUTS AND MISPERCEPTIONS

AND WHAT PROPORTION OF THE GOVERNMENT’S PLANNED CUTS TO PUBLIC SPENDING DO YOU THINK HAVE BEEN CARRIED OUT SO FAR?
40%
28%
November 2012
August 2015
People think only 28% of planned cuts have been
made – less than they thought in 2012
Base: 1,001 British adults 18+, 8th – 11th August 2015 Source: Ipsos MORI

I WOULD NOW LIKE YOU TO THINK ABOUT PUBLIC SPENDING ON DIFFERENT SERVICES OVER THE LAST FIVE YEARS.
FOR EACH OF THE FOLLOWING, PLEASE TELL ME BY WHAT PERCENT YOU THINK SPENDING HAS INCREASED OR DECREASED IN REAL TERMS OVER THE LAST FIVE YEARS? PLEASE GIVE YOUR BEST ESTIMATE IF YOU ARE NOT SURE.
-20% -9%
-12% -6%
4% -3%
-1% -5%
-19% 0%
13% -2%
-13% 1%
-49% -5%
65% 11%
-54%
+44%
+14%
-15%
+19%
-4%
-7%
+6%
+11%
Source: Ipsos MORI
Foreign aid [Foreign economic aid]
Housing [housing development: local authority
and other social housing]
Education [all education services from pre-primary to
tertiary and others*]
Pensions and old age benefits [pensions and old
age personal social services]
Transport [national and local roads, local public transport, railway and
other transport]
Other benefits [all social protection not including old age benefits and
pensions]
Health services / NHS [includes medical services and
research and central and other health services]
Defence [includes military, civil, R&D and
other defence and foreign military aid]
Policing [includes immigration and
citizenship and other police services]
Perceived
Actual
Perceived
Actual
Perceived
Actual
Perceived
Actual
Perceived
Actual
Perceived
Actual
Perceived
Actual
Perceived
Actual
Perceived
Actual
But public is wrong about lots of things….
Gap
DEVOLUTION

Source: Ipsos MORI Fieldwork dates: 18° Sept to 29° Sept 2015
As long as services are delivered well, most do not care who makes the decisions,
14%
7%
38%
29%
22%
36%
15%
14%
6%
8%
5%
6%
I don’t care who is
responsible for making
decisions about services in
my local area so long as
they are delivered well
I trust local
politicians/councillors more
than national
politicians/MPs and
ministers to make decisions
about services in my local
area
Strongly agree Tend to agree Neither/nor Tend to disagree Strongly disagree Don't know
Q. To what extent do you agree or disagree with the following statements…?
Base: All adults aged 16-75 in England (3831)
52%
36%

Fieldwork dates: 18° Sept to 29° Sept 2015
You what? Devolution less exciting to them than you
Q. Before today, how much, if anything, would you say you knew about the proposals for devolving more power to local councils, or groups of councils, within England?
Base: All adults aged 16-75 in England (3831)
23%
25%
27%
22%
19%
21%
20%
17%
3%
17%
34%
25%
17%
3%
A great deal
A fair amount
Just a little
Heard of, but knownothing about
Never heard of
Don't know
16%
% knowing ‘a great deal’ or a ‘fair
amount’ about devolution
76%

Fieldwork dates: 18° Sept to 29° Sept 2015
All regions support more devolution
Q. Thinking overall, to what extent, if at all, do you support or oppose giving more decision-making powers (on issues
such as economic development, transport, housing, planning and policing) to local areas?
Base: All adults aged 16-75 in England (3831)
14
16
19
14
15
18
17
20
18
17
57
54
53
48
46
46
46
44
42
49
Yorkshire and The Humber
North West
South West
East Midlands
West Midlands
South East
Greater London
North East
East of England
Overall
% Oppose % SupportNet +%
+42
+38
+33
+34
+31
+29
+28
+24
+24
+32

Fieldwork dates: 18° Sept to 29° Sept 2015
Support for increased accountability and flexibility to respond to local area
needs…however, only a third expect standards of public service to improve
59%
59%
56%
42%
33%
22%
3%
1%
1%
It will allow local councils and other local agencies like the
police to be more flexible in responding to changing local…
Local politicians know better than national politicians what is
best for the local area
Decisions affecting me should be made by local politicians
who are more accountable to local people
It will lead to better joining up and co-ordination between
public services in the local area
Standards of public services will improve in the local area
It will save money when delivering services
Something else
No reason
Don’t know
Q. Why do you say you support devolving more powers to local areas?
Base: All adults stating they support devolution (1862)

Fieldwork dates: 18° Sept to 29° Sept 2015
Concerns that devolution will result in a ‘postcode lottery’ when it
comes to service delivery – plus distrust in politicians
58%
58%
44%
43%
41%
41%
39%
36%
27%
11%
*%
1%
Standards of services risk being different depending on where
you live – a ‘postcode lottery’
I don’t trust local politicians to make the right decisions for the
local area
It will lead to services being less joined up
It will do nothing to improve local services
It won’t lead to savings
Local politicians do not always know what is best for the local
area
It will cost money to implement
Standards of service will decline in the local area
I think taxes will increase
Something else
No reason
Don’t know
Q. Why do you say you oppose devolving more powers to local areas?
Base: All stating they don’t support devolution (656)

Fieldwork dates: 18° Sept to 29° Sept 2015
On many issues say do want local control….
17%
25%
35%
36%
44%
56%
64%
65%
57%
47%
47%
38%
26%
18%
New housing developments
Transport, such as buses/cycle
network & trains
Schools and further education
colleges
Crime and policing services
Health and social care services
New infrastructure projects
related to air/rail/road networks
Welfare benefit payments, such
as HB and CTC
Nationally Locally
Q. For each of the following services, do you think decisions should be taken nationally for England as a whole or
locally by local bodies such as councils or other local service providers?
Base: All adults aged 16-75 in England (3831)

Fieldwork dates: 18° Sept to 29° Sept 2015
But also want SAME STANDARDS everywhere….
Q. To what extent do you agree or disagree with the following statement…?
Base: All adults aged 16-75 in England (3831)
36%
35%
16%
6% 1% 5%
Strongly agree Tend to agree Neither/nor Tend to disagree Strongly disagree Don't know
“Standards of public
services should be
the same everywhere in
England”

Fieldwork dates: 18° Sept to 29° Sept 2015
Need to elect a mayor is more likely than not to make public support
devolution, although over a quarter are undecided
17%
19%
15%
13%
9%
27%
I support more devolution
regardless of the need to elect a…
I am more likely to support
devolution if I have to elect a…
I am less likely to support devolution
if I have to elect a mayor
I do not support devolution anyway
regardless of whether it might…
None of the above
Don’t know
Q. Which of these statements comes closest to your views about devolution and the need for a mayor?
Base: All adults aged 16-75 in England (3831)

Fieldwork dates: 18° Sept to 29° Sept 2015
Most people think the London mayor has had a positive impact
Base: All adults aged 16-75 in England (3831)
9%
37%
31%
6%
3%
15%
Very positive Fairly positive No impact
Fairly negative Very negative Don't know
Q. As you may know London has an independent elected mayor, currently Boris Johnson. Do you think that having an independently elected mayor has had a positive or negative impact on London?
10%
9%
9%
9%
8%
8%
8%
8%
6%
9%
40%
42%
36%
30%
37%
37%
36%
26%
36%
37%
South East
Greater London
South West
West Midlands
Yorkshire and The…
East of England
East Midlands
North East
North West
Overall
Very positive impact Fairly positive impact
45%

Source: Ipsos MORI Fieldwork dates: 18° Sept to 29° Sept 2015 Fieldwork dates: 18° Sept to 29° Sept 2015
7%
25%
30%
15%
10%
14%
Consistently find mixed views of giving tax/spend powers to you
Q. To what extent, if at all, do you support or oppose giving similar powers around tax and spending for…
Base: All adults aged 16-75 in England (3831)
7%
26%
30%
14%
10%
13%
STRONGLY SUPPORT
TEND TO SUPPORT
NEITHER SUPPORT NOR
OPPOSE
TEND TO OPPOSE
STRONGLY OPPOSE
DON’T KNOW
Support 33%
Oppose 24%
Support 31%
Oppose 25%
Major cities
English counties
+9 +6


Some evidence we are actually getting happier Fairly or very satisfied with life overall
1975 2014
94%
86%

In conclusion - change is coming (as always)
Technology changes fast
Values change relatively slowly
Transparency and lack of trust…
Greatest human needs unchanged
Things aren’t so bad
Good luck!