Embed Size (px)
Citation preview
SAK Good Job Index 2016
A good job empowers the worker

SAK Good Job Index 2016
A good job empowers the worker

ISBN 978-951-714-308-0Kannen kuva: Reijo Nenonen / Vastavalo.fi
2
Contents
The SAK Good Job Index 3
How did we take the measurements? 4
Increasing problems on decision making at work 5
A greater feeling of safety 6
Good jobs are still rare 7
Lower rates of illness in good jobs… 8
… and employees cope for longer 9
Who has good working conditions? 11
Tables annex 12
Employment essentials 12
A smooth working experience 14
the sAK Good Job Index
As part of its 2014 Working Life Barometer, the Central Organisation of Finnish Trade Unions (SAK) has compiled a new Good Job Index describing the quality of life at work. The template for the Index is the SAK Good Job report and the Gute Arbeit index used by the German Confederation of Trade Unions (DGB).
The Good Job Index now forms part of the biennial SAK Working Life Barom-eter. The 2016 survey was conducted in February-March, based on responses from 1,200 members of SAK-affiliated trade unions.
3
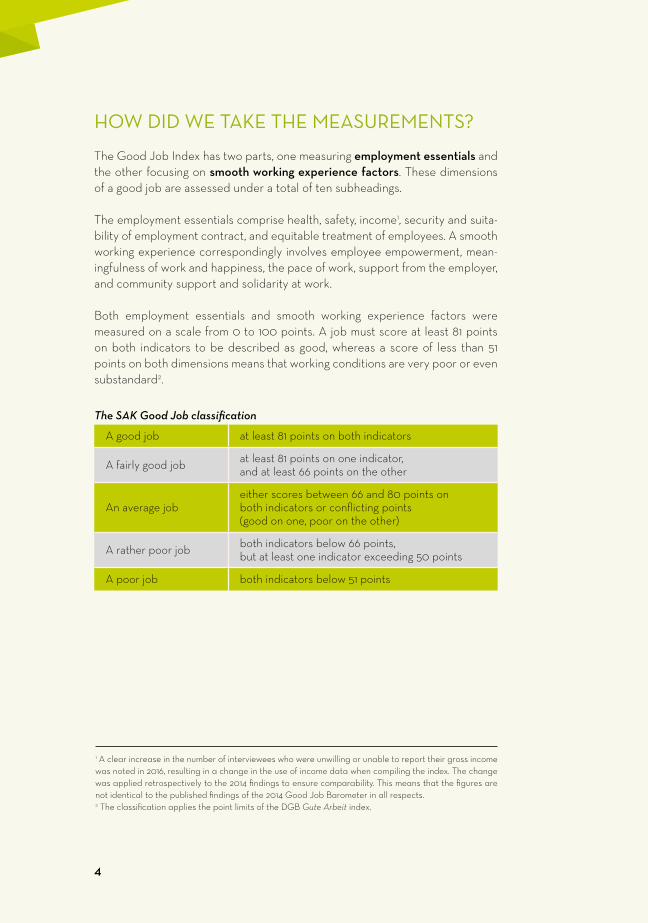
how dId we tAKe the meAsurements?
The Good Job Index has two parts, one measuring employment essentials and the other focusing on smooth working experience factors. These dimensions of a good job are assessed under a total of ten subheadings.
The employment essentials comprise health, safety, income1, security and suita-bility of employment contract, and equitable treatment of employees. A smooth working experience correspondingly involves employee empowerment, mean-ingfulness of work and happiness, the pace of work, support from the employer, and community support and solidarity at work.
Both employment essentials and smooth working experience factors were measured on a scale from 0 to 100 points. A job must score at least 81 points on both indicators to be described as good, whereas a score of less than 51 points on both dimensions means that working conditions are very poor or even substandard2.
The SAK Good Job classification
A good job at least 81 points on both indicators
A fairly good job at least 81 points on one indicator, and at least 66 points on the other
An average jobeither scores between 66 and 80 points on both indicators or conflicting points (good on one, poor on the other)
A rather poor job both indicators below 66 points, but at least one indicator exceeding 50 points
A poor job both indicators below 51 points
1 A clear increase in the number of interviewees who were unwilling or unable to report their gross income was noted in 2016, resulting in a change in the use of income data when compiling the index. The change was applied retrospectively to the 2014 findings to ensure comparability. This means that the figures are not identical to the published findings of the 2014 Good Job Barometer in all respects. 2 The classification applies the point limits of the DGB Gute Arbeit index.
4
InCreAsInG problems on deCIsIon mAKInG At worK
The SAK Good Job Index indicates that employees possibilities on decision making at work has significantly deteriorated over the last two years.
The working life barometer survey of the Ministry of Economic Affairs and Em-ployment indicates that no progress has been made at all since the turn of the century in the ability of employees to influence the pace of work, their duties, the division of labour, or the places where work is done. The same survey sug-gests that blue-collar employees have considerably less influence over their own work than their colleagues in clerical occupations.
This problem is even more clearly evident in the findings of the SAK Working Life Barometer, which indicate a deterioration in empowerment of members of SAK-affiliated trade unions in 2012 compared to previous measurements in all sectors.3
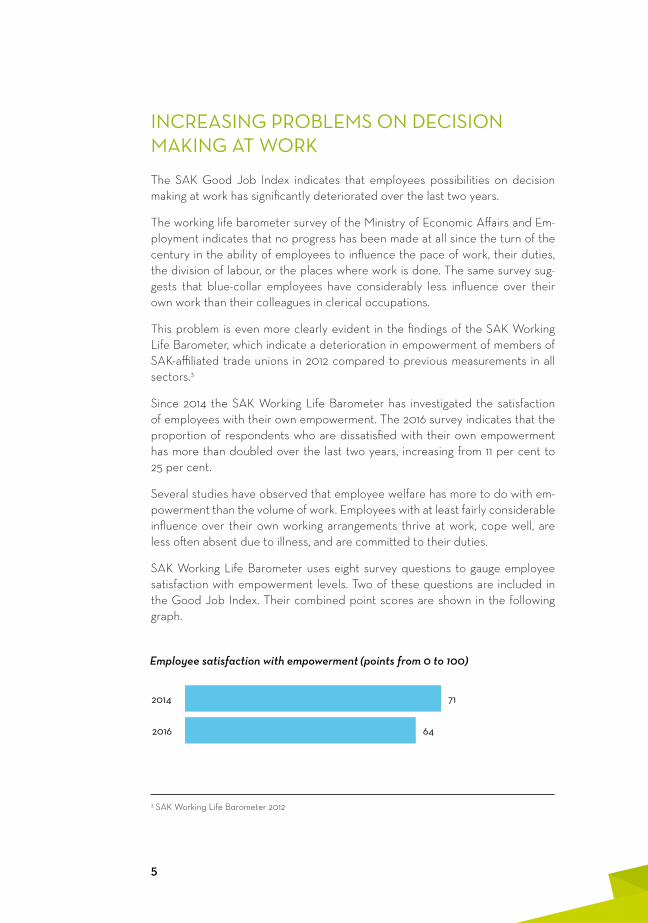
Since 2014 the SAK Working Life Barometer has investigated the satisfaction of employees with their own empowerment. The 2016 survey indicates that the proportion of respondents who are dissatisfied with their own empowerment has more than doubled over the last two years, increasing from 11 per cent to 25 per cent.
Several studies have observed that employee welfare has more to do with em-powerment than the volume of work. Employees with at least fairly considerable influence over their own working arrangements thrive at work, cope well, are less often absent due to illness, and are committed to their duties.
SAK Working Life Barometer uses eight survey questions to gauge employee satisfaction with empowerment levels. Two of these questions are included in the Good Job Index. Their combined point scores are shown in the following graph.
Employee satisfaction with empowerment (points from 0 to 100)
3 SAK Working Life Barometer 2012
64
71
2016
2014
5
A GreAter feelInG of sAfety
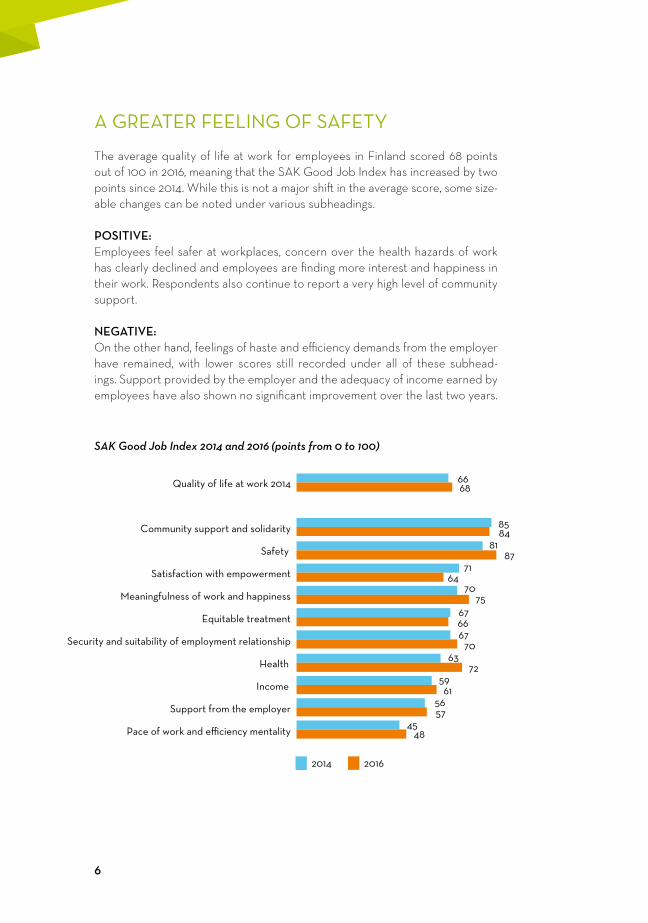
The average quality of life at work for employees in Finland scored 68 points out of 100 in 2016, meaning that the SAK Good Job Index has increased by two points since 2014. While this is not a major shift in the average score, some size-able changes can be noted under various subheadings.
POSITIVE: Employees feel safer at workplaces, concern over the health hazards of work has clearly declined and employees are finding more interest and happiness in their work. Respondents also continue to report a very high level of community support.
NEGATIVE: On the other hand, feelings of haste and efficiency demands from the employer have remained, with lower scores still recorded under all of these subhead-ings. Support provided by the employer and the adequacy of income earned by employees have also shown no significant improvement over the last two years.
66
85
81
71
70
67
67
63
59
56
45
68
84
87
64
75
66
70
72
61
57
48
Quality of life at work 2014
Community support and solidarity
Safety
Satisfaction with empowerment
Meaningfulness of work and happiness
Equitable treatment
Security and suitability of employment relationship
Health
Income
Support from the employer
Pace of work and efficiency mentality
2014 2016
6
SAK Good Job Index 2014 and 2016 (points from 0 to 100)
Good Jobs Are stIll rAre
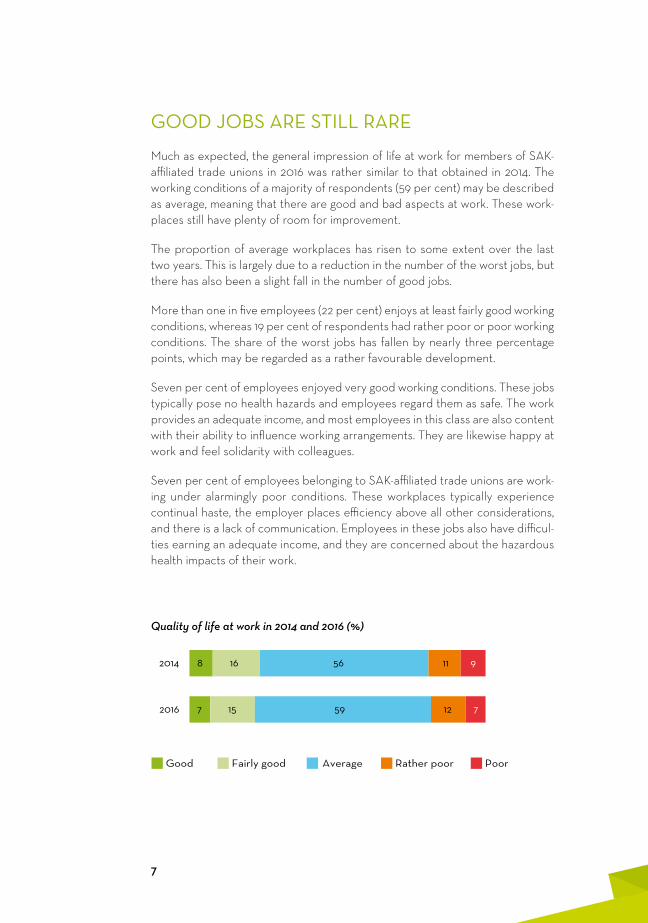
Much as expected, the general impression of life at work for members of SAK-affiliated trade unions in 2016 was rather similar to that obtained in 2014. The working conditions of a majority of respondents (59 per cent) may be described as average, meaning that there are good and bad aspects at work. These work-places still have plenty of room for improvement.
The proportion of average workplaces has risen to some extent over the last two years. This is largely due to a reduction in the number of the worst jobs, but there has also been a slight fall in the number of good jobs.
More than one in five employees (22 per cent) enjoys at least fairly good working conditions, whereas 19 per cent of respondents had rather poor or poor working conditions. The share of the worst jobs has fallen by nearly three percentage points, which may be regarded as a rather favourable development.
Seven per cent of employees enjoyed very good working conditions. These jobs typically pose no health hazards and employees regard them as safe. The work provides an adequate income, and most employees in this class are also content with their ability to influence working arrangements. They are likewise happy at work and feel solidarity with colleagues.
Seven per cent of employees belonging to SAK-affiliated trade unions are work-ing under alarmingly poor conditions. These workplaces typically experience continual haste, the employer places efficiency above all other considerations, and there is a lack of communication. Employees in these jobs also have difficul-ties earning an adequate income, and they are concerned about the hazardous health impacts of their work.
7
Quality of life at work in 2014 and 2016 (%)
7
8
15
16
59
56
12
11
7
9
2016
2014
Good Fairly good Average Rather poor Poor
lower rAtes of Illness In Good Jobs...
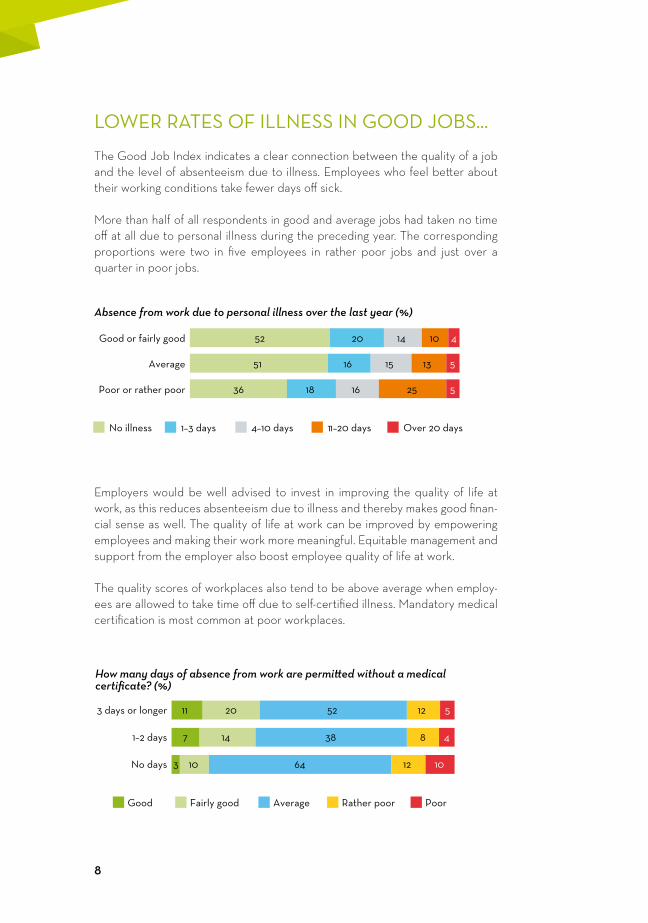
The Good Job Index indicates a clear connection between the quality of a job and the level of absenteeism due to illness. Employees who feel better about their working conditions take fewer days off sick.
More than half of all respondents in good and average jobs had taken no time off at all due to personal illness during the preceding year. The corresponding proportions were two in five employees in rather poor jobs and just over a quarter in poor jobs.
Absence from work due to personal illness over the last year (%)
How many days of absence from work are permitted without a medical certificate? (%)
52
51
36
20
16
18
14
15
16
10
13
25
4
5
5
Good or fairly good
Average
Poor or rather poor
No illness 1–3 days 4–10 days 11–20 days Over 20 days
Employers would be well advised to invest in improving the quality of life at work, as this reduces absenteeism due to illness and thereby makes good finan-cial sense as well. The quality of life at work can be improved by empowering employees and making their work more meaningful. Equitable management and support from the employer also boost employee quality of life at work.
The quality scores of workplaces also tend to be above average when employ-ees are allowed to take time off due to self-certified illness. Mandatory medical certification is most common at poor workplaces.
11
7
3
20
14
10
52
38
64
12
8
12
5
4
10
3 days or longer
1–2 days
No days
Good Fairly good Average Rather poor Poor
8
Several studies have observed a clear fall in absenteeism due to illness as em-ployees gain more influence at workplaces. The number of absences due to illness has fallen at many workplaces after self-certification schemes were in-troduced, and SAK recommends a practice whereby employees may be absent from work due to illness for up to three days, and possibly even for up to five days during epidemics, simply by notifying a supervisor.
… And employees Cope for lonGer
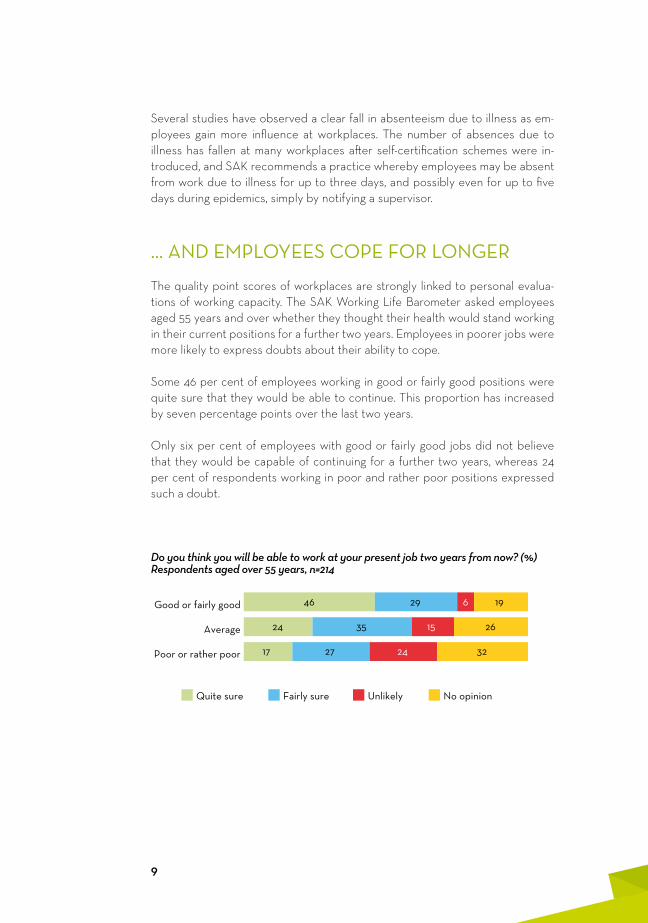
The quality point scores of workplaces are strongly linked to personal evalua-tions of working capacity. The SAK Working Life Barometer asked employees aged 55 years and over whether they thought their health would stand working in their current positions for a further two years. Employees in poorer jobs were more likely to express doubts about their ability to cope.
Some 46 per cent of employees working in good or fairly good positions were quite sure that they would be able to continue. This proportion has increased by seven percentage points over the last two years.
Only six per cent of employees with good or fairly good jobs did not believe that they would be capable of continuing for a further two years, whereas 24 per cent of respondents working in poor and rather poor positions expressed such a doubt.
Do you think you will be able to work at your present job two years from now? (%)Respondents aged over 55 years, n=214
46
24
17
29
35
27
6
15
24
19
26
32
Good or fairly good
Average
Poor or rather poor
Quite sure Fairly sure Unlikely No opinion
9
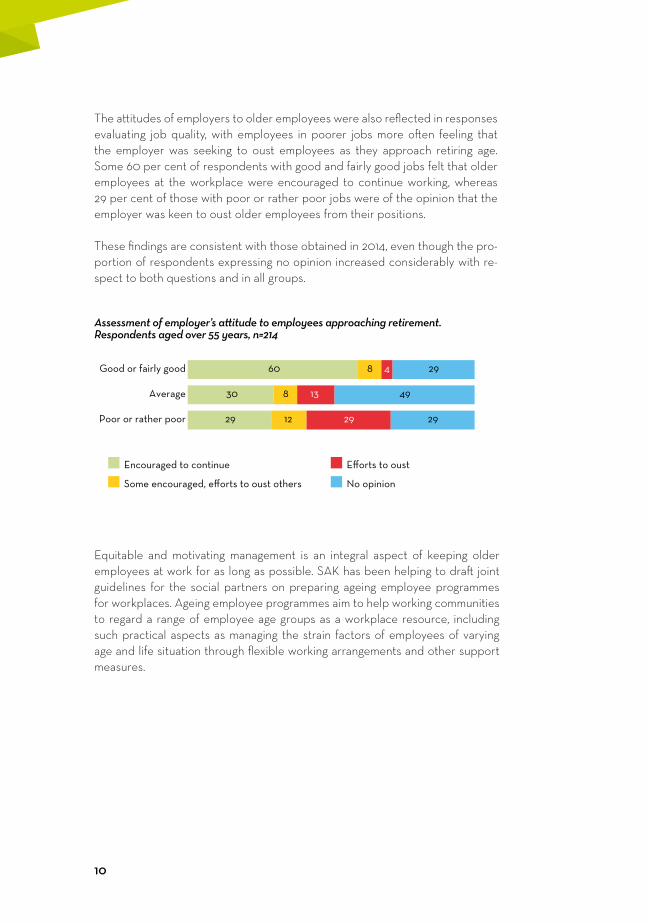
The attitudes of employers to older employees were also reflected in responses evaluating job quality, with employees in poorer jobs more often feeling that the employer was seeking to oust employees as they approach retiring age. Some 60 per cent of respondents with good and fairly good jobs felt that older employees at the workplace were encouraged to continue working, whereas 29 per cent of those with poor or rather poor jobs were of the opinion that the employer was keen to oust older employees from their positions.
These findings are consistent with those obtained in 2014, even though the pro-portion of respondents expressing no opinion increased considerably with re-spect to both questions and in all groups.
Assessment of employer’s attitude to employees approaching retirement. Respondents aged over 55 years, n=214
60
30
29
8
8
12
4
13
29
29
49
29
Good or fairly good
Average
Poor or rather poor
Encouraged to continue
Some encouraged, efforts to oust others
Efforts to oust
No opinion
Equitable and motivating management is an integral aspect of keeping older employees at work for as long as possible. SAK has been helping to draft joint guidelines for the social partners on preparing ageing employee programmes for workplaces. Ageing employee programmes aim to help working communities to regard a range of employee age groups as a workplace resource, including such practical aspects as managing the strain factors of employees of varying age and life situation through flexible working arrangements and other support measures.
10
who hAs Good worKInG CondItIons?
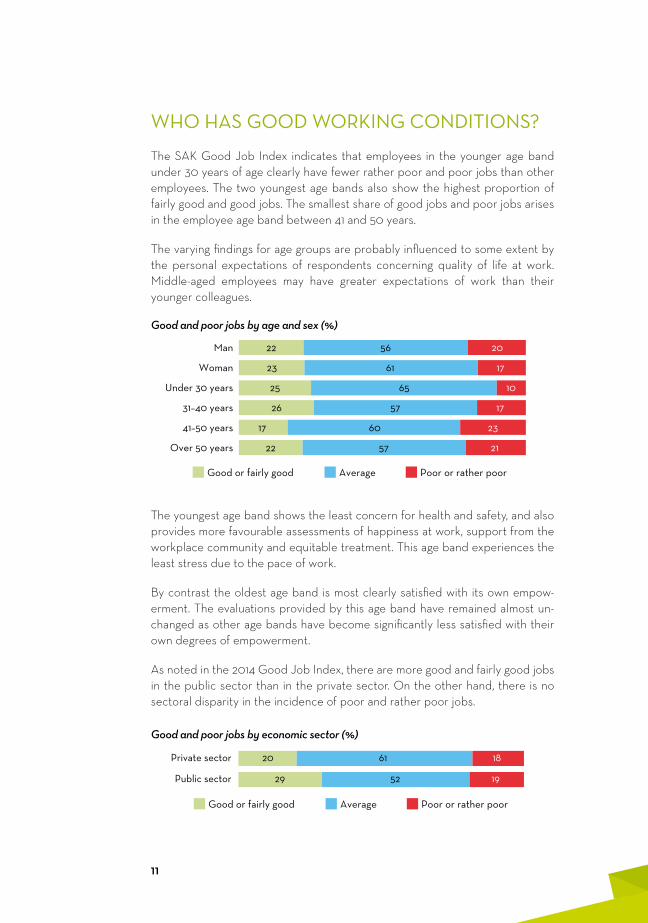
The SAK Good Job Index indicates that employees in the younger age band under 30 years of age clearly have fewer rather poor and poor jobs than other employees. The two youngest age bands also show the highest proportion of fairly good and good jobs. The smallest share of good jobs and poor jobs arises in the employee age band between 41 and 50 years.
The varying findings for age groups are probably influenced to some extent by the personal expectations of respondents concerning quality of life at work. Middle-aged employees may have greater expectations of work than their younger colleagues.
Good and poor jobs by age and sex (%)
22
17
26
25
23
22
57
60
57
65
61
56
21
23
17
10
17
20
Over 50 years
41–50 years
31–40 years
Under 30 years
Woman
Man
Good or fairly good Average Poor or rather poor
The youngest age band shows the least concern for health and safety, and also provides more favourable assessments of happiness at work, support from the workplace community and equitable treatment. This age band experiences the least stress due to the pace of work.
By contrast the oldest age band is most clearly satisfied with its own empow-erment. The evaluations provided by this age band have remained almost un-changed as other age bands have become significantly less satisfied with their own degrees of empowerment.
As noted in the 2014 Good Job Index, there are more good and fairly good jobs in the public sector than in the private sector. On the other hand, there is no sectoral disparity in the incidence of poor and rather poor jobs.
Good and poor jobs by economic sector (%)
29
20
52
61
19
18
Public sector
Private sector
Good or fairly good Average Poor or rather poor
11
12
tAbles Annex
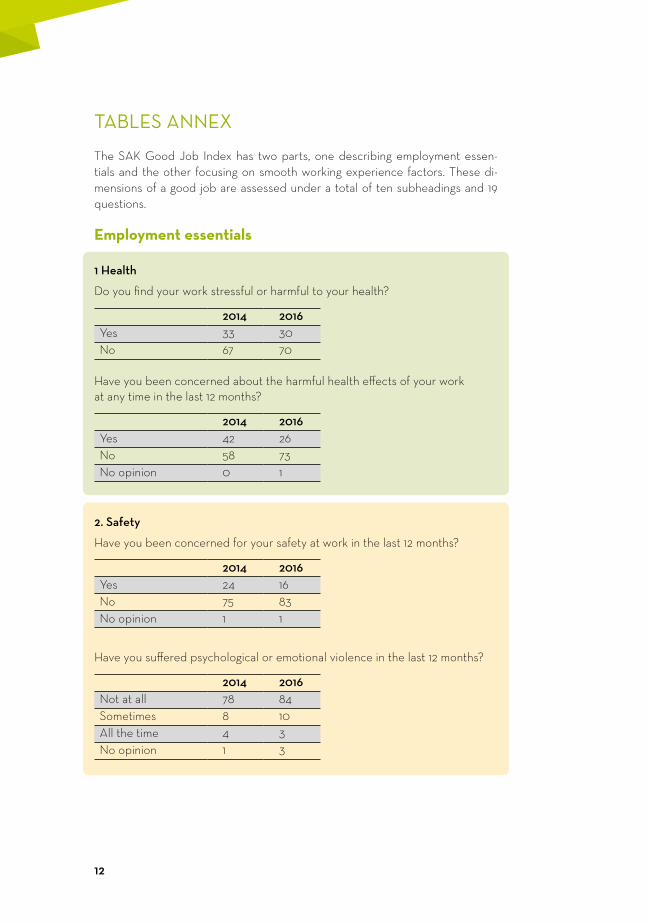
The SAK Good Job Index has two parts, one describing employment essen-tials and the other focusing on smooth working experience factors. These di-mensions of a good job are assessed under a total of ten subheadings and 19 questions.
employment essentials
1 Health
Do you find your work stressful or harmful to your health?
2014 2016Yes 33 30No 67 70
Have you been concerned about the harmful health effects of your work at any time in the last 12 months?
2014 2016Yes 42 26No 58 73No opinion 0 1
2. Safety
Have you been concerned for your safety at work in the last 12 months?
2014 2016Yes 24 16No 75 83No opinion 1 1
Have you suffered psychological or emotional violence in the last 12 months?
2014 2016Not at all 78 84Sometimes 8 10All the time 4 3No opinion 1 3
13
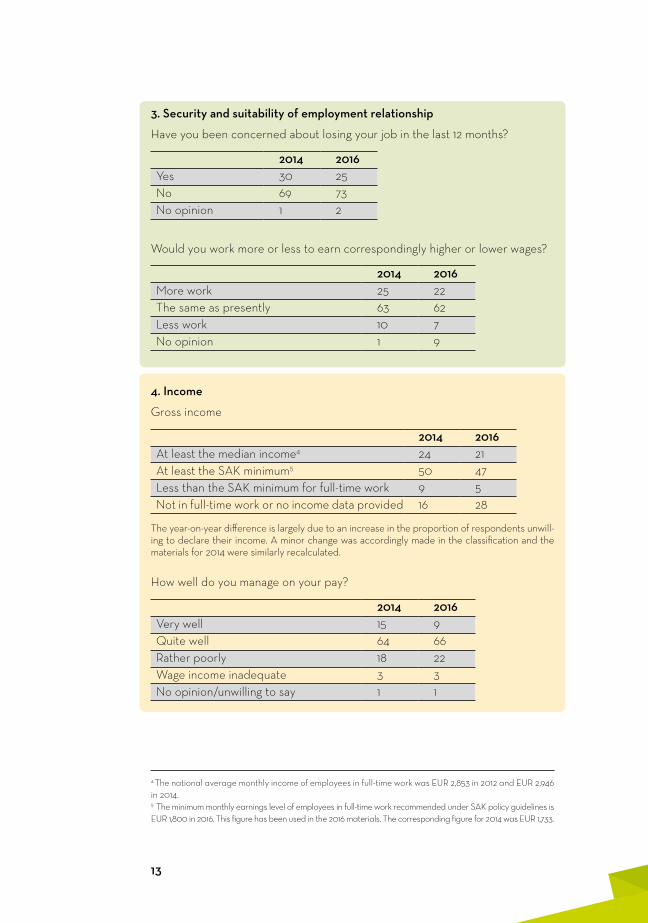
3. Security and suitability of employment relationship
Have you been concerned about losing your job in the last 12 months?
2014 2016Yes 30 25No 69 73No opinion 1 2
Would you work more or less to earn correspondingly higher or lower wages?
2014 2016More work 25 22The same as presently 63 62Less work 10 7No opinion 1 9
4. Income
Gross income
2014 2016At least the median income4 24 21At least the SAK minimum5 50 47Less than the SAK minimum for full-time work 9 5Not in full-time work or no income data provided 16 28
The year-on-year difference is largely due to an increase in the proportion of respondents unwill-ing to declare their income. A minor change was accordingly made in the classification and the materials for 2014 were similarly recalculated.
How well do you manage on your pay?
2014 2016Very well 15 9Quite well 64 66Rather poorly 18 22Wage income inadequate 3 3No opinion/unwilling to say 1 1
4 The national average monthly income of employees in full-time work was EUR 2,853 in 2012 and EUR 2,946 in 2014. 5 The minimum monthly earnings level of employees in full-time work recommended under SAK policy guidelines is EUR 1,800 in 2016. This figure has been used in the 2016 materials. The corresponding figure for 2014 was EUR 1,733.
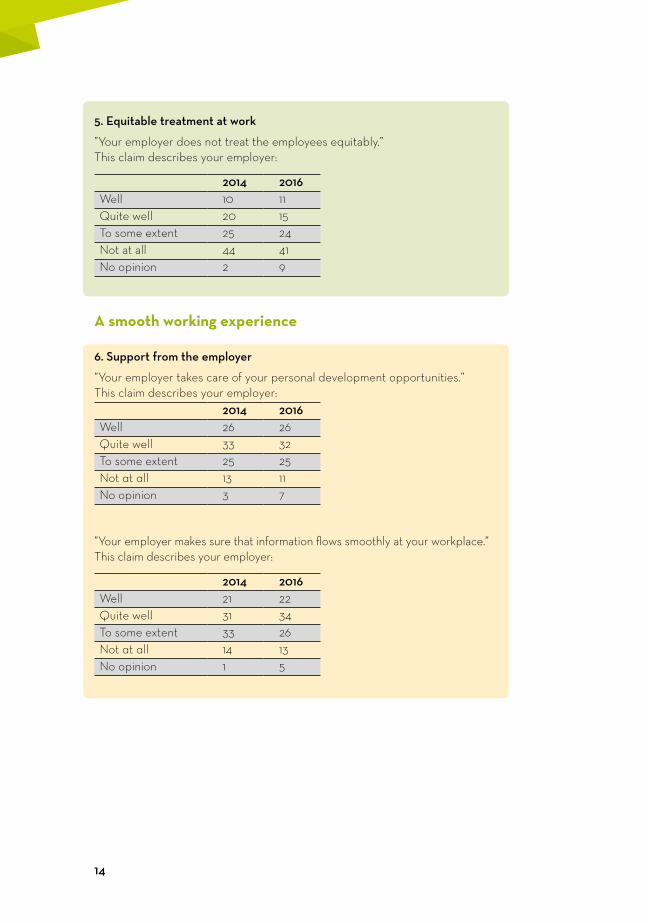
5. Equitable treatment at work
”Your employer does not treat the employees equitably.” This claim describes your employer:
2014 2016Well 10 11Quite well 20 15To some extent 25 24Not at all 44 41No opinion 2 9
A smooth working experience
6. Support from the employer
”Your employer takes care of your personal development opportunities.” This claim describes your employer:
2014 2016Well 26 26Quite well 33 32To some extent 25 25Not at all 13 11No opinion 3 7
”Your employer makes sure that information flows smoothly at your workplace.” This claim describes your employer:
2014 2016Well 21 22Quite well 31 34To some extent 33 26Not at all 14 13No opinion 1 5
14
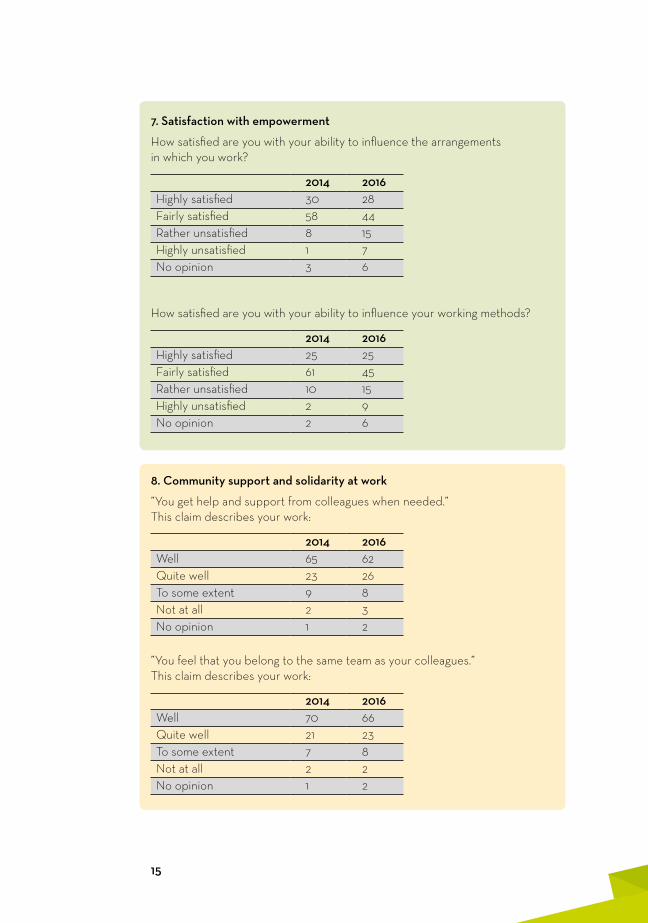
7. Satisfaction with empowerment
How satisfied are you with your ability to influence the arrangements in which you work?
2014 2016Highly satisfied 30 28Fairly satisfied 58 44Rather unsatisfied 8 15Highly unsatisfied 1 7No opinion 3 6
How satisfied are you with your ability to influence your working methods?
2014 2016Highly satisfied 25 25Fairly satisfied 61 45Rather unsatisfied 10 15Highly unsatisfied 2 9No opinion 2 6
8. Community support and solidarity at work
”You get help and support from colleagues when needed.” This claim describes your work:
2014 2016Well 65 62Quite well 23 26To some extent 9 8Not at all 2 3No opinion 1 2
”You feel that you belong to the same team as your colleagues.” This claim describes your work:
2014 2016Well 70 66Quite well 21 23To some extent 7 8Not at all 2 2No opinion 1 2
15
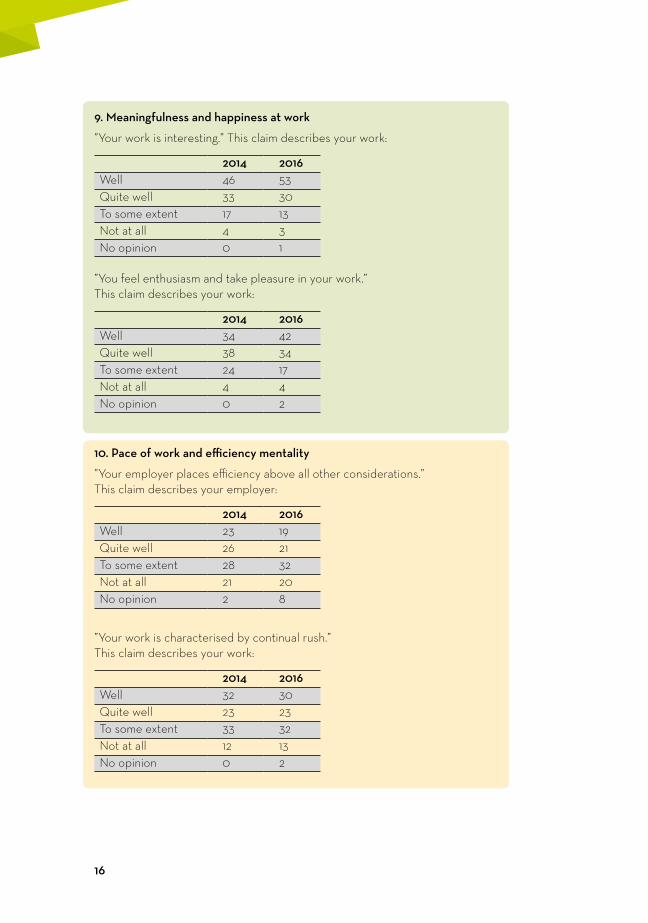
9. Meaningfulness and happiness at work
”Your work is interesting.” This claim describes your work:
2014 2016Well 46 53Quite well 33 30To some extent 17 13Not at all 4 3No opinion 0 1
”You feel enthusiasm and take pleasure in your work.” This claim describes your work:
2014 2016Well 34 42Quite well 38 34To some extent 24 17Not at all 4 4No opinion 0 2
10. Pace of work and efficiency mentality
”Your employer places efficiency above all other considerations.” This claim describes your employer:
2014 2016Well 23 19Quite well 26 21To some extent 28 32Not at all 21 20No opinion 2 8
”Your work is characterised by continual rush.” This claim describes your work:
2014 2016Well 32 30Quite well 23 23To some extent 33 32Not at all 12 13No opinion 0 2
16

The SAK Good Job Index shows a significant deterioration in employee empowerment over the last two years. A good job allows employees to influence their own working arrangements. Several studies indicate that employee empowerment substantially improves job satisfaction and workplace productivity. SAK uses the Good Job Index to measure the quality of life at work in Finland. Based on the findings of the SAK Working Life Barometer, this analysis is made every two years.