Embed Size (px)
Citation preview

Topic Syllabus:Basic GIS
Session 1: Introduction to GIS: Basic Concepts and Map Appreciation

Key Areas:
• GIS Competency Assessment• Basic Concepts on GIS• Map Appreciation• Definition of Metadata• Role of GIS in CLUP

Topic Objectives:
• Develop an understanding on the basic concept of GIS, its role in land use planning and map appreciation.
• Identify the map and data requirements for situational analysis.
• Understand and appreciate the elements on the map, as well as, evaluate its utilization into GIS.

Output/Key Result Area
• Identify competencies of participants• Understand the concepts and
principles of GIS• Enhanced appreciation on maps• List of map requirements

Content Outline
• Basic Concepts on GIS• Map Appreciation• Definition of Metadata• Role of GIS in CLUP

Steps and Procedures
1. Determine competency of participants.2. Present Powerpoint on Introduction to GIS, Map Basics,
Metadata3. Workshop on Map appreciation4. Present sample maps and entry points of GIS in the
CLUP process5. Distribute map and data requirements table (CLUP excel
tables) and GIS training files


GEOGRAPHIC INFORMATION SYSTEM
“Geographic Information”
“Information System”
“System”
What is ?
Spatial Database

• An organized collection of computer hardware, software, geographic data, and personnel designed to efficiently capture, store, update, manipulate, analyze, and display all forms of geographically referenced information.www.fws.gov/data/IMADS/glossary.htm
• A system of computer hardware, software and data for collecting, storing, analyzing and disseminating information about areas of the earth. www.oahutrans2k.com/info/glossary/G.htm
Some Definition of GIS
• A Geographic Information System is a computer-based tool for mapping and analyzing things that exist and events that happen in the local authority. GIS technology integrates common database operations such as query and statistical analysis with the unique visualization and geographic analysis benefits offered by maps. A geographic information system is the combination of skilled people having achieved training, spatial and attribute/descriptive data, analytic methods, computer software and hardware all organized to automate, manage, and deliver information through geographic information. http://cookbook.hlurb.gov.ph/3-01-introduction

An Early Example of GIS
Since these figures represent something else that have associated attributes, these cave paintings may be considered a GIS.

… modern GIS equivalent
Caribou Herds are tracked through GPS and monitored using a GIS software

All of these must be found to have a well functioning GIS

HARDWARE

HARDWARE
• Computer• Input
Devices- Scanner- Digitizer
- GPS
• Output Devices
- Plotter
- Printer

GIS software provides the functions and tools needed to store, analyse, and display geographic information. Key software components are:
Tools for the input and manipulation of geographic information A database management system (DBMS) Tools that support geographic query, analysis, and visualisation A graphical user interface (GUI) for easy access to tools
SOFTWARE

SOFTWARE

METHODOLOGY
Also called Applications or Analysis

METHODOLOGY
Process of transforming data to information

An Example of Methodology

Location of Subdivision Project
METHODOLOGY

Data

GIS DATA
• Base Maps – include roads, political boundaries, rivers and lakes, parks and landmarks; place names
• Environmental maps - include data related to the environment, weather, environmental risk, satellite imagery, topography, and natural resources.
• Socio-economic data - include data related to census/demography, health care, real state, telecommunications, emergency preparedness, crime, business establishments, and transportation.
Data

Kinds of Data that GIS Handles• Spatial data
• data pertaining to the location and spatial dimensions of geographical entities, and data that can be linked to locations in geographic space, usually via features on a map.
• usually translated into simple objects: points, lines, areas and grids (pixels).
• Example: Barangay Map, Land Parcels

Kinds of Data that GIS Handles• Attribute data (Non-spatial or Aspatial Data)
• Usually organized in tables• refers to the properties of a specific, precisely defined location. The data are
often statistical but may be text, images or multi-media. These are linked in the GIS to spatial data that define the location. They are often referred to as non-spatial data since they do not in themselves represent location information.
• Example: Barangay Name, PIN

Geographic Data Characteristics• Spatial data
and their attributes are linked• By their
geographic location
• By unique identifiers

Spatial Data Types• Two major categories of spatial data representation in GIS:
raster and vector.• Raster approach: cells• Vector approach: points, lines, and polygons

RASTER FILEVECTOR FILE

Some Examples for Each Data Type
Raster
Vector
- Satellite Images (tif, bsq, bil)
- Orthophotos (tif,sid)
- Scanned images (tif, gif, jpg, bmp)
- Drawing Files (dwg) - AutoCAD
- Shapefiles (shp,shx,dbf) - ESRI’s ArcView
- TAB (tab) - MapInfo

Data Build Up in the Cookbook
From Paper Map
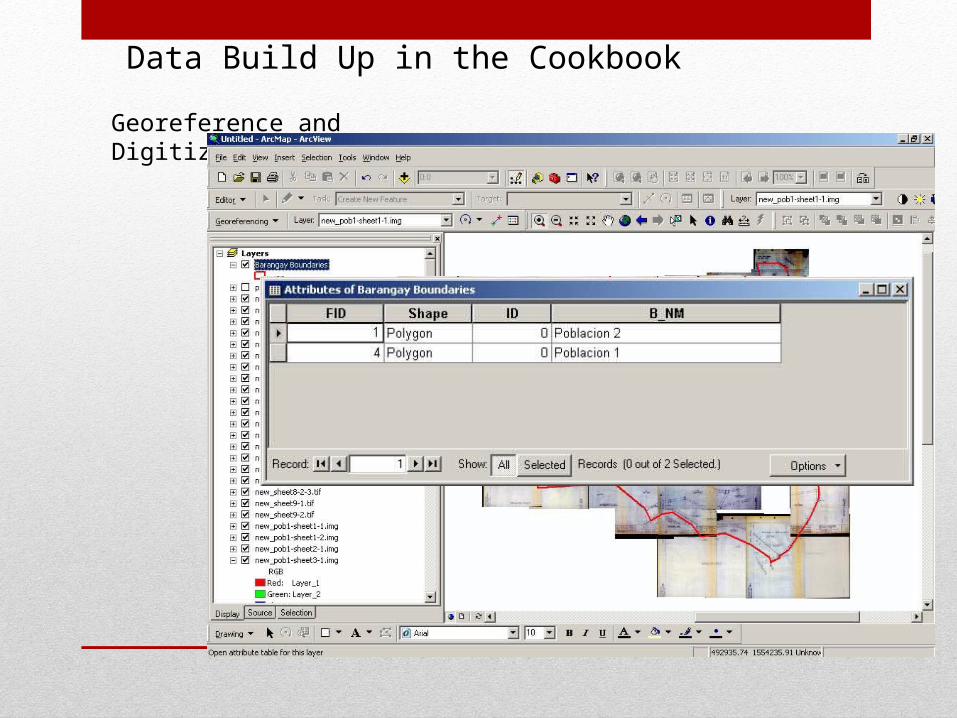
Data Build Up in the Cookbook
Georeference and Digitize

Data Build Up in the Cookbook
Fill out the Excel

Data Build Up in the Cookbook
Open the tables in GIS and Join

Data Build Up in the Cookbook
Create the Thematic Map Required in the Information Product

Manpower/PeopleA vital component of any system is the people as they are the ones who will make the system a useful service.

Money
Money
Dependent
Skills Development
Mindset of users and beneficiaries

Manpower/People
• Advocate use
• Develop Skills – Users must be comfortable first in
using GIS as Maps
What should People part of GIS do?

KNOW GIS IN THEORY
MASTER GIS AS A PRESENTATION TOOL
MASTER ATTRIBUTE DATA IN A GIS
BUILD GEOGRAPHIC INFORMATION
BUILD BASIC ATTRIBUTE DATA IN THEMATIC ACTIVITIES
USE GIS AS AN ANALYSIS TOOL
GIS BUILDING IN THE PLANNING OFFICE
EXCHANGE OF DATA BETWEEN LGU ‘OFFICES’
EXCHANGE OF DATA BETWEEN LGU AND OTHER INSTITUTIONS
TRAIN OTHERS IN GIS
MASTER BASIC GIS AS A DRAWING TOOL
Training
Practice and Simple use
Application to CLUP


GPS and Digital Maps on Mobile Phones

Map Appreciation

What is a Map?
• directions• Location or positions of existing features• Areas/coverage/extent• Distance• Boundaries• Ground features or characteristics• Facts, events, trends, predictions, possibilities and other
phenomena
A map shows :

In a map …Real world features are represented graphically by
using symbols on a plane surface at their correct positions and at a reduced scale
Landmarks to Point Roads to Line
Parcel or Lots to Polygon

Basic Map Contents
• Primary content – actual subject of the map or its main theme, i.e., land use, geology, topography
• Secondary content – includes grids, graticules and values of longitude and latitude around the maps sheet, i.e., administrative boundaries, roads, grid
• Supportive content – are the marginal information such as the title, scale, legend, location diagram, projection, explanatory text, north orientation, date and author, scale bar

Primary Content
Secondary ContentSupportive Content

Parts of a Map

Map Window• Contain the primary and
Secondary Content• The map window shall occupy
the largest area of the map.

Map Title• Defines the information and the
purpose of the map.• includes the geographical area,
the most important administrative and/or political subdivision or other features presented
• Example: Geologic Map, Urban Land Use Map, Topographic Map

Legend
• Column of symbols (as reflected in map) and their descriptions.
• It provides explanation and classification of map elements.

Grid• a reference system made of straight lines intersecting one another at right angles
• Represents information as an array of equally sized square cells arranged in rows and columns.

Scale• Scale – the relationship between a distance on
the map and the true distance on the ground measured in the same unit. Ex. 1:10,000
• Small (e.g., 1:250,000) vs. large (e.g., 1:10,000)• There must be only one scale for the map

Scale• Ways to show the map scale
• Graphic scale is a line or with the distance represented by the length of the line/bar marked on the ends of the line/bar (also called scale bar)
• Fractional scale like 1:5,000 or 1:1,000,000• Verbal/Descriptive scale is a statement such as 1 inch=100 feet

Source of Data, Date and Author
• Source of information and its date or the date of the survey or period covered
• Name of the author/producer of the map

North Orientation
• Provides the user the proper perspective in interpreting the information on the map.

Reservations/Explanatory Notes/Disclaimer
• Added for the purposes of further clarification, interpretation and evaluation of the contents of the maps.

Projection and Datum
• Projection and Datum used in creating the Map

Year 2000

Metadata: Definition• Traditionally: metadata has been described as data
about data.• Metadata is the term used to describe the summary
information of a set of data or “data about data”
Example: • A library catalogue contains information ( metadata) about
publications (data)

• Metadata can be defined as geospatial data describing its characteristics in terms of:
• Content• Quality• Processing history• Format, projection etc.

Why is metadata important ?The data user needs metadata to determine whether or not a particular data set exists and to decide whether or not the data is appropriate for use.
Proper metadata should describe who, what, when, where, why and how about all aspects of a GIS data set.

• When was the map prepared ?• Who prepared the map ?• What type of projection ?• What is the file name ?

Role of GIS in CLUP

Key Messages
• GIS is a tool for map-making which is vital in CLUP preparation.
• Map appreciation is an important skill needed when using GIS.
• GIS entails the use of vector (e.g. shapefiles) and raster (e.g. TIFF, DEM) files.
• By the end of the training, the participants will be able to create their own base maps.