Embed Size (px)
Citation preview
Improving
Food Security & Nutrition
(IFSN)
Overview of Project & Research
Stacia Nordin, RD
FAO Nutrition Officer (Food Security & Policy)
28 April 2015 Mapping the Linkages Between Agriculture, Food Security & Nutrition Slide 1
Project reports, materials & Research Dissemination
http://www.fao.org/food/en/
https://www.dropbox.com/sh/cy7vj1ym9xwvhsz/AAApGITXU36k1w7NPcGfVEXta?dl=0
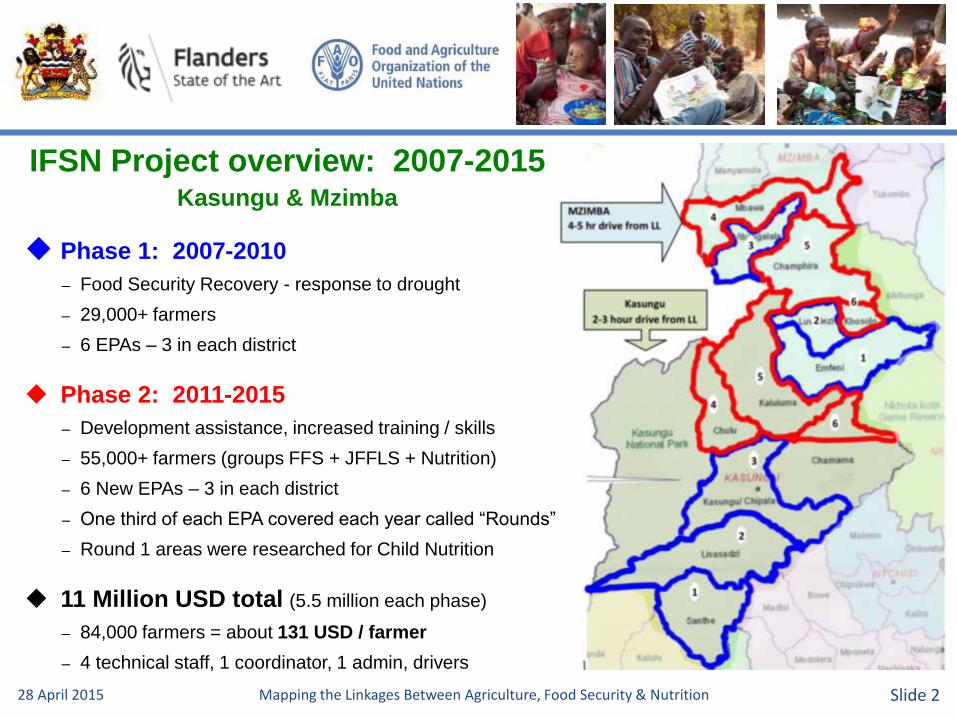
IFSN Project overview: 2007-2015Kasungu & Mzimba
Phase 1: 2007-2010
– Food Security Recovery - response to drought
– 29,000+ farmers
– 6 EPAs – 3 in each district
Phase 2: 2011-2015
– Development assistance, increased training / skills
– 55,000+ farmers (groups FFS + JFFLS + Nutrition)
– 6 New EPAs – 3 in each district
– One third of each EPA covered each year called “Rounds”
– Round 1 areas were researched for Child Nutrition
11 Million USD total (5.5 million each phase)
– 84,000 farmers = about 131 USD / farmer
– 4 technical staff, 1 coordinator, 1 admin, drivers
28 April 2015 Mapping the Linkages Between Agriculture, Food Security & Nutrition Slide 2
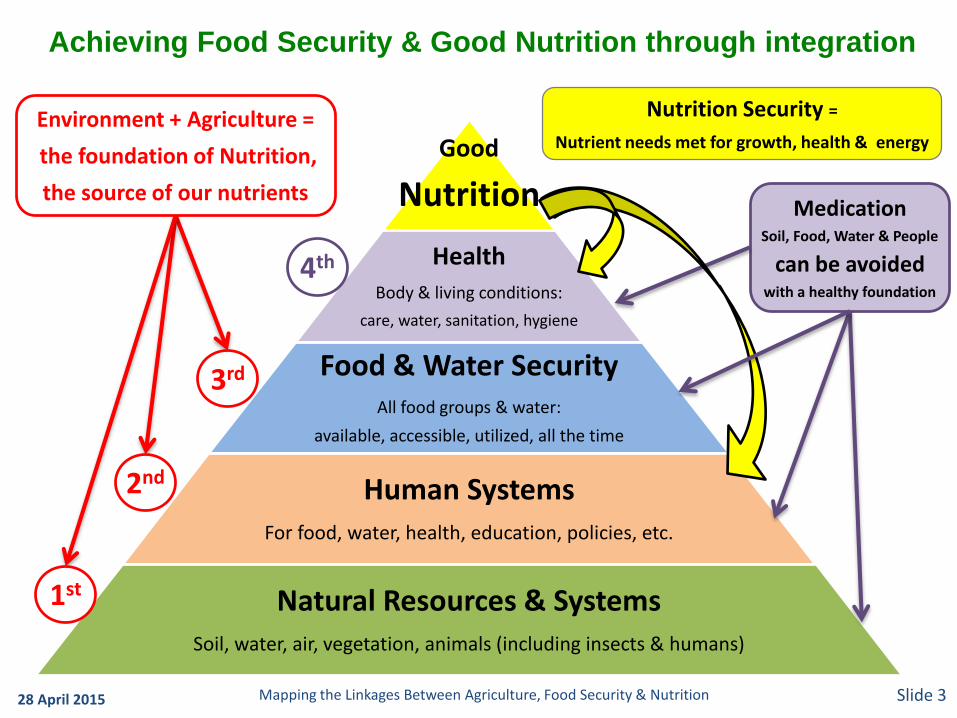
Good
Nutrition
Health
Body & living conditions:
care, water, sanitation, hygiene
Food & Water SecurityAll food groups & water:
available, accessible, utilized, all the time
Human SystemsFor food, water, health, education, policies, etc.
Natural Resources & SystemsSoil, water, air, vegetation, animals (including insects & humans)
1st
4th
3rd
2nd
Environment + Agriculture =
the foundation of Nutrition,
the source of our nutrients
Nutrition Security =
Nutrient needs met for growth, health & energy
MedicationSoil, Food, Water & People
can be avoidedwith a healthy foundation
Achieving Food Security & Good Nutrition through integration
28 April 2015 Mapping the Linkages Between Agriculture, Food Security & Nutrition Slide 3
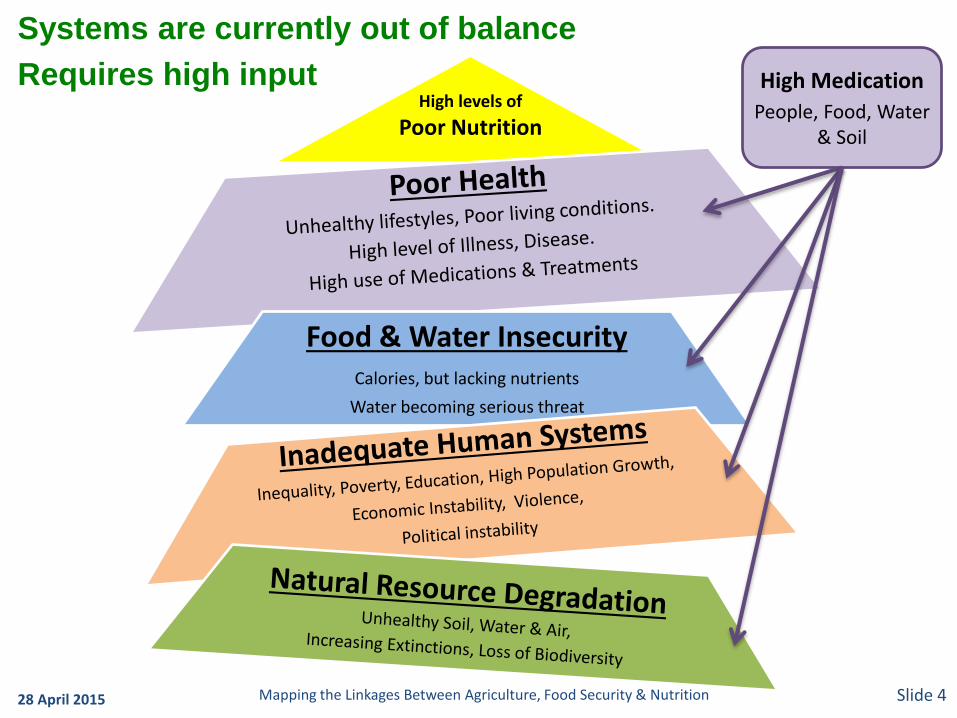
High levels of
Poor Nutrition
Food & Water InsecurityCalories, but lacking nutrients
Water becoming serious threat
Systems are currently out of balance
Requires high input High Medication
People, Food, Water & Soil
28 April 2015 Mapping the Linkages Between Agriculture, Food Security & Nutrition Slide 4
Good
Nutrition
Healthy Living
& Health Care
Food & Water
Security
Human
Systems
Natural Resources
& Systems
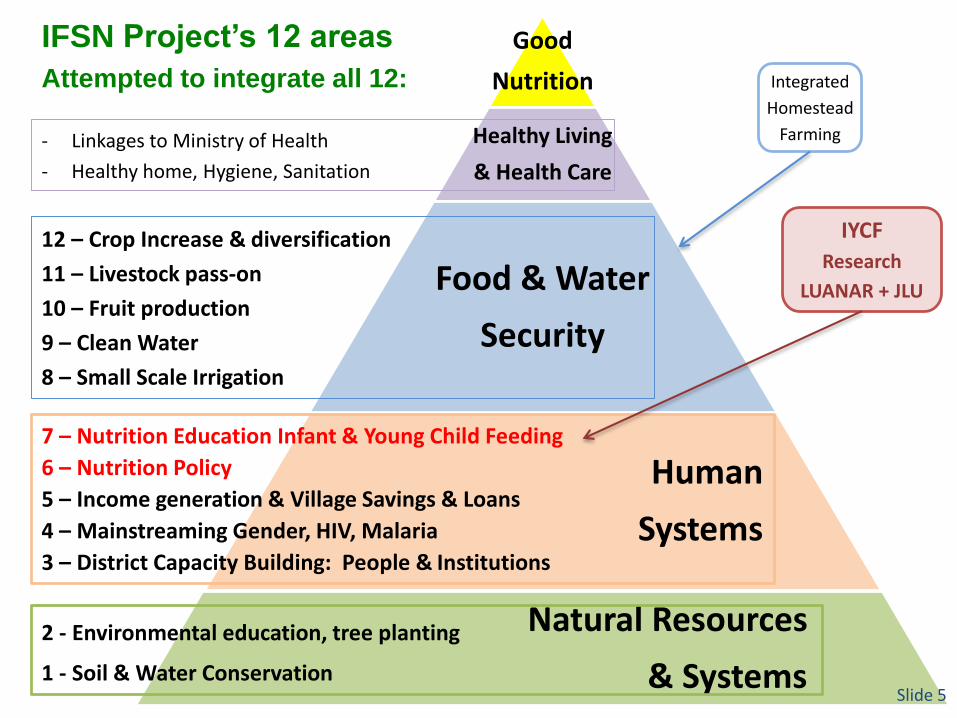
IFSN Project’s 12 areas
Attempted to integrate all 12:
12 – Crop Increase & diversification
11 – Livestock pass-on
10 – Fruit production
9 – Clean Water
8 – Small Scale Irrigation
- Linkages to Ministry of Health
- Healthy home, Hygiene, Sanitation
7 – Nutrition Education Infant & Young Child Feeding
6 – Nutrition Policy
5 – Income generation & Village Savings & Loans
4 – Mainstreaming Gender, HIV, Malaria
3 – District Capacity Building: People & Institutions
2 - Environmental education, tree planting
1 - Soil & Water Conservation
IYCF
Research
LUANAR + JLU
Integrated
Homestead
Farming
Slide 5
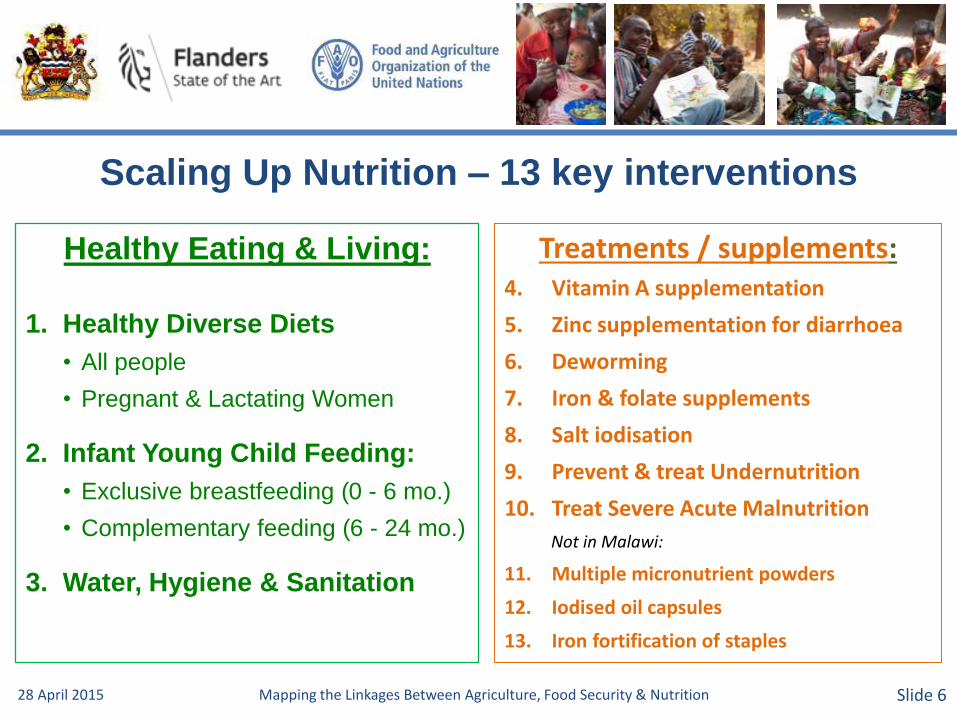
Scaling Up Nutrition – 13 key interventions
Healthy Eating & Living:
1. Healthy Diverse Diets
• All people
• Pregnant & Lactating Women
2. Infant Young Child Feeding:
• Exclusive breastfeeding (0 - 6 mo.)
• Complementary feeding (6 - 24 mo.)
3. Water, Hygiene & Sanitation
Treatments / supplements:4. Vitamin A supplementation
5. Zinc supplementation for diarrhoea
6. Deworming
7. Iron & folate supplements
8. Salt iodisation
9. Prevent & treat Undernutrition
10. Treat Severe Acute Malnutrition
Not in Malawi:
11. Multiple micronutrient powders
12. Iodised oil capsules
13. Iron fortification of staples
28 April 2015 Mapping the Linkages Between Agriculture, Food Security & Nutrition Slide 6
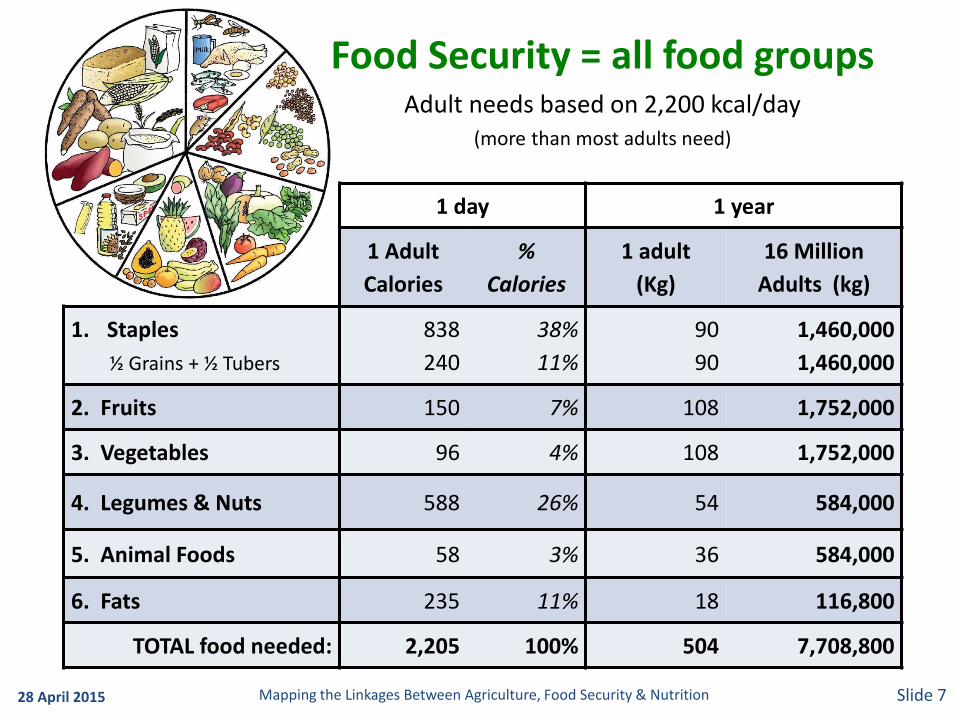
Food Security = all food groups Adult needs based on 2,200 kcal/day
(more than most adults need)
1 day 1 year
1 Adult
Calories
%
Calories
1 adult
(Kg)
16 Million
Adults (kg)
1. Staples
½ Grains + ½ Tubers
838
240
38%
11%
90
90
1,460,000
1,460,000
2. Fruits 150 7% 108 1,752,000
3. Vegetables 96 4% 108 1,752,000
4. Legumes & Nuts 588 26% 54 584,000
5. Animal Foods 58 3% 36 584,000
6. Fats 235 11% 18 116,800
TOTAL food needed: 2,205 100% 504 7,708,800
28 April 2015 Mapping the Linkages Between Agriculture, Food Security & Nutrition Slide 7
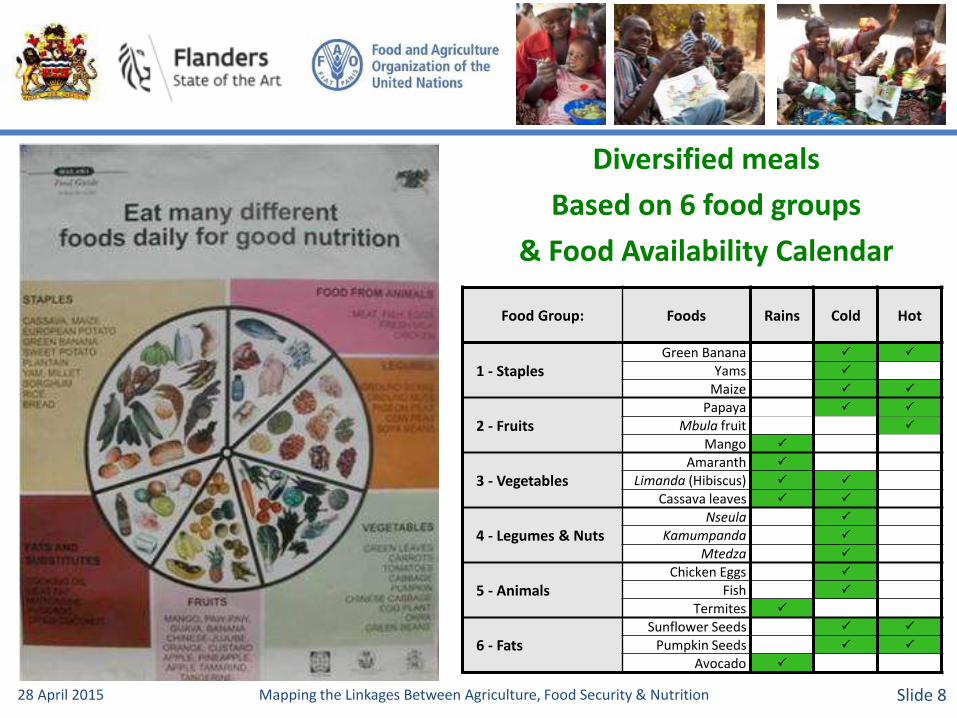
Diversified meals
Based on 6 food groups
& Food Availability Calendar
Food Group: Foods Rains Cold Hot
1 - StaplesGreen Banana
Yams
Maize
2 - FruitsPapaya
Mbula fruit
Mango
3 - VegetablesAmaranth
Limanda (Hibiscus)
Cassava leaves
4 - Legumes & NutsNseula
Kamumpanda
Mtedza
5 - AnimalsChicken Eggs
Fish
Termites
6 - FatsSunflower Seeds
Pumpkin Seeds
Avocado
28 April 2015 Mapping the Linkages Between Agriculture, Food Security & Nutrition Slide 8
28 April 2015 Mapping the Linkages Between Agriculture, Food Security & Nutrition Slide 9
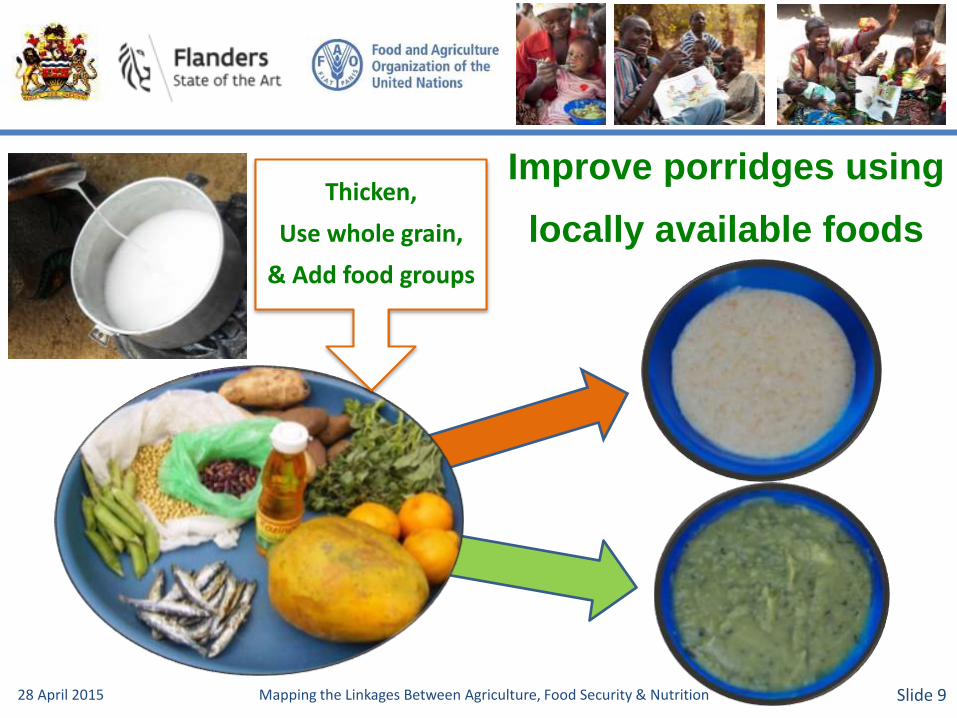
Improve porridges using
locally available foodsThicken,
Use whole grain,
& Add food groups
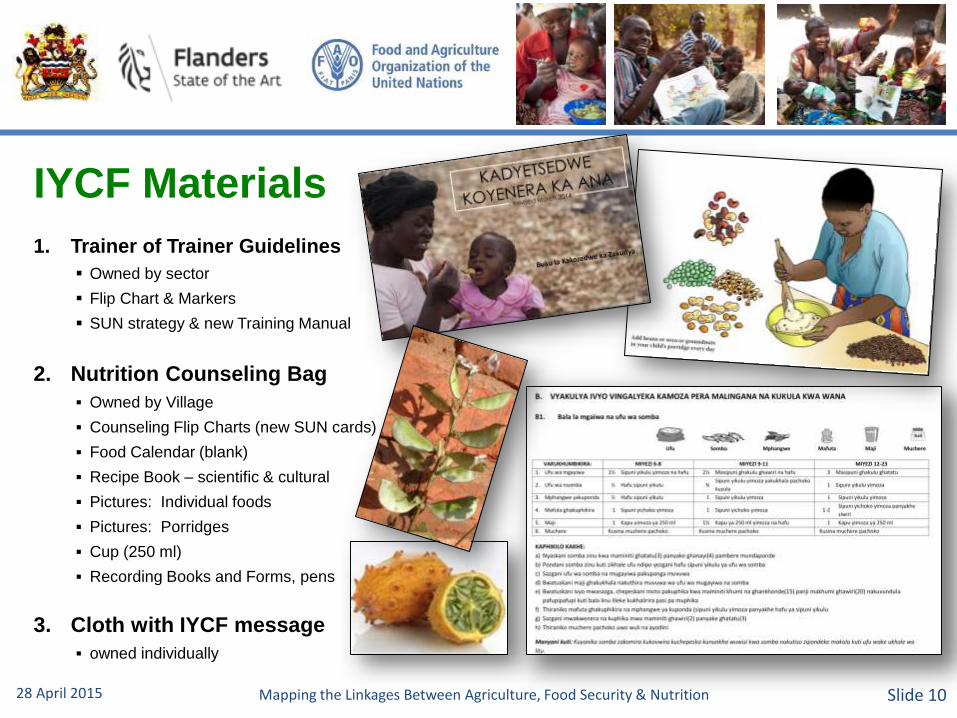
1. Trainer of Trainer Guidelines
Owned by sector
Flip Chart & Markers
SUN strategy & new Training Manual
2. Nutrition Counseling Bag
Owned by Village
Counseling Flip Charts (new SUN cards)
Food Calendar (blank)
Recipe Book – scientific & cultural
Pictures: Individual foods
Pictures: Porridges
Cup (250 ml)
Recording Books and Forms, pens
3. Cloth with IYCF message
owned individually
28 April 2015 Mapping the Linkages Between Agriculture, Food Security & Nutrition Slide 10
IYCF Materials
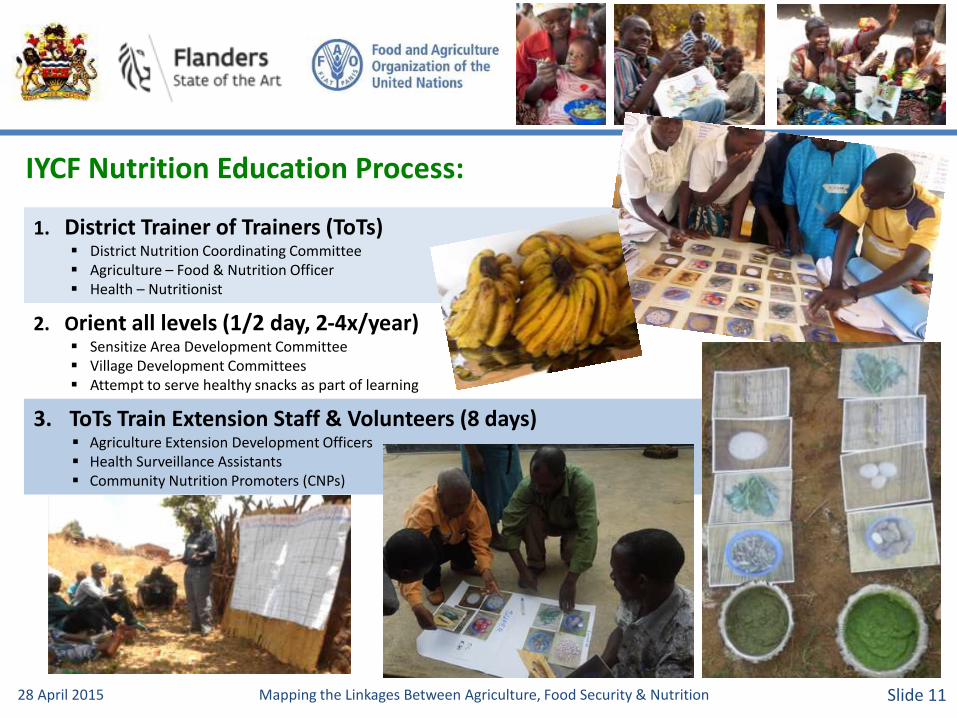
1. District Trainer of Trainers (ToTs) District Nutrition Coordinating Committee Agriculture – Food & Nutrition Officer Health – Nutritionist
2. Orient all levels (1/2 day, 2-4x/year) Sensitize Area Development Committee Village Development Committees Attempt to serve healthy snacks as part of learning
3. ToTs Train Extension Staff & Volunteers (8 days) Agriculture Extension Development Officers Health Surveillance Assistants Community Nutrition Promoters (CNPs)
28 April 2015 Mapping the Linkages Between Agriculture, Food Security & Nutrition Slide 11
IYCF Nutrition Education Process:
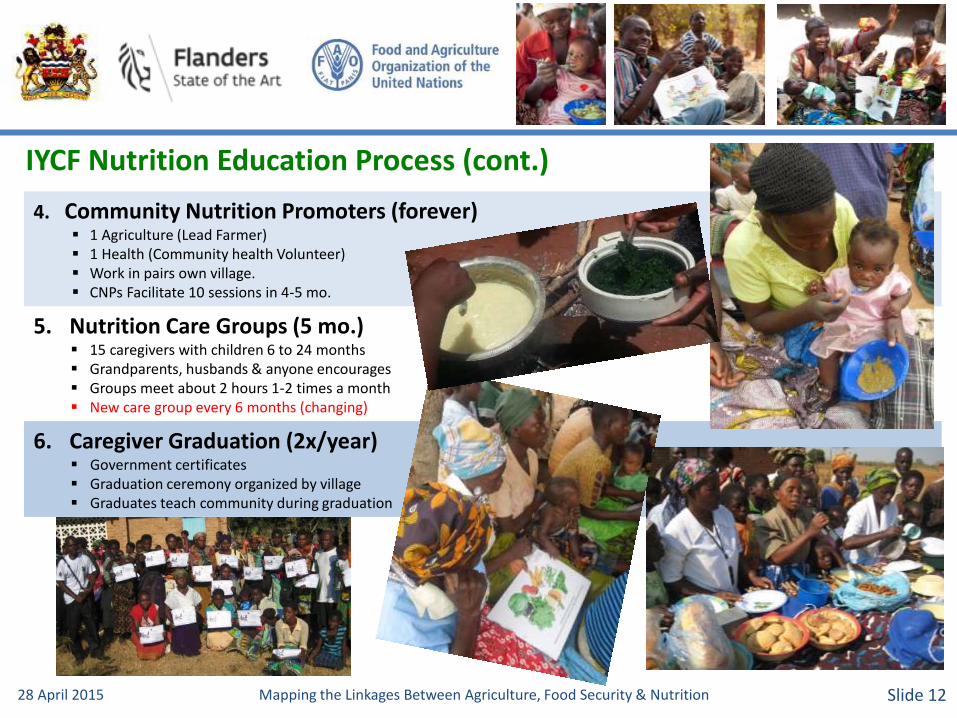
4. Community Nutrition Promoters (forever) 1 Agriculture (Lead Farmer) 1 Health (Community health Volunteer) Work in pairs own village. CNPs Facilitate 10 sessions in 4-5 mo.
5. Nutrition Care Groups (5 mo.) 15 caregivers with children 6 to 24 months Grandparents, husbands & anyone encourages Groups meet about 2 hours 1-2 times a month New care group every 6 months (changing)
6. Caregiver Graduation (2x/year) Government certificates Graduation ceremony organized by village Graduates teach community during graduation
IYCF Nutrition Education Process (cont.)
28 April 2015 Mapping the Linkages Between Agriculture, Food Security & Nutrition Slide 12
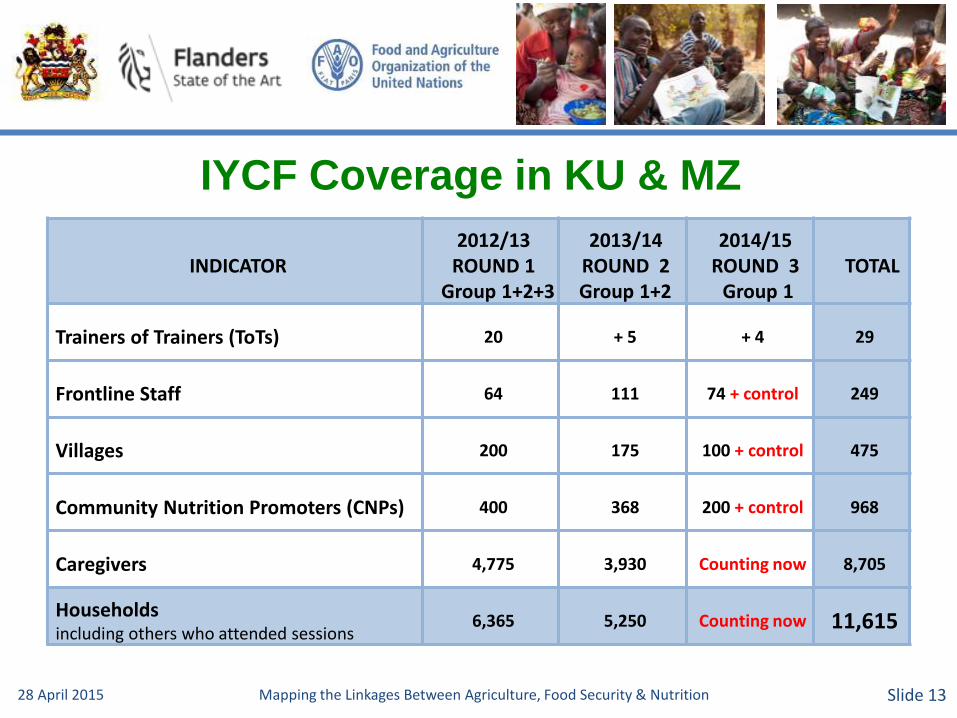
IYCF Coverage in KU & MZ
INDICATOR 2012/13
ROUND 1 Group 1+2+3
2013/14ROUND 2 Group 1+2
2014/15ROUND 3
Group 1 TOTAL
Trainers of Trainers (ToTs) 20 + 5 + 4 29
Frontline Staff 64 111 74 + control 249
Villages 200 175 100 + control 475
Community Nutrition Promoters (CNPs) 400 368 200 + control 968
Caregivers 4,775 3,930 Counting now 8,705
Householdsincluding others who attended sessions
6,365 5,250 Counting now 11,615
28 April 2015 Mapping the Linkages Between Agriculture, Food Security & Nutrition Slide 13
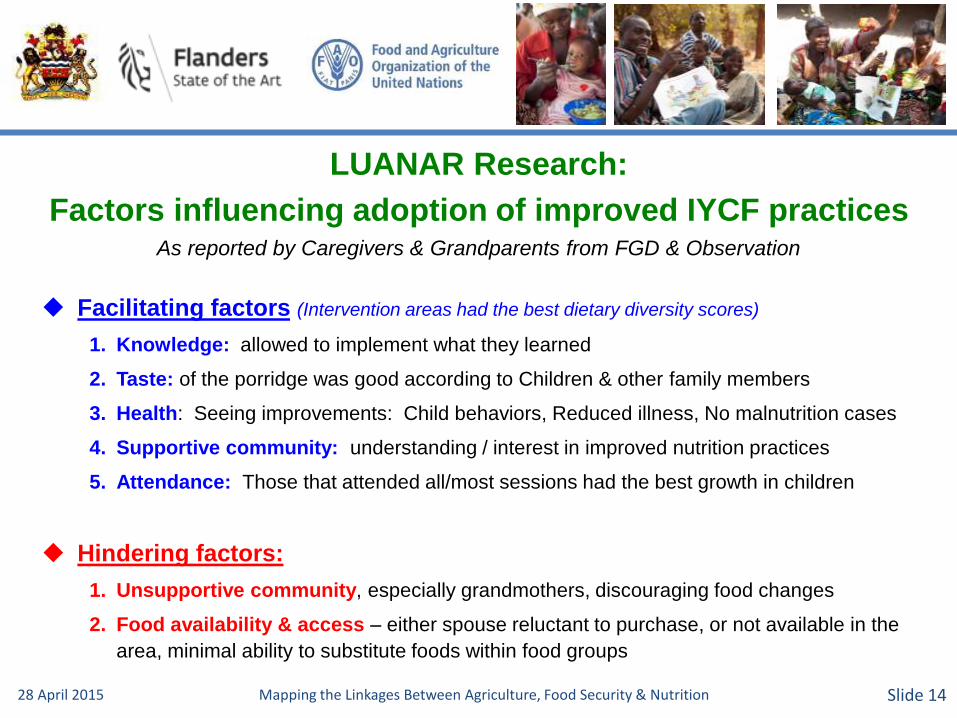
LUANAR Research:
Factors influencing adoption of improved IYCF practicesAs reported by Caregivers & Grandparents from FGD & Observation
28 April 2015 Mapping the Linkages Between Agriculture, Food Security & Nutrition Slide 14
Facilitating factors (Intervention areas had the best dietary diversity scores)
1. Knowledge: allowed to implement what they learned
2. Taste: of the porridge was good according to Children & other family members
3. Health: Seeing improvements: Child behaviors, Reduced illness, No malnutrition cases
4. Supportive community: understanding / interest in improved nutrition practices
5. Attendance: Those that attended all/most sessions had the best growth in children
Hindering factors:
1. Unsupportive community, especially grandmothers, discouraging food changes
2. Food availability & access – either spouse reluctant to purchase, or not available in the
area, minimal ability to substitute foods within food groups
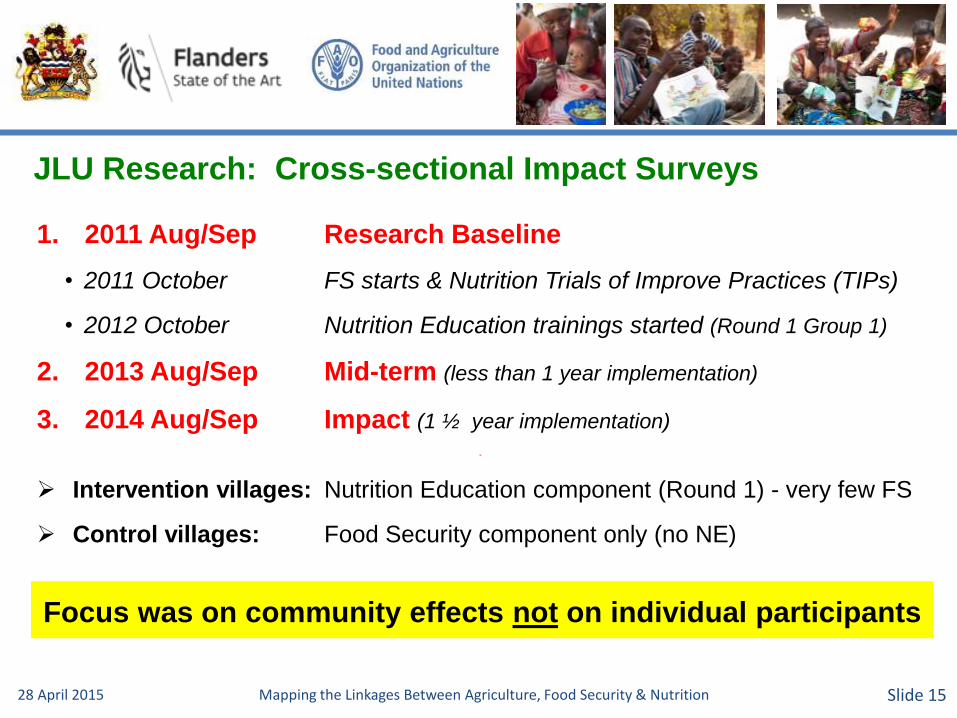
JLU Research: Cross-sectional Impact Surveys
1. 2011 Aug/Sep Research Baseline
• 2011 October FS starts & Nutrition Trials of Improve Practices (TIPs)
• 2012 October Nutrition Education trainings started (Round 1 Group 1)
2. 2013 Aug/Sep Mid-term (less than 1 year implementation)
3. 2014 Aug/Sep Impact (1 ½ year implementation)
-
Intervention villages: Nutrition Education component (Round 1) - very few FS
Control villages: Food Security component only (no NE)
Focus was on community effects not on individual participants
28 April 2015 Mapping the Linkages Between Agriculture, Food Security & Nutrition Slide 15
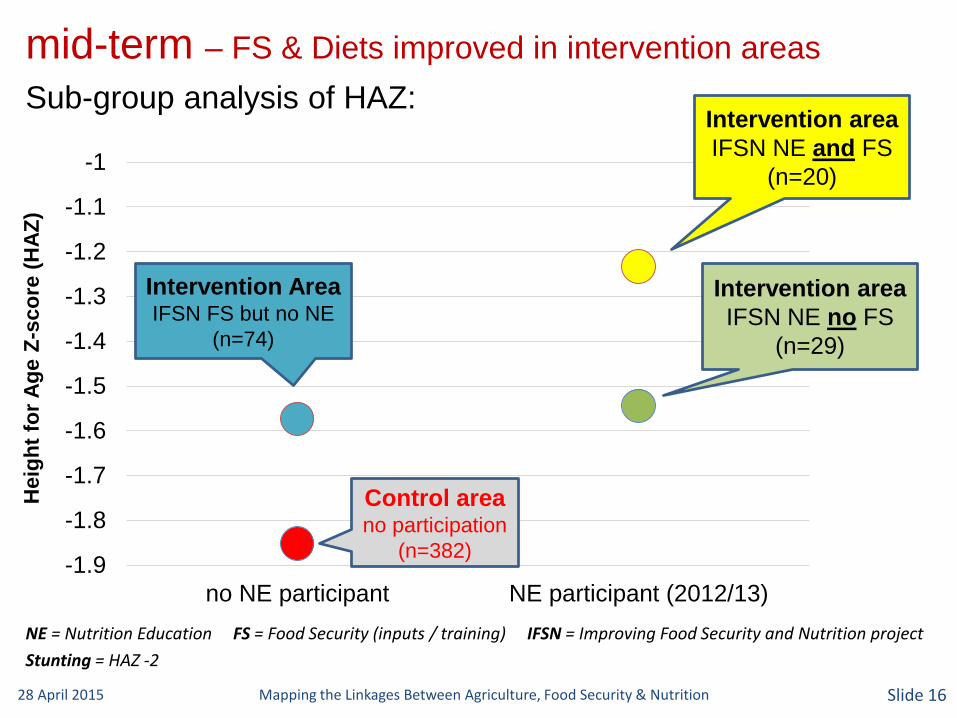
mid-term – FS & Diets improved in intervention areas
Sub-group analysis of HAZ:
-1.9
-1.8
-1.7
-1.6
-1.5
-1.4
-1.3
-1.2
-1.1
-1
no NE participant NE participant (2012/13)
Heig
ht
for
Ag
e Z
-sco
re (
HA
Z)
Control area no participation
(n=382)
Intervention area
IFSN NE no FS
(n=29)
Intervention AreaIFSN FS but no NE
(n=74)
Intervention area
IFSN NE and FS
(n=20)
NE = Nutrition Education FS = Food Security (inputs / training) IFSN = Improving Food Security and Nutrition project
Stunting = HAZ -2
28 April 2015 Mapping the Linkages Between Agriculture, Food Security & Nutrition Slide 16
28 April 2015 Mapping the Linkages Between Agriculture, Food Security & Nutrition Slide 17
Food-based approaches
focusing on the use of local foods
are feasible for improving child feeding.
---
Government & Community Ownership & Understanding
with Integrated Food Security & Nutrition Programming
is needed to achieve the best results.