Embed Size (px)
Citation preview

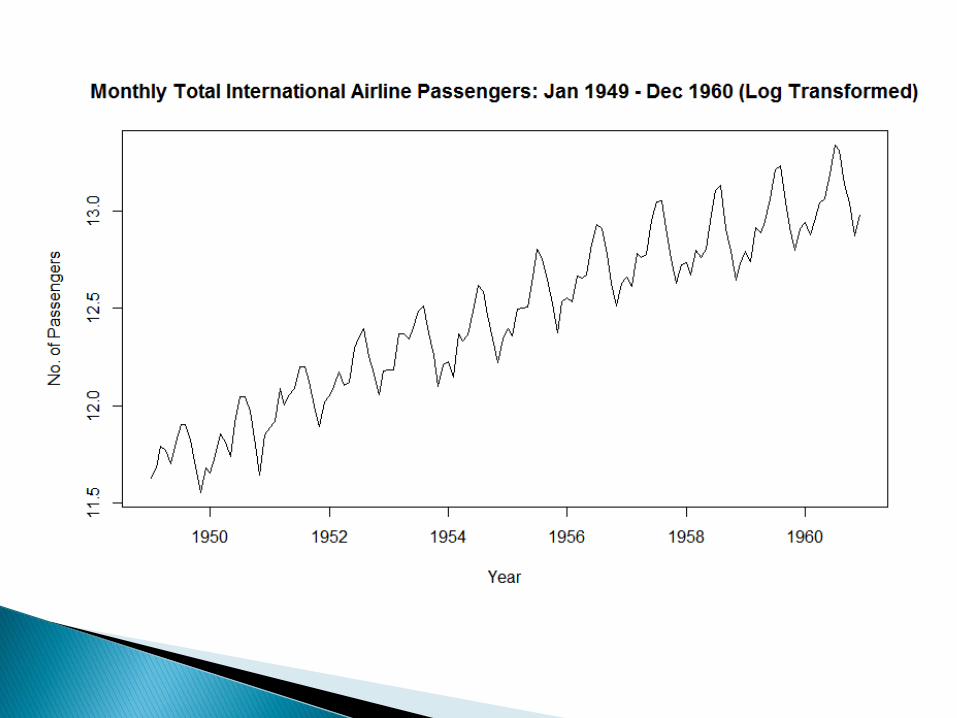
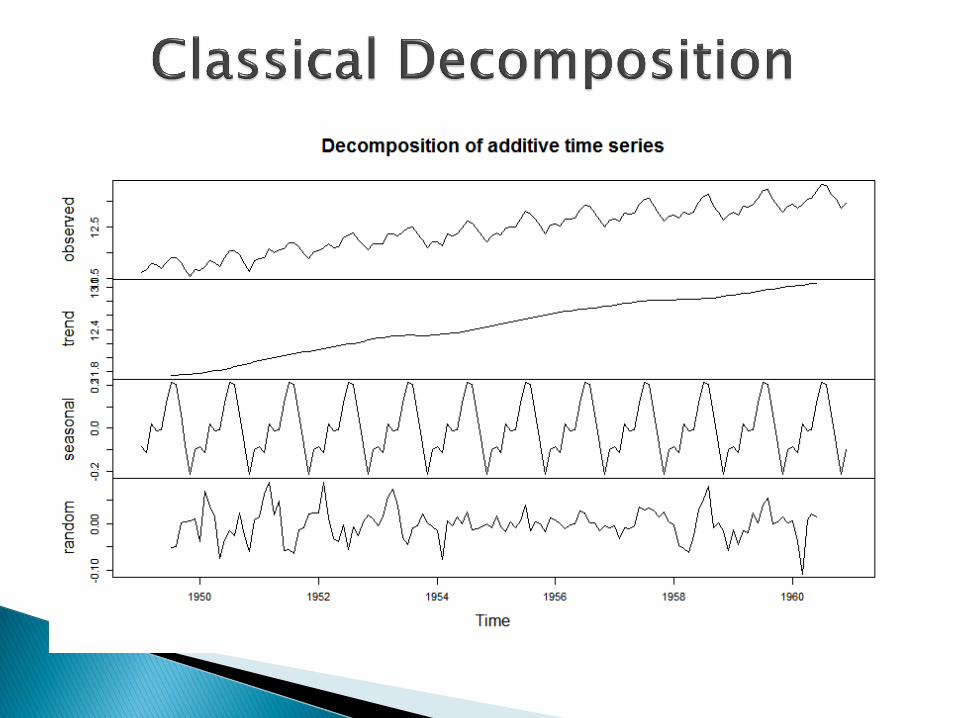
• Clearly, there is an exponentially increasing trend. • The graph also indicates the presence of seasonality.
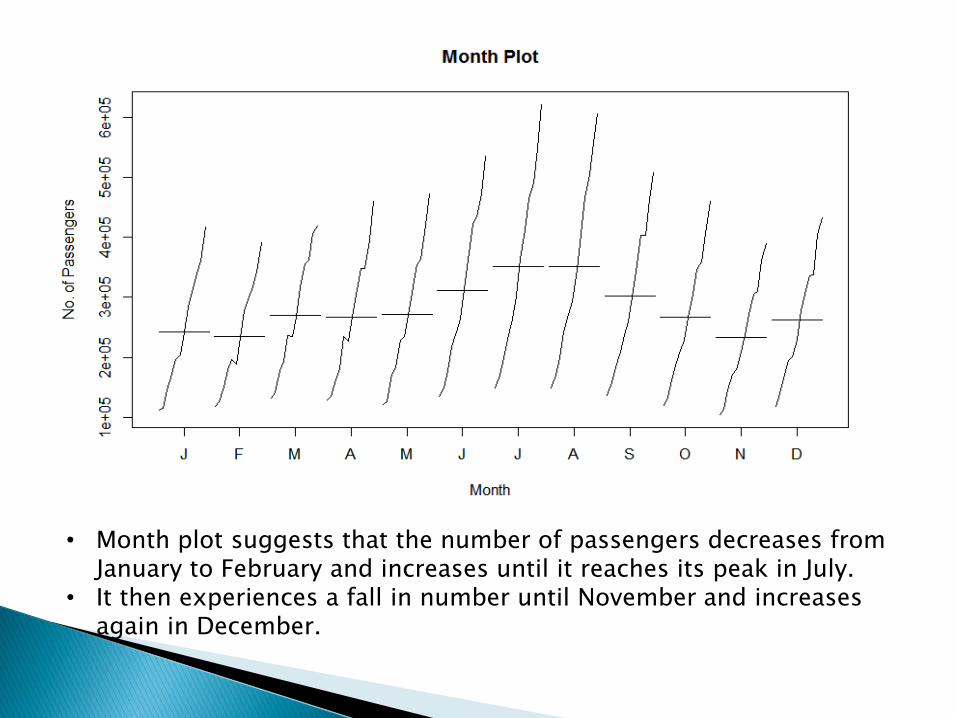
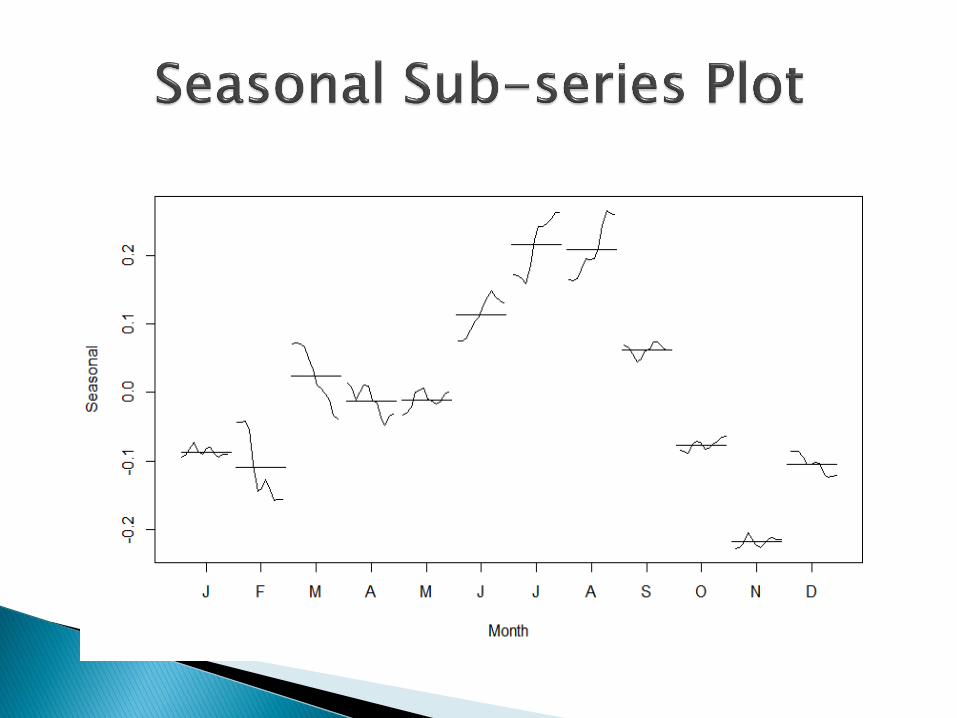
• Month plot suggests that the number of passengers decreases from January to February and increases until it reaches its peak in July.
• It then experiences a fall in number until November and increases again in December.
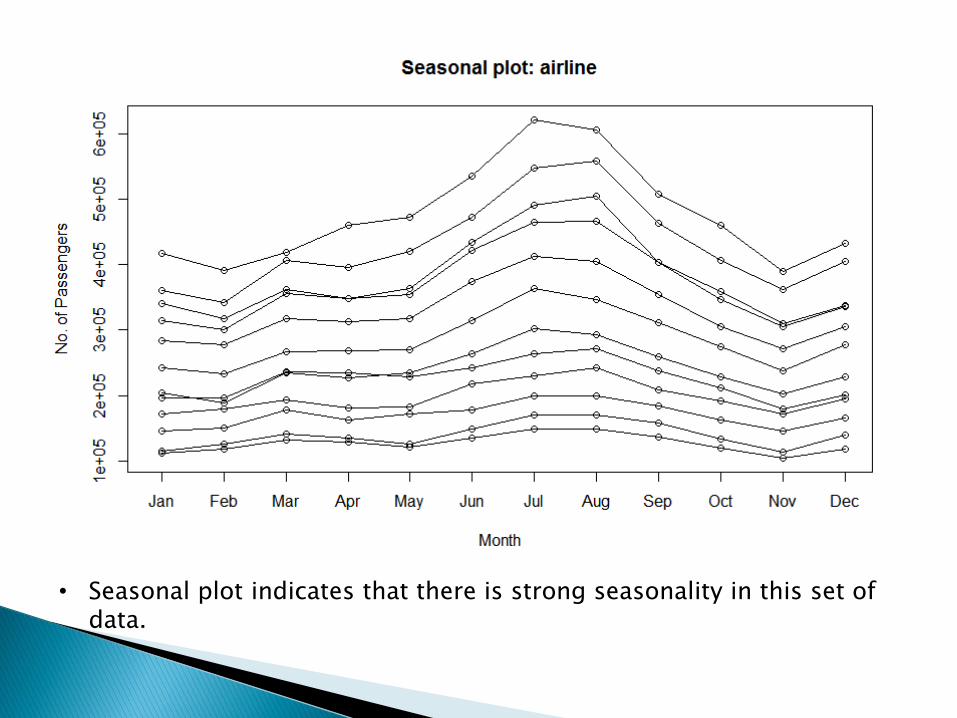
• Seasonal plot indicates that there is strong seasonality in this set of data.
The variation in the seasonal pattern appears to be proportional to the level of the time series.
Therefore, a multiplicative model is more appropriate.
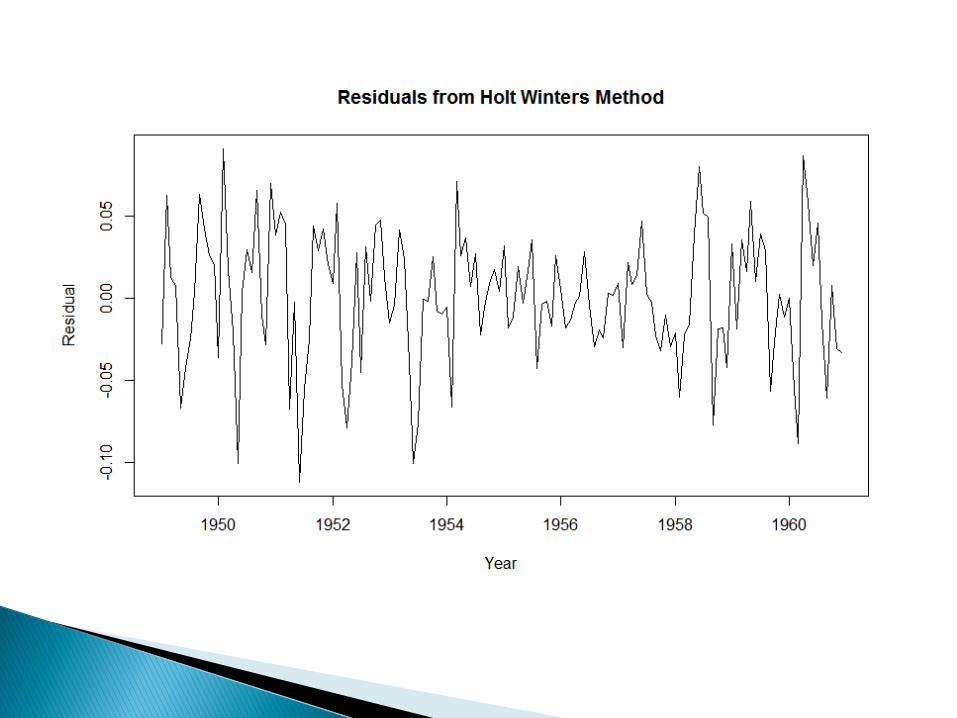
Box-Cox transformation is done to transform the data until the variation in the series becomes stable over time, so that Holt Winters Additive model can be applied.


![Chap3 Airline Economics[2] - George Mason University2].pdf · • Airline networks create complications for analysis of market demand and supply – Not all A‐B passengers will](https://img.pdfslide.net/doc/110x75/5e28d55e19622b7d056664c7/chap3-airline-economics2-george-mason-university-2pdf-a-airline-networks.jpg)