Embed Size (px)
Citation preview

International Trade and Income in Malawi: A Co-integration and Causality Approach
Greenwell Matchaya, Pius Chilonda, Sibusiso Nhelengethwa
ReSAKSS/IWMI

Outline
• Introduction• Objectives • Methodology• Results• Conclusions

Introduction
• Exports, Imports and incomes are related
• It is important to understand the nature of the relationship for purposes of policy
• Many factors affect each of these including fiscal programs, trade policy, exchange policy etc

Objectives • To investigate causal relationships between exports, imports,
and economic growth in Malawi over the period 1961-2010.
• Draw some recommendations for policy based on the findings

Methodology• These relationships are examined using the Johansen frameworks for co-
integration • The Vector Error Correction (VECM) framework is further used to provide
estimates for both short-run and long-run dynamics in the series under study.
• Impulse responses are generated to foresee the future dynamics
• Data:

Descriptives

Descriptives Single unit root (i.e. on levels) Second unit root (i.e. on
changes) Series DF ADF PP DFGLS DF ADF PP Y -1.42 -2.54 -1.61 -1.57 -8.28*** -5.71*** -50.53*** X -1.71 -1.94 -1.66 -1.28 -6.89*** -5.12*** -42.98*** M -1.03 -2.74 -1.27 -1.82 -6.27*** -4.82*** -41.82***

Results-residual based co-integration
Series DF PP
Residuals for logY -3.54*** -19.76***
Residuals for logX-2.90* -14.27***
Residuals for logM-3.84*** -24.39***

Results –Granger CausalityEquation Excluded Chi2 df prob >
chi2DlogY DlogX 6.2** 2 0.05DlogY DlogM 2.3 2 0.30DlogY ALL 11.4** 4 0.02DlogX DlogY 0.89 2 0.63DlogX DlogM 7.1** 2 0.03DlogX ALL 12.5*** 4 0.01DlogM DlogY 5.5* 2 0.06DlogM DlogX 1.5 2 0.46DlogM ALL 8.3* 4 0.08AutocorrelationTest
Lagrange Multiplier
Ch2=6.87Prob>chi2
=0.65 Residual normality test
Kurtosis Chi2=3.52Prob >Chi2
=0.32VAR-stability All Eigen-values
lie in unit circle

Co-integration –results
Beta Coef. Std. Err.
_ce1
logY 1 .
logM (omitted)
logX 0.55* 0.31
trend -0.03** .01
_cons -6.13
_cons 0.69
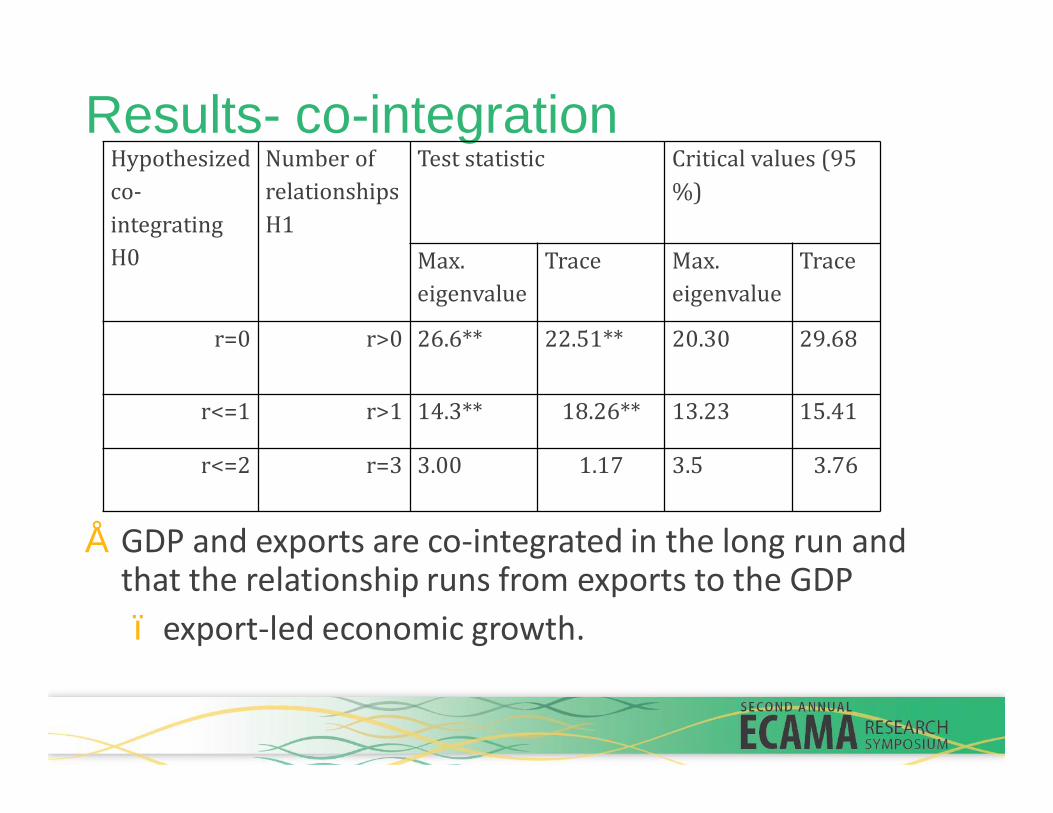
Results- co-integration
• GDP and exports are co-integrated in the long run and that the relationship runs from exports to the GDP – export-led economic growth.
Hypothesized co-integratingH0
Number of relationshipsH1
Test statistic Critical values (95 %)
Max. eigenvalue
Trace Max. eigenvalue
Trace
r=0 r>0 26.6** 22.51** 20.30 29.68
r<=1 r>1 14.3** 18.26** 13.23 15.41
r<=2 r=3 3.00 1.17 3.5 3.76

Causal directions
Imports
GDP
exports

Impulse responses •
-.1
0
.1
.2
0 2 4 6 8step
irf
irfstore: logEXPORTS -> logrealGDP
0
.05
.1
.15
.2
0 2 4 6 8step
irf
irfstore: logIMPORTS -> logrealGDP
0
.5
1
1.5
0 2 4 6 8step
irf
irfstore: logrealGDP -> logEXPORTS
0
.5
1
1.5
0 2 4 6 8step
irf
irfstore: logrealGDP -> logIMPORTS

Conclusions • The general qualitative story• Exports are good for economic growth• No evidence of import led growth• Policies that can encourage ag exports are desired
– These could include :– increase in agricultural productivity– Value addition – Diversification of production, – flexible but stable exchange rate – Reduction of Tariff and non Tariff trade barrier– Reduction of transaction costs etc