Embed Size (px)
Citation preview

28 November 2017
Ángel Gurría OECD Secretary-General
Catherine L. Mann OECD Chief Economist
OECD ECONOMIC OUTLOOK
The policy challenge:
Catalyse the private sector
for stronger and more inclusive growth
www.oecd.org/economy/economicoutlook.htm
ECOSCOPE blog: oecdecoscope.wordpress.com

Key messages
2
Global growth is strengthening but longer-term challenges remain
•Growth has picked up and is synchronised globally
•Policy stimulus is supporting the upturn, but the private investment recovery is modest
• Inflation and wage growth remain subdued
Financial vulnerabilities and high debt could undermine medium-term growth
•Low interest rates and low market volatility have encouraged risk-taking
•Corporate indebtedness is high and rising, creating vulnerabilities
•High debt makes households in many countries vulnerable to shocks
Policy action will be key to ensure robust, inclusive and resilient growth
•Focus structural and fiscal action on long-term potential as monetary policy support is reduced
• Implement reform packages to promote productivity, higher wages and inclusive growth
•Pursue an integrated approach to balance growth and risks in the financial sector

Global growth is picking up in 2017 and 2018
3
Global GDP growth Contributions by regions
Growth is synchronised globally
Note: The RHS shows 45 countries accounting for more than 80% of global GDP. Accelerating/slowing growth refers to a comparison with the
previous year.
Source: OECD Economic Outlook database; and OECD calculations.

Note. Data cover 24 OECD countries. The series shown are derived for each
cohort from a specification controlling for country and age fixed effects.
Source: OECD calculations from the Luxembourg Income Study data.
4
More needs to be done
to meet the public’s expectations
Income gains across generations have slowed Real disposable income by age and birth decade, OECD
Evolution of GDP per capita OECD, volume
Note: Series calculated with GDP PPP weights. Horizontal lines show
average annual real GDP per capita growth for each period. The dotted line
indicates a linear projection based on the 1990-2007 period.
Source: OECD Economic Outlook database.

OECD Economic Outlook projections
5
Real GDP growth Year-on-year, %
Arrows indicate the change in growth rate from previous year
1. With growth in Ireland in 2015 computed using gross value added at constant prices excluding foreign-owned multinational enterprise
denominated sectors.
2. Fiscal years starting in April.

6
Monetary and fiscal stimulus
are underpinning the current momentum
Long-term yields remain low 10-year government bond yields
Source: Thomson Reuters.
Fiscal stance has eased in OECD countries Contributions to change in fiscal balances, % of GDP
Note: The fiscal stance is shown as the change in the underlying
primary balance.
Source: OECD Economic Outlook database; and OECD
calculations.

7
Despite a recovery in investment,
the capital stock is old
Note: The net investment ratio is defined as the gross investment ratio minus the depreciation rate in
% of the productive capital stock. It includes business plus government investment.
Source: OECD Economic Outlook database; and OECD calculations.
Dynamics of the net investment ratio
2007 2016
Gross investment rates have declined compared to pre-crisis
Faster depreciation has contributed to slow net capital stock growth
The investment recovery projected to 2019 remains partial

8
Productivity growth remains below past norms,
weighing on wage growth
Labour productivity growth
Note: Labour productivity growth is the average annual growth rate of output per person employed. Real wage growth is calculated from nominal
wage growth and the GDP deflator. 2017-2019 are projections.
Source: OECD Economic Outlook database.
Real wage growth

9
Inflationary pressures are subdued
despite tighter labour markets
United States Euro Area
Contributions to core inflation for major economies
Source: Bureau of Economic Analysis; Eurostat; and OECD calculations.

FINANCIAL VULNERABILITIES AND HIGH DEBT COULD UNDERMINE
MEDIUM-TERM GROWTH
10

11
Low volatility has encouraged risk-taking,
but risks of sudden corrections persist
Source: Thomson Reuters.
Note: 15-day moving average. The dashed line indicates the
long-term average (1990-2017) of the SKEW index.
Rising tail risk in equity markets SKEW index
Low volatility in equity prices
Source: Thomson Reuters and OECD calculations.
Note: 15-day moving average of normalised values, in standard deviations.
The equity market volatility indices measure an expected symmetric range
of movements in the main equity indices over next 30 days.

12
Corporate and household indebtedness
are rising in many countries
Corporate debt % of GDP
1 or latest available. 2 2008 for EMEs and China.
Note: EMEs exclude China.
Source: OECD National Accounts; BIS.
1 or latest available.
Source: OECD National Accounts.
Household debt % of disposable income

13
Risks from corporate borrowing have shifted
towards less regulated finance
Total social financing flows in China 4-quarter moving sum of flows
as share of 4-quarter moving sum of GDP
Corporate bond issuance
Source: OECD Economic Outlook database; Thomson Reuters;
and OECD calculations.
Note: Core debt comprises loans, debt securities and currency and deposits.
Source: OECD Business and Finance Scoreboard 2017; Bank of
International Settlements; OECD financial accounts; and OECD calculations.

14
Declining credit quality and rising
international exposures create vulnerabilities
Credit quality of new corporate bonds
International corporate bond issuance
Source: Bank for International Settlements; and OECD calculations. Note: Covers advanced and emerging economies.
Source: OECD Business and Finance Scoreboard.

15
High debt can increase risks
for medium-term real activity
House price booms precede recessions Global real house price index
Disconnect between debt
and productive capital
Note: Based on nominal series.
Source: OECD National Accounts; OECD Economic Outlook database;
and OECD calculations.
Note: Blue areas represent the number of countries in a severe
recession. The global real house price index is constructed as a
GDP-weighted average across OECD countries and is measured
as deviation from trend.
Source: Hermansen and Röhn (2017).

POLICY ACTION IS KEY TO ACHIEVE STRONGER, MORE INCLUSIVE AND
RESILIENT GROWTH
16

17
The policy mix is starting to rebalance away
from monetary policy support
Overnight interest rates Actual and market expectations
Note: Values in the shaded area are market expectations of overnight rates as of 15 November 2017.
Source: Thomson Reuters; and OECD calculations.

18 Source: Fournier and Johansson (2016), “The effect of the size and the mix of public spending on growth and inequality”,
OECD Economics Department Working Paper.
Fiscal stance has eased but the fiscal mix
should better support inclusive growth
Growth and equity effects of the public spending mix
Impact of spending reform Growth Equity Income of the poor
Improving education
Increasing public investment and R&D
Increasing government effectiveness
Increasing family benefits
Decreasing public subsidies
positive impact uncertain or no impact negative impact

19
Countries with scope to combine reforms for inclusive growth
Source: Going for Growth 2017.
Policy packages would catalyse investment
and productivity gains for inclusive growth
20
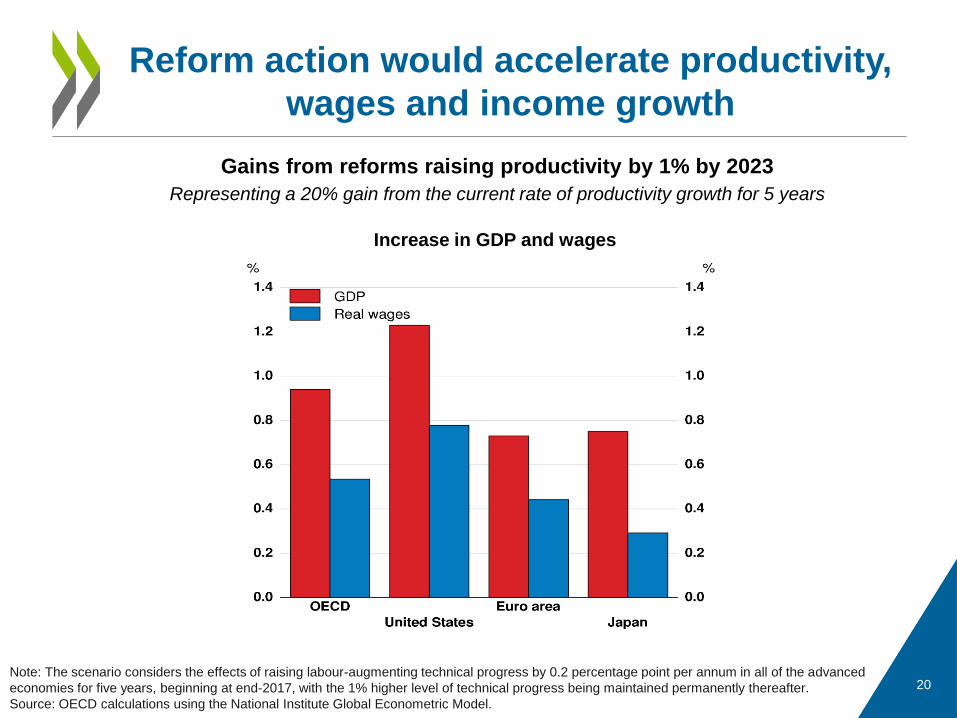
Gains from reforms raising productivity by 1% by 2023
Representing a 20% gain from the current rate of productivity growth for 5 years
Note: The scenario considers the effects of raising labour-augmenting technical progress by 0.2 percentage point per annum in all of the advanced
economies for five years, beginning at end-2017, with the 1% higher level of technical progress being maintained permanently thereafter.
Source: OECD calculations using the National Institute Global Econometric Model.
Reform action would accelerate productivity,
wages and income growth
Increase in GDP and wages

21
Reducing the tax bias towards debt
would mitigate risks and boost productivity
Debt-equity bias in corporate tax Effective average tax rates on new equity minus debt, 2016
Note: The debt-equity bias is defined as the percentage point difference
between the effective tax rates on equity finance and debt finance.
Source: Centre of European Economic Research (ZEW, 2016).
Note: Potential gains to within-firm total factor productivity
growth associated with removing the debt-equity bias.
Source: Adalet McGowan, Andrews and Millot (2017).
Productivity impact of reducing
the debt-equity bias
Higher values
indicate more
disadvantage
for equity

22
Recent OECD recommendations
Sources: OECD Economic Surveys and Going for Growth 2017. Sources: OECD Economic Surveys.
Recently adopted Loan-to-Value caps
Policy area Countries
Macro- and micro-
prudential measures
AUS, CAN, CHE, DNK, GBR,
ISR, KOR, LUX, NZL, NOR,
SVK, SWE, CHN, RUS, USA.
Housing policies
AUS, FIN, DNK, GBR, IRL,
LUX, NLD, NZL, POL, SVK,
SWE.
Tax policies CHE, DNK, LUX, NZL, SWE.
Addressing vulnerabilities arising
from household debt

23
An integrated approach is needed to enhance
resilience and achieve inclusive growth
Use prudential tools to prevent excessive credit
growth
Step up supervision of
non-bank activities
Expand housing supply & reduce home ownership
subsidies
Strengthen incentives to raise equity
finance
Improve insolvency regimes
Foster financial literacy

Other information
Disclaimers:
The statistical data for Israel are supplied by and under the responsibility of the relevant Israeli authorities. The use of such data by the OECD is without prejudice to the status of
the Golan Heights, East Jerusalem and Israeli settlements in the West Bank under the terms of international law.
This document and any map included herein are without prejudice to the status of or sovereignty over any territory, to the delimitation of international frontiers and boundaries
and to the name of any territory, city or area.
24
@OECDeconomy
@OECD
www.oecd.org/economy/economicoutlook.htm
ECOSCOPE blog: oecdecoscope.wordpress.com
Resilience in a time of high debt: http://www.oecd.org/eco/outlook/Resilience-in-a-time-
of-high-debt-november-2017-OECD-economic-outlook-presentation.pdf