Embed Size (px)
Citation preview
Consequences of demographic change on rehabilitation in German Pension Insurance
Uwe Egner, Stephan Mäder, Nadine VorsatzGerman Federal Pension Insurance (Deutsche Rentenversicherung Bund)
23rd Rehabilitation International World Congress
25th of October – 27nd of October 2016, Edinburgh, Scotland
1
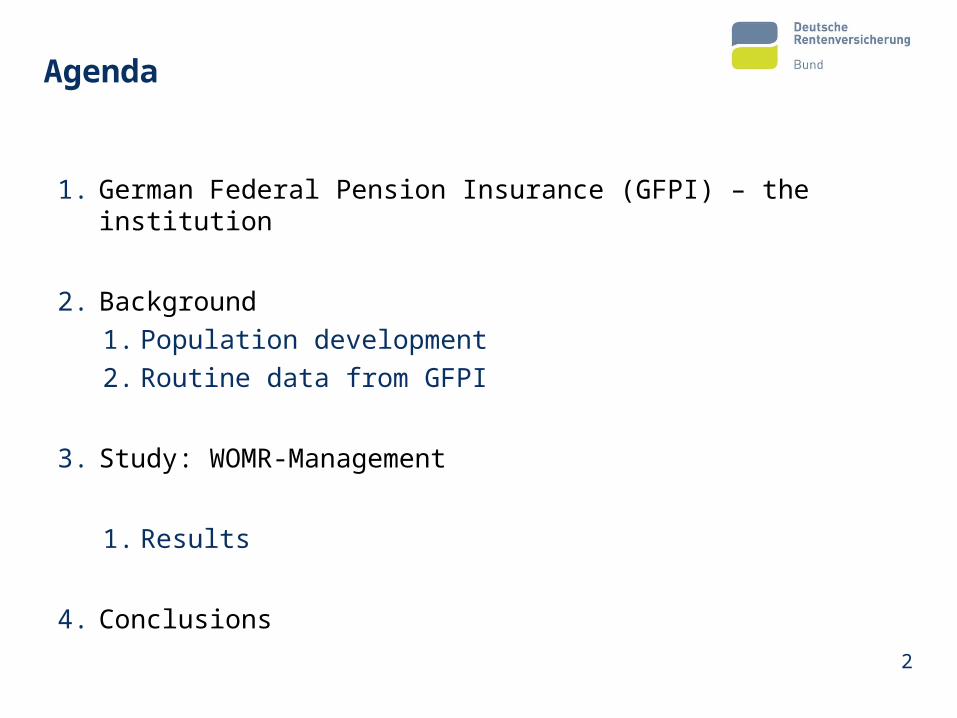
Agenda
1. German Federal Pension Insurance (GFPI) – the institution
2. Background1. Population development2. Routine data from GFPI
3. Study: WOMR-Management
1. Results
4. Conclusions
2
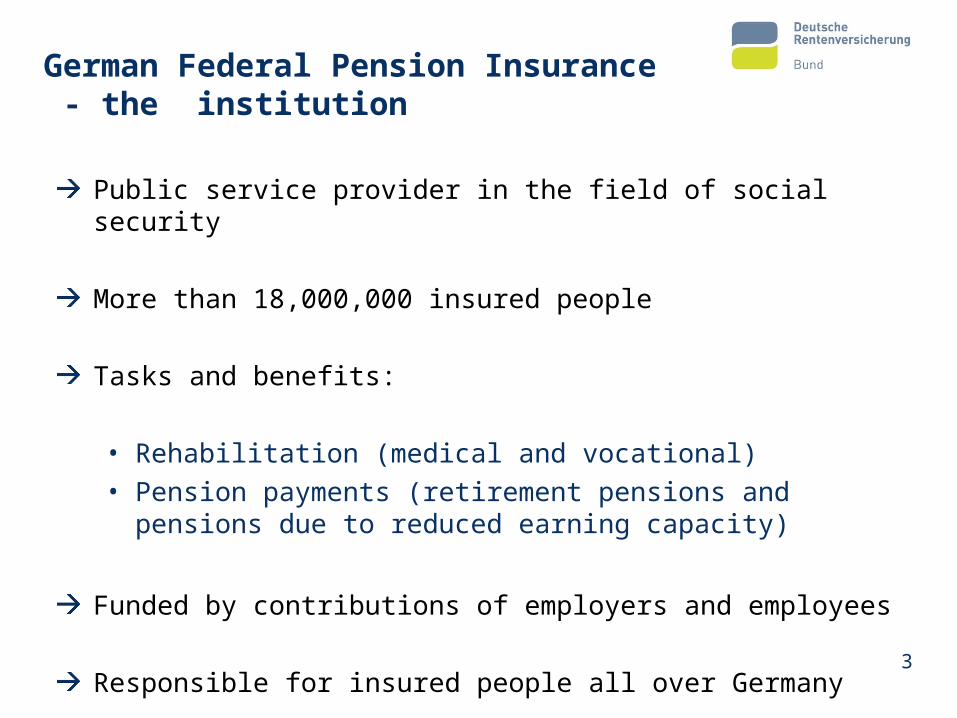
German Federal Pension Insurance - the institution
Public service provider in the field of social security
More than 18,000,000 insured people
Tasks and benefits:
• Rehabilitation (medical and vocational)• Pension payments (retirement pensions and pensions due to
reduced earning capacity)
Funded by contributions of employers and employees
Responsible for insured people all over Germany3
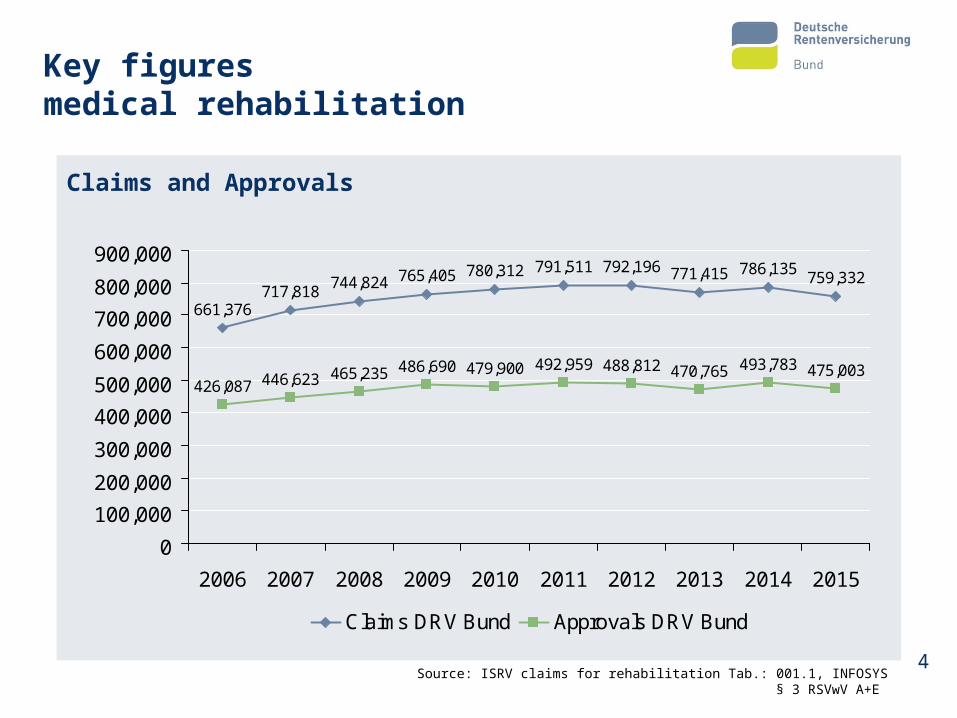
Key figures medical rehabilitation
Source: ISRV claims for rehabilitation Tab.: 001.1, INFOSYS § 3 RSVwV A+E
Claims and Approvals
661,376717,818 744,824 765,405 780,312 791,511 792,196 771,415 786,135 759,332
426,087 446,623 465,235 486,690 479,900 492,959 488,812 470,765 493,783 475,003
0100,000200,000300,000400,000500,000600,000700,000800,000900,000
2006 2007 2008 2009 2010 2011 2012 2013 2014 2015
Claims DRV Bund Approvals DRV Bund
4
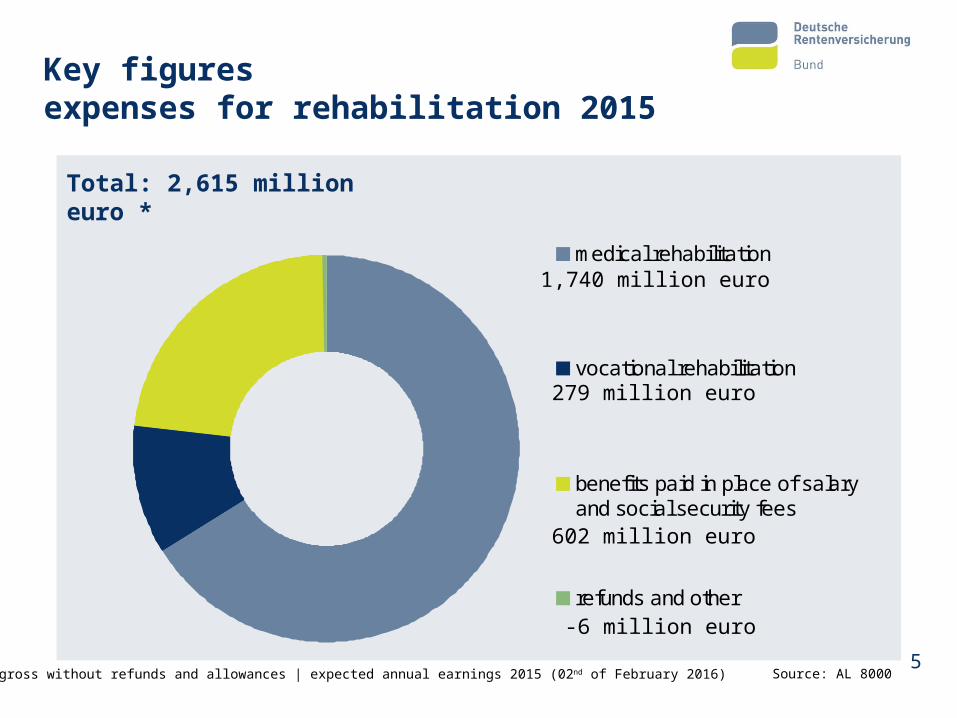
Key figures expenses for rehabilitation 2015
medical rehabilitation
vocational rehabilitation
benefits paid in place of salaryand social security fees
refunds and other
Total: 2,615 million euro *
1,740 million euro
279 million euro
602 million euro
Source: AL 8000* gross without refunds and allowances | expected annual earnings 2015 (02nd of February 2016)
-6 million euro
5
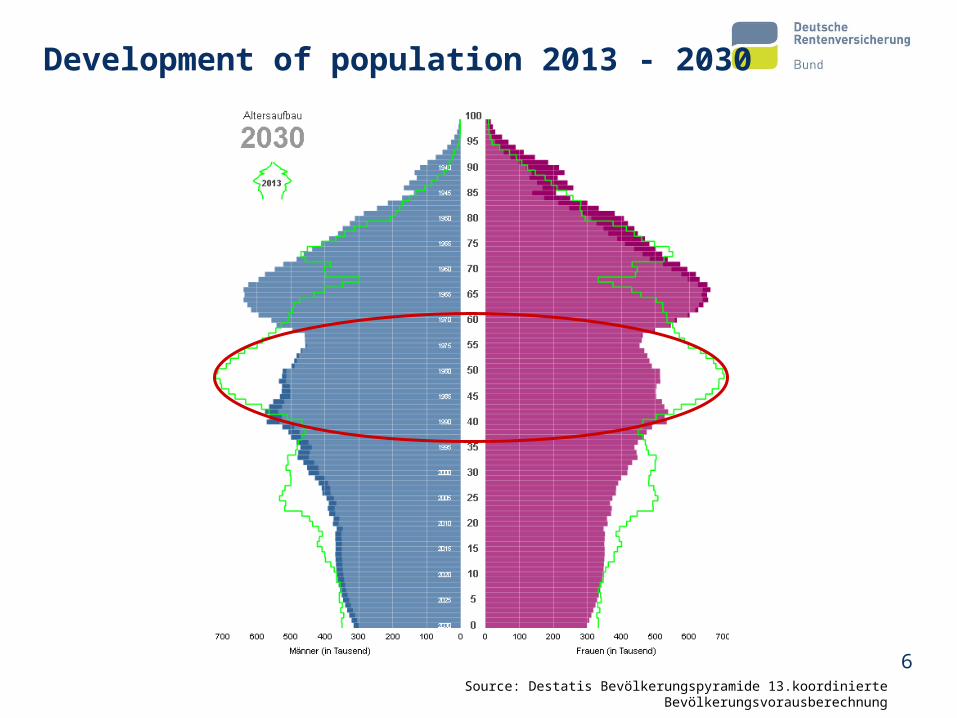
Development of population 2013 - 2030
Source: Destatis Bevölkerungspyramide 13.koordinierte Bevölkerungsvorausberechnung6
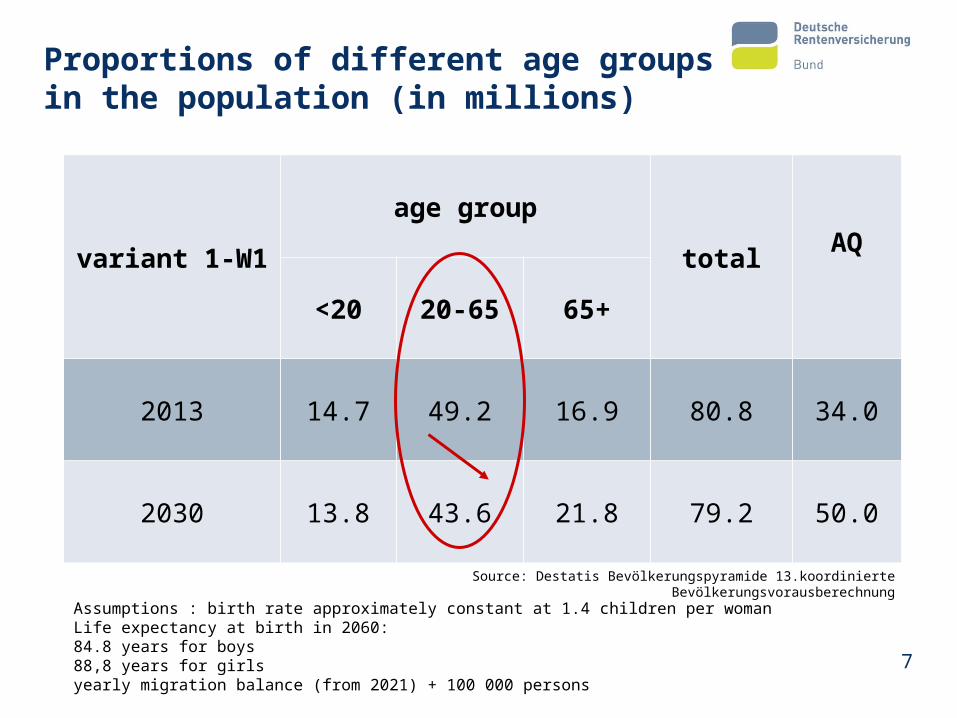
Proportions of different age groups in the population (in millions)
variant 1-W1
age group
total AQ
<20 20-65 65+
2013 14.7 49.2 16.9 80.8 34.0
2030 13.8 43.6 21.8 79.2 50.0
Assumptions : birth rate approximately constant at 1.4 children per womanLife expectancy at birth in 2060:84.8 years for boys88,8 years for girlsyearly migration balance (from 2021) + 100 000 persons
Source: Destatis Bevölkerungspyramide 13.koordinierte Bevölkerungsvorausberechnung
7
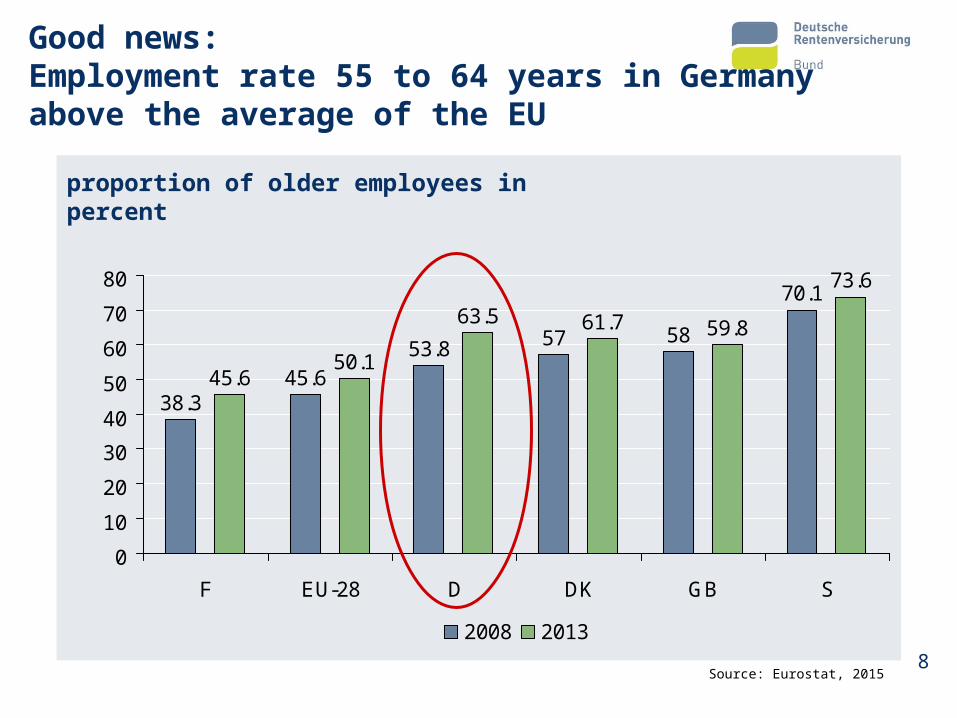
38.345.6
53.8 57 58
70.1
45.650.1
63.5 61.7 59.8
73.6
0
10
20
30
40
50
60
70
80
F EU-28 D DK GB S
2008 2013
Good news:Employment rate 55 to 64 years in Germany above the average of the EU
Source: Eurostat, 2015
proportion of older employees in percent
8
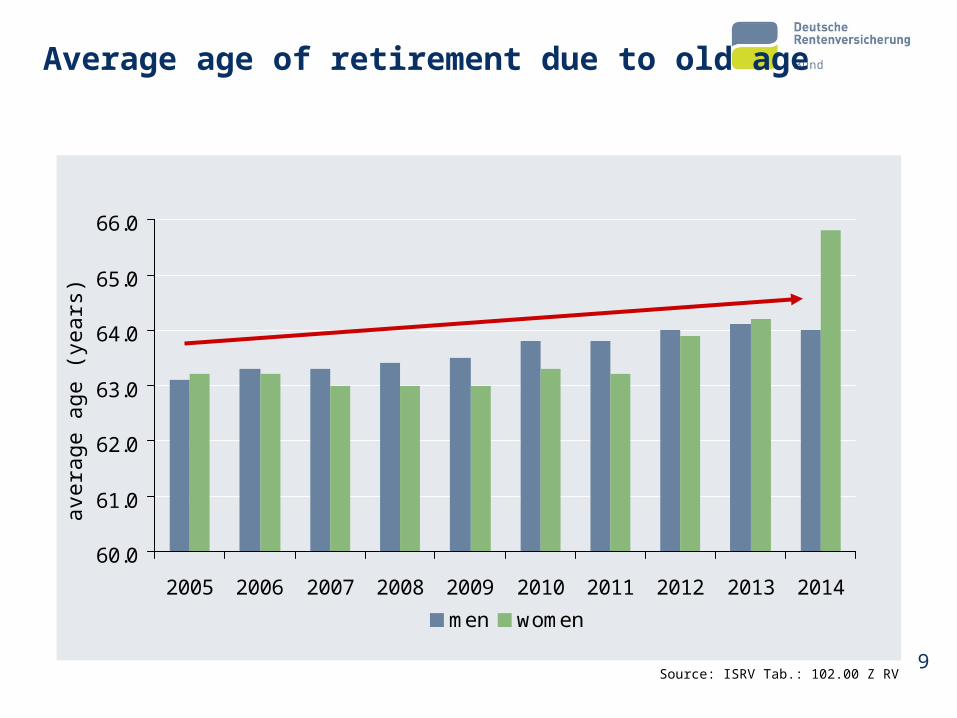
Average age of retirement due to old age
60.0
61.0
62.0
63.0
64.0
65.0
66.0
2005 2006 2007 2008 2009 2010 2011 2012 2013 2014
men women
aver
age
age
(yea
rs)
Source: ISRV Tab.: 102.00 Z RV 9
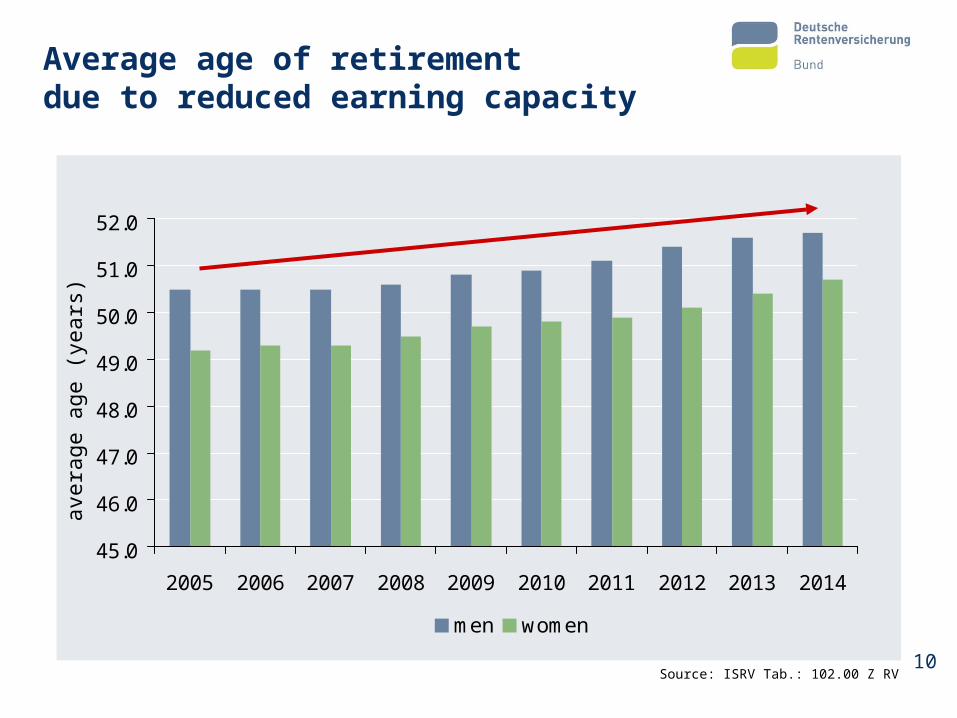
45.0
46.0
47.0
48.0
49.0
50.0
51.0
52.0
2005 2006 2007 2008 2009 2010 2011 2012 2013 2014
men women
Average age of retirement due to reduced earning capacity
Source: ISRV Tab.: 102.00 Z RV
aver
age
age
(yea
rs)
10
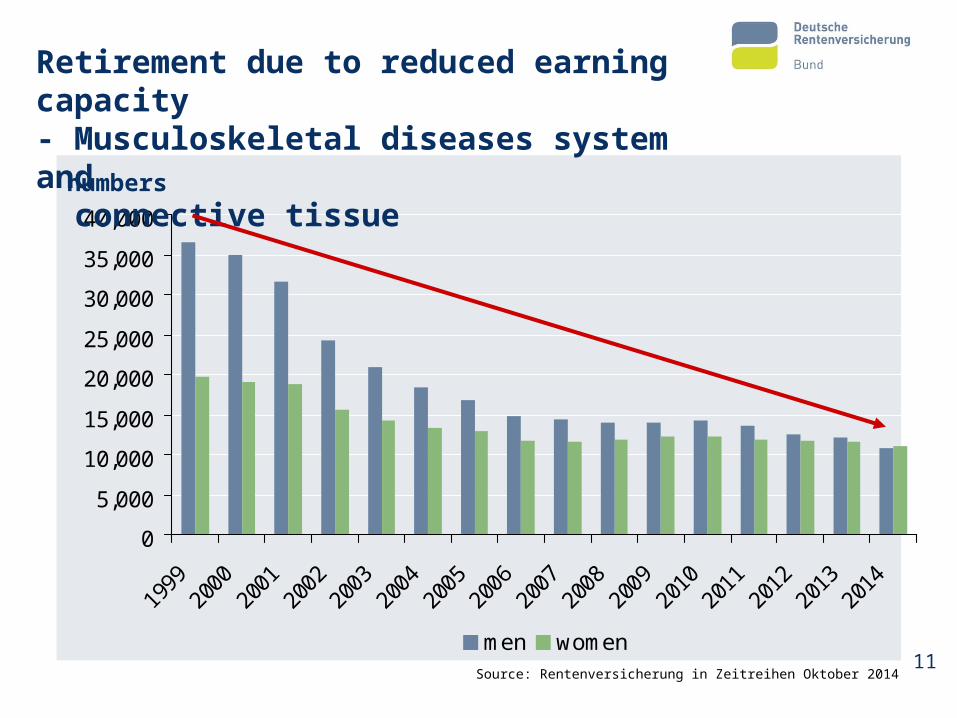
0
5,000
10,000
15,000
20,000
25,000
30,000
35,000
40,000
1999
2000
2001
2002
2003
2004
2005
2006
2007
2008
2009
2010
2011
2012
2013
2014
men women
Retirement due to reduced earning capacity- Musculoskeletal diseases system and connective tissue
Source: Rentenversicherung in Zeitreihen Oktober 2014
numbers
11
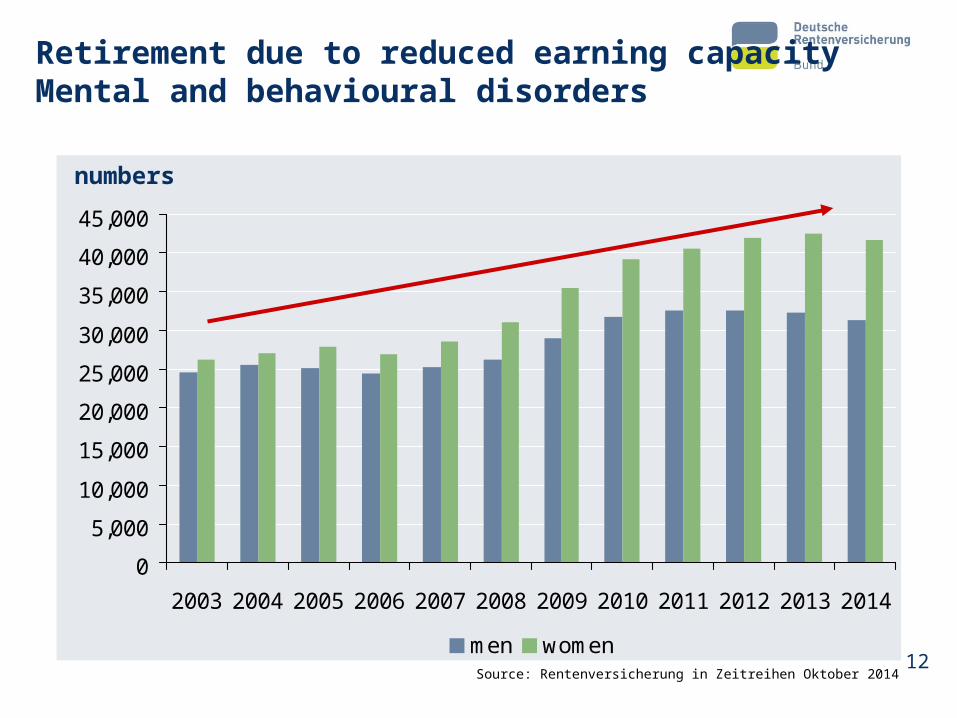
0
5,000
10,000
15,000
20,000
25,000
30,000
35,000
40,000
45,000
2003 2004 2005 2006 2007 2008 2009 2010 2011 2012 2013 2014
men womenSource: Rentenversicherung in Zeitreihen Oktober 2014
Retirement due to reduced earning capacityMental and behavioural disorders
12
numbers
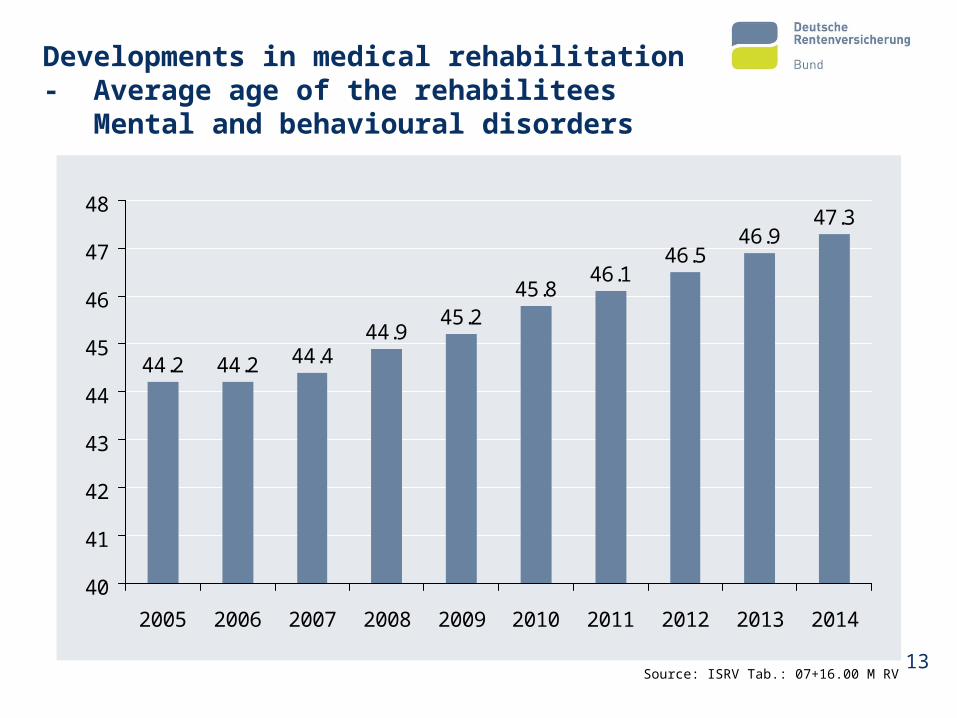
Developments in medical rehabilitation- Average age of the rehabilitees Mental and behavioural disorders
44.2 44.2 44.444.9
45.245.8
46.146.5
46.947.3
40
41
42
43
44
45
46
47
48
2005 2006 2007 2008 2009 2010 2011 2012 2013 2014
Source: ISRV Tab.: 07+16.00 M RV 13
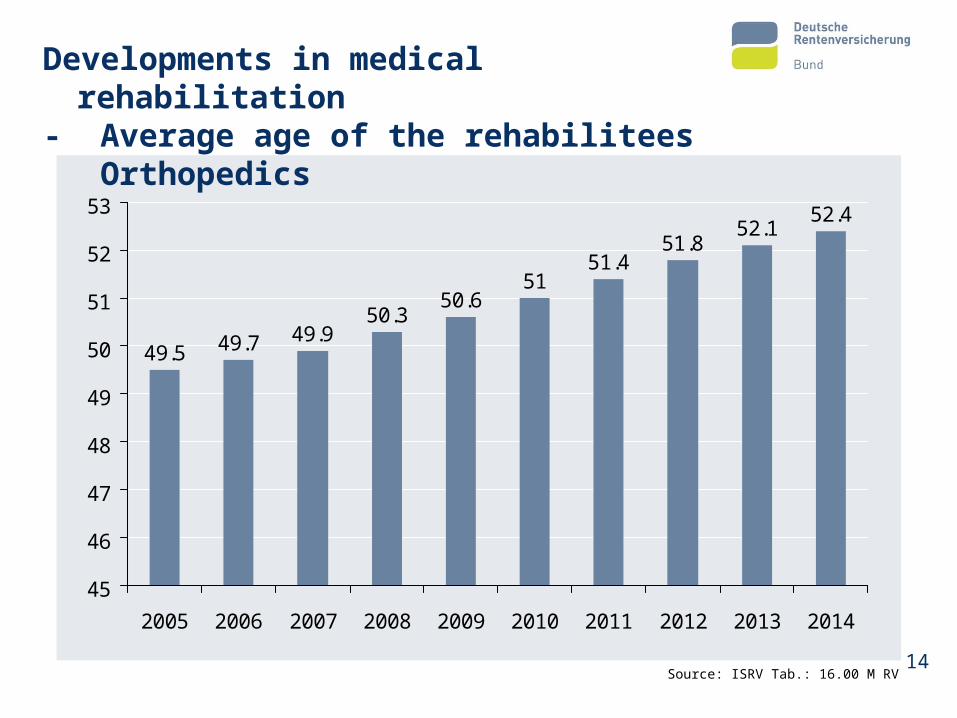
49.5 49.7 49.950.3
50.651
51.451.8
52.152.4
45
46
47
48
49
50
51
52
53
2005 2006 2007 2008 2009 2010 2011 2012 2013 2014
Source: ISRV Tab.: 16.00 M RV
Developments in medical rehabilitation- Average age of the rehabilitees Orthopedics
14
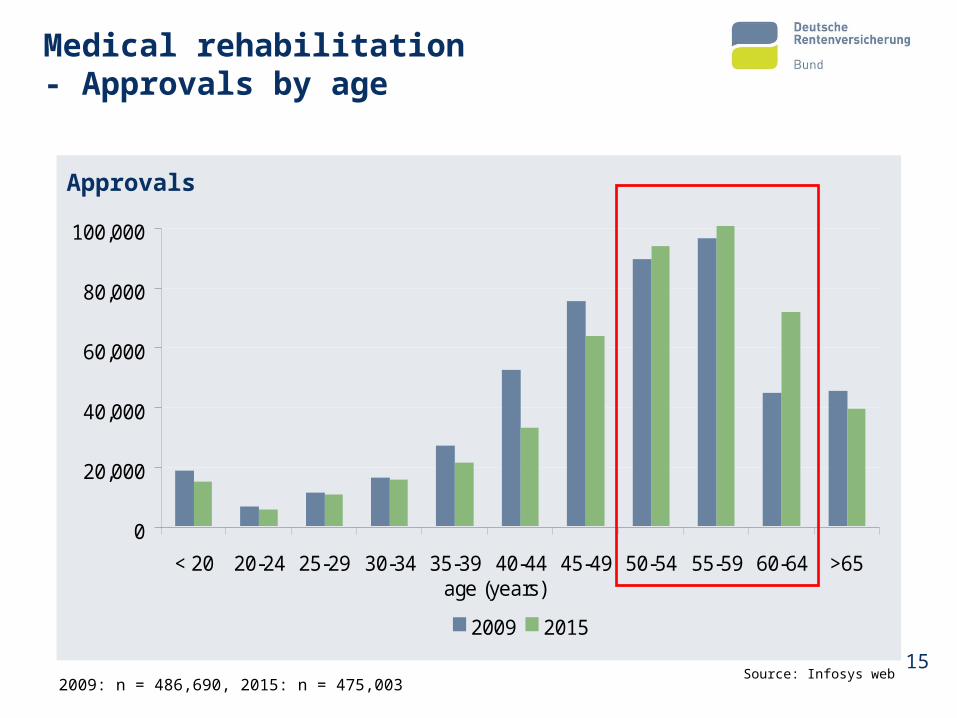
Approvals
Medical rehabilitation- Approvals by age
Source: Infosys web
0
20,000
40,000
60,000
80,000
100,000
< 20 20-24 25-29 30-34 35-39 40-44 45-49 50-54 55-59 60-64 >65age (years)
2009 2015
2009: n = 486,690, 2015: n = 475,00315
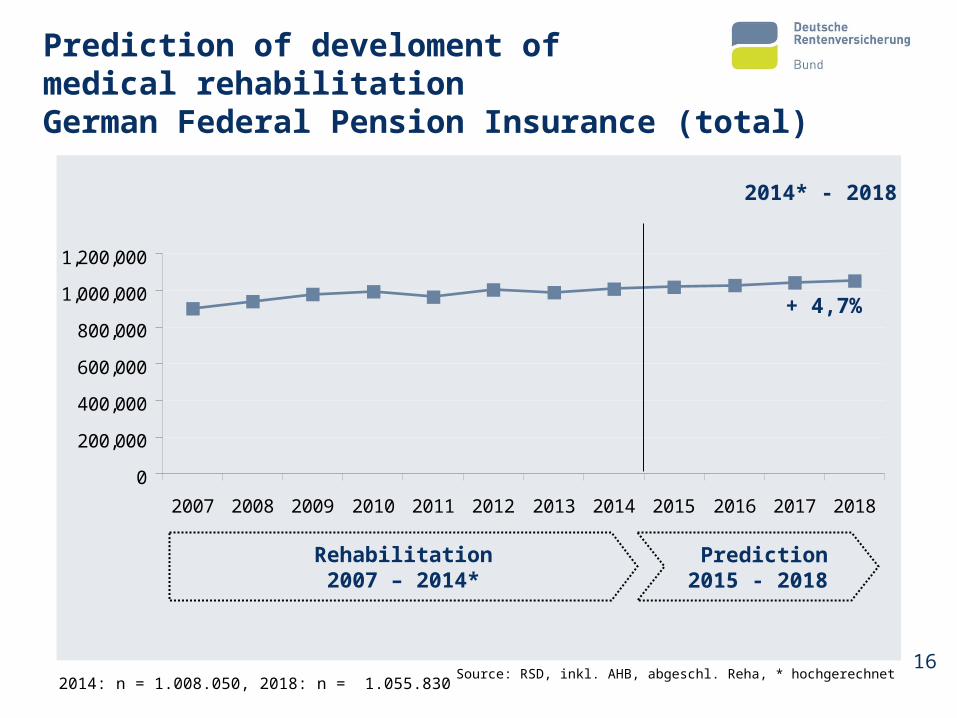
Prediction of develoment of medical rehabilitationGerman Federal Pension Insurance (total)
Source: RSD, inkl. AHB, abgeschl. Reha, * hochgerechnet2014: n = 1.008.050, 2018: n = 1.055.830
Rehabilitation2007 – 2014*
Prediction2015 - 2018
0
200,000
400,000
600,000
800,000
1,000,000
1,200,000
2007 2008 2009 2010 2011 2012 2013 2014 2015 2016 2017 2018
+ 4,7%
2014* - 2018
16
Needs for orientation in medical rehabilitation
Source: Re-Analyse MBO-Studie (Streibelt 2009)
Patient survey before starting orthopedic rehabilitation:
What do you think will help you most during
rehabilitation?
17
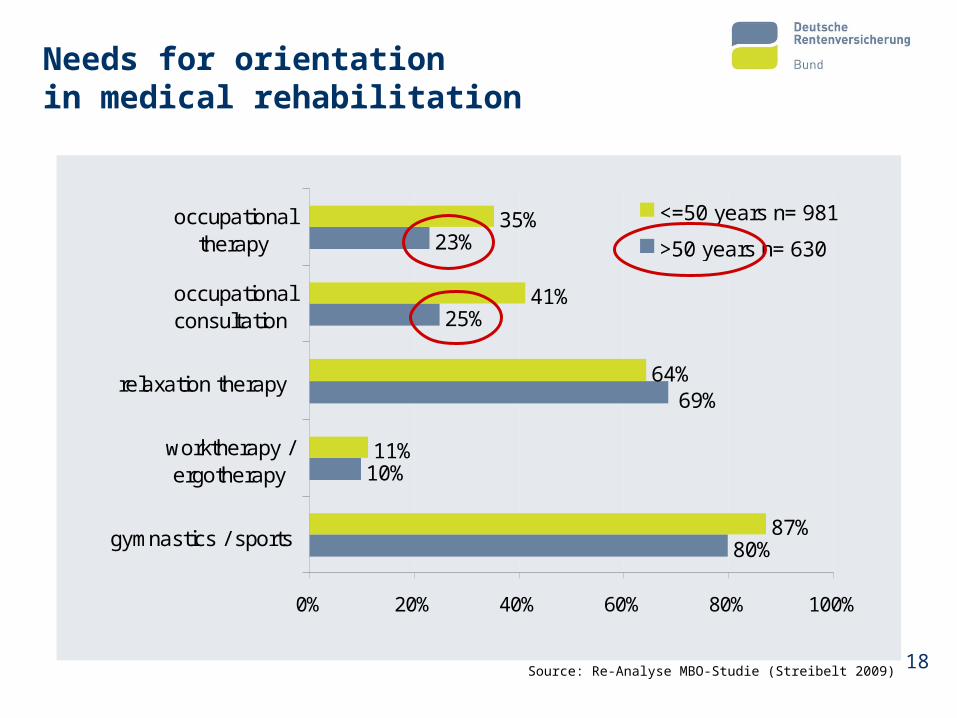
Needs for orientation in medical rehabilitation
80%
10%
25%
23%
87%
11%
64%
41%
35%
69%
0% 20% 40% 60% 80% 100%
gymnastics / sports
worktherapy /ergotherapy
relaxation therapy
occupationalconsultation
occupationaltherapy
<=50 years n= 981
>50 years n= 630
Source: Re-Analyse MBO-Studie (Streibelt 2009) 18
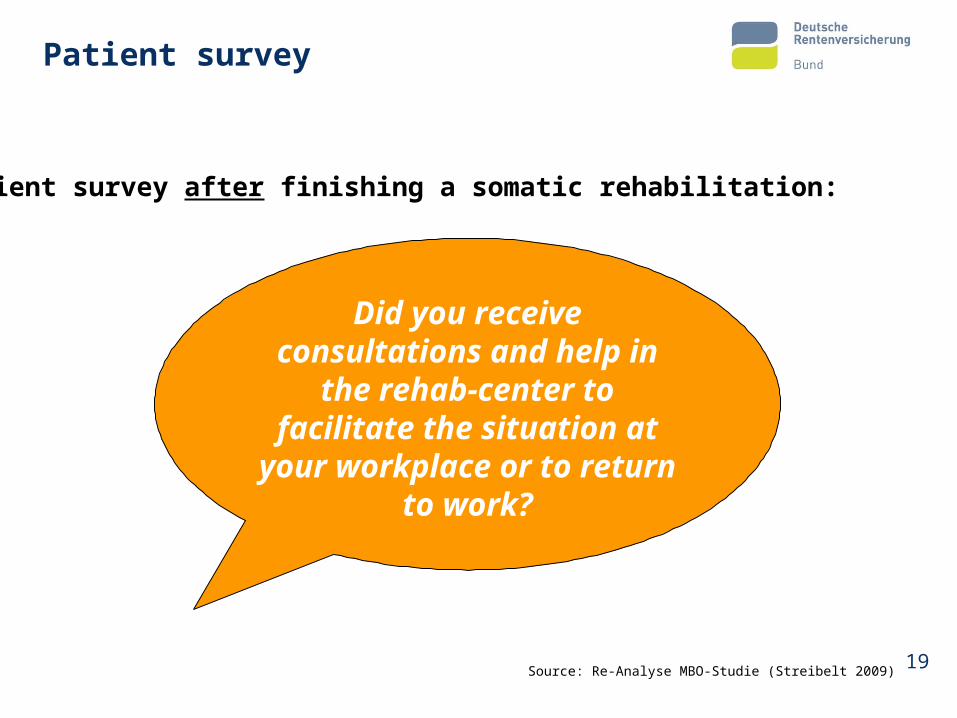
Patient survey
Source: Re-Analyse MBO-Studie (Streibelt 2009)
Patient survey after finishing a somatic rehabilitation:
Did you receive consultations and help in
the rehab-center to facilitate the situation at
your workplace or to return to work?
19
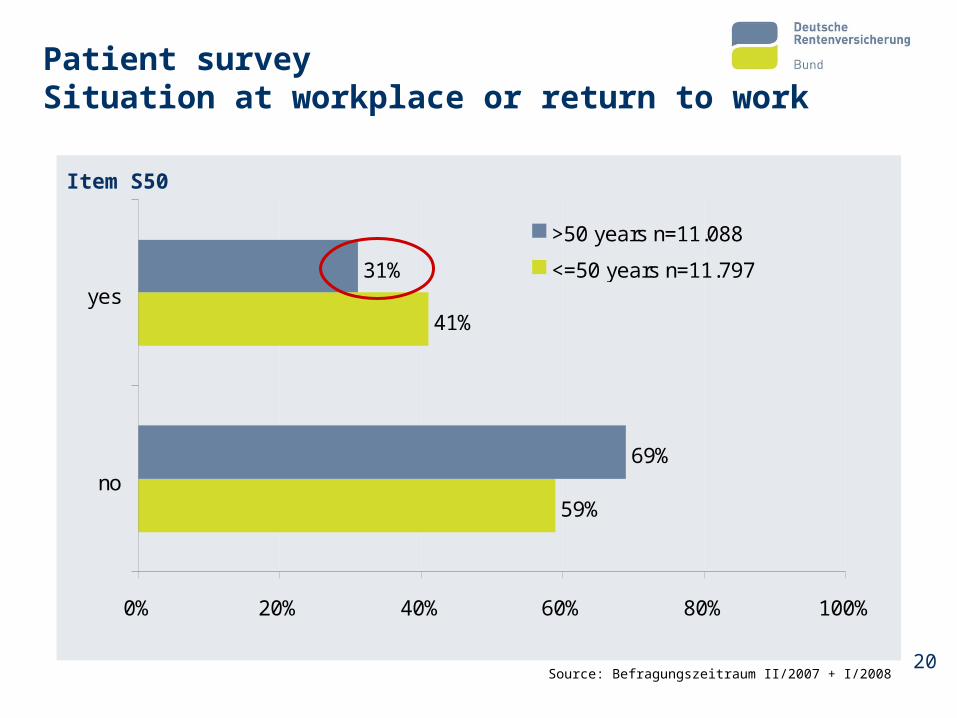
Item S50
Patient survey Situation at workplace or return to work
59%
41%
69%
31%
0% 20% 40% 60% 80% 100%
no
yes
>50 years n=11.088
<=50 years n=11.797
Source: Befragungszeitraum II/2007 + I/2008 20
21
0
0,2
0,4
0,6
0,8
1
0 500 1000 1500 2000
Tage bis Rentenzugang
Kum
ulie
rtes
Über
lebe
n
T-Wert bis 40
T-Wert größer 40 bis 60
T-Wert größer 60
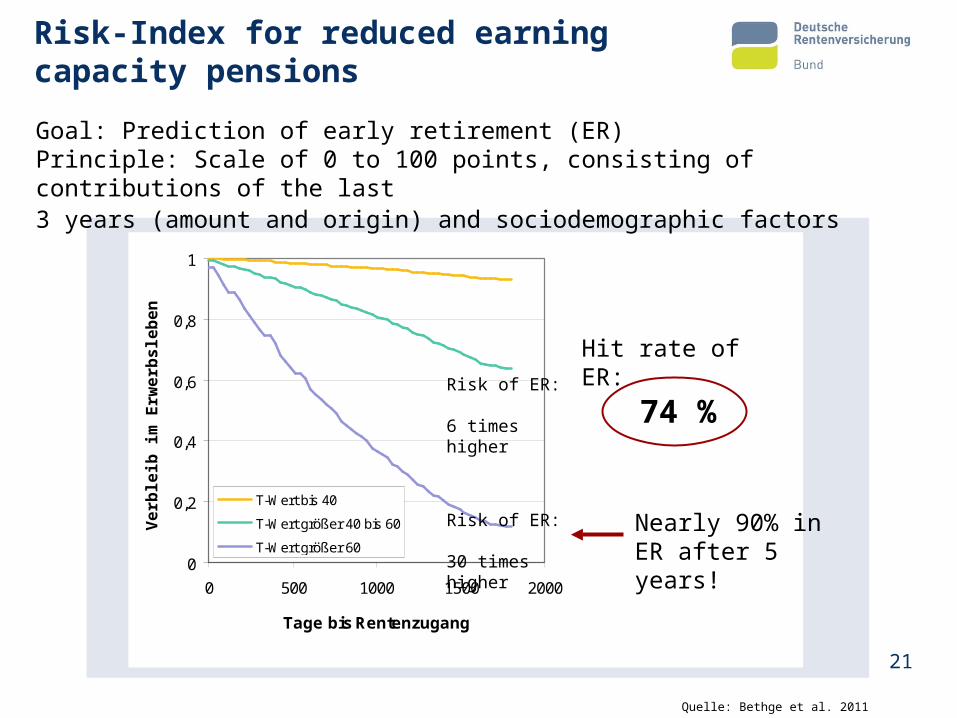
Risk-Index for reduced earning capacity pensions
Quelle: Bethge et al. 2011
Goal: Prediction of early retirement (ER)Principle: Scale of 0 to 100 points, consisting of contributions of the last3 years (amount and origin) and sociodemographic factors
Risk of ER: 30 times higher
Risk of ER: 6 times higher
Hit rate of ER:
74 %
Nearly 90% in ER after 5 years!
Verb
leib
im E
rwer
bsle
ben
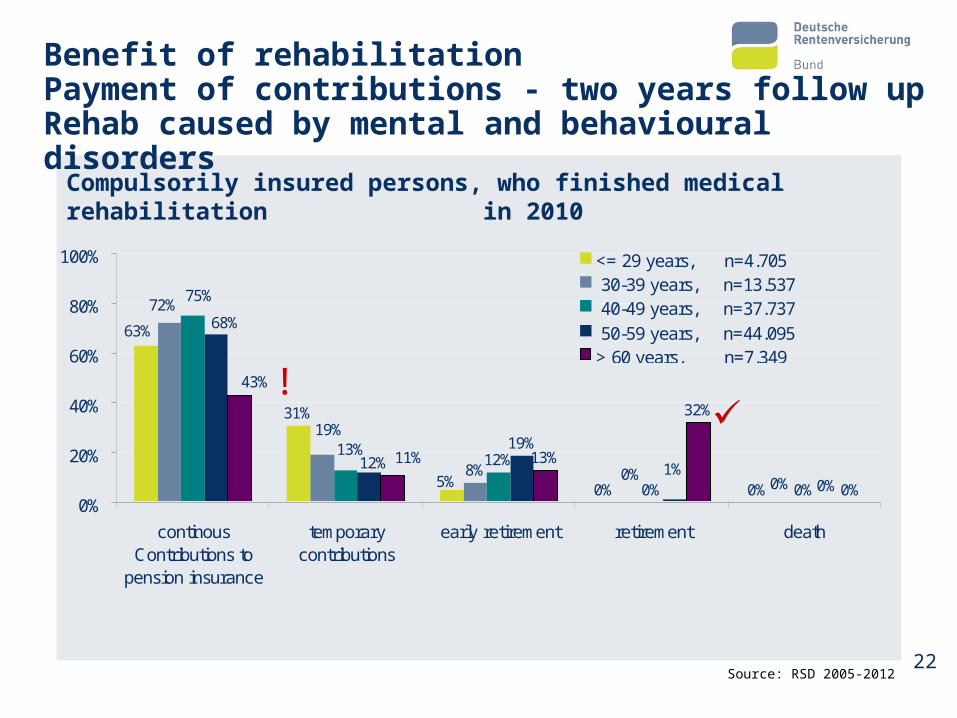
31%
0% 0%8%
12%
0% 0%
19%13%
32%
0%5%
63%
0%
72%
0%
19%13%
75%
1%0%
12%
68%
11%
43%
0%
20%
40%
60%
80%
100%
continousContributions to
pension insurance
temporarycontributions
early retirement retirement death
<= 29 years, n=4.705 30-39 years, n=13.537 40-49 years, n=37.737 50-59 years, n=44.095> 60 years, n=7.349
Benefit of rehabilitation Payment of contributions - two years follow upRehab caused by mental and behavioural disorders
Source: RSD 2005-2012
!
Compulsorily insured persons, who finished medical rehabilitation in 2010
22
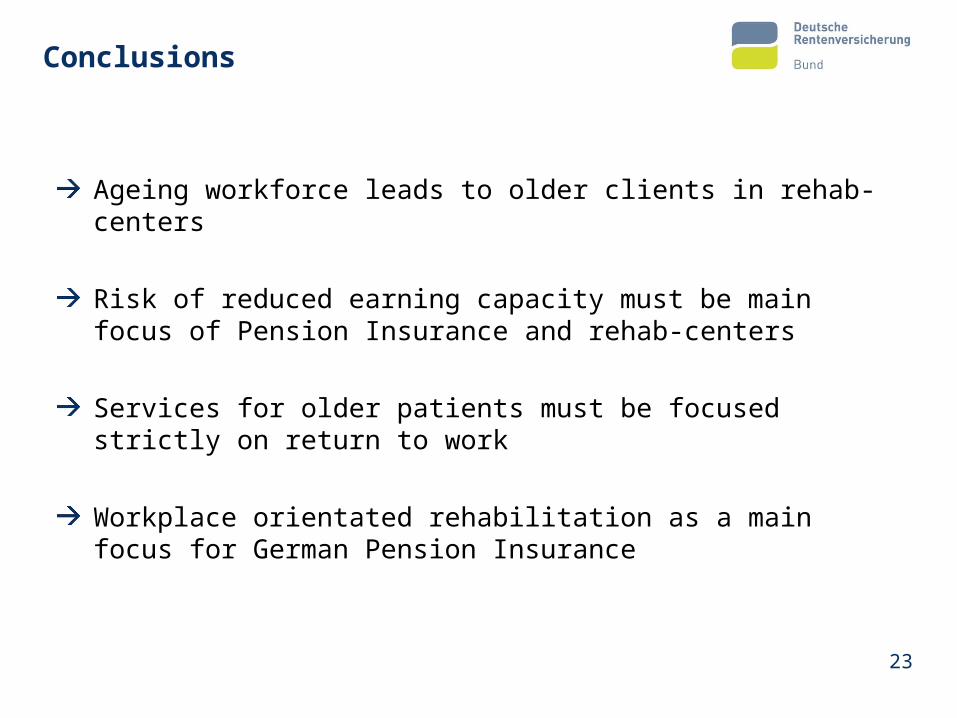
Conclusions
Ageing workforce leads to older clients in rehab-centers
Risk of reduced earning capacity must be main focus of Pension Insurance and rehab-centers
Services for older patients must be focused strictly on return to work
Workplace orientated rehabilitation as a main focus for German Pension Insurance
23
Impressum
23rd Rehabilitation International World Congress25th of October – 27nd of October 2016, Edinburgh, Scotland
Consequences of demographic change on rehabilitation in German Pension Insurance
Uwe EgnerGerman Federal Pension Insurance
24