Embed Size (px)
Citation preview
MONTHLY STATISTICS PACKAGE
City of Calgary
CREB® Monthly Statistics City of Calgary2
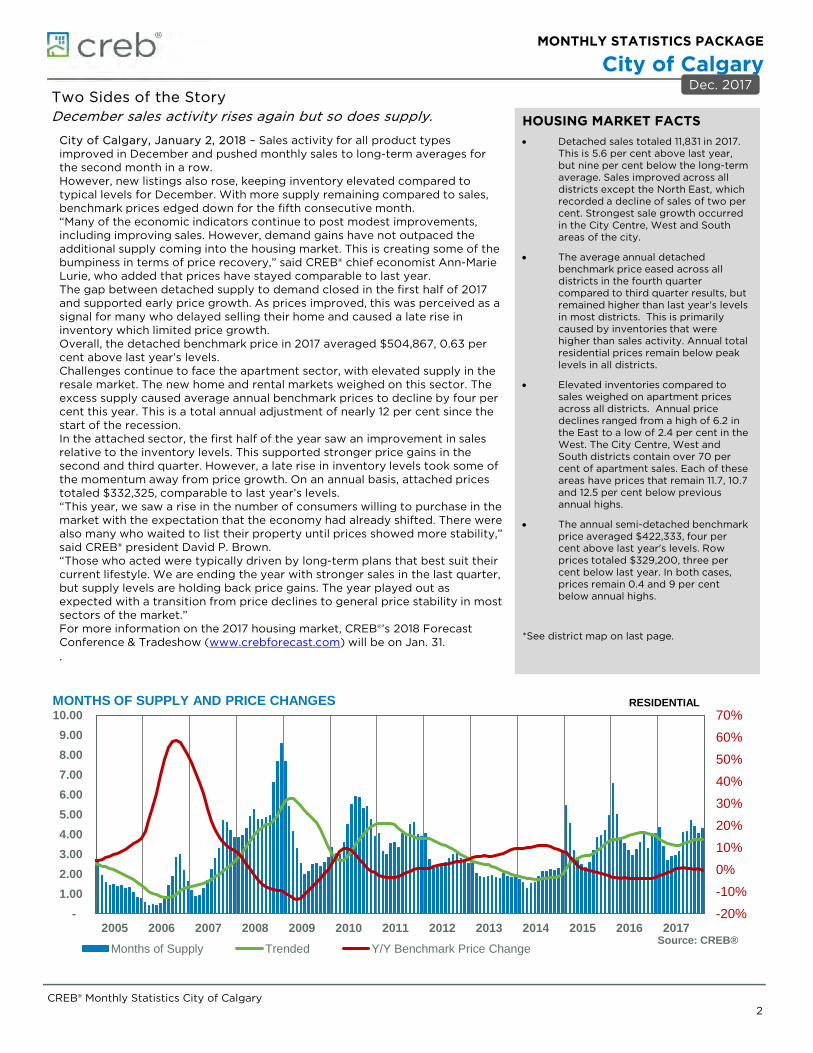
Two Sides of the StoryDecember sales activity rises again but so does supply.
Dec. 2017
City of Calgary, January 2, 2018 – Sales activity for all product types improved in December and pushed monthly sales to long-term averages for the second month in a row.However, new listings also rose, keeping inventory elevated compared to typical levels for December. With more supply remaining compared to sales, benchmark prices edged down for the fifth consecutive month. “Many of the economic indicators continue to post modest improvements, including improving sales. However, demand gains have not outpaced the additional supply coming into the housing market. This is creating some of the bumpiness in terms of price recovery,” said CREB® chief economist Ann-Marie Lurie, who added that prices have stayed comparable to last year.The gap between detached supply to demand closed in the first half of 2017 and supported early price growth. As prices improved, this was perceived as a signal for many who delayed selling their home and caused a late rise in inventory which limited price growth. Overall, the detached benchmark price in 2017 averaged $504,867, 0.63 per cent above last year’s levels.Challenges continue to face the apartment sector, with elevated supply in the resale market. The new home and rental markets weighed on this sector. The excess supply caused average annual benchmark prices to decline by four per cent this year. This is a total annual adjustment of nearly 12 per cent since the start of the recession. In the attached sector, the first half of the year saw an improvement in sales relative to the inventory levels. This supported stronger price gains in the second and third quarter. However, a late rise in inventory levels took some of the momentum away from price growth. On an annual basis, attached prices totaled $332,325, comparable to last year’s levels.“This year, we saw a rise in the number of consumers willing to purchase in the market with the expectation that the economy had already shifted. There were also many who waited to list their property until prices showed more stability,” said CREB® president David P. Brown.“Those who acted were typically driven by long-term plans that best suit their current lifestyle. We are ending the year with stronger sales in the last quarter, but supply levels are holding back price gains. The year played out as expected with a transition from price declines to general price stability in most sectors of the market.” For more information on the 2017 housing market, CREB®’s 2018 Forecast Conference & Tradeshow (www.crebforecast.com) will be on Jan. 31. .
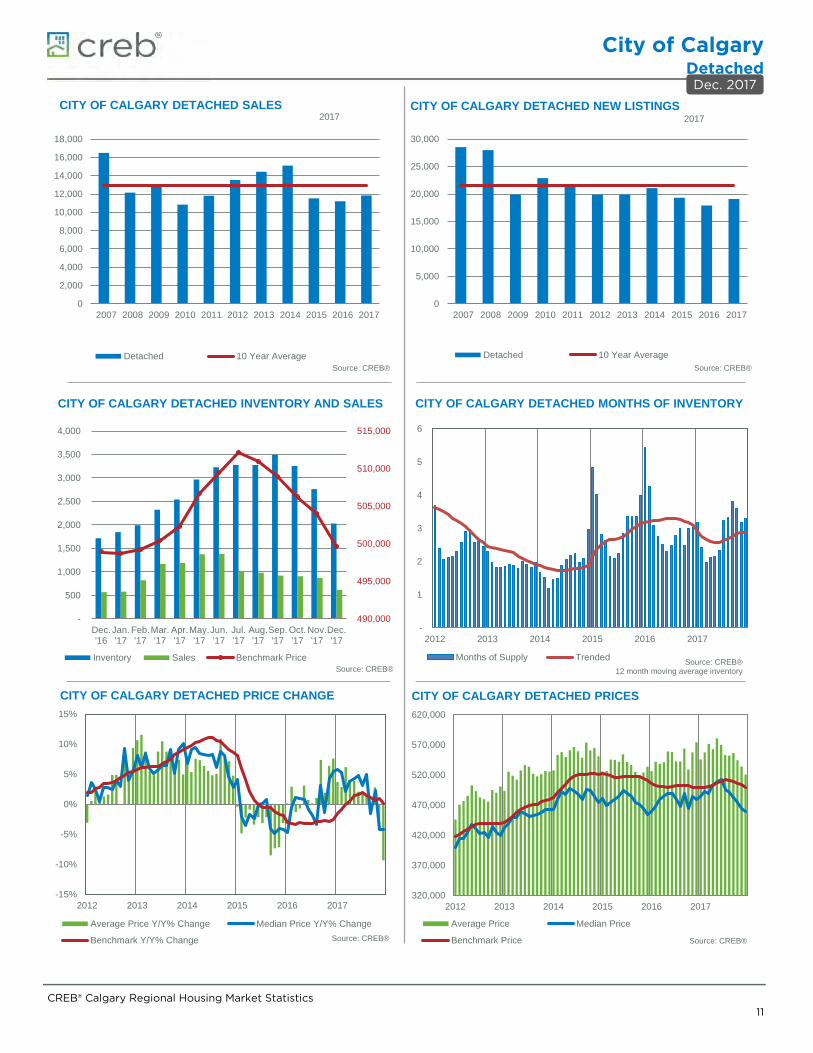
HOUSING MARKET FACTS• Detached sales totaled 11,831 in 2017.
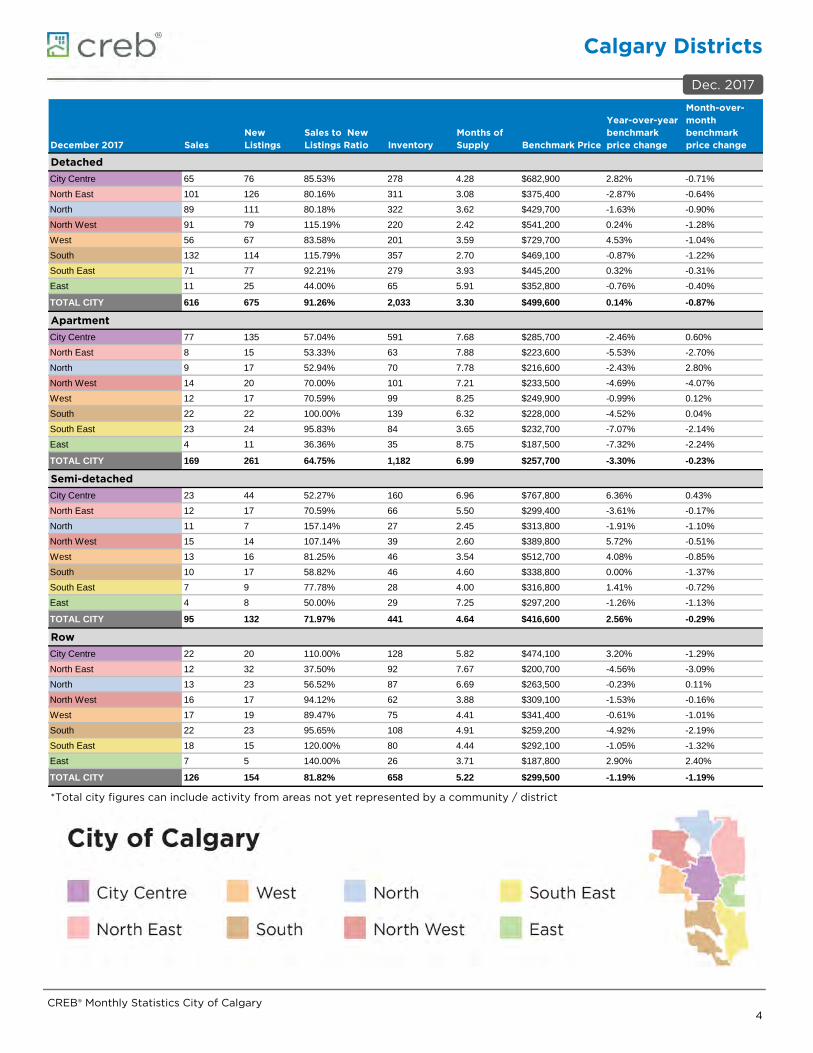
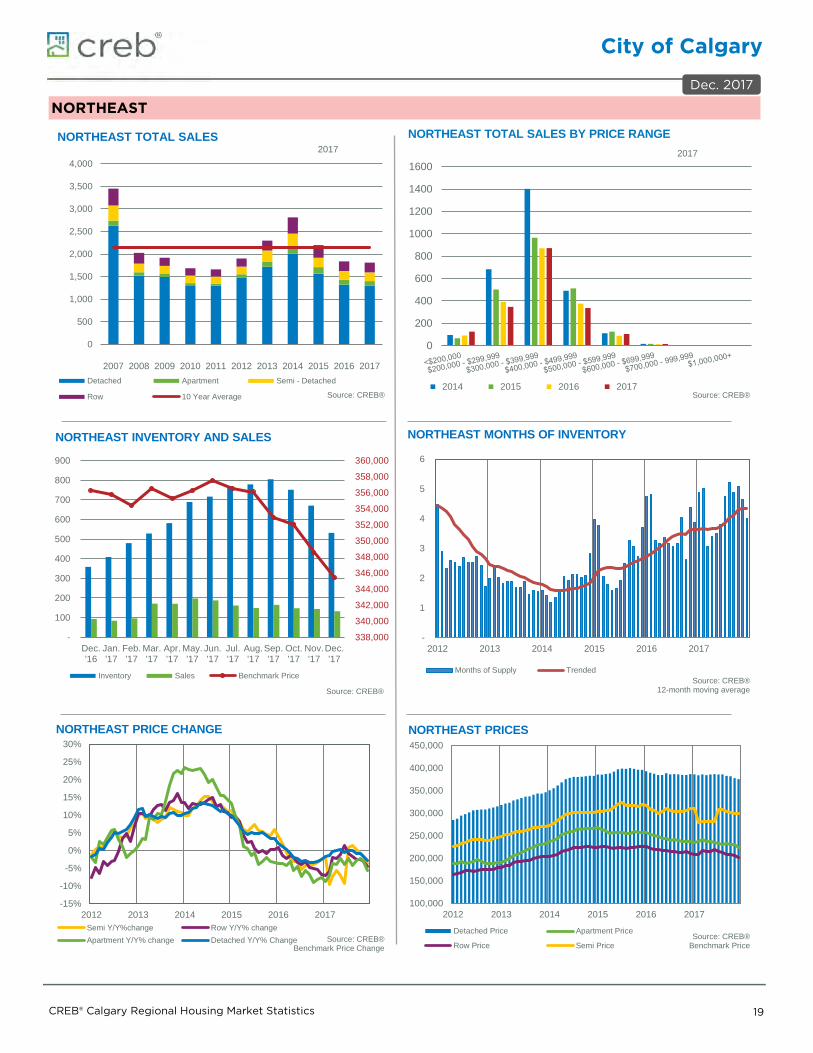
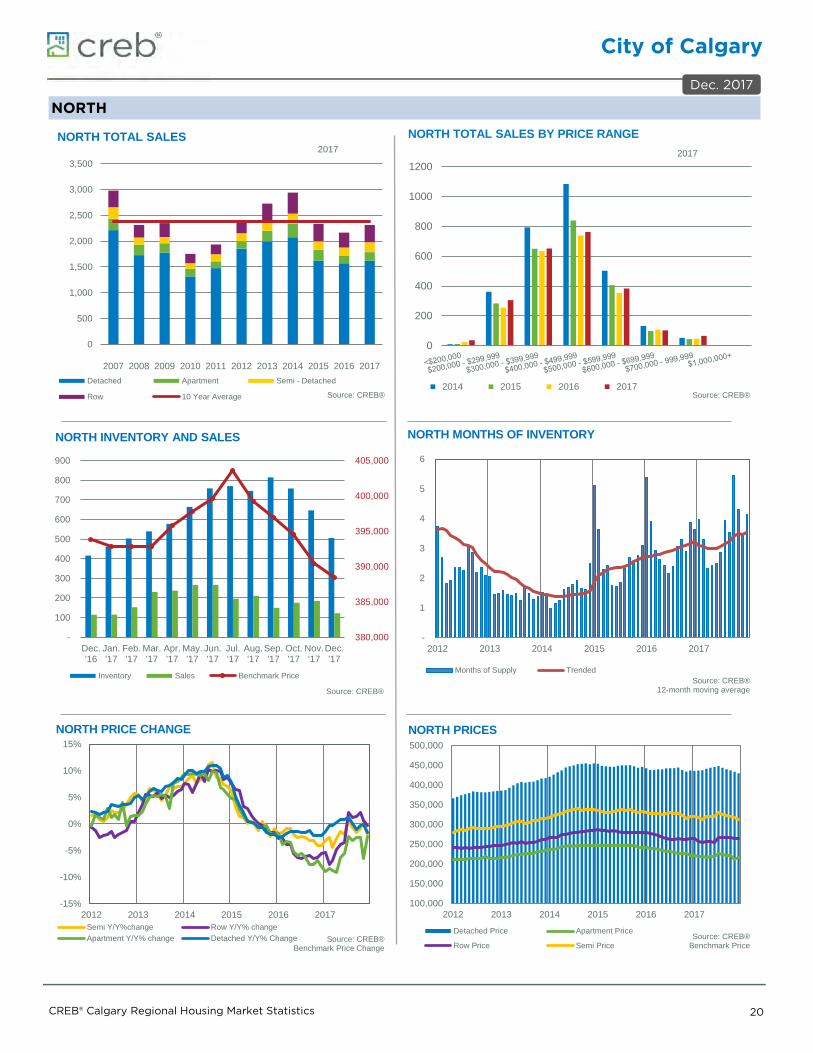
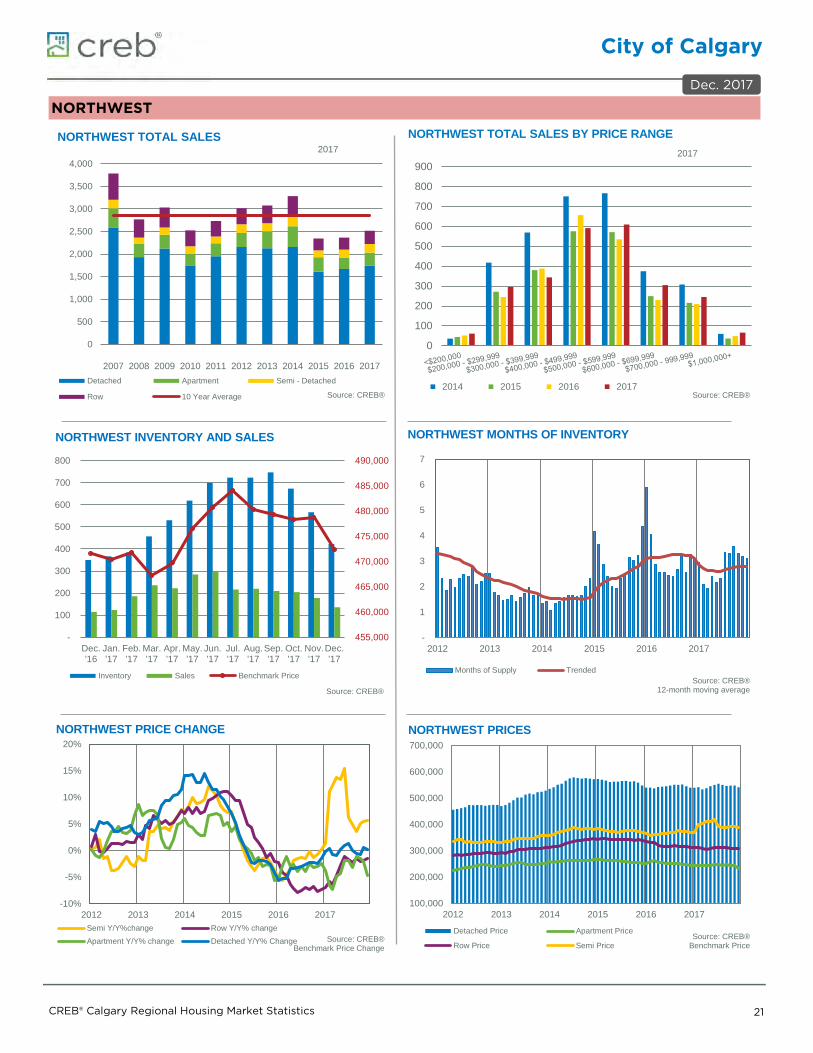
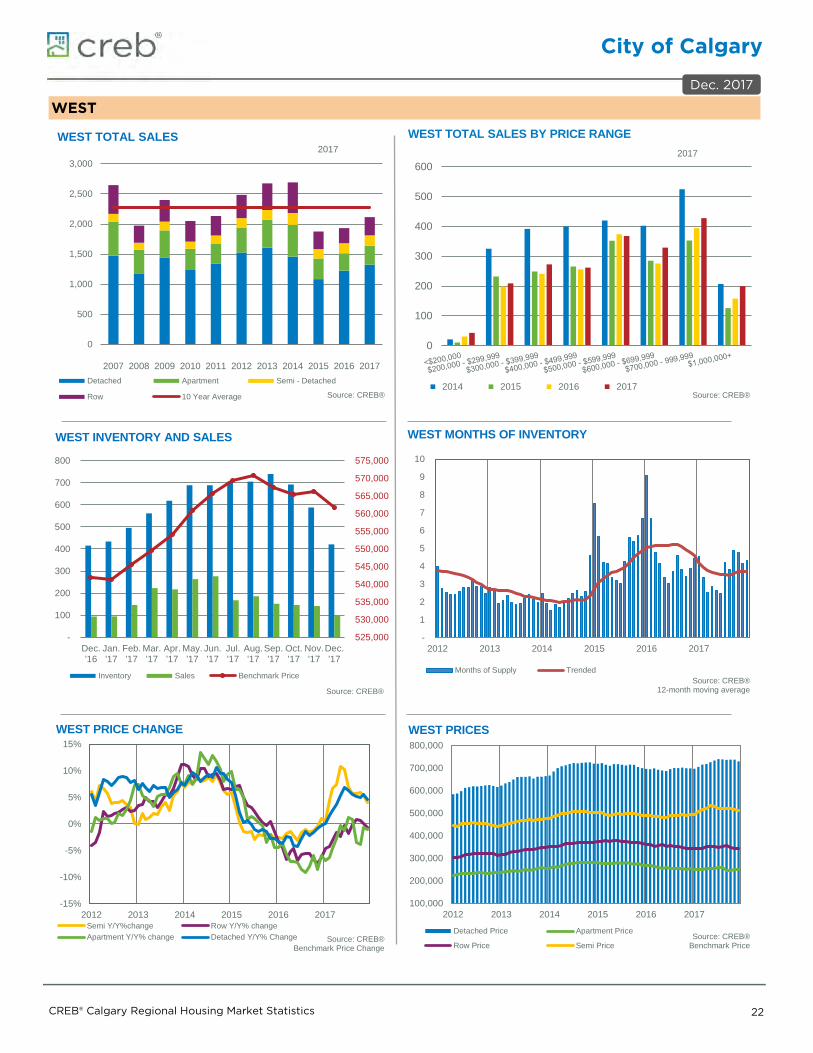
This is 5.6 per cent above last year, but nine per cent below the long-term average. Sales improved across all districts except the North East, which recorded a decline of sales of two per cent. Strongest sale growth occurred in the City Centre, West and South areas of the city.
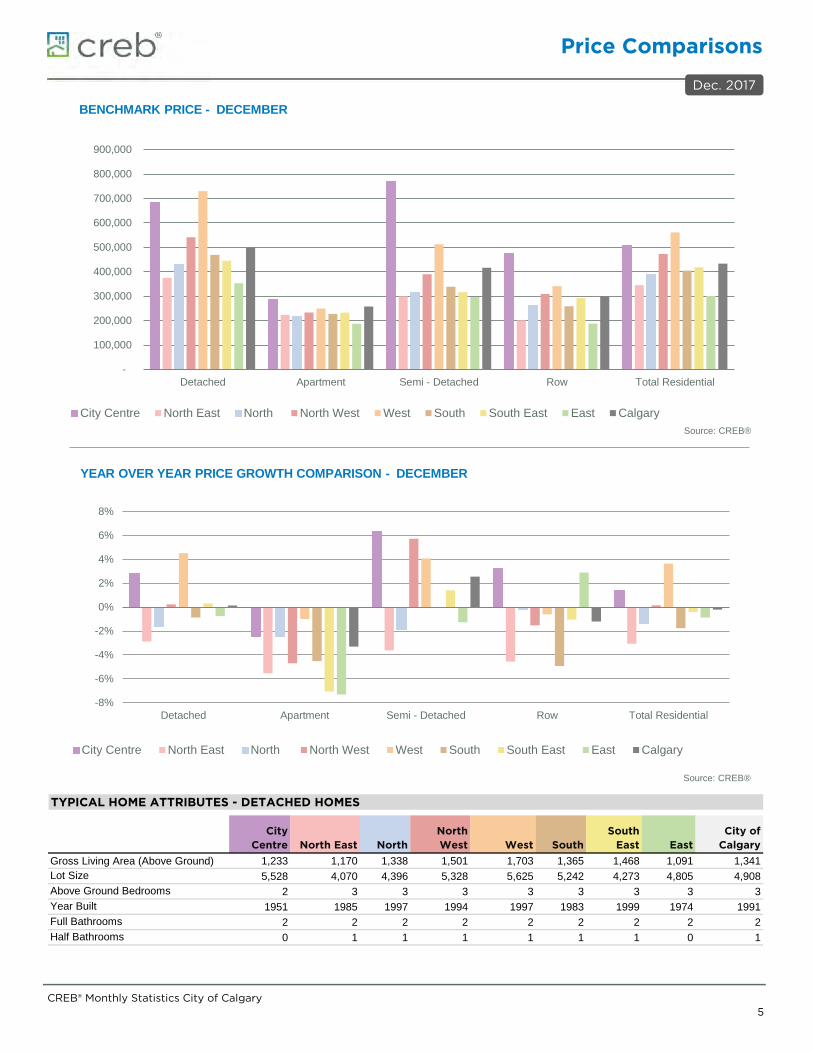
• The average annual detached benchmark price eased across all districts in the fourth quarter compared to third quarter results, but remained higher than last year’s levels in most districts. This is primarily caused by inventories that were higher than sales activity. Annual total residential prices remain below peak levels in all districts.
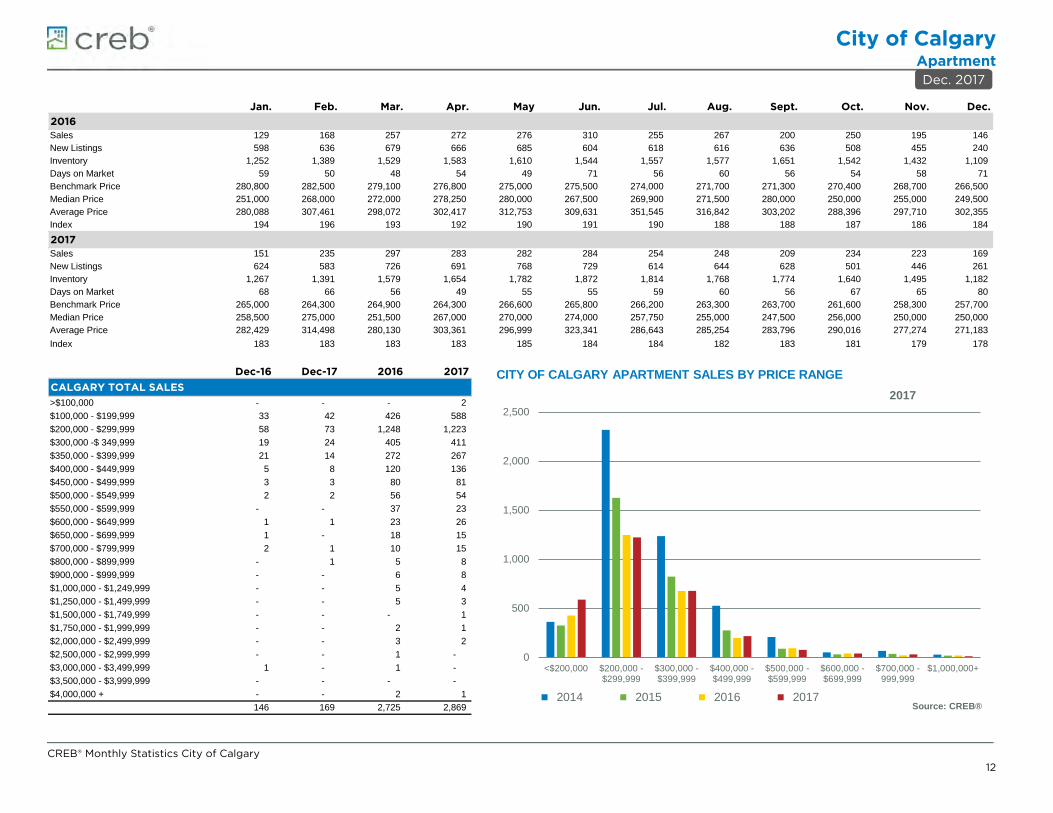
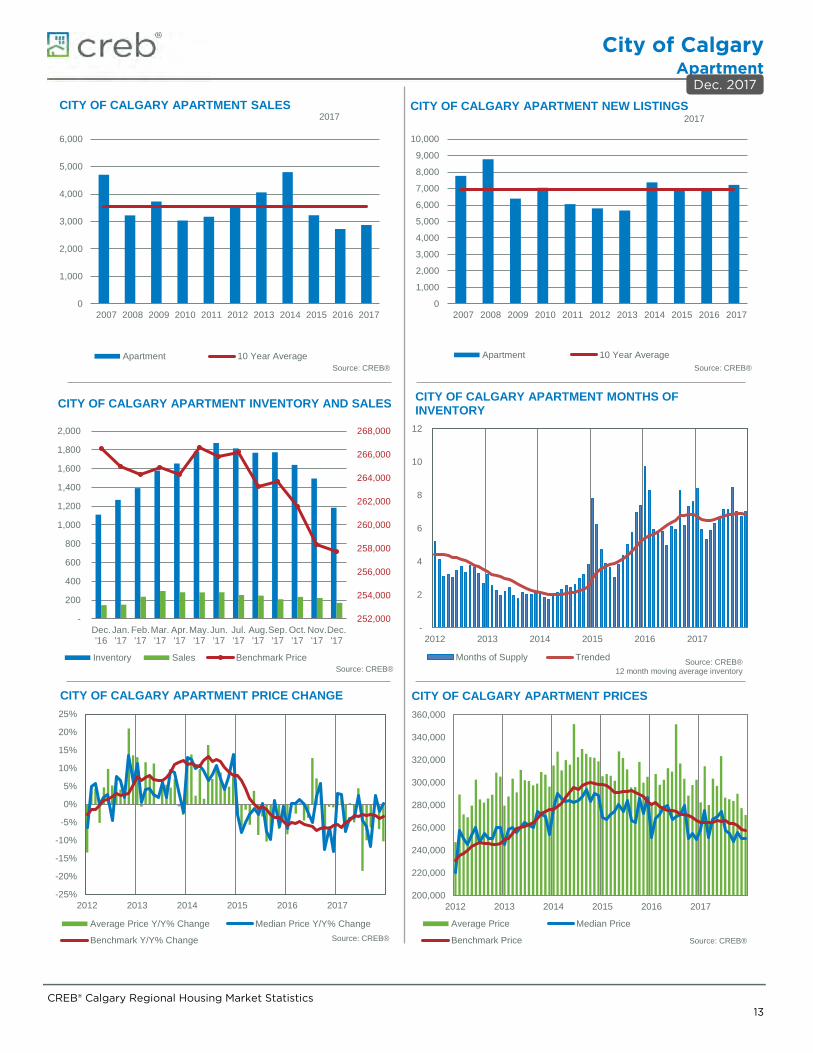
• Elevated inventories compared to sales weighed on apartment prices across all districts. Annual price declines ranged from a high of 6.2 in the East to a low of 2.4 per cent in the West. The City Centre, West and South districts contain over 70 per cent of apartment sales. Each of these areas have prices that remain 11.7, 10.7 and 12.5 per cent below previous annual highs.
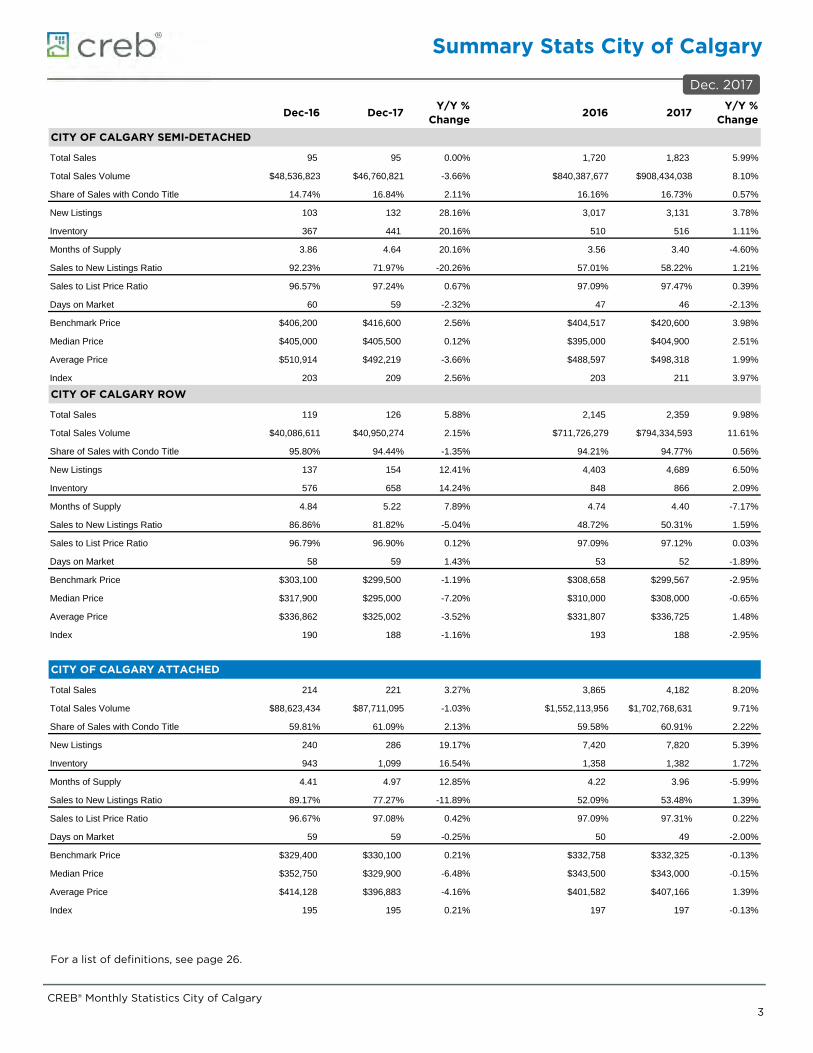
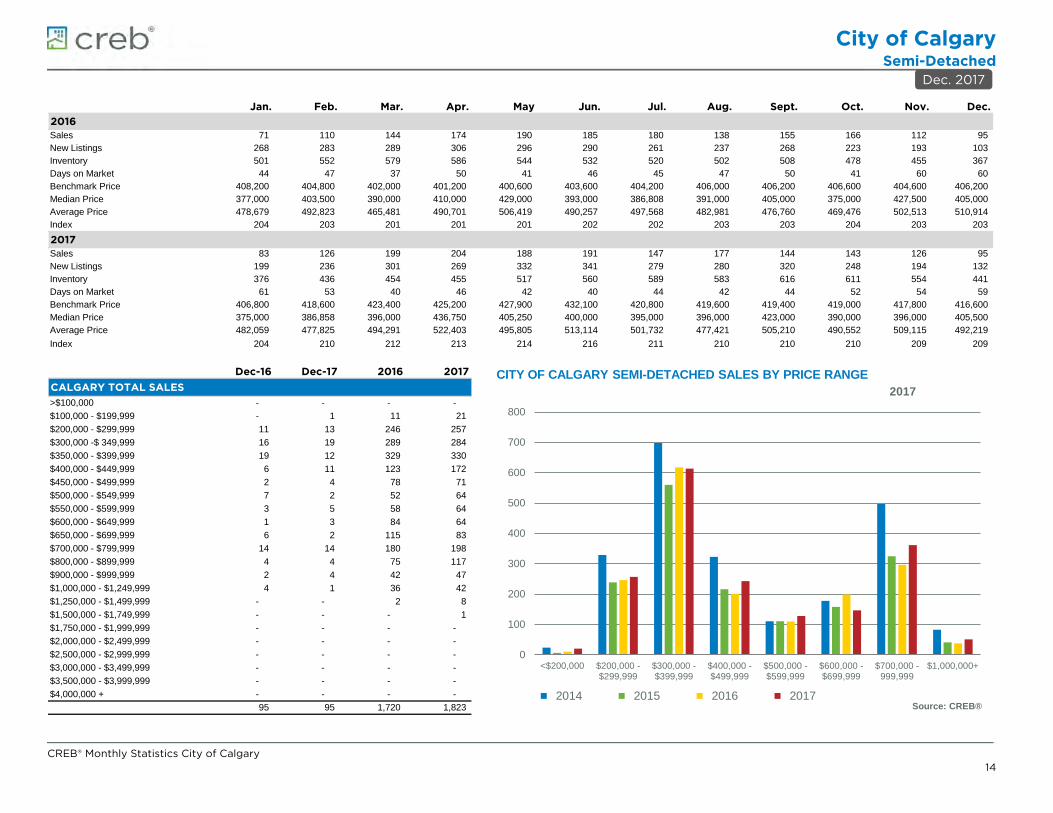
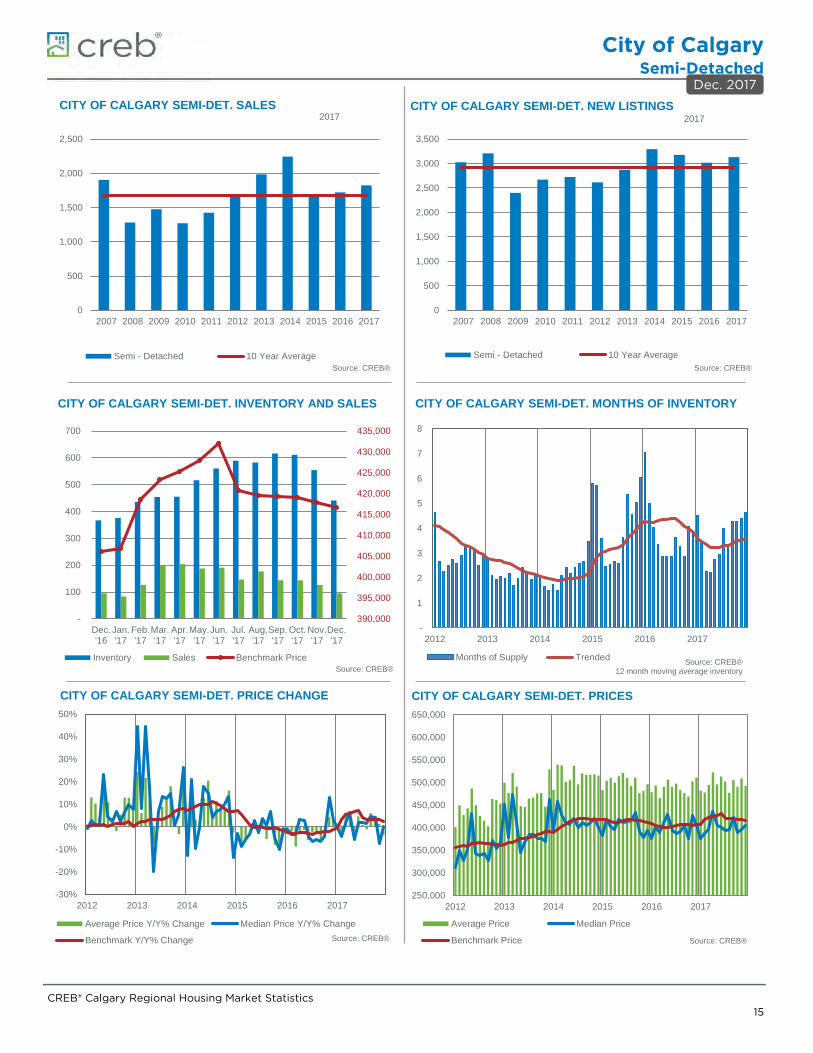
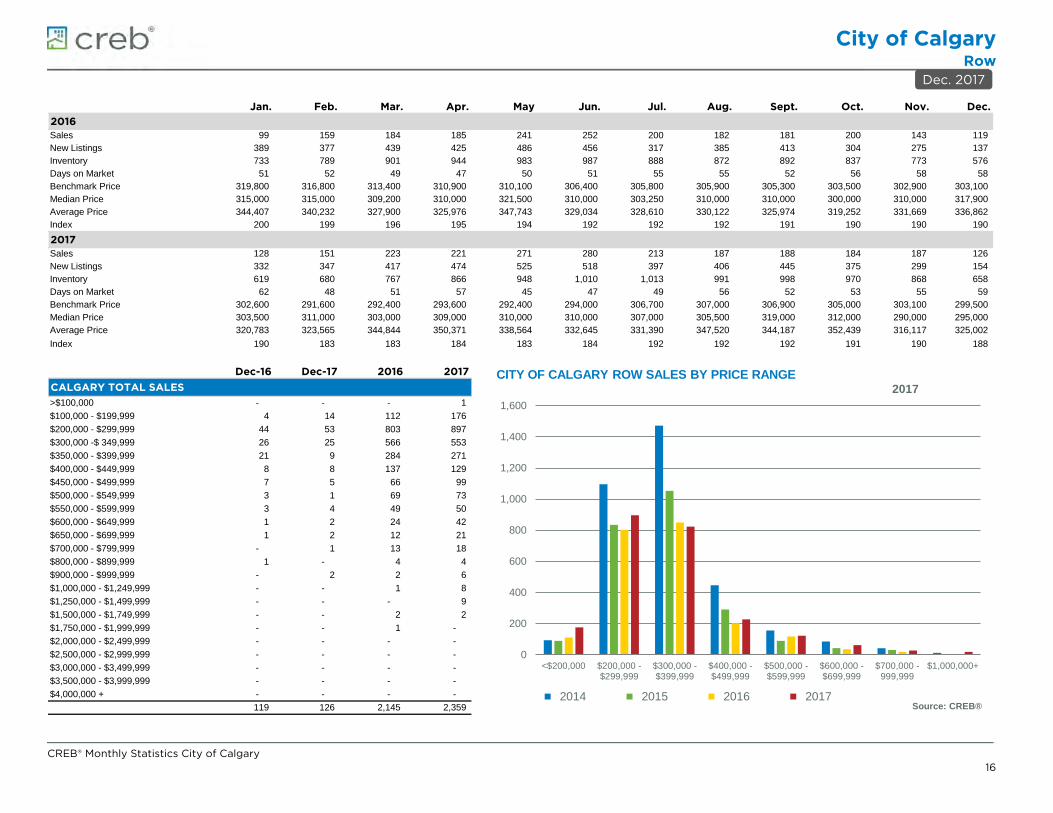
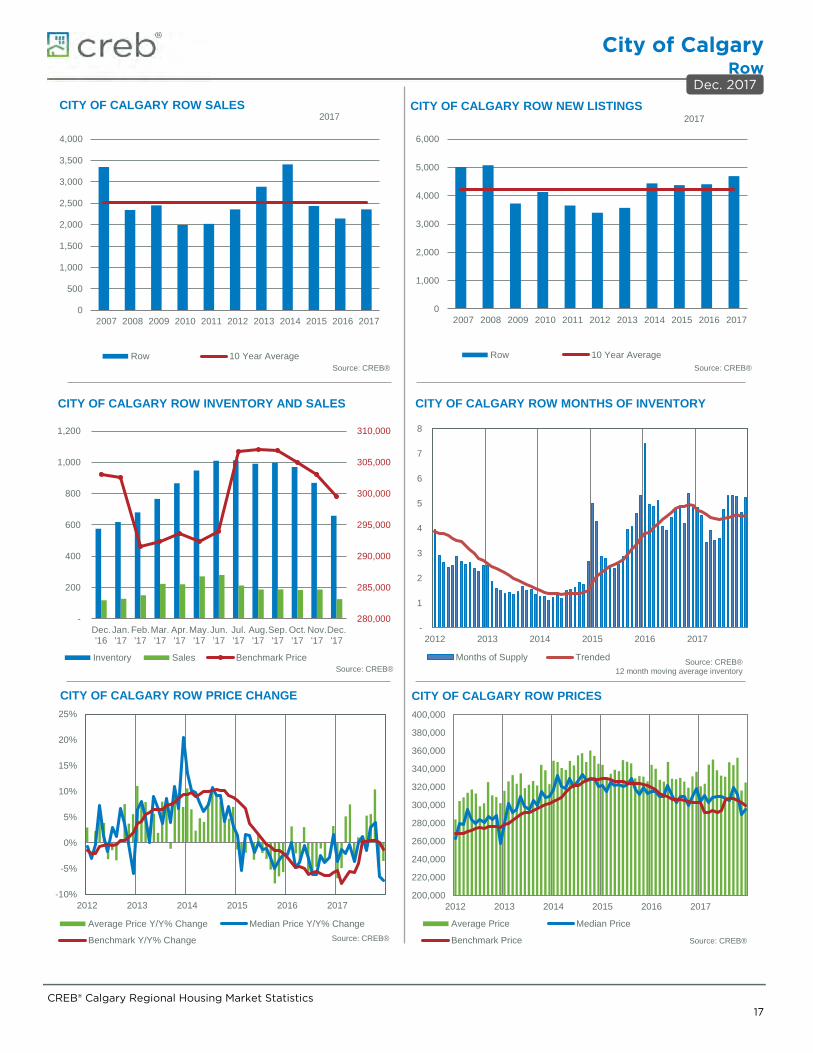
• The annual semi-detached benchmark price averaged $422,333, four per cent above last year's levels. Row prices totaled $329,200, three per cent below last year. In both cases, prices remain 0.4 and 9 per cent below annual highs.
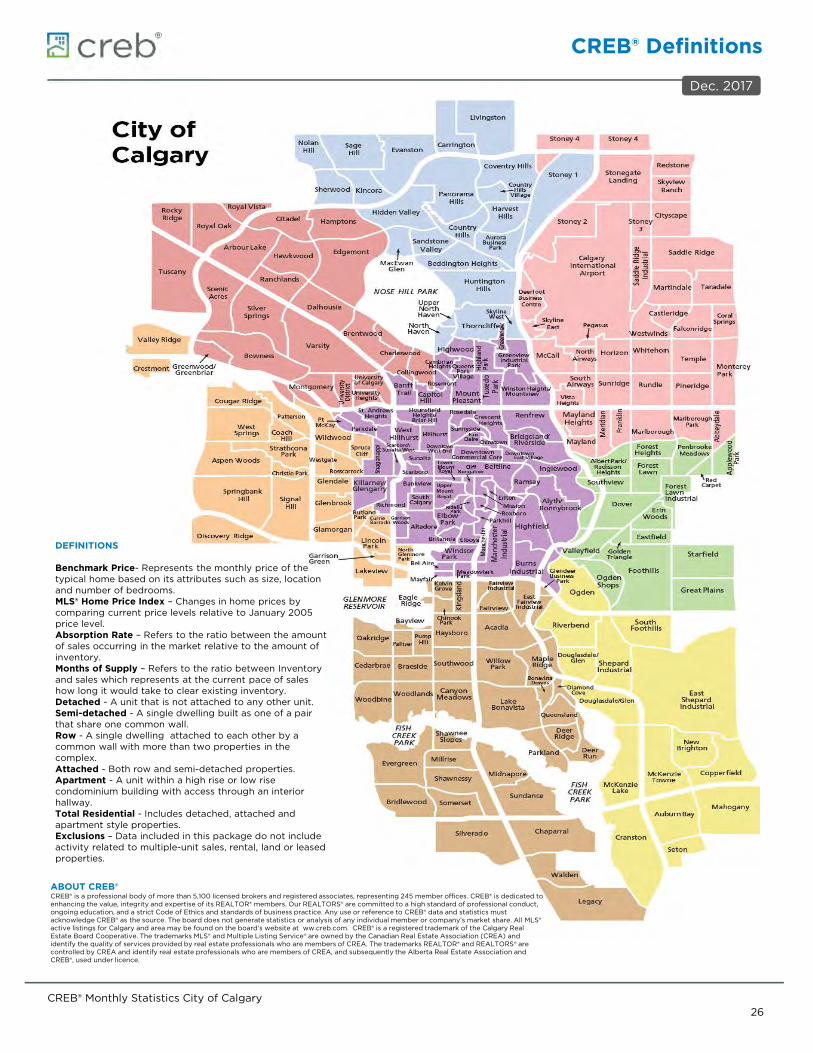
*See district map on last page.
-20%
-10%
0%
10%
20%
30%
40%
50%
60%
70%
- 1.00 2.00 3.00 4.00 5.00 6.00 7.00 8.00 9.00
10.00
2005 2006 2007 2008 2009 2010 2011 2012 2013 2014 2015 2016 2017
RESIDENTIALMONTHS OF SUPPLY AND PRICE CHANGES
Months of Supply Trended Y/Y Benchmark Price ChangeSource: CREB®
Summary Stats City of Calgary
CREB® Monthly Statistics City of Calgary 2
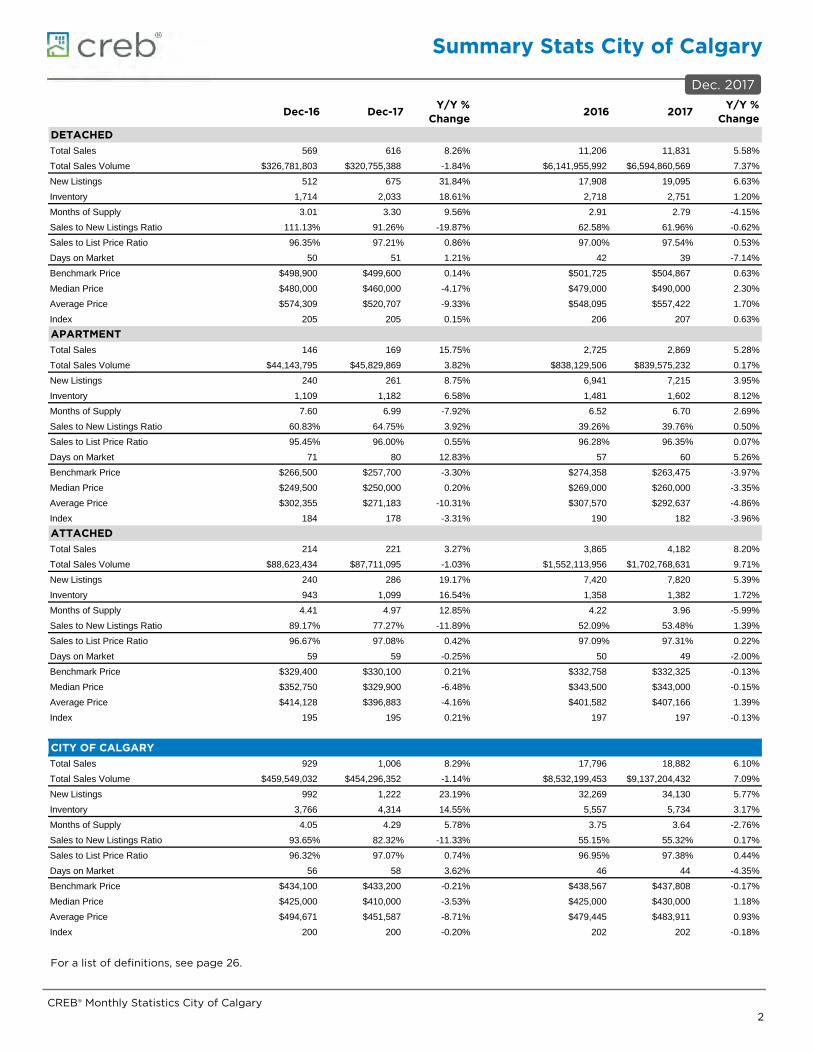
Dec-16 Dec-17 Y/Y % Change 2016 2017 Y/Y %
ChangeDETACHEDTotal Sales 569 616 8.26% 11,206 11,831 5.58%Total Sales Volume $326,781,803 $320,755,388 -1.84% $6,141,955,992 $6,594,860,569 7.37%New Listings 512 675 31.84% 17,908 19,095 6.63%Inventory 1,714 2,033 18.61% 2,718 2,751 1.20%Months of Supply 3.01 3.30 9.56% 2.91 2.79 -4.15%Sales to New Listings Ratio 111.13% 91.26% -19.87% 62.58% 61.96% -0.62%Sales to List Price Ratio 96.35% 97.21% 0.86% 97.00% 97.54% 0.53%Days on Market 50 51 1.21% 42 39 -7.14%Benchmark Price $498,900 $499,600 0.14% $501,725 $504,867 0.63%Median Price $480,000 $460,000 -4.17% $479,000 $490,000 2.30%Average Price $574,309 $520,707 -9.33% $548,095 $557,422 1.70%Index 205 205 0.15% 206 207 0.63%APARTMENTTotal Sales 146 169 15.75% 2,725 2,869 5.28%Total Sales Volume $44,143,795 $45,829,869 3.82% $838,129,506 $839,575,232 0.17%New Listings 240 261 8.75% 6,941 7,215 3.95%Inventory 1,109 1,182 6.58% 1,481 1,602 8.12%Months of Supply 7.60 6.99 -7.92% 6.52 6.70 2.69%Sales to New Listings Ratio 60.83% 64.75% 3.92% 39.26% 39.76% 0.50%Sales to List Price Ratio 95.45% 96.00% 0.55% 96.28% 96.35% 0.07%Days on Market 71 80 12.83% 57 60 5.26%Benchmark Price $266,500 $257,700 -3.30% $274,358 $263,475 -3.97%Median Price $249,500 $250,000 0.20% $269,000 $260,000 -3.35%Average Price $302,355 $271,183 -10.31% $307,570 $292,637 -4.86%Index 184 178 -3.31% 190 182 -3.96%ATTACHEDTotal Sales 214 221 3.27% 3,865 4,182 8.20%Total Sales Volume $88,623,434 $87,711,095 -1.03% $1,552,113,956 $1,702,768,631 9.71%New Listings 240 286 19.17% 7,420 7,820 5.39%Inventory 943 1,099 16.54% 1,358 1,382 1.72%Months of Supply 4.41 4.97 12.85% 4.22 3.96 -5.99%Sales to New Listings Ratio 89.17% 77.27% -11.89% 52.09% 53.48% 1.39%Sales to List Price Ratio 96.67% 97.08% 0.42% 97.09% 97.31% 0.22%Days on Market 59 59 -0.25% 50 49 -2.00%Benchmark Price $329,400 $330,100 0.21% $332,758 $332,325 -0.13%Median Price $352,750 $329,900 -6.48% $343,500 $343,000 -0.15%Average Price $414,128 $396,883 -4.16% $401,582 $407,166 1.39%Index 195 195 0.21% 197 197 -0.13%
CITY OF CALGARYTotal Sales 929 1,006 8.29% 17,796 18,882 6.10%Total Sales Volume $459,549,032 $454,296,352 -1.14% $8,532,199,453 $9,137,204,432 7.09%New Listings 992 1,222 23.19% 32,269 34,130 5.77%Inventory 3,766 4,314 14.55% 5,557 5,734 3.17%Months of Supply 4.05 4.29 5.78% 3.75 3.64 -2.76%Sales to New Listings Ratio 93.65% 82.32% -11.33% 55.15% 55.32% 0.17%Sales to List Price Ratio 96.32% 97.07% 0.74% 96.95% 97.38% 0.44%Days on Market 56 58 3.62% 46 44 -4.35%Benchmark Price $434,100 $433,200 -0.21% $438,567 $437,808 -0.17%Median Price $425,000 $410,000 -3.53% $425,000 $430,000 1.18%Average Price $494,671 $451,587 -8.71% $479,445 $483,911 0.93%Index 200 200 -0.20% 202 202 -0.18%
For a list of definitions, see page 26.
Dec. 2017
Summary Stats City of Calgary
CREB® Monthly Statistics City of Calgary 3
Dec-16 Dec-17 Y/Y % Change 2016 2017 Y/Y %
ChangeCITY OF CALGARY SEMI-DETACHED
Total Sales 95 95 0.00% 1,720 1,823 5.99%
Total Sales Volume $48,536,823 $46,760,821 -3.66% $840,387,677 $908,434,038 8.10%
Share of Sales with Condo Title 14.74% 16.84% 2.11% 16.16% 16.73% 0.57%
New Listings 103 132 28.16% 3,017 3,131 3.78%
Inventory 367 441 20.16% 510 516 1.11%
Months of Supply 3.86 4.64 20.16% 3.56 3.40 -4.60%
Sales to New Listings Ratio 92.23% 71.97% -20.26% 57.01% 58.22% 1.21%
Sales to List Price Ratio 96.57% 97.24% 0.67% 97.09% 97.47% 0.39%
Days on Market 60 59 -2.32% 47 46 -2.13%
Benchmark Price $406,200 $416,600 2.56% $404,517 $420,600 3.98%
Median Price $405,000 $405,500 0.12% $395,000 $404,900 2.51%
Average Price $510,914 $492,219 -3.66% $488,597 $498,318 1.99%
Index 203 209 2.56% 203 211 3.97%
CITY OF CALGARY ROW
Total Sales 119 126 5.88% 2,145 2,359 9.98%
Total Sales Volume $40,086,611 $40,950,274 2.15% $711,726,279 $794,334,593 11.61%
Share of Sales with Condo Title 95.80% 94.44% -1.35% 94.21% 94.77% 0.56%
New Listings 137 154 12.41% 4,403 4,689 6.50%
Inventory 576 658 14.24% 848 866 2.09%
Months of Supply 4.84 5.22 7.89% 4.74 4.40 -7.17%
Sales to New Listings Ratio 86.86% 81.82% -5.04% 48.72% 50.31% 1.59%
Sales to List Price Ratio 96.79% 96.90% 0.12% 97.09% 97.12% 0.03%
Days on Market 58 59 1.43% 53 52 -1.89%
Benchmark Price $303,100 $299,500 -1.19% $308,658 $299,567 -2.95%
Median Price $317,900 $295,000 -7.20% $310,000 $308,000 -0.65%
Average Price $336,862 $325,002 -3.52% $331,807 $336,725 1.48%
Index 190 188 -1.16% 193 188 -2.95%
CITY OF CALGARY ATTACHED
Total Sales 214 221 3.27% 3,865 4,182 8.20%
Total Sales Volume $88,623,434 $87,711,095 -1.03% $1,552,113,956 $1,702,768,631 9.71%
Share of Sales with Condo Title 59.81% 61.09% 2.13% 59.58% 60.91% 2.22%
New Listings 240 286 19.17% 7,420 7,820 5.39%
Inventory 943 1,099 16.54% 1,358 1,382 1.72%
Months of Supply 4.41 4.97 12.85% 4.22 3.96 -5.99%
Sales to New Listings Ratio 89.17% 77.27% -11.89% 52.09% 53.48% 1.39%
Sales to List Price Ratio 96.67% 97.08% 0.42% 97.09% 97.31% 0.22%
Days on Market 59 59 -0.25% 50 49 -2.00%
Benchmark Price $329,400 $330,100 0.21% $332,758 $332,325 -0.13%
Median Price $352,750 $329,900 -6.48% $343,500 $343,000 -0.15%
Average Price $414,128 $396,883 -4.16% $401,582 $407,166 1.39%
Index 195 195 0.21% 197 197 -0.13%
For a list of definitions, see page 26.
Dec. 2017
Calgary Districts
CREB® Monthly Statistics City of Calgary 4
December 2017 SalesNew Listings
Sales to New Listings Ratio Inventory
Months of Supply Benchmark Price
Year-over-year benchmark price change
Month-over-month benchmark price change
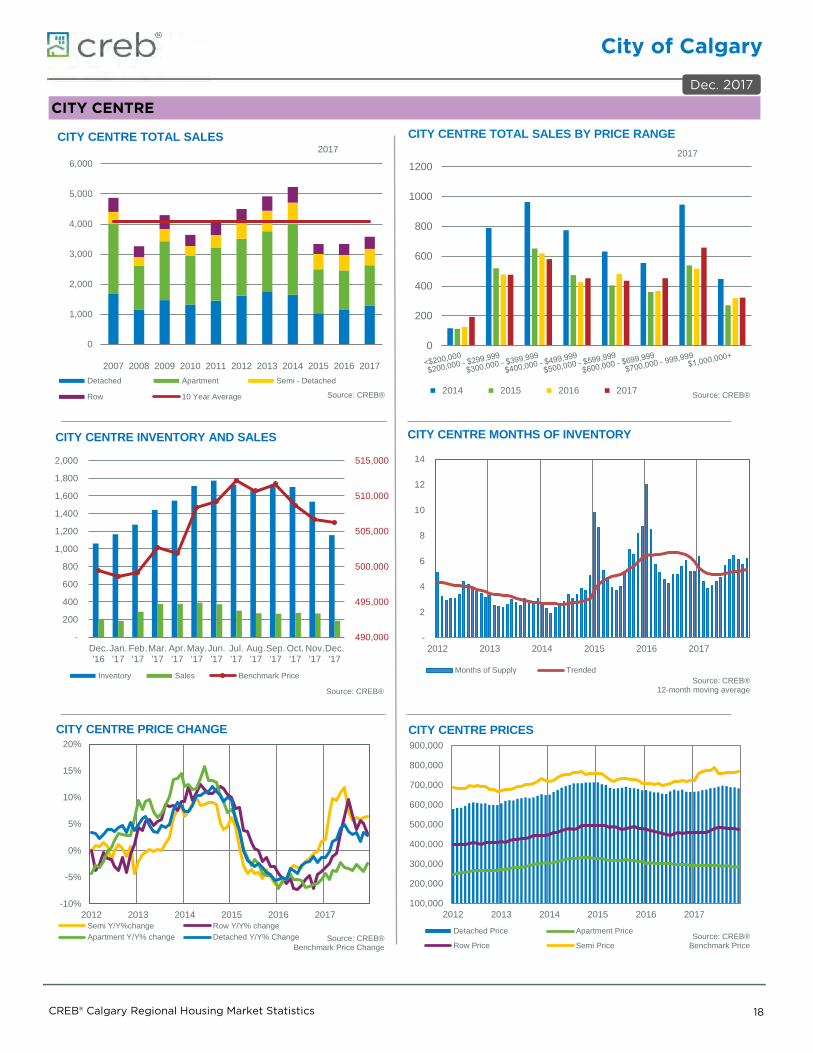
DetachedCity Centre 65 76 85.53% 278 4.28 $682,900 2.82% -0.71%North East 101 126 80.16% 311 3.08 $375,400 -2.87% -0.64%North 89 111 80.18% 322 3.62 $429,700 -1.63% -0.90%North West 91 79 115.19% 220 2.42 $541,200 0.24% -1.28%West 56 67 83.58% 201 3.59 $729,700 4.53% -1.04%South 132 114 115.79% 357 2.70 $469,100 -0.87% -1.22%South East 71 77 92.21% 279 3.93 $445,200 0.32% -0.31%East 11 25 44.00% 65 5.91 $352,800 -0.76% -0.40%
TOTAL CITY 616 675 91.26% 2,033 3.30 $499,600 0.14% -0.87%
ApartmentCity Centre 77 135 57.04% 591 7.68 $285,700 -2.46% 0.60%North East 8 15 53.33% 63 7.88 $223,600 -5.53% -2.70%North 9 17 52.94% 70 7.78 $216,600 -2.43% 2.80%North West 14 20 70.00% 101 7.21 $233,500 -4.69% -4.07%West 12 17 70.59% 99 8.25 $249,900 -0.99% 0.12%South 22 22 100.00% 139 6.32 $228,000 -4.52% 0.04%South East 23 24 95.83% 84 3.65 $232,700 -7.07% -2.14%East 4 11 36.36% 35 8.75 $187,500 -7.32% -2.24%
TOTAL CITY 169 261 64.75% 1,182 6.99 $257,700 -3.30% -0.23%
Semi-detachedCity Centre 23 44 52.27% 160 6.96 $767,800 6.36% 0.43%North East 12 17 70.59% 66 5.50 $299,400 -3.61% -0.17%North 11 7 157.14% 27 2.45 $313,800 -1.91% -1.10%North West 15 14 107.14% 39 2.60 $389,800 5.72% -0.51%West 13 16 81.25% 46 3.54 $512,700 4.08% -0.85%South 10 17 58.82% 46 4.60 $338,800 0.00% -1.37%South East 7 9 77.78% 28 4.00 $316,800 1.41% -0.72%East 4 8 50.00% 29 7.25 $297,200 -1.26% -1.13%
TOTAL CITY 95 132 71.97% 441 4.64 $416,600 2.56% -0.29%
RowCity Centre 22 20 110.00% 128 5.82 $474,100 3.20% -1.29%North East 12 32 37.50% 92 7.67 $200,700 -4.56% -3.09%North 13 23 56.52% 87 6.69 $263,500 -0.23% 0.11%North West 16 17 94.12% 62 3.88 $309,100 -1.53% -0.16%West 17 19 89.47% 75 4.41 $341,400 -0.61% -1.01%South 22 23 95.65% 108 4.91 $259,200 -4.92% -2.19%South East 18 15 120.00% 80 4.44 $292,100 -1.05% -1.32%East 7 5 140.00% 26 3.71 $187,800 2.90% 2.40%
TOTAL CITY 126 154 81.82% 658 5.22 $299,500 -1.19% -1.19%
*Total city figures can include activity from areas not yet represented by a community / district
Dec. 2017
District Trends
CREB® Monthly Statistics City of Calgary 6
0
200
400
600
800
1,000
1,200
1,400
1,600
1,800
Dec.'03
Dec.'04
Dec.'05
Dec.'06
Dec.'07
Dec.'08
Dec.'09
Dec.'10
Dec.'11
Dec.'12
Dec.'13
Dec.'14
Dec.'15
Dec.'16
Dec.'17
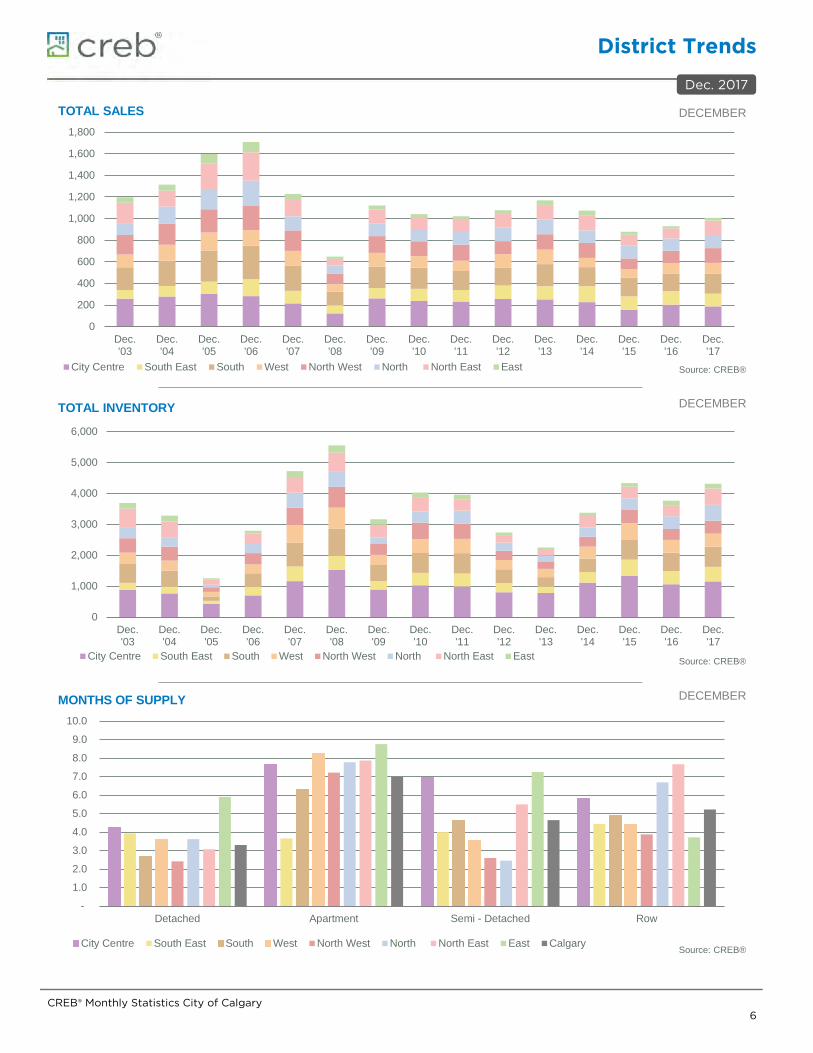
TOTAL SALES
City Centre South East South West North West North North East East Source: CREB®
DECEMBER
-
1.0
2.0
3.0
4.0
5.0
6.0
7.0
8.0
9.0
10.0
Detached Apartment Semi - Detached Row
MONTHS OF SUPPLY
City Centre South East South West North West North North East East CalgarySource: CREB®
DECEMBER
0
1,000
2,000
3,000
4,000
5,000
6,000
Dec.'03
Dec.'04
Dec.'05
Dec.'06
Dec.'07
Dec.'08
Dec.'09
Dec.'10
Dec.'11
Dec.'12
Dec.'13
Dec.'14
Dec.'15
Dec.'16
Dec.'17
TOTAL INVENTORY
City Centre South East South West North West North North East East Source: CREB®
DECEMBER
Dec. 2017
Price Comparisons
CREB® Monthly Statistics City of Calgary 5
TYPICAL HOME ATTRIBUTES - DETACHED HOMES
City Centre North East North
North West West South
South East East
City of Calgary
Gross Living Area (Above Ground) 1,233 1,170 1,338 1,501 1,703 1,365 1,468 1,091 1,341Lot Size 5,528 4,070 4,396 5,328 5,625 5,242 4,273 4,805 4,908Above Ground Bedrooms 2 3 3 3 3 3 3 3 3Year Built 1951 1985 1997 1994 1997 1983 1999 1974 1991Full Bathrooms 2 2 2 2 2 2 2 2 2Half Bathrooms 0 1 1 1 1 1 1 0 1
-
100,000
200,000
300,000
400,000
500,000
600,000
700,000
800,000
900,000
Detached Apartment Semi - Detached Row Total Residential
BENCHMARK PRICE - DECEMBER
City Centre North East North North West West South South East East CalgarySource: CREB®
-8%
-6%
-4%
-2%
0%
2%
4%
6%
8%
Detached Apartment Semi - Detached Row Total Residential
YEAR OVER YEAR PRICE GROWTH COMPARISON - DECEMBER
City Centre North East North North West West South South East East Calgary
Source: CREB®
Dec. 2017
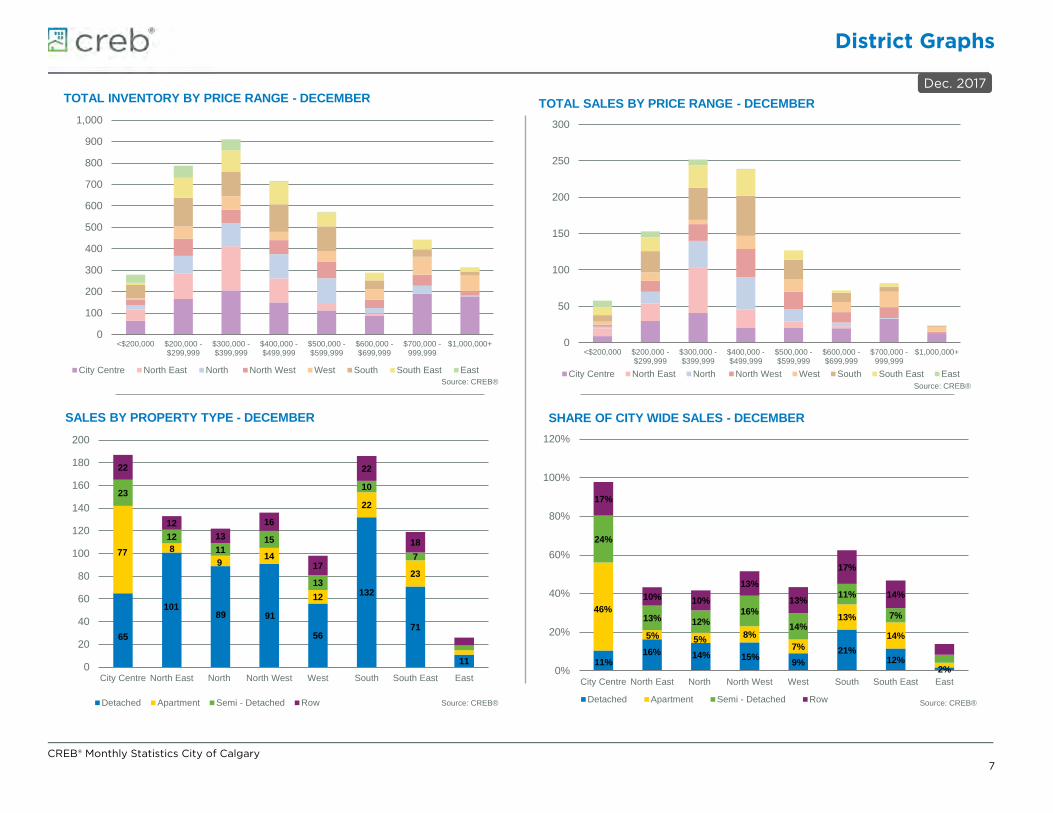
District Graphs
CREB® Monthly Statistics City of Calgary 7
0
100
200
300
400
500
600
700
800
900
1,000
<$200,000 $200,000 -$299,999
$300,000 -$399,999
$400,000 -$499,999
$500,000 -$599,999
$600,000 -$699,999
$700,000 -999,999
$1,000,000+
TOTAL INVENTORY BY PRICE RANGE - DECEMBER
City Centre North East North North West West South South East EastSource: CREB®
65
10189 91
56
132
71
11
77 89
14
12
22
23
23
1211
15
13
10
7
22
1213
16
17
22
18
0
20
40
60
80
100
120
140
160
180
200
City Centre North East North North West West South South East East
SALES BY PROPERTY TYPE - DECEMBER
Detached Apartment Semi - Detached Row Source: CREB®
11%16% 14% 15% 9%
21%12%
2%
46%
5% 5% 8%7%
13%
14%
24%
13% 12%16%
14%
11%
7%
17%
10% 10%
13%
13%
17%
14%
0%
20%
40%
60%
80%
100%
120%
City Centre North East North North West West South South East East
SHARE OF CITY WIDE SALES - DECEMBER
Detached Apartment Semi - Detached Row Source: CREB®
0
50
100
150
200
250
300
<$200,000 $200,000 -$299,999
$300,000 -$399,999
$400,000 -$499,999
$500,000 -$599,999
$600,000 -$699,999
$700,000 -999,999
$1,000,000+
TOTAL SALES BY PRICE RANGE - DECEMBER
City Centre North East North North West West South South East EastSource: CREB®
Dec. 2017
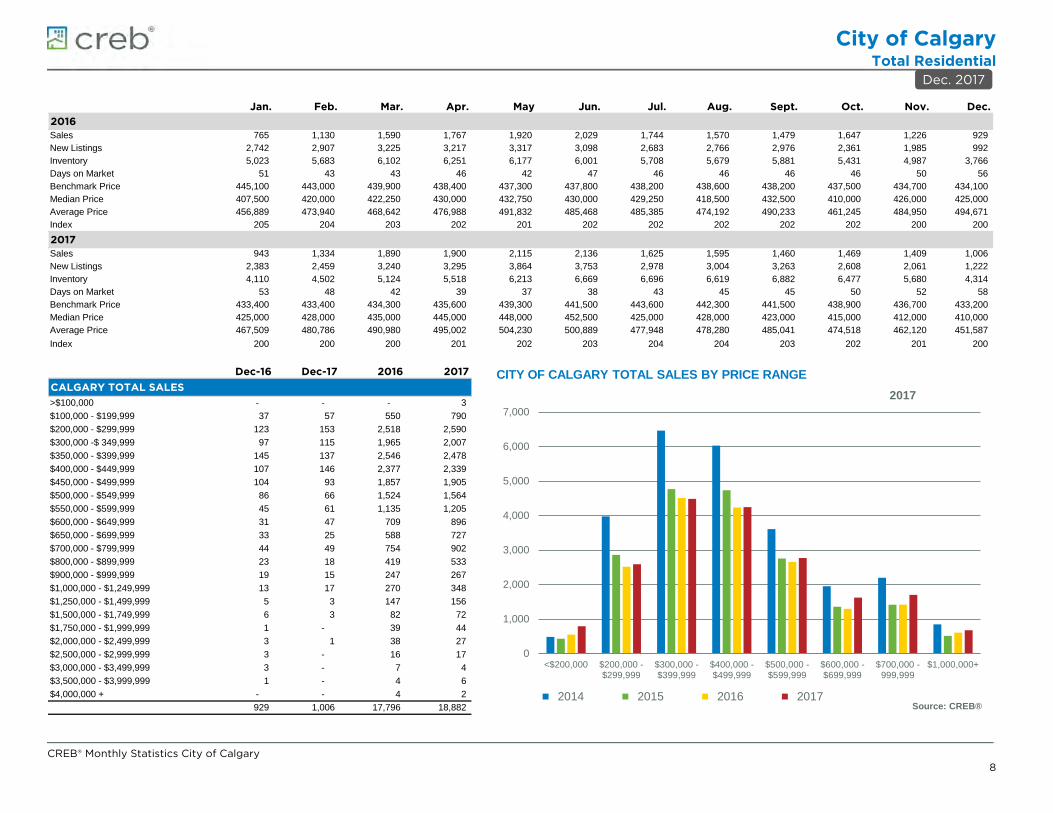
City of CalgaryTotal Residential
CREB® Monthly Statistics City of Calgary 8
Jan. Feb. Mar. Apr. May Jun. Jul. Aug. Sept. Oct. Nov. Dec.2016 01/01/16 02/01/16 03/01/16 04/01/16 05/01/16 06/01/16 07/01/16 08/01/16 09/01/16 10/01/16 11/01/16 12/01/16Sales 765 1,130 1,590 1,767 1,920 2,029 1,744 1,570 1,479 1,647 1,226 929 New Listings 2,742 2,907 3,225 3,217 3,317 3,098 2,683 2,766 2,976 2,361 1,985 992 Inventory 5,023 5,683 6,102 6,251 6,177 6,001 5,708 5,679 5,881 5,431 4,987 3,766 Days on Market 51 43 43 46 42 47 46 46 46 46 50 56 Benchmark Price 445,100 443,000 439,900 438,400 437,300 437,800 438,200 438,600 438,200 437,500 434,700 434,100 Median Price 407,500 420,000 422,250 430,000 432,750 430,000 429,250 418,500 432,500 410,000 426,000 425,000 Average Price 456,889 473,940 468,642 476,988 491,832 485,468 485,385 474,192 490,233 461,245 484,950 494,671 Index 205 204 203 202 201 202 202 202 202 202 200 200
2017 01/01/17 02/01/17 03/01/17 04/01/17 05/01/17 06/01/17 07/01/17 08/01/17 09/01/17 10/01/17 11/01/17 12/01/17Sales 943 1,334 1,890 1,900 2,115 2,136 1,625 1,595 1,460 1,469 1,409 1,006 New Listings 2,383 2,459 3,240 3,295 3,864 3,753 2,978 3,004 3,263 2,608 2,061 1,222 Inventory 4,110 4,502 5,124 5,518 6,213 6,669 6,696 6,619 6,882 6,477 5,680 4,314 Days on Market 53 48 42 39 37 38 43 45 45 50 52 58 Benchmark Price 433,400 433,400 434,300 435,600 439,300 441,500 443,600 442,300 441,500 438,900 436,700 433,200 Median Price 425,000 428,000 435,000 445,000 448,000 452,500 425,000 428,000 423,000 415,000 412,000 410,000 Average Price 467,509 480,786 490,980 495,002 504,230 500,889 477,948 478,280 485,041 474,518 462,120 451,587 Index 200 200 200 201 202 203 204 204 203 202 201 200
Dec-16 Dec-17 2016 2017CALGARY TOTAL SALES 12/01/16 12/01/17 12/01/16 12/01/17>$100,000 - - - 3 $100,000 - $199,999 37 57 550 790 $200,000 - $299,999 123 153 2,518 2,590 $300,000 -$ 349,999 97 115 1,965 2,007 $350,000 - $399,999 145 137 2,546 2,478 $400,000 - $449,999 107 146 2,377 2,339 $450,000 - $499,999 104 93 1,857 1,905 $500,000 - $549,999 86 66 1,524 1,564 $550,000 - $599,999 45 61 1,135 1,205 $600,000 - $649,999 31 47 709 896 $650,000 - $699,999 33 25 588 727 $700,000 - $799,999 44 49 754 902 $800,000 - $899,999 23 18 419 533 $900,000 - $999,999 19 15 247 267 $1,000,000 - $1,249,999 13 17 270 348 $1,250,000 - $1,499,999 5 3 147 156 $1,500,000 - $1,749,999 6 3 82 72 $1,750,000 - $1,999,999 1 - 39 44 $2,000,000 - $2,499,999 3 1 38 27 $2,500,000 - $2,999,999 3 - 16 17 $3,000,000 - $3,499,999 3 - 7 4 $3,500,000 - $3,999,999 1 - 4 6 $4,000,000 + - - 4 2
929 1,006 17,796 18,882
0
1,000
2,000
3,000
4,000
5,000
6,000
7,000
<$200,000 $200,000 -$299,999
$300,000 -$399,999
$400,000 -$499,999
$500,000 -$599,999
$600,000 -$699,999
$700,000 -999,999
$1,000,000+
2017 CITY OF CALGARY TOTAL SALES BY PRICE RANGE
2014 2015 2016 2017Source: CREB®
Dec. 2017
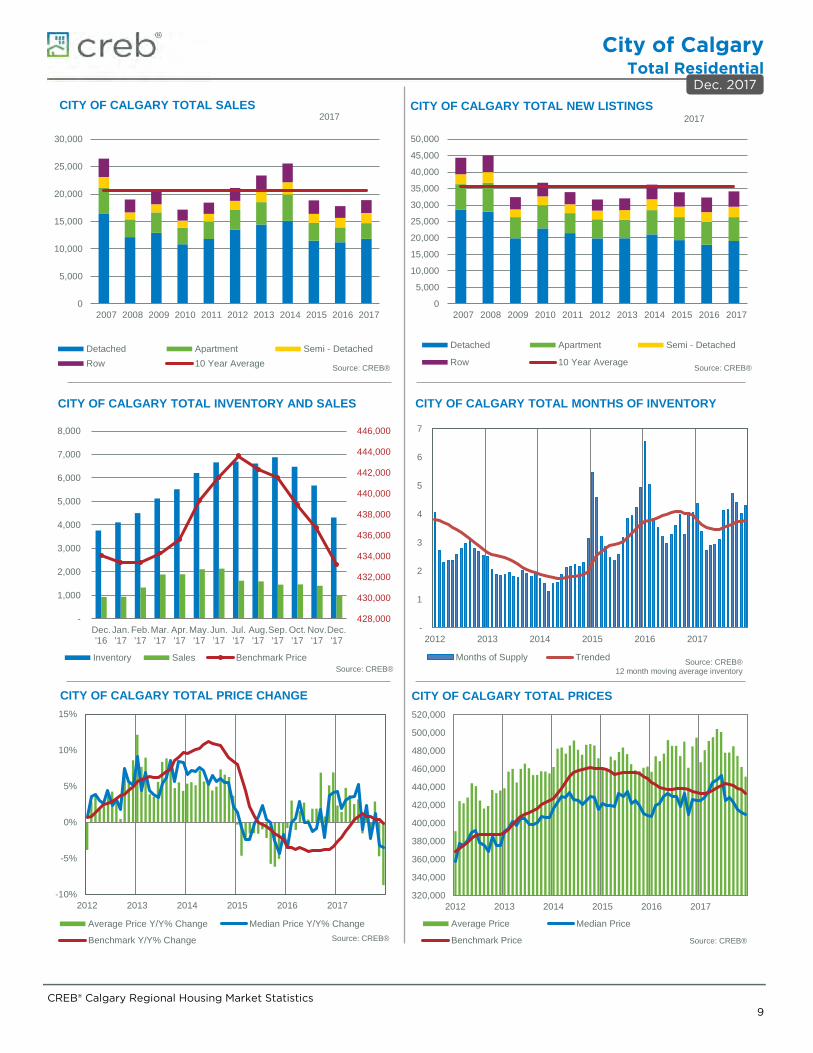
City of CalgaryTotal Residential
CREB® Calgary Regional Housing Market Statistics 9
0
5,000
10,000
15,000
20,000
25,000
30,000
2007 2008 2009 2010 2011 2012 2013 2014 2015 2016 2017
2017
Detached Apartment Semi - DetachedRow 10 Year Average Source: CREB®
CITY OF CALGARY TOTAL SALES
0
5,000
10,000
15,000
20,000
25,000
30,000
35,000
40,000
45,000
50,000
2007 2008 2009 2010 2011 2012 2013 2014 2015 2016 2017
2017
Detached Apartment Semi - Detached
Row 10 Year AverageSource: CREB®
CITY OF CALGARY TOTAL NEW LISTINGS
428,000
430,000
432,000
434,000
436,000
438,000
440,000
442,000
444,000
446,000
-
1,000
2,000
3,000
4,000
5,000
6,000
7,000
8,000
Dec.'16
Jan.'17
Feb.'17
Mar.'17
Apr.'17
May.'17
Jun.'17
Jul.'17
Aug.'17
Sep.'17
Oct.'17
Nov.'17
Dec.'17
Inventory Sales Benchmark PriceSource: CREB®
CITY OF CALGARY TOTAL INVENTORY AND SALES
-
1
2
3
4
5
6
7
2012 2013 2014 2015 2016 2017
Months of Supply Trended Source: CREB®12 month moving average inventory
CITY OF CALGARY TOTAL MONTHS OF INVENTORY
-10%
-5%
0%
5%
10%
15%
2012 2013 2014 2015 2016 2017
Average Price Y/Y% Change Median Price Y/Y% Change
Benchmark Y/Y% Change Source: CREB®
CITY OF CALGARY TOTAL PRICE CHANGE
320,000
340,000
360,000
380,000
400,000
420,000
440,000
460,000
480,000
500,000
520,000
2012 2013 2014 2015 2016 2017
Average Price Median Price
Benchmark Price Source: CREB®
CITY OF CALGARY TOTAL PRICES
Dec. 2017
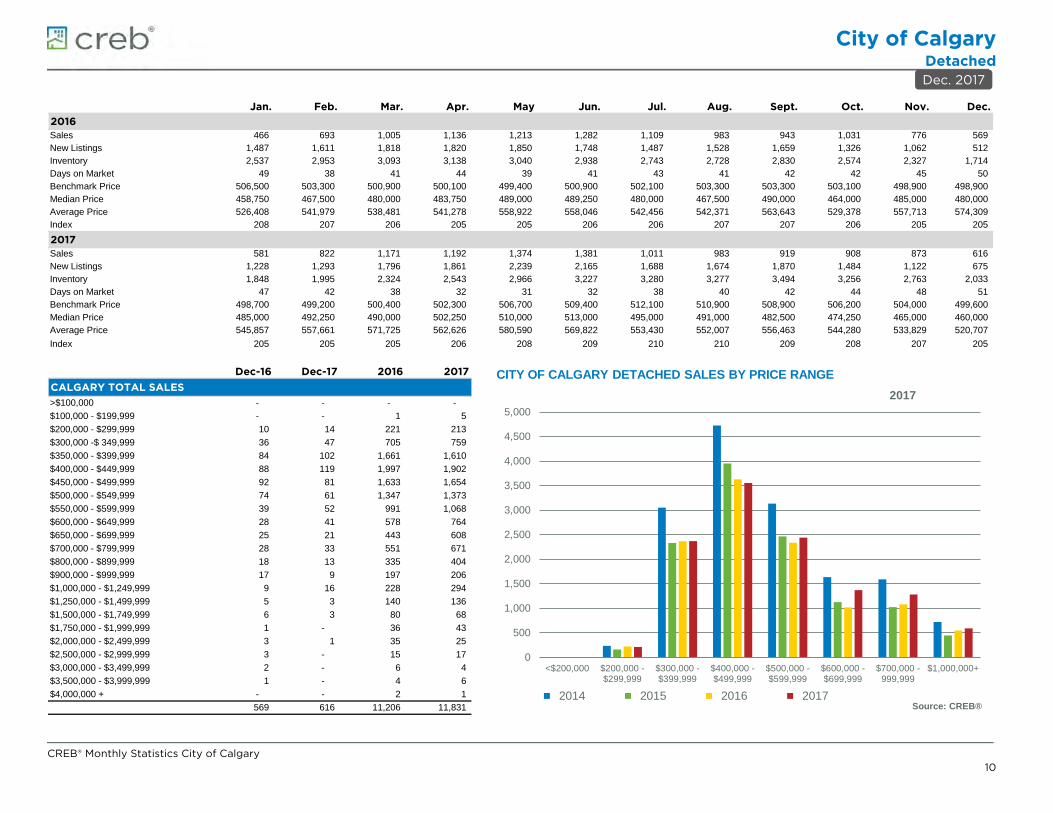
City of CalgaryDetached
CREB® Monthly Statistics City of Calgary 10
Jan. Feb. Mar. Apr. May Jun. Jul. Aug. Sept. Oct. Nov. Dec.2016 01/01/16 02/01/16 03/01/16 04/01/16 05/01/16 06/01/16 07/01/16 08/01/16 09/01/16 10/01/16 11/01/16 12/01/16Sales 466 693 1,005 1,136 1,213 1,282 1,109 983 943 1,031 776 569 New Listings 1,487 1,611 1,818 1,820 1,850 1,748 1,487 1,528 1,659 1,326 1,062 512 Inventory 2,537 2,953 3,093 3,138 3,040 2,938 2,743 2,728 2,830 2,574 2,327 1,714 Days on Market 49 38 41 44 39 41 43 41 42 42 45 50 Benchmark Price 506,500 503,300 500,900 500,100 499,400 500,900 502,100 503,300 503,300 503,100 498,900 498,900 Median Price 458,750 467,500 480,000 483,750 489,000 489,250 480,000 467,500 490,000 464,000 485,000 480,000 Average Price 526,408 541,979 538,481 541,278 558,922 558,046 542,456 542,371 563,643 529,378 557,713 574,309 Index 208 207 206 205 205 206 206 207 207 206 205 205
2017 01/01/17 02/01/17 03/01/17 04/01/17 05/01/17 06/01/17 07/01/17 08/01/17 09/01/17 10/01/17 11/01/17 12/01/17Sales 581 822 1,171 1,192 1,374 1,381 1,011 983 919 908 873 616 New Listings 1,228 1,293 1,796 1,861 2,239 2,165 1,688 1,674 1,870 1,484 1,122 675 Inventory 1,848 1,995 2,324 2,543 2,966 3,227 3,280 3,277 3,494 3,256 2,763 2,033 Days on Market 47 42 38 32 31 32 38 40 42 44 48 51 Benchmark Price 498,700 499,200 500,400 502,300 506,700 509,400 512,100 510,900 508,900 506,200 504,000 499,600 Median Price 485,000 492,250 490,000 502,250 510,000 513,000 495,000 491,000 482,500 474,250 465,000 460,000 Average Price 545,857 557,661 571,725 562,626 580,590 569,822 553,430 552,007 556,463 544,280 533,829 520,707 Index 205 205 205 206 208 209 210 210 209 208 207 205
Dec-16 Dec-17 2016 2017CALGARY TOTAL SALES 12/01/16 12/01/17 12/01/16 12/01/17>$100,000 - - - - $100,000 - $199,999 - - 1 5 $200,000 - $299,999 10 14 221 213 $300,000 -$ 349,999 36 47 705 759 $350,000 - $399,999 84 102 1,661 1,610 $400,000 - $449,999 88 119 1,997 1,902 $450,000 - $499,999 92 81 1,633 1,654 $500,000 - $549,999 74 61 1,347 1,373 $550,000 - $599,999 39 52 991 1,068 $600,000 - $649,999 28 41 578 764 $650,000 - $699,999 25 21 443 608 $700,000 - $799,999 28 33 551 671 $800,000 - $899,999 18 13 335 404 $900,000 - $999,999 17 9 197 206 $1,000,000 - $1,249,999 9 16 228 294 $1,250,000 - $1,499,999 5 3 140 136 $1,500,000 - $1,749,999 6 3 80 68 $1,750,000 - $1,999,999 1 - 36 43 $2,000,000 - $2,499,999 3 1 35 25 $2,500,000 - $2,999,999 3 - 15 17 $3,000,000 - $3,499,999 2 - 6 4 $3,500,000 - $3,999,999 1 - 4 6 $4,000,000 + - - 2 1
569 616 11,206 11,831
0
500
1,000
1,500
2,000
2,500
3,000
3,500
4,000
4,500
5,000
<$200,000 $200,000 -$299,999
$300,000 -$399,999
$400,000 -$499,999
$500,000 -$599,999
$600,000 -$699,999
$700,000 -999,999
$1,000,000+
2017 CITY OF CALGARY DETACHED SALES BY PRICE RANGE
2014 2015 2016 2017Source: CREB®
Dec. 2017
City of CalgaryDetached
CREB® Calgary Regional Housing Market Statistics 11
0
2,000
4,000
6,000
8,000
10,000
12,000
14,000
16,000
18,000
2007 2008 2009 2010 2011 2012 2013 2014 2015 2016 2017
2017
Detached 10 Year AverageSource: CREB®
CITY OF CALGARY DETACHED SALES
0
5,000
10,000
15,000
20,000
25,000
30,000
2007 2008 2009 2010 2011 2012 2013 2014 2015 2016 2017
2017
Detached 10 Year AverageSource: CREB®
CITY OF CALGARY DETACHED NEW LISTINGS
490,000
495,000
500,000
505,000
510,000
515,000
-
500
1,000
1,500
2,000
2,500
3,000
3,500
4,000
Dec.'16
Jan.'17
Feb.'17
Mar.'17
Apr.'17
May.'17
Jun.'17
Jul.'17
Aug.'17
Sep.'17
Oct.'17
Nov.'17
Dec.'17
Inventory Sales Benchmark PriceSource: CREB®
CITY OF CALGARY DETACHED INVENTORY AND SALES
-
1
2
3
4
5
6
2012 2013 2014 2015 2016 2017
Months of Supply Trended Source: CREB®12 month moving average inventory
CITY OF CALGARY DETACHED MONTHS OF INVENTORY
-15%
-10%
-5%
0%
5%
10%
15%
2012 2013 2014 2015 2016 2017
Average Price Y/Y% Change Median Price Y/Y% Change
Benchmark Y/Y% Change Source: CREB®
CITY OF CALGARY DETACHED PRICE CHANGE
320,000
370,000
420,000
470,000
520,000
570,000
620,000
2012 2013 2014 2015 2016 2017
Average Price Median Price
Benchmark Price Source: CREB®
CITY OF CALGARY DETACHED PRICES
Dec. 2017
City of CalgaryApartment
CREB® Monthly Statistics City of Calgary 12
Jan. Feb. Mar. Apr. May Jun. Jul. Aug. Sept. Oct. Nov. Dec.2016 01/01/16 02/01/16 03/01/16 04/01/16 05/01/16 06/01/16 07/01/16 08/01/16 09/01/16 10/01/16 11/01/16 12/01/16Sales 129 168 257 272 276 310 255 267 200 250 195 146 New Listings 598 636 679 666 685 604 618 616 636 508 455 240 Inventory 1,252 1,389 1,529 1,583 1,610 1,544 1,557 1,577 1,651 1,542 1,432 1,109 Days on Market 59 50 48 54 49 71 56 60 56 54 58 71 Benchmark Price 280,800 282,500 279,100 276,800 275,000 275,500 274,000 271,700 271,300 270,400 268,700 266,500 Median Price 251,000 268,000 272,000 278,250 280,000 267,500 269,900 271,500 280,000 250,000 255,000 249,500 Average Price 280,088 307,461 298,072 302,417 312,753 309,631 351,545 316,842 303,202 288,396 297,710 302,355 Index 194 196 193 192 190 191 190 188 188 187 186 184
2017 01/01/17 02/01/17 03/01/17 04/01/17 05/01/17 06/01/17 07/01/17 08/01/17 09/01/17 10/01/17 11/01/17 12/01/17Sales 151 235 297 283 282 284 254 248 209 234 223 169 New Listings 624 583 726 691 768 729 614 644 628 501 446 261 Inventory 1,267 1,391 1,579 1,654 1,782 1,872 1,814 1,768 1,774 1,640 1,495 1,182 Days on Market 68 66 56 49 55 55 59 60 56 67 65 80 Benchmark Price 265,000 264,300 264,900 264,300 266,600 265,800 266,200 263,300 263,700 261,600 258,300 257,700 Median Price 258,500 275,000 251,500 267,000 270,000 274,000 257,750 255,000 247,500 256,000 250,000 250,000 Average Price 282,429 314,498 280,130 303,361 296,999 323,341 286,643 285,254 283,796 290,016 277,274 271,183 Index 183 183 183 183 185 184 184 182 183 181 179 178
Dec-16 Dec-17 2016 2017CALGARY TOTAL SALES 12/01/16 12/01/17 12/01/16 12/01/17>$100,000 - - - 2 $100,000 - $199,999 33 42 426 588 $200,000 - $299,999 58 73 1,248 1,223 $300,000 -$ 349,999 19 24 405 411 $350,000 - $399,999 21 14 272 267 $400,000 - $449,999 5 8 120 136 $450,000 - $499,999 3 3 80 81 $500,000 - $549,999 2 2 56 54 $550,000 - $599,999 - - 37 23 $600,000 - $649,999 1 1 23 26 $650,000 - $699,999 1 - 18 15 $700,000 - $799,999 2 1 10 15 $800,000 - $899,999 - 1 5 8 $900,000 - $999,999 - - 6 8 $1,000,000 - $1,249,999 - - 5 4 $1,250,000 - $1,499,999 - - 5 3 $1,500,000 - $1,749,999 - - - 1 $1,750,000 - $1,999,999 - - 2 1 $2,000,000 - $2,499,999 - - 3 2 $2,500,000 - $2,999,999 - - 1 - $3,000,000 - $3,499,999 1 - 1 - $3,500,000 - $3,999,999 - - - - $4,000,000 + - - 2 1
146 169 2,725 2,869
0
500
1,000
1,500
2,000
2,500
<$200,000 $200,000 -$299,999
$300,000 -$399,999
$400,000 -$499,999
$500,000 -$599,999
$600,000 -$699,999
$700,000 -999,999
$1,000,000+
2017 CITY OF CALGARY APARTMENT SALES BY PRICE RANGE
2014 2015 2016 2017Source: CREB®
Dec. 2017
City of CalgaryApartment
CREB® Calgary Regional Housing Market Statistics 13
0
1,000
2,000
3,000
4,000
5,000
6,000
2007 2008 2009 2010 2011 2012 2013 2014 2015 2016 2017
2017
Apartment 10 Year AverageSource: CREB®
CITY OF CALGARY APARTMENT SALES
0
1,000
2,000
3,000
4,000
5,000
6,000
7,000
8,000
9,000
10,000
2007 2008 2009 2010 2011 2012 2013 2014 2015 2016 2017
2017
Apartment 10 Year AverageSource: CREB®
CITY OF CALGARY APARTMENT NEW LISTINGS
252,000
254,000
256,000
258,000
260,000
262,000
264,000
266,000
268,000
-
200
400
600
800
1,000
1,200
1,400
1,600
1,800
2,000
Dec.'16
Jan.'17
Feb.'17
Mar.'17
Apr.'17
May.'17
Jun.'17
Jul.'17
Aug.'17
Sep.'17
Oct.'17
Nov.'17
Dec.'17
Inventory Sales Benchmark PriceSource: CREB®
CITY OF CALGARY APARTMENT INVENTORY AND SALES
-
2
4
6
8
10
12
2012 2013 2014 2015 2016 2017
Months of Supply Trended Source: CREB®12 month moving average inventory
CITY OF CALGARY APARTMENT MONTHS OF INVENTORY
-25%
-20%
-15%
-10%
-5%
0%
5%
10%
15%
20%
25%
2012 2013 2014 2015 2016 2017
Average Price Y/Y% Change Median Price Y/Y% Change
Benchmark Y/Y% Change Source: CREB®
CITY OF CALGARY APARTMENT PRICE CHANGE
200,000
220,000
240,000
260,000
280,000
300,000
320,000
340,000
360,000
2012 2013 2014 2015 2016 2017
Average Price Median Price
Benchmark Price Source: CREB®
CITY OF CALGARY APARTMENT PRICES
Dec. 2017
City of CalgarySemi-Detached
CREB® Monthly Statistics City of Calgary 14
Jan. Feb. Mar. Apr. May Jun. Jul. Aug. Sept. Oct. Nov. Dec.2016 01/01/16 02/01/16 03/01/16 04/01/16 05/01/16 06/01/16 07/01/16 08/01/16 09/01/16 10/01/16 11/01/16 12/01/16Sales 71 110 144 174 190 185 180 138 155 166 112 95 New Listings 268 283 289 306 296 290 261 237 268 223 193 103 Inventory 501 552 579 586 544 532 520 502 508 478 455 367 Days on Market 44 47 37 50 41 46 45 47 50 41 60 60 Benchmark Price 408,200 404,800 402,000 401,200 400,600 403,600 404,200 406,000 406,200 406,600 404,600 406,200 Median Price 377,000 403,500 390,000 410,000 429,000 393,000 386,808 391,000 405,000 375,000 427,500 405,000 Average Price 478,679 492,823 465,481 490,701 506,419 490,257 497,568 482,981 476,760 469,476 502,513 510,914 Index 204 203 201 201 201 202 202 203 203 204 203 203
2017 01/01/17 02/01/17 03/01/17 04/01/17 05/01/17 06/01/17 07/01/17 08/01/17 09/01/17 10/01/17 11/01/17 12/01/17Sales 83 126 199 204 188 191 147 177 144 143 126 95 New Listings 199 236 301 269 332 341 279 280 320 248 194 132 Inventory 376 436 454 455 517 560 589 583 616 611 554 441 Days on Market 61 53 40 46 42 40 44 42 44 52 54 59 Benchmark Price 406,800 418,600 423,400 425,200 427,900 432,100 420,800 419,600 419,400 419,000 417,800 416,600 Median Price 375,000 386,858 396,000 436,750 405,250 400,000 395,000 396,000 423,000 390,000 396,000 405,500 Average Price 482,059 477,825 494,291 522,403 495,805 513,114 501,732 477,421 505,210 490,552 509,115 492,219 Index 204 210 212 213 214 216 211 210 210 210 209 209
Dec-16 Dec-17 2016 2017CALGARY TOTAL SALES 12/01/16 12/01/17 12/01/16 12/01/17>$100,000 - - - - $100,000 - $199,999 - 1 11 21 $200,000 - $299,999 11 13 246 257 $300,000 -$ 349,999 16 19 289 284 $350,000 - $399,999 19 12 329 330 $400,000 - $449,999 6 11 123 172 $450,000 - $499,999 2 4 78 71 $500,000 - $549,999 7 2 52 64 $550,000 - $599,999 3 5 58 64 $600,000 - $649,999 1 3 84 64 $650,000 - $699,999 6 2 115 83 $700,000 - $799,999 14 14 180 198 $800,000 - $899,999 4 4 75 117 $900,000 - $999,999 2 4 42 47 $1,000,000 - $1,249,999 4 1 36 42 $1,250,000 - $1,499,999 - - 2 8 $1,500,000 - $1,749,999 - - - 1 $1,750,000 - $1,999,999 - - - - $2,000,000 - $2,499,999 - - - - $2,500,000 - $2,999,999 - - - - $3,000,000 - $3,499,999 - - - - $3,500,000 - $3,999,999 - - - - $4,000,000 + - - - -
95 95 1,720 1,823
0
100
200
300
400
500
600
700
800
<$200,000 $200,000 -$299,999
$300,000 -$399,999
$400,000 -$499,999
$500,000 -$599,999
$600,000 -$699,999
$700,000 -999,999
$1,000,000+
2017 CITY OF CALGARY SEMI-DETACHED SALES BY PRICE RANGE
2014 2015 2016 2017Source: CREB®
Dec. 2017
City of CalgarySemi-Detached
CREB® Calgary Regional Housing Market Statistics 15
0
500
1,000
1,500
2,000
2,500
2007 2008 2009 2010 2011 2012 2013 2014 2015 2016 2017
2017
Semi - Detached 10 Year AverageSource: CREB®
CITY OF CALGARY SEMI-DET. SALES
0
500
1,000
1,500
2,000
2,500
3,000
3,500
2007 2008 2009 2010 2011 2012 2013 2014 2015 2016 2017
2017
Semi - Detached 10 Year AverageSource: CREB®
CITY OF CALGARY SEMI-DET. NEW LISTINGS
390,000
395,000
400,000
405,000
410,000
415,000
420,000
425,000
430,000
435,000
-
100
200
300
400
500
600
700
Dec.'16
Jan.'17
Feb.'17
Mar.'17
Apr.'17
May.'17
Jun.'17
Jul.'17
Aug.'17
Sep.'17
Oct.'17
Nov.'17
Dec.'17
Inventory Sales Benchmark PriceSource: CREB®
CITY OF CALGARY SEMI-DET. INVENTORY AND SALES
-
1
2
3
4
5
6
7
8
2012 2013 2014 2015 2016 2017
Months of Supply Trended Source: CREB®12 month moving average inventory
CITY OF CALGARY SEMI-DET. MONTHS OF INVENTORY
-30%
-20%
-10%
0%
10%
20%
30%
40%
50%
2012 2013 2014 2015 2016 2017
Average Price Y/Y% Change Median Price Y/Y% Change
Benchmark Y/Y% Change Source: CREB®
CITY OF CALGARY SEMI-DET. PRICE CHANGE
250,000
300,000
350,000
400,000
450,000
500,000
550,000
600,000
650,000
2012 2013 2014 2015 2016 2017
Average Price Median Price
Benchmark Price Source: CREB®
CITY OF CALGARY SEMI-DET. PRICES
Dec. 2017
City of CalgaryRow
CREB® Monthly Statistics City of Calgary 16
Jan. Feb. Mar. Apr. May Jun. Jul. Aug. Sept. Oct. Nov. Dec.2016 01/01/16 02/01/16 03/01/16 04/01/16 05/01/16 06/01/16 07/01/16 08/01/16 09/01/16 10/01/16 11/01/16 12/01/16Sales 99 159 184 185 241 252 200 182 181 200 143 119 New Listings 389 377 439 425 486 456 317 385 413 304 275 137 Inventory 733 789 901 944 983 987 888 872 892 837 773 576 Days on Market 51 52 49 47 50 51 55 55 52 56 58 58 Benchmark Price 319,800 316,800 313,400 310,900 310,100 306,400 305,800 305,900 305,300 303,500 302,900 303,100 Median Price 315,000 315,000 309,200 310,000 321,500 310,000 303,250 310,000 310,000 300,000 310,000 317,900 Average Price 344,407 340,232 327,900 325,976 347,743 329,034 328,610 330,122 325,974 319,252 331,669 336,862 Index 200 199 196 195 194 192 192 192 191 190 190 190
2017 01/01/17 02/01/17 03/01/17 04/01/17 05/01/17 06/01/17 07/01/17 08/01/17 09/01/17 10/01/17 11/01/17 12/01/17Sales 128 151 223 221 271 280 213 187 188 184 187 126 New Listings 332 347 417 474 525 518 397 406 445 375 299 154 Inventory 619 680 767 866 948 1,010 1,013 991 998 970 868 658 Days on Market 62 48 51 57 45 47 49 56 52 53 55 59 Benchmark Price 302,600 291,600 292,400 293,600 292,400 294,000 306,700 307,000 306,900 305,000 303,100 299,500 Median Price 303,500 311,000 303,000 309,000 310,000 310,000 307,000 305,500 319,000 312,000 290,000 295,000 Average Price 320,783 323,565 344,844 350,371 338,564 332,645 331,390 347,520 344,187 352,439 316,117 325,002 Index 190 183 183 184 183 184 192 192 192 191 190 188
Dec-16 Dec-17 2016 2017CALGARY TOTAL SALES 12/01/16 12/01/17 12/01/16 12/01/17>$100,000 - - - 1 $100,000 - $199,999 4 14 112 176 $200,000 - $299,999 44 53 803 897 $300,000 -$ 349,999 26 25 566 553 $350,000 - $399,999 21 9 284 271 $400,000 - $449,999 8 8 137 129 $450,000 - $499,999 7 5 66 99 $500,000 - $549,999 3 1 69 73 $550,000 - $599,999 3 4 49 50 $600,000 - $649,999 1 2 24 42 $650,000 - $699,999 1 2 12 21 $700,000 - $799,999 - 1 13 18 $800,000 - $899,999 1 - 4 4 $900,000 - $999,999 - 2 2 6 $1,000,000 - $1,249,999 - - 1 8 $1,250,000 - $1,499,999 - - - 9 $1,500,000 - $1,749,999 - - 2 2 $1,750,000 - $1,999,999 - - 1 - $2,000,000 - $2,499,999 - - - - $2,500,000 - $2,999,999 - - - - $3,000,000 - $3,499,999 - - - - $3,500,000 - $3,999,999 - - - - $4,000,000 + - - - -
119 126 2,145 2,359
0
200
400
600
800
1,000
1,200
1,400
1,600
<$200,000 $200,000 -$299,999
$300,000 -$399,999
$400,000 -$499,999
$500,000 -$599,999
$600,000 -$699,999
$700,000 -999,999
$1,000,000+
2017 CITY OF CALGARY ROW SALES BY PRICE RANGE
2014 2015 2016 2017Source: CREB®
Dec. 2017
City of CalgaryRow
CREB® Calgary Regional Housing Market Statistics 17
0
500
1,000
1,500
2,000
2,500
3,000
3,500
4,000
2007 2008 2009 2010 2011 2012 2013 2014 2015 2016 2017
2017
Row 10 Year AverageSource: CREB®
CITY OF CALGARY ROW SALES
0
1,000
2,000
3,000
4,000
5,000
6,000
2007 2008 2009 2010 2011 2012 2013 2014 2015 2016 2017
2017
Row 10 Year AverageSource: CREB®
CITY OF CALGARY ROW NEW LISTINGS
280,000
285,000
290,000
295,000
300,000
305,000
310,000
-
200
400
600
800
1,000
1,200
Dec.'16
Jan.'17
Feb.'17
Mar.'17
Apr.'17
May.'17
Jun.'17
Jul.'17
Aug.'17
Sep.'17
Oct.'17
Nov.'17
Dec.'17
Inventory Sales Benchmark PriceSource: CREB®
CITY OF CALGARY ROW INVENTORY AND SALES
-
1
2
3
4
5
6
7
8
2012 2013 2014 2015 2016 2017
Months of Supply Trended Source: CREB®12 month moving average inventory
CITY OF CALGARY ROW MONTHS OF INVENTORY
-10%
-5%
0%
5%
10%
15%
20%
25%
2012 2013 2014 2015 2016 2017
Average Price Y/Y% Change Median Price Y/Y% Change
Benchmark Y/Y% Change Source: CREB®
CITY OF CALGARY ROW PRICE CHANGE
200,000
220,000
240,000
260,000
280,000
300,000
320,000
340,000
360,000
380,000
400,000
2012 2013 2014 2015 2016 2017
Average Price Median Price
Benchmark Price Source: CREB®
CITY OF CALGARY ROW PRICES
Dec. 2017
City of Calgary
CREB® Calgary Regional Housing Market Statistics 18
CITY CENTRE CITY CENT CITY CENT CITY CENT CITY CENT CITY CENT CITY CENTRE PRICES
0
1,000
2,000
3,000
4,000
5,000
6,000
2007 2008 2009 2010 2011 2012 2013 2014 2015 2016 2017
2017 CITY CENTRE TOTAL SALES
Detached Apartment Semi - Detached
Row 10 Year Average Source: CREB®
490,000
495,000
500,000
505,000
510,000
515,000
-
200
400
600
800
1,000
1,200
1,400
1,600
1,800
2,000
Dec.'16
Jan.'17
Feb.'17
Mar.'17
Apr.'17
May.'17
Jun.'17
Jul.'17
Aug.'17
Sep.'17
Oct.'17
Nov.'17
Dec.'17
CITY CENTRE INVENTORY AND SALES
Inventory Sales Benchmark Price
Source: CREB®
-
2
4
6
8
10
12
14
2012 2013 2014 2015 2016 2017
CITY CENTRE MONTHS OF INVENTORY
Months of Supply TrendedSource: CREB®
12-month moving average
-10%
-5%
0%
5%
10%
15%
20%
2012 2013 2014 2015 2016 2017
CITY CENTRE PRICE CHANGE
Semi Y/Y%change Row Y/Y% changeApartment Y/Y% change Detached Y/Y% Change Source: CREB®
Benchmark Price Change
100,000
200,000
300,000
400,000
500,000
600,000
700,000
800,000
900,000
2012 2013 2014 2015 2016 2017
CITY CENTRE PRICES
Detached Price Apartment Price
Row Price Semi PriceSource: CREB®
Benchmark Price
0
200
400
600
800
1000
12002017
CITY CENTRE TOTAL SALES BY PRICE RANGE
2014 2015 2016 2017 Source: CREB®
Dec. 2017
City of Calgary
CREB® Calgary Regional Housing Market Statistics 19
NORTHEAST NORTHEA NORTHEA NORTHEA NORTHEA NORTHEA NORTHEAST PRICES
0
500
1,000
1,500
2,000
2,500
3,000
3,500
4,000
2007 2008 2009 2010 2011 2012 2013 2014 2015 2016 2017
2017 NORTHEAST TOTAL SALES
Detached Apartment Semi - Detached
Row 10 Year Average Source: CREB®
338,000
340,000
342,000
344,000
346,000
348,000
350,000
352,000
354,000
356,000
358,000
360,000
-
100
200
300
400
500
600
700
800
900
Dec.'16
Jan.'17
Feb.'17
Mar.'17
Apr.'17
May.'17
Jun.'17
Jul.'17
Aug.'17
Sep.'17
Oct.'17
Nov.'17
Dec.'17
NORTHEAST INVENTORY AND SALES
Inventory Sales Benchmark Price
Source: CREB®
-
1
2
3
4
5
6
2012 2013 2014 2015 2016 2017
NORTHEAST MONTHS OF INVENTORY
Months of Supply TrendedSource: CREB®
12-month moving average
-15%
-10%
-5%
0%
5%
10%
15%
20%
25%
30%
2012 2013 2014 2015 2016 2017
NORTHEAST PRICE CHANGE
Semi Y/Y%change Row Y/Y% changeApartment Y/Y% change Detached Y/Y% Change Source: CREB®
Benchmark Price Change
100,000
150,000
200,000
250,000
300,000
350,000
400,000
450,000
2012 2013 2014 2015 2016 2017
NORTHEAST PRICES
Detached Price Apartment Price
Row Price Semi PriceSource: CREB®
Benchmark Price
0
200
400
600
800
1000
1200
1400
16002017
NORTHEAST TOTAL SALES BY PRICE RANGE
2014 2015 2016 2017Source: CREB®
Dec. 2017
City of Calgary
CREB® Calgary Regional Housing Market Statistics 20
NORTH NORTH TO NORTH TO NORTH IN NORTH M NORTH P NORTH PRICES
0
500
1,000
1,500
2,000
2,500
3,000
3,500
2007 2008 2009 2010 2011 2012 2013 2014 2015 2016 2017
2017 NORTH TOTAL SALES
Detached Apartment Semi - Detached
Row 10 Year Average Source: CREB®
380,000
385,000
390,000
395,000
400,000
405,000
-
100
200
300
400
500
600
700
800
900
Dec.'16
Jan.'17
Feb.'17
Mar.'17
Apr.'17
May.'17
Jun.'17
Jul.'17
Aug.'17
Sep.'17
Oct.'17
Nov.'17
Dec.'17
NORTH INVENTORY AND SALES
Inventory Sales Benchmark Price
Source: CREB®
-
1
2
3
4
5
6
2012 2013 2014 2015 2016 2017
NORTH MONTHS OF INVENTORY
Months of Supply TrendedSource: CREB®
12-month moving average
-15%
-10%
-5%
0%
5%
10%
15%
2012 2013 2014 2015 2016 2017
NORTH PRICE CHANGE
Semi Y/Y%change Row Y/Y% changeApartment Y/Y% change Detached Y/Y% Change Source: CREB®
Benchmark Price Change
100,000
150,000
200,000
250,000
300,000
350,000
400,000
450,000
500,000
2012 2013 2014 2015 2016 2017
NORTH PRICES
Detached Price Apartment Price
Row Price Semi PriceSource: CREB®
Benchmark Price
0
200
400
600
800
1000
12002017
NORTH TOTAL SALES BY PRICE RANGE
2014 2015 2016 2017Source: CREB®
Dec. 2017
City of Calgary
CREB® Calgary Regional Housing Market Statistics 21
NORTHWEST NORTHW NORTHW NORTHW NORTHW NORTHW NORTHWEST PRICES
0
500
1,000
1,500
2,000
2,500
3,000
3,500
4,000
2007 2008 2009 2010 2011 2012 2013 2014 2015 2016 2017
2017 NORTHWEST TOTAL SALES
Detached Apartment Semi - Detached
Row 10 Year Average Source: CREB®
455,000
460,000
465,000
470,000
475,000
480,000
485,000
490,000
-
100
200
300
400
500
600
700
800
Dec.'16
Jan.'17
Feb.'17
Mar.'17
Apr.'17
May.'17
Jun.'17
Jul.'17
Aug.'17
Sep.'17
Oct.'17
Nov.'17
Dec.'17
NORTHWEST INVENTORY AND SALES
Inventory Sales Benchmark Price
Source: CREB®
-
1
2
3
4
5
6
7
2012 2013 2014 2015 2016 2017
NORTHWEST MONTHS OF INVENTORY
Months of Supply TrendedSource: CREB®
12-month moving average
-10%
-5%
0%
5%
10%
15%
20%
2012 2013 2014 2015 2016 2017
NORTHWEST PRICE CHANGE
Semi Y/Y%change Row Y/Y% changeApartment Y/Y% change Detached Y/Y% Change Source: CREB®
Benchmark Price Change
100,000
200,000
300,000
400,000
500,000
600,000
700,000
2012 2013 2014 2015 2016 2017
NORTHWEST PRICES
Detached Price Apartment Price
Row Price Semi PriceSource: CREB®
Benchmark Price
0
100
200
300
400
500
600
700
800
9002017
NORTHWEST TOTAL SALES BY PRICE RANGE
2014 2015 2016 2017Source: CREB®
Dec. 2017
City of Calgary
CREB® Calgary Regional Housing Market Statistics 22
WEST WEST TOT WEST TOT WEST INV WEST MO WEST PRI WEST PRICES
0
500
1,000
1,500
2,000
2,500
3,000
2007 2008 2009 2010 2011 2012 2013 2014 2015 2016 2017
2017 WEST TOTAL SALES
Detached Apartment Semi - Detached
Row 10 Year Average Source: CREB®
525,000
530,000
535,000
540,000
545,000
550,000
555,000
560,000
565,000
570,000
575,000
-
100
200
300
400
500
600
700
800
Dec.'16
Jan.'17
Feb.'17
Mar.'17
Apr.'17
May.'17
Jun.'17
Jul.'17
Aug.'17
Sep.'17
Oct.'17
Nov.'17
Dec.'17
WEST INVENTORY AND SALES
Inventory Sales Benchmark Price
Source: CREB®
-
1
2
3
4
5
6
7
8
9
10
2012 2013 2014 2015 2016 2017
WEST MONTHS OF INVENTORY
Months of Supply TrendedSource: CREB®
12-month moving average
-15%
-10%
-5%
0%
5%
10%
15%
2012 2013 2014 2015 2016 2017
WEST PRICE CHANGE
Semi Y/Y%change Row Y/Y% changeApartment Y/Y% change Detached Y/Y% Change Source: CREB®
Benchmark Price Change
100,000
200,000
300,000
400,000
500,000
600,000
700,000
800,000
2012 2013 2014 2015 2016 2017
WEST PRICES
Detached Price Apartment Price
Row Price Semi PriceSource: CREB®
Benchmark Price
0
100
200
300
400
500
6002017
WEST TOTAL SALES BY PRICE RANGE
2014 2015 2016 2017Source: CREB®
Dec. 2017
City of Calgary
CREB® Calgary Regional Housing Market Statistics 23
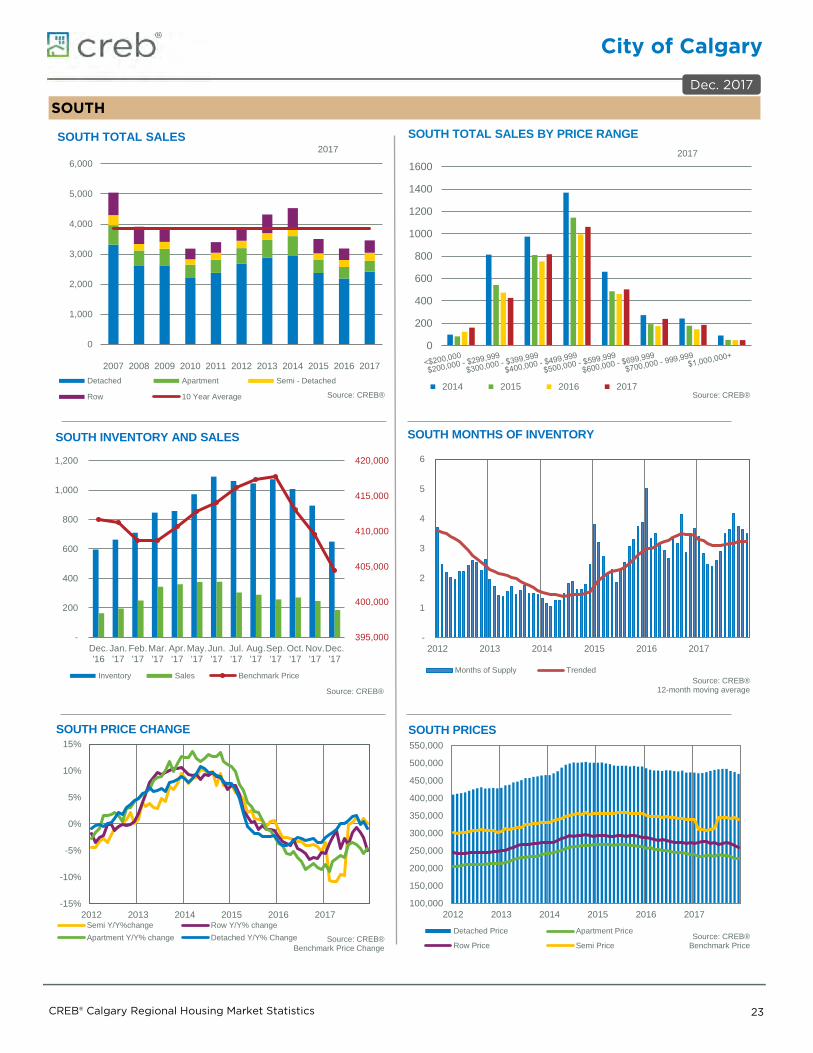
SOUTH SOUTH TO SOUTH TO SOUTH IN SOUTH M SOUTH PR SOUTH PRICES
0
1,000
2,000
3,000
4,000
5,000
6,000
2007 2008 2009 2010 2011 2012 2013 2014 2015 2016 2017
2017 SOUTH TOTAL SALES
Detached Apartment Semi - Detached
Row 10 Year Average Source: CREB®
395,000
400,000
405,000
410,000
415,000
420,000
-
200
400
600
800
1,000
1,200
Dec.'16
Jan.'17
Feb.'17
Mar.'17
Apr.'17
May.'17
Jun.'17
Jul.'17
Aug.'17
Sep.'17
Oct.'17
Nov.'17
Dec.'17
SOUTH INVENTORY AND SALES
Inventory Sales Benchmark Price
Source: CREB®
-
1
2
3
4
5
6
2012 2013 2014 2015 2016 2017
SOUTH MONTHS OF INVENTORY
Months of Supply TrendedSource: CREB®
12-month moving average
-15%
-10%
-5%
0%
5%
10%
15%
2012 2013 2014 2015 2016 2017
SOUTH PRICE CHANGE
Semi Y/Y%change Row Y/Y% changeApartment Y/Y% change Detached Y/Y% Change Source: CREB®
Benchmark Price Change
100,000
150,000
200,000
250,000
300,000
350,000
400,000
450,000
500,000
550,000
2012 2013 2014 2015 2016 2017
SOUTH PRICES
Detached Price Apartment Price
Row Price Semi PriceSource: CREB®
Benchmark Price
0
200
400
600
800
1000
1200
1400
16002017
SOUTH TOTAL SALES BY PRICE RANGE
2014 2015 2016 2017Source: CREB®
Dec. 2017
City of Calgary
CREB® Calgary Regional Housing Market Statistics 24
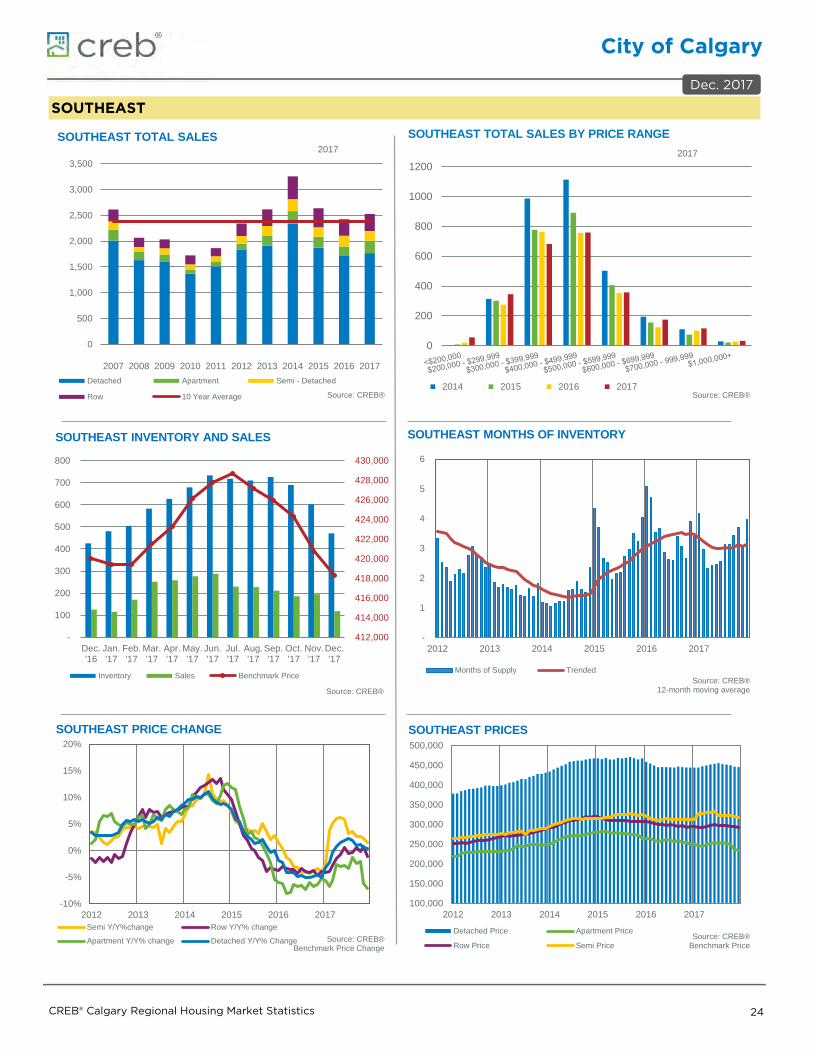
SOUTHEAST SOUTHEA SOUTHEA SOUTHEA SOUTHEA SOUTHEA SOUTHEAST PRICES
0
500
1,000
1,500
2,000
2,500
3,000
3,500
2007 2008 2009 2010 2011 2012 2013 2014 2015 2016 2017
2017 SOUTHEAST TOTAL SALES
Detached Apartment Semi - Detached
Row 10 Year Average Source: CREB®
412,000
414,000
416,000
418,000
420,000
422,000
424,000
426,000
428,000
430,000
-
100
200
300
400
500
600
700
800
Dec.'16
Jan.'17
Feb.'17
Mar.'17
Apr.'17
May.'17
Jun.'17
Jul.'17
Aug.'17
Sep.'17
Oct.'17
Nov.'17
Dec.'17
SOUTHEAST INVENTORY AND SALES
Inventory Sales Benchmark Price
Source: CREB®
-
1
2
3
4
5
6
2012 2013 2014 2015 2016 2017
SOUTHEAST MONTHS OF INVENTORY
Months of Supply TrendedSource: CREB®
12-month moving average
-10%
-5%
0%
5%
10%
15%
20%
2012 2013 2014 2015 2016 2017
SOUTHEAST PRICE CHANGE
Semi Y/Y%change Row Y/Y% change
Apartment Y/Y% change Detached Y/Y% Change Source: CREB®Benchmark Price Change
100,000
150,000
200,000
250,000
300,000
350,000
400,000
450,000
500,000
2012 2013 2014 2015 2016 2017
SOUTHEAST PRICES
Detached Price Apartment Price
Row Price Semi PriceSource: CREB®
Benchmark Price
0
200
400
600
800
1000
12002017
SOUTHEAST TOTAL SALES BY PRICE RANGE
2014 2015 2016 2017Source: CREB®
Dec. 2017
City of Calgary
CREB® Calgary Regional Housing Market Statistics 25
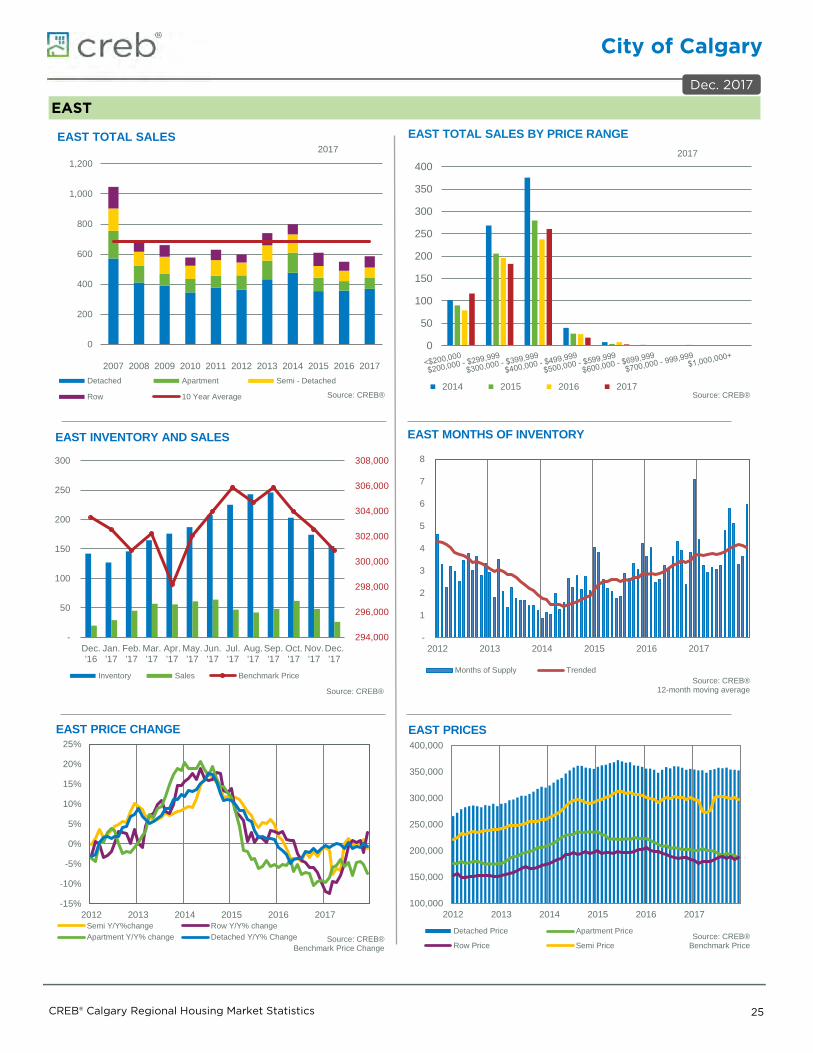
EAST EAST TOT EAST TOT EAST INV EAST MO EAST PRIC EAST PRICES
0
200
400
600
800
1,000
1,200
2007 2008 2009 2010 2011 2012 2013 2014 2015 2016 2017
2017 EAST TOTAL SALES
Detached Apartment Semi - Detached
Row 10 Year Average Source: CREB®
294,000
296,000
298,000
300,000
302,000
304,000
306,000
308,000
-
50
100
150
200
250
300
Dec.'16
Jan.'17
Feb.'17
Mar.'17
Apr.'17
May.'17
Jun.'17
Jul.'17
Aug.'17
Sep.'17
Oct.'17
Nov.'17
Dec.'17
EAST INVENTORY AND SALES
Inventory Sales Benchmark Price
Source: CREB®
-
1
2
3
4
5
6
7
8
2012 2013 2014 2015 2016 2017
EAST MONTHS OF INVENTORY
Months of Supply TrendedSource: CREB®
12-month moving average
-15%
-10%
-5%
0%
5%
10%
15%
20%
25%
2012 2013 2014 2015 2016 2017
EAST PRICE CHANGE
Semi Y/Y%change Row Y/Y% changeApartment Y/Y% change Detached Y/Y% Change Source: CREB®
Benchmark Price Change
100,000
150,000
200,000
250,000
300,000
350,000
400,000
2012 2013 2014 2015 2016 2017
EAST PRICES
Detached Price Apartment Price
Row Price Semi PriceSource: CREB®
Benchmark Price
0
50
100
150
200
250
300
350
4002017
EAST TOTAL SALES BY PRICE RANGE
2014 2015 2016 2017Source: CREB®
Dec. 2017
CREB® Definitions
CREB® Monthly Statistics City of Calgary 26
95 95
DEFINITIONS
Benchmark Price- Represents the monthly price of the typical home based on its attributes such as size, location and number of bedrooms.MLS® Home Price Index – Changes in home prices by comparing current price levels relative to January 2005 price level. Absorption Rate – Refers to the ratio between the amount of sales occurring in the market relative to the amount of inventory.Months of Supply – Refers to the ratio between Inventory and sales which represents at the current pace of sales how long it would take to clear existing inventory. Detached - A unit that is not attached to any other unit.Semi-detached - A single dwelling built as one of a pair that share one common wall. Row - A single dwelling attached to each other by a common wall with more than two properties in the complex.Attached - Both row and semi-detached properties.Apartment - A unit within a high rise or low rise condominium building with access through an interior hallway. Total Residential - Includes detached, attached and apartment style properties.Exclusions – Data included in this package do not include activity related to multiple-unit sales, rental, land or leased properties.
ABOUT CREB®CREB® is a professional body of more than 5,100 licensed brokers and registered associates, representing 245 member offices. CREB® is dedicated to enhancing the value, integrity and expertise of its REALTOR® members. Our REALTORS® are committed to a high standard of professional conduct, ongoing education, and a strict Code of Ethics and standards of business practice. Any use or reference to CREB® data and statistics must acknowledge CREB® as the source. The board does not generate statistics or analysis of any individual member or company’s market share. All MLS® active listings for Calgary and area may be found on the board’s website at ww.creb.com. CREB® is a registered trademark of the Calgary Real Estate Board Cooperative. The trademarks MLS® and Multiple Listing Service® are owned by the Canadian Real Estate Association (CREA) and identify the quality of services provided by real estate professionals who are members of CREA. The trademarks REALTOR® and REALTORS® are controlled by CREA and identify real estate professionals who are members of CREA, and subsequently the Alberta Real Estate Association and CREB®, used under licence.
Dec. 2017