Embed Size (px)
Citation preview
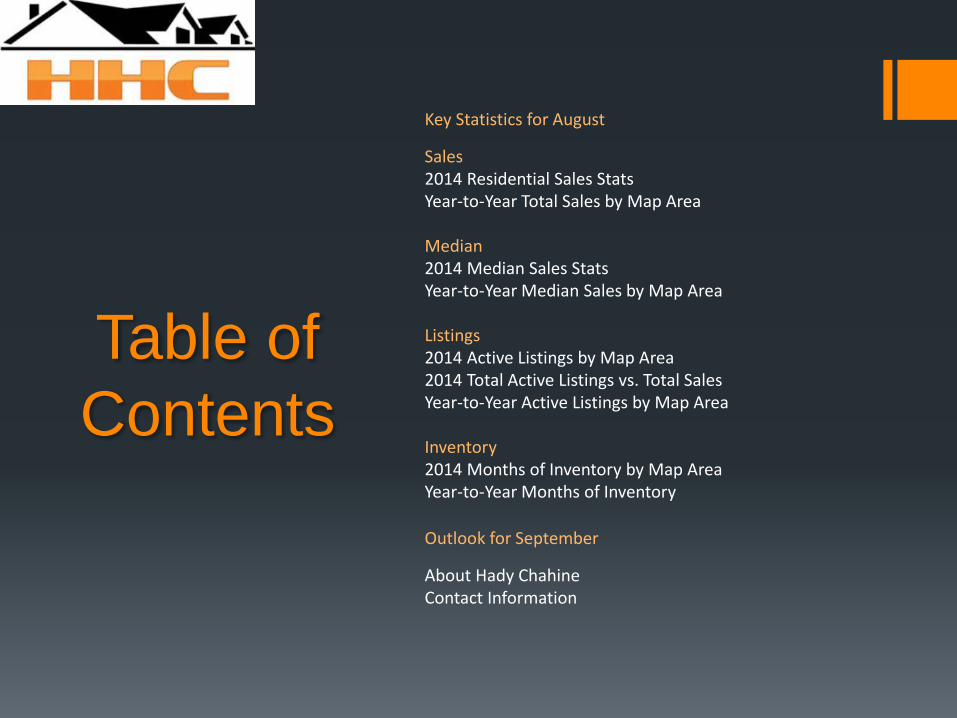
Table of
Contents
Key Statistics for August
Sales 2014 Residential Sales Stats Year-to-Year Total Sales by Map Area Median 2014 Median Sales Stats Year-to-Year Median Sales by Map Area Listings 2014 Active Listings by Map Area 2014 Total Active Listings vs. Total Sales Year-to-Year Active Listings by Map Area Inventory 2014 Months of Inventory by Map Area Year-to-Year Months of Inventory
Outlook for September
About Hady Chahine Contact Information
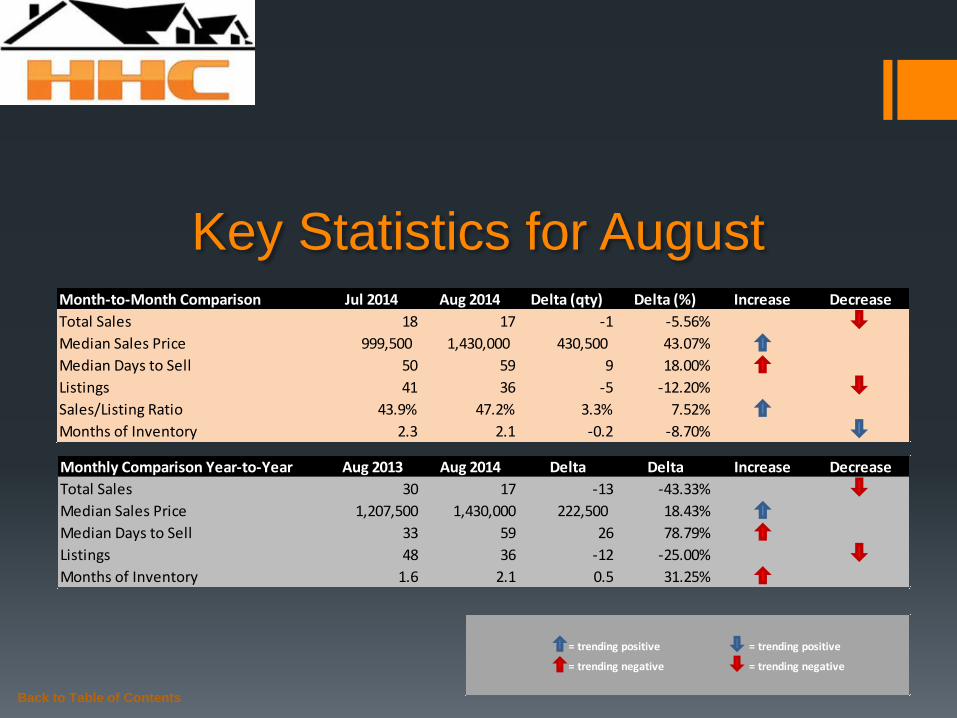
Key Statistics for August
Back to Table of Contents
= trending positive = trending positive
= trending negative = trending negative
Month-to-Month Comparison Jul 2014 Aug 2014 Delta (qty) Delta (%) Increase Decrease
Total Sales 18 17 -1 -5.56%
Median Sales Price 999,500 1,430,000 430,500 43.07%
Median Days to Sell 50 59 9 18.00%
Listings 41 36 -5 -12.20%
Sales/Listing Ratio 43.9% 47.2% 3.3% 7.52%
Months of Inventory 2.3 2.1 -0.2 -8.70%
Monthly Comparison Year-to-Year Aug 2013 Aug 2014 Delta Delta Increase Decrease
Total Sales 30 17 -13 -43.33%
Median Sales Price 1,207,500 1,430,000 222,500 18.43%
Median Days to Sell 33 59 26 78.79%
Listings 48 36 -12 -25.00%
Months of Inventory 1.6 2.1 0.5 31.25%
Back to Table of Contents
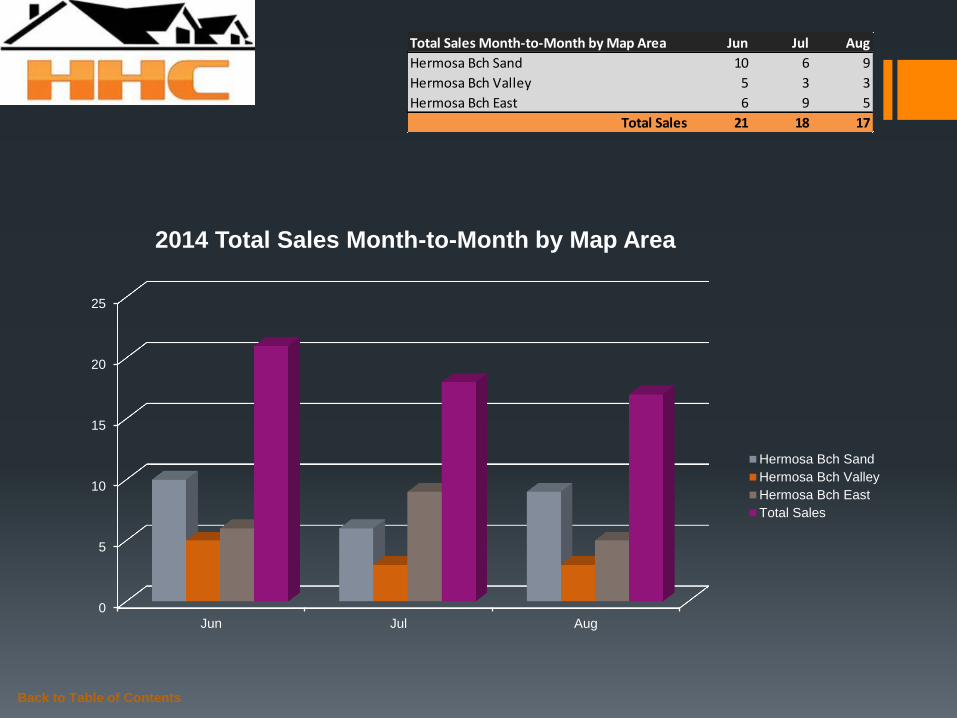
Total Sales Month-to-Month by Map Area Jun Jul Aug
Hermosa Bch Sand 10 6 9
Hermosa Bch Valley 5 3 3
Hermosa Bch East 6 9 5
Total Sales 21 18 17
0
5
10
15
20
25
Jun Jul Aug
2014 Total Sales Month-to-Month by Map Area
Hermosa Bch Sand
Hermosa Bch Valley
Hermosa Bch East
Total Sales
Back to Table of Contents
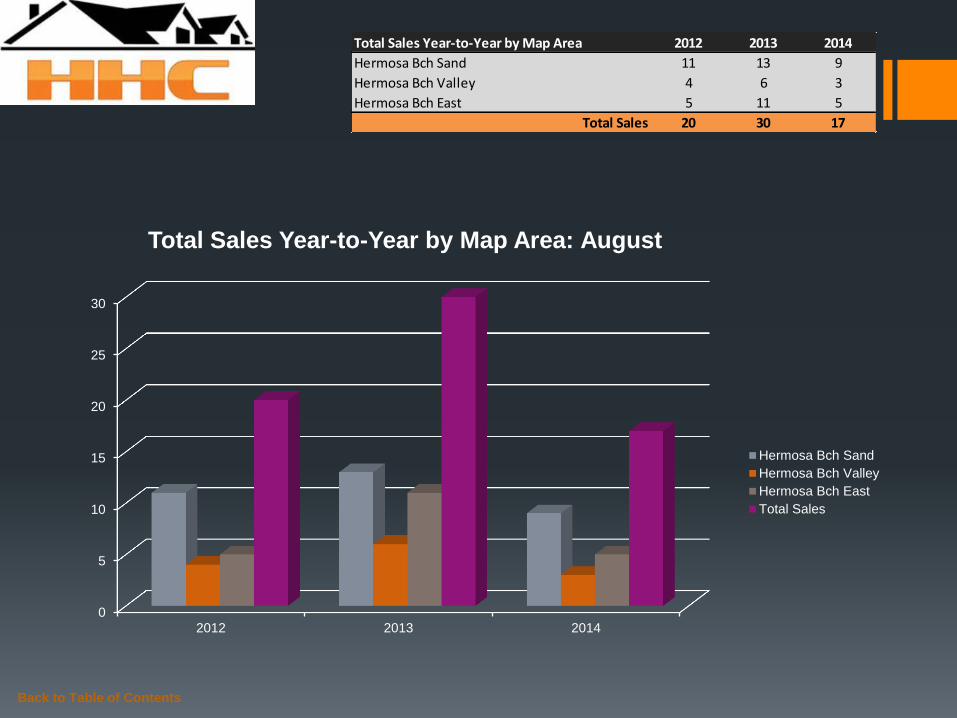
Total Sales Year-to-Year by Map Area 2012 2013 2014
Hermosa Bch Sand 11 13 9
Hermosa Bch Valley 4 6 3
Hermosa Bch East 5 11 5
Total Sales 20 30 17
0
5
10
15
20
25
30
2012 2013 2014
Total Sales Year-to-Year by Map Area: August
Hermosa Bch Sand
Hermosa Bch Valley
Hermosa Bch East
Total Sales
Back to Table of Contents
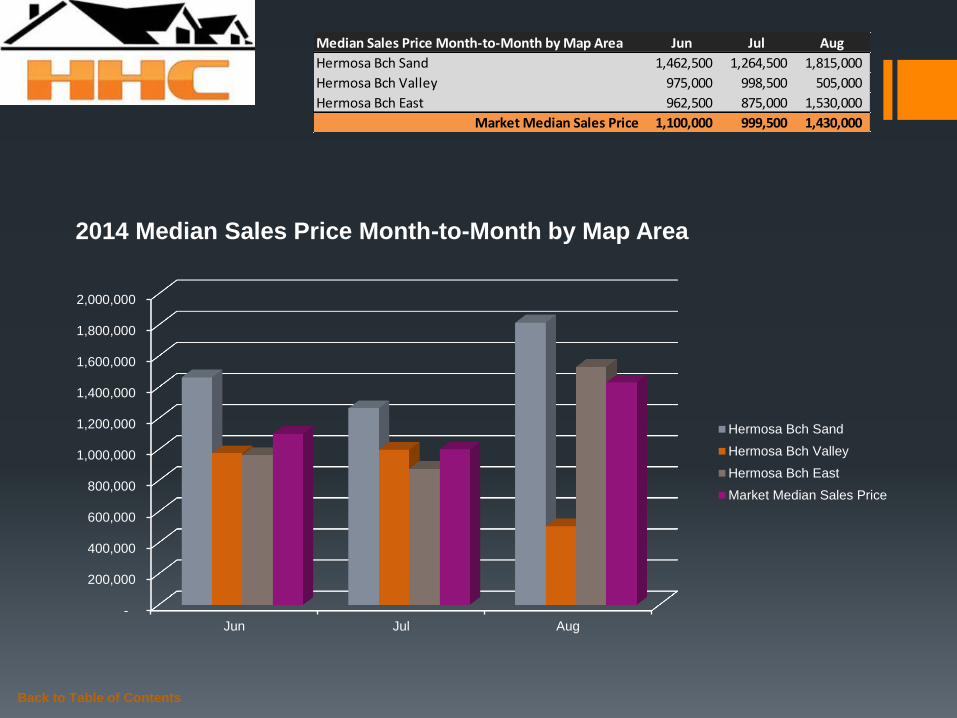
Median Sales Price Month-to-Month by Map Area Jun Jul Aug
Hermosa Bch Sand 1,462,500 1,264,500 1,815,000
Hermosa Bch Valley 975,000 998,500 505,000
Hermosa Bch East 962,500 875,000 1,530,000
Market Median Sales Price 1,100,000 999,500 1,430,000
-
200,000
400,000
600,000
800,000
1,000,000
1,200,000
1,400,000
1,600,000
1,800,000
2,000,000
Jun Jul Aug
2014 Median Sales Price Month-to-Month by Map Area
Hermosa Bch Sand
Hermosa Bch Valley
Hermosa Bch East
Market Median Sales Price
Back to Table of Contents
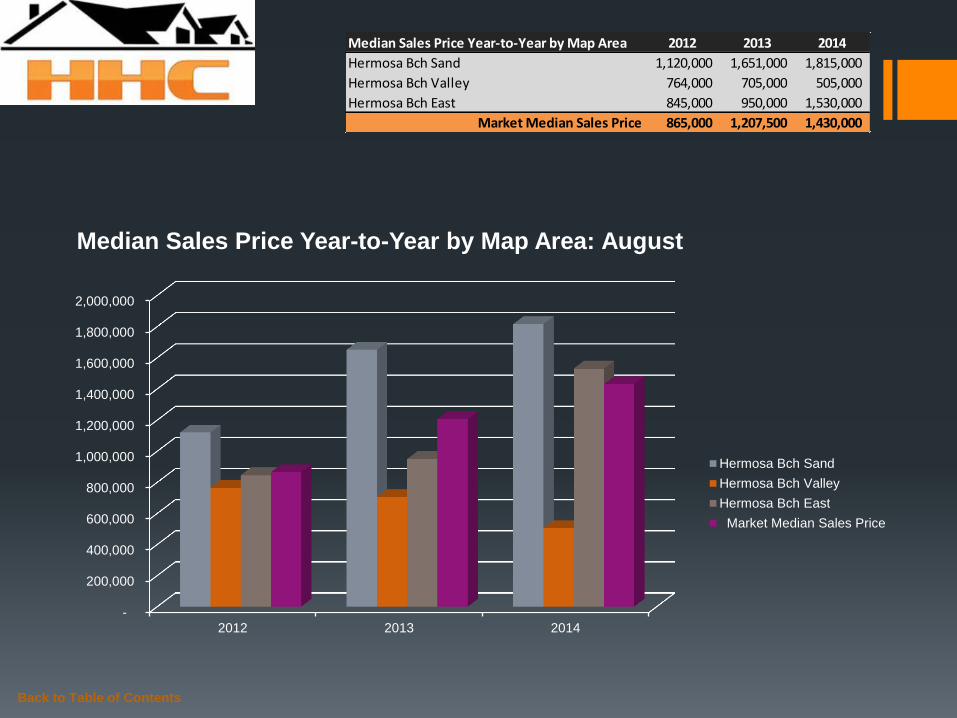
Median Sales Price Year-to-Year by Map Area 2012 2013 2014
Hermosa Bch Sand 1,120,000 1,651,000 1,815,000
Hermosa Bch Valley 764,000 705,000 505,000
Hermosa Bch East 845,000 950,000 1,530,000
Market Median Sales Price 865,000 1,207,500 1,430,000
-
200,000
400,000
600,000
800,000
1,000,000
1,200,000
1,400,000
1,600,000
1,800,000
2,000,000
2012 2013 2014
Median Sales Price Year-to-Year by Map Area: August
Hermosa Bch Sand
Hermosa Bch Valley
Hermosa Bch East
Market Median Sales Price
Back to Table of Contents
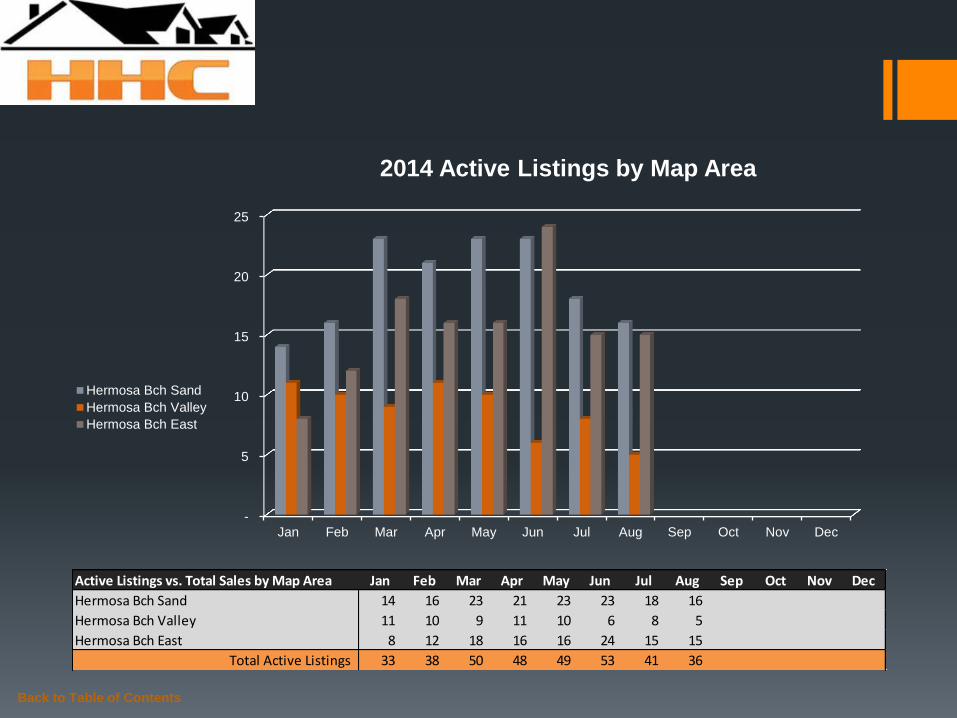
Active Listings vs. Total Sales by Map Area Jan Feb Mar Apr May Jun Jul Aug Sep Oct Nov Dec
Hermosa Bch Sand 14 16 23 21 23 23 18 16
Hermosa Bch Valley 11 10 9 11 10 6 8 5
Hermosa Bch East 8 12 18 16 16 24 15 15
Total Active Listings 33 38 50 48 49 53 41 36
-
5
10
15
20
25
Jan Feb Mar Apr May Jun Jul Aug Sep Oct Nov Dec
2014 Active Listings by Map Area
Hermosa Bch Sand
Hermosa Bch Valley
Hermosa Bch East
Back to Table of Contents
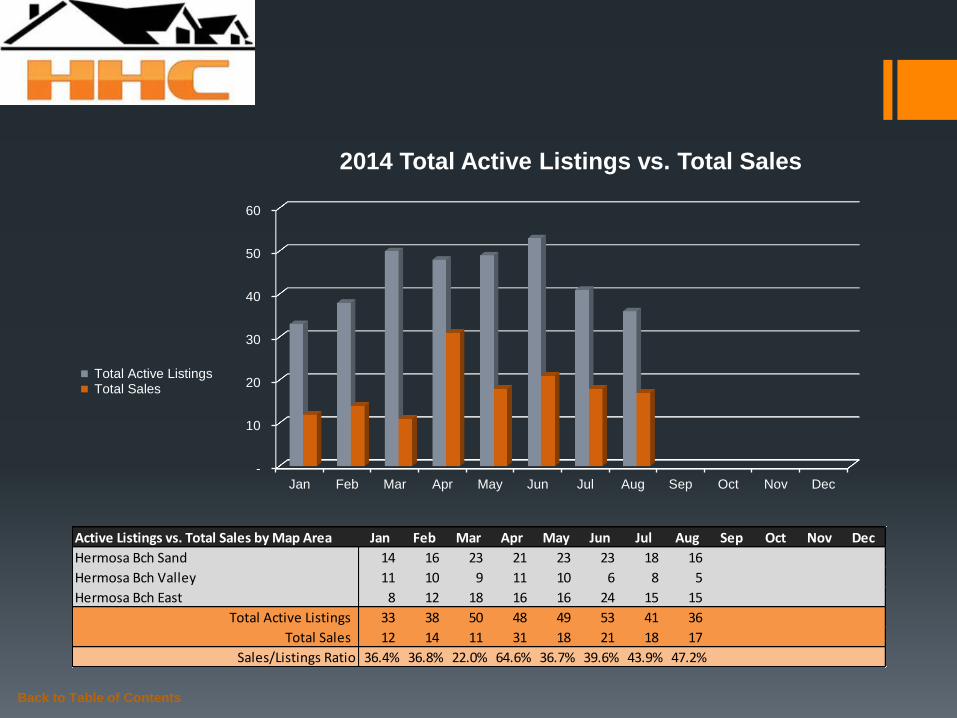
Active Listings vs. Total Sales by Map Area Jan Feb Mar Apr May Jun Jul Aug Sep Oct Nov Dec
Hermosa Bch Sand 14 16 23 21 23 23 18 16
Hermosa Bch Valley 11 10 9 11 10 6 8 5
Hermosa Bch East 8 12 18 16 16 24 15 15
Total Active Listings 33 38 50 48 49 53 41 36
Total Sales 12 14 11 31 18 21 18 17
Sales/Listings Ratio 36.4% 36.8% 22.0% 64.6% 36.7% 39.6% 43.9% 47.2%
-
10
20
30
40
50
60
Jan Feb Mar Apr May Jun Jul Aug Sep Oct Nov Dec
2014 Total Active Listings vs. Total Sales
Total Active Listings Total Sales
Back to Table of Contents
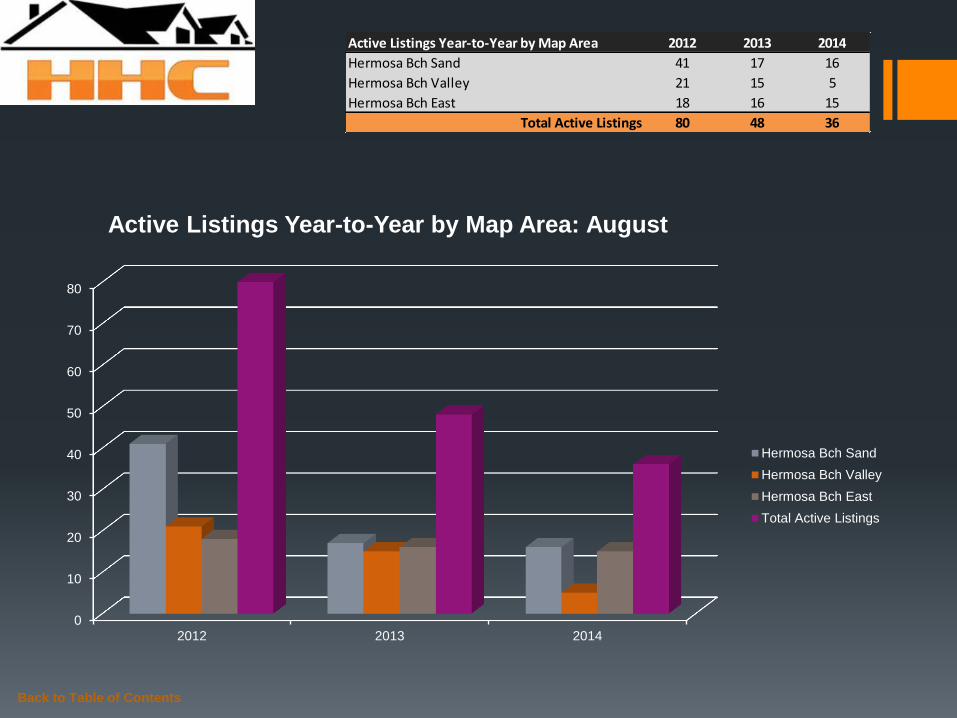
Active Listings Year-to-Year by Map Area 2012 2013 2014
Hermosa Bch Sand 41 17 16
Hermosa Bch Valley 21 15 5
Hermosa Bch East 18 16 15
Total Active Listings 80 48 36
0
10
20
30
40
50
60
70
80
2012 2013 2014
Active Listings Year-to-Year by Map Area: August
Hermosa Bch Sand
Hermosa Bch Valley
Hermosa Bch East
Total Active Listings
Back to Table of Contents
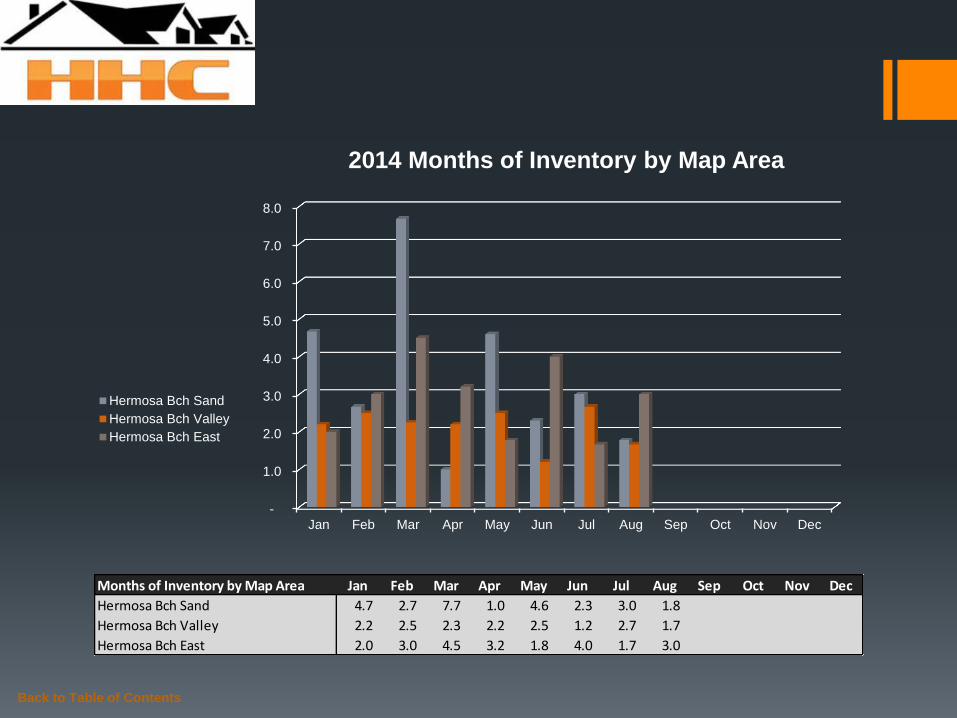
Months of Inventory by Map Area Jan Feb Mar Apr May Jun Jul Aug Sep Oct Nov Dec
Hermosa Bch Sand 4.7 2.7 7.7 1.0 4.6 2.3 3.0 1.8
Hermosa Bch Valley 2.2 2.5 2.3 2.2 2.5 1.2 2.7 1.7
Hermosa Bch East 2.0 3.0 4.5 3.2 1.8 4.0 1.7 3.0
-
1.0
2.0
3.0
4.0
5.0
6.0
7.0
8.0
Jan Feb Mar Apr May Jun Jul Aug Sep Oct Nov Dec
2014 Months of Inventory by Map Area
Hermosa Bch Sand
Hermosa Bch Valley
Hermosa Bch East
Back to Table of Contents
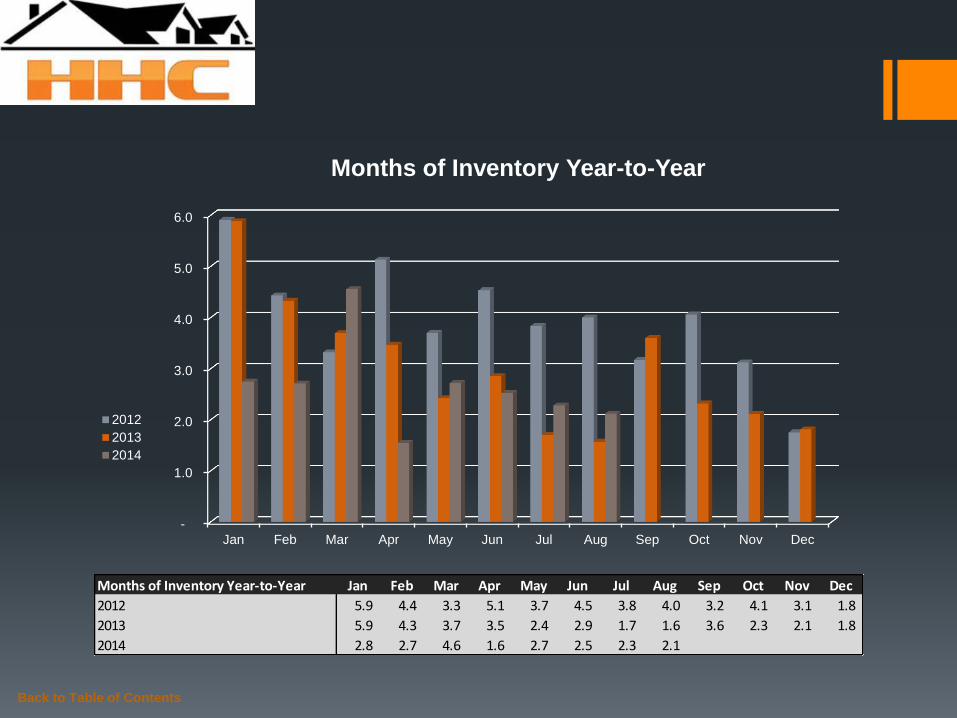
Months of Inventory Year-to-Year Jan Feb Mar Apr May Jun Jul Aug Sep Oct Nov Dec
2012 5.9 4.4 3.3 5.1 3.7 4.5 3.8 4.0 3.2 4.1 3.1 1.8
2013 5.9 4.3 3.7 3.5 2.4 2.9 1.7 1.6 3.6 2.3 2.1 1.8
2014 2.8 2.7 4.6 1.6 2.7 2.5 2.3 2.1
-
1.0
2.0
3.0
4.0
5.0
6.0
Jan Feb Mar Apr May Jun Jul Aug Sep Oct Nov Dec
Months of Inventory Year-to-Year
2012
2013
2014
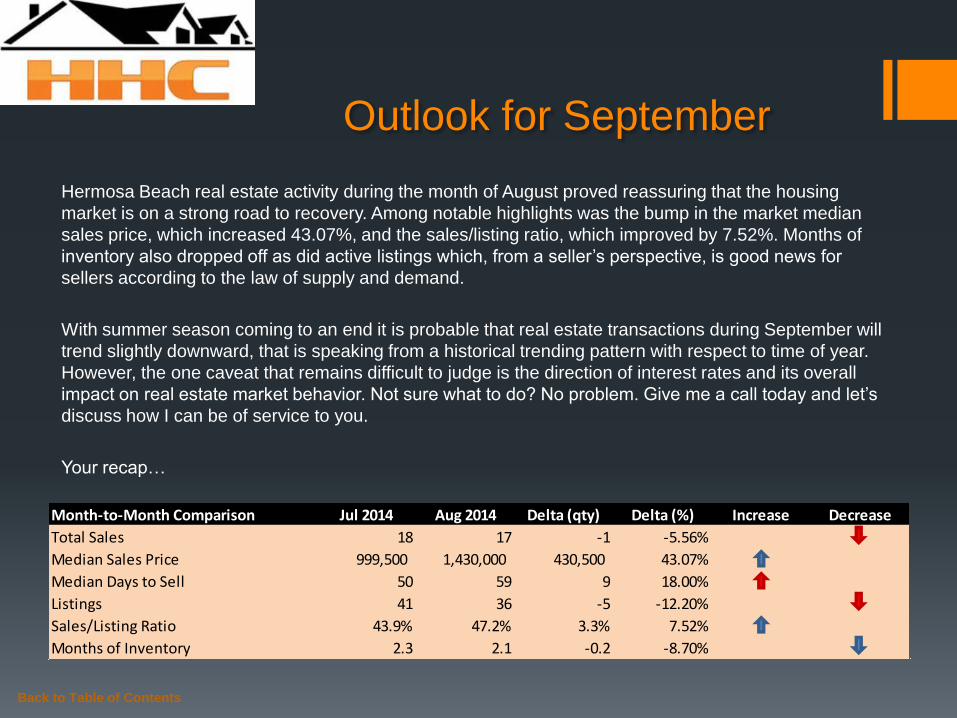
Outlook for September
Hermosa Beach real estate activity during the month of August proved reassuring that the housing
market is on a strong road to recovery. Among notable highlights was the bump in the market median
sales price, which increased 43.07%, and the sales/listing ratio, which improved by 7.52%. Months of
inventory also dropped off as did active listings which, from a seller’s perspective, is good news for
sellers according to the law of supply and demand.
With summer season coming to an end it is probable that real estate transactions during September will
trend slightly downward, that is speaking from a historical trending pattern with respect to time of year.
However, the one caveat that remains difficult to judge is the direction of interest rates and its overall
impact on real estate market behavior. Not sure what to do? No problem. Give me a call today and let’s
discuss how I can be of service to you.
Your recap…
Back to Table of Contents
Month-to-Month Comparison Jul 2014 Aug 2014 Delta (qty) Delta (%) Increase Decrease
Total Sales 18 17 -1 -5.56%
Median Sales Price 999,500 1,430,000 430,500 43.07%
Median Days to Sell 50 59 9 18.00%
Listings 41 36 -5 -12.20%
Sales/Listing Ratio 43.9% 47.2% 3.3% 7.52%
Months of Inventory 2.3 2.1 -0.2 -8.70%
About
Hady Chahine…
Serving South Bay Home Buyers and Sellers Since 2001
RE/MAX Top 4 Team in California – 2012
RE/MAX 100% Club - 2011
Shorewood Realtors Top 5% in Overall Sales 2001-2006, 2008-2010
Back to Table of Contents

The information being provided by CARETS (CLAW, CRISNet MLS, DAMLS, CRMLS, i-Tech MLS, and/or VCRDS) is for the visitor’s personal, non-commercial use and may not be used for
any purpose other than to identify prospective properties visitor may be interested in purchasing. Any information relating to a property referenced on this web site comes from the Internet
Data Exchange (IDX) program of CARETS. This web site may reference real estate listing(s) held by a brokerage firm other than the broker and/or agent who owns this web site. The accuracy
of all information, regardless of source, including but not limited to square footages and lot sizes, is deemed reliable but not guaranteed and should be personally verified through personal
inspection by and/or with the appropriate professionals.
Hady Chahine
• 310-404-5361
Back to Table of Contents
Listings MLS BLOG Website