Embed Size (px)
Citation preview

Calgary & Area Real Estate Statistics:
January 2016
1
Request Your Free Home Evaluation Today!
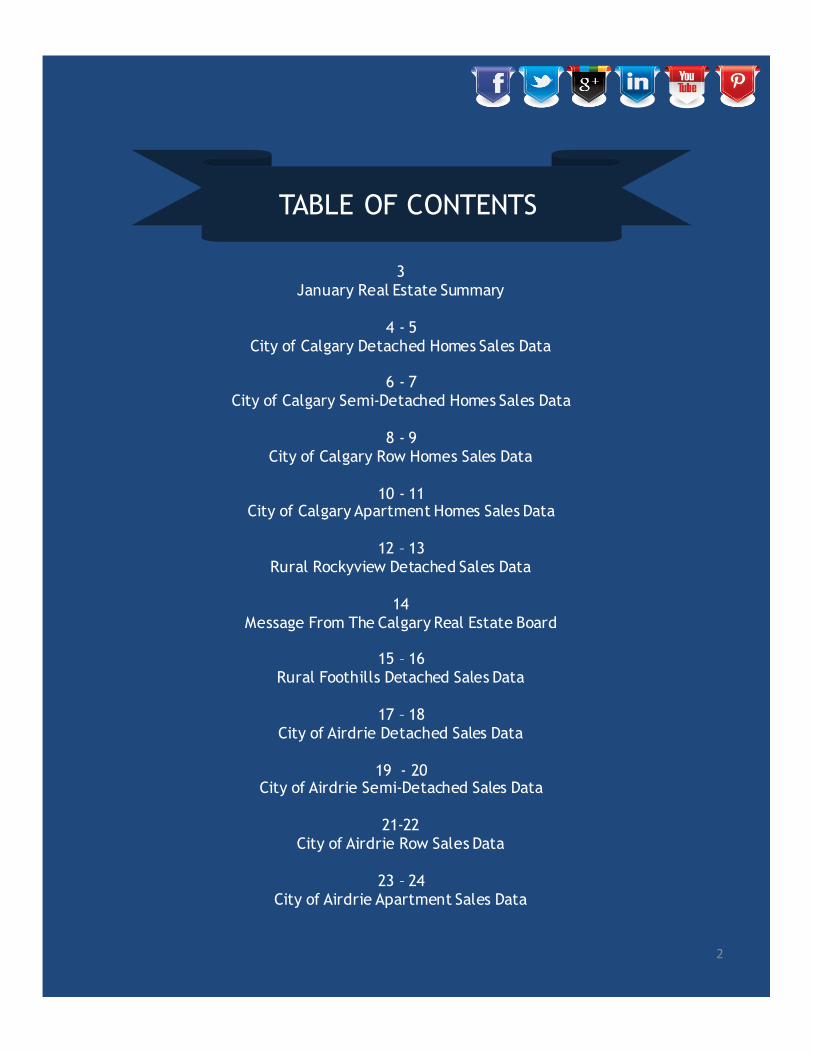
TABLE OF CONTENTS
3January Real Estate Summary
4 - 5City of Calgary Detached Homes Sales Data
6 - 7City of Calgary Semi-Detached Homes Sales Data
8 - 9City of Calgary Row Homes Sales Data
10 - 11City of Calgary Apartment Homes Sales Data
12 – 13Rural Rockyview Detached Sales Data
14Message From The Calgary Real Estate Board
15 – 16Rural Foothills Detached Sales Data
17 – 18City of Airdrie Detached Sales Data
19 - 20City of Airdrie Semi-Detached Sales Data
21-22City of Airdrie Row Sales Data
23 – 24City of Airdrie Apartment Sales Data
2
Housing Market Remains Unchanged in January
•Slowsalesactivityandinventorygainsplacedownwardpressureonprices
“City wide, January sales totaled 763 units, 13 per cent below last year and 43 per cent below long-term averages. While new listings declined by 16 per cent compared to January 2015, the number of new listings far outpaced the sales, causing inventory gains. January’s city wide months of supply levels rose above six months.”
“The recent slide in energy prices has raised concerns about near term recovery prospects for the city,” said CREB® chief economist Ann-Marie Lurie. “Energy market uncertainty and a soft labour market are weighing on many aspects of our economy, including the housing sector.”
“As expected, the imbalance between housing supply and demand is continuing to place downward pressure on prices,” said Lurie. “However, the recent price retraction has not erased all the gains recorded in recent years, as the benchmark price remains 4.41 per cent above the January 2014 price of $428,400.” (Source: Calgary Real Estate Board)
While all property types have recorded price contractions from recent highs, the largest price declines have occurred in the apartment sector as this segment has had elevated months of supply since the second quarter of 2015. The apartment benchmark price totaled $281,900 in January, a year over-year decrease of 6.35 per cent and 2.12 per cent lower than the previous month’s price. In fact, apartment sector prices have once again fallen below the 2007 monthly high of $301,500.
For those who are selling, it is vital to know how the market is performing for your specific type of property! For those who are interested in investing in real estate, this is an ideal market! Interest rates continue to favour borrowers.
Hope this helps!
Susanita de Diego
3

City of Calgary Detached Homes Sales DataYearly – January 2015 – January 2016
The following table shows the City of Calgary Detached Homes Sales Data for each month for the last year.
Month/Year DetachedSales
PreviousMonthEndInventory+InventoryAdded
DuringtheMonth
%ofAvailableInventorySold
DaysonMarket
MonthsofSupply
January2015 534 1,788+1,836=3,624 14.70% 37 4.83
February2015 740 2,579+1,671=4,250 17.40% 34 4.02
March2015 1,079 2,977+1,774=4,751 22.70% 37 2.81
April2015 1,150 3,027+1,770=4,797 24.00% 38 2.65
May2015 1,362 3,044+1,875=4,919 27.70% 38 2.15
June2015 1,331 2,923+1,830=4,753 28.00% 37 2.10
July2015 1,220 2,789+1,731=4,520 27.00% 37 2.26
August2015 994 2,752+1,643=4,395 22.60% 37 2.85
September2015 906 2,833+1,768=4,601 19.70% 37 3.34
October2015 872 3,029+1,441=4,470 19.50% 38 3.35
November2015 797 2,921+1,184=4,105 19.40% 43 3.37
December2015 533 2,684+791=3,475 15.30% 47 4.02
January2016 465 2,143+1,488=3,631 12.80% 48 5.48
City of Calgary Detached Homes Sales DataMonthly – January 2012 – January 2016
The following table shows the City of Airdrie Apartment Sales Data year over year for the last five years.
Month/Year DetachedSales PreviousMonthEndInventory+Inventory
AddedDuringtheMonth
%ofAvailableInventorySold
DaysonMarket
MonthsofSupply
January2012 679 2,348+1,534=3,882 17.50% 58 3.69
January2013 779 1,614+1,521=3,135 24.80% 47 2.30
January2014 857 1,331+1,399=2,730 31.40% 40 1.68
January2015 533 1,791+1,835=3,626 14.70% 37 4.85
January2016 465 2,143+1,488=3,631 12.80% 48 5.48
4

The MLS® Home Price Index (HPI)
The MLS® Home Price Index (HPI) was launched on February 6, 2012 as part of a nationwide rollout involving boards in Canada’s largest cities because average and median price changes can misrepresent changes in market price. We often refer to the median price as being immune from outliers. However, if there have been large movements in either the low end or high end of the price spectrum, the median is unable to reflect the price changes.
The MLS® Home Price Index (HPI) was introduced to provide a better measurement of price and price trends for residential properties. A benchmark home is one that is comprised of a set of specific attributes that is typical for the area where it is located.
The City of Calgary Detached Benchmark, Average and Median Prices have shown the following progression:
5
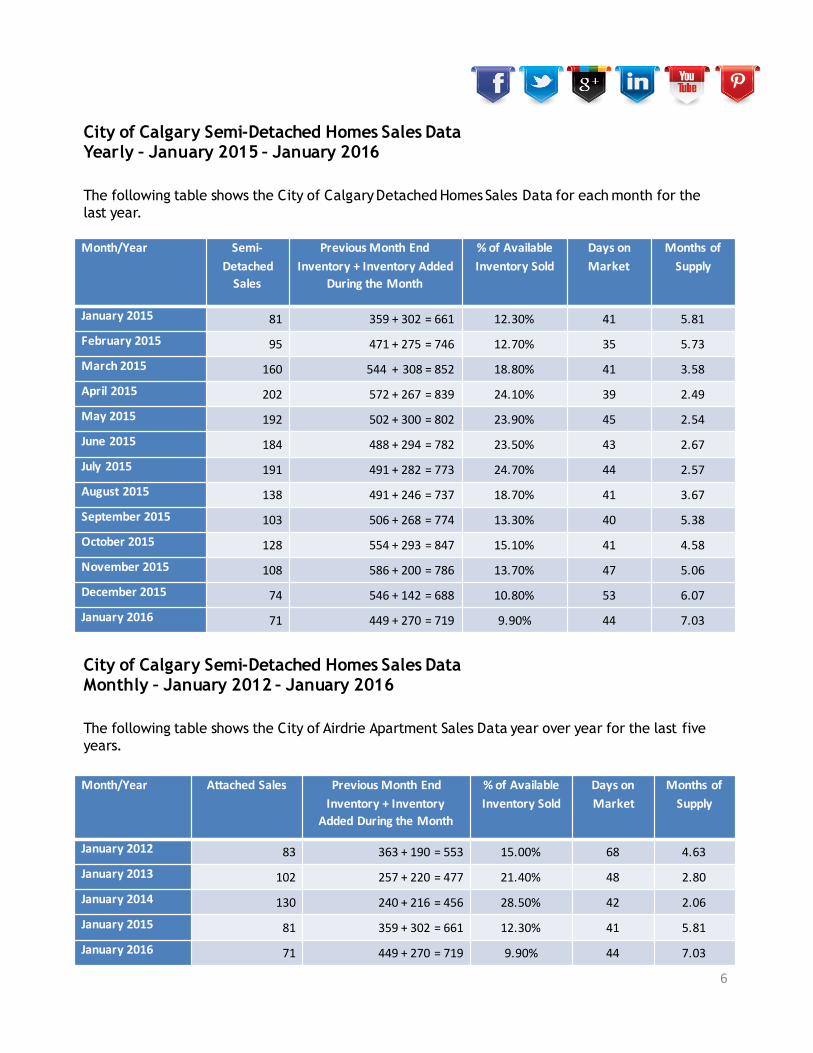
City of Calgary Semi-Detached Homes Sales DataYearly – January 2015 – January 2016
The following table shows the City of Calgary Detached Homes Sales Data for each month for the last year.
Month/Year Semi-DetachedSales
PreviousMonthEndInventory+InventoryAdded
DuringtheMonth
%ofAvailableInventorySold
DaysonMarket
MonthsofSupply
January2015 81 359+302=661 12.30% 41 5.81
February2015 95 471+275=746 12.70% 35 5.73
March2015 160 544+308=852 18.80% 41 3.58
April2015 202 572+267=839 24.10% 39 2.49
May2015 192 502+300=802 23.90% 45 2.54
June2015 184 488+294=782 23.50% 43 2.67
July2015 191 491+282=773 24.70% 44 2.57
August2015 138 491+246=737 18.70% 41 3.67
September2015 103 506+268=774 13.30% 40 5.38
October2015 128 554+293=847 15.10% 41 4.58
November2015 108 586+200=786 13.70% 47 5.06
December2015 74 546+142=688 10.80% 53 6.07
January2016 71 449+270=719 9.90% 44 7.03
City of Calgary Semi-Detached Homes Sales DataMonthly – January 2012 – January 2016
The following table shows the City of Airdrie Apartment Sales Data year over year for the last five years.
Month/Year AttachedSales PreviousMonthEndInventory+Inventory
AddedDuringtheMonth
%ofAvailableInventorySold
DaysonMarket
MonthsofSupply
January2012 83 363+190=553 15.00% 68 4.63
January2013 102 257+220=477 21.40% 48 2.80
January2014 130 240+216=456 28.50% 42 2.06
January2015 81 359+302=661 12.30% 41 5.81
January2016 71 449+270=719 9.90% 44 7.03
6
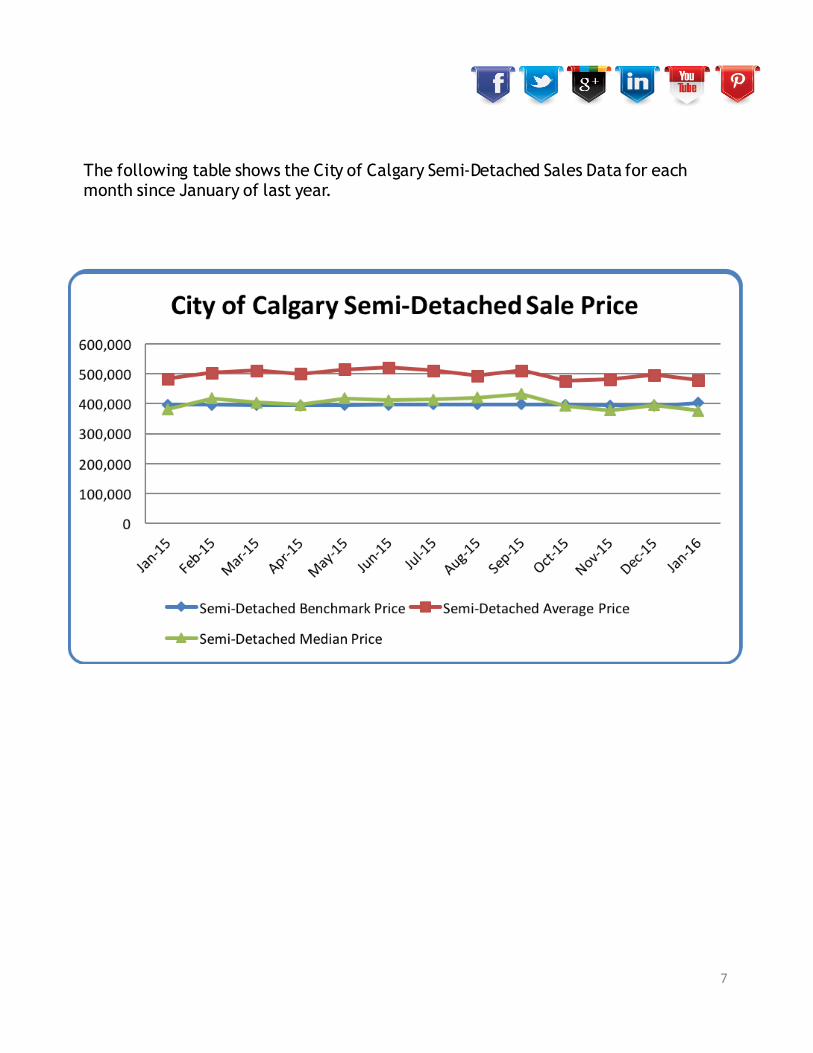
The following table shows the City of Calgary Semi-Detached Sales Data for each month since January of last year.
7

City of Calgary Row Homes Sales DataYearly – January 2015 – January 2016
The following table shows the City of Calgary Detached Homes Sales Data for each month for the last year.
Month/Year RowSales PreviousMonthEndInventory+InventoryAdded
DuringtheMonth
%ofAvailableInventorySold
DaysonMarket
MonthsofSupply
January2015 109 382+386=768 14.20% 42 4.99
February2015 156 544+396=940 16.60% 33 4.31
March2015 236 672+375=1,047 22.50% 38 2.88
April2015 259 679+419=1,098 23.60% 42 2.80
May2015 273 724+380=1,104 24.70% 41 2.46
June2015 268 672+385=1,057 25.40% 44 2.41
July2015 255 645+390=1,035 24.60% 44 2.53
August2015 227 644+339=983 23.10% 46 2.85
September2015 181 648+402=1,050 17.20% 41 3.99
October2015 184 722+369=1,091 16.90% 41 4.06
November2015 161 747+308=1,055 15.30% 50 4.60
December2015 120 740+215=955 12.60% 47 5.33
January2016 99 640+382=1,022 9.70% 51 7.31
City of Calgary Row Homes Sales DataMonthly – January 2012 – January 2016
The following table shows the City of Airdrie Apartment Sales Data year over year for the last five years.
Month/Year AttachedSales PreviousMonthEndInventory+Inventory
AddedDuringtheMonth
%ofAvailableInventorySold
DaysonMarket
MonthsofSupply
January2012 119 440+285=725 16.40% 61 3.93
January2013 133 284+278=562 23.70% 52 2.51
January2014 181 208+276=484 37.40% 38 1.27
January2015 109 382+386=768 14.20% 42 4.99
January2016 99 640+382=1,022 9.70% 51 7.31
8
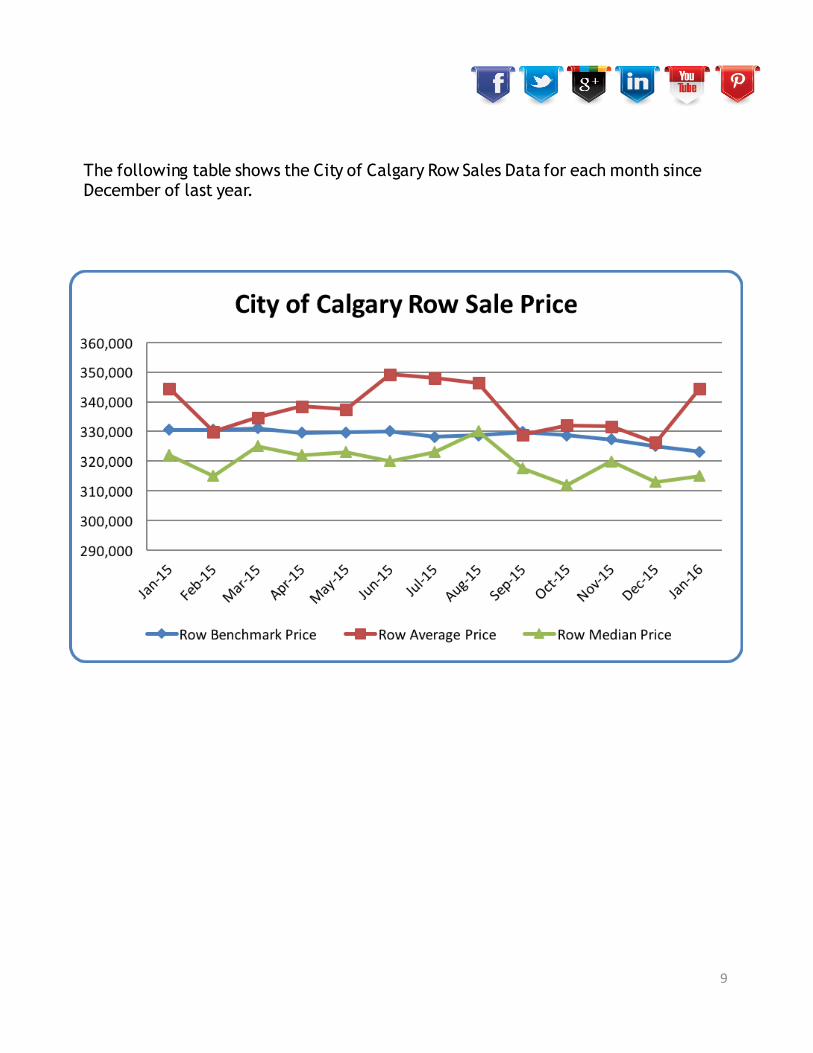
The following table shows the City of Calgary Row Sales Data for each month since December of last year.
9

City of Calgary Apartment Homes Sales DataYearly – January 2015 – January 2016
The following table shows the City of Calgary Detached Homes Sales Data for each month for the last year.
Month/Year ApartmentSales
PreviousMonthEndInventory+InventoryAdded
DuringtheMonth
%ofAvailableInventorySold
DaysonMarket
MonthsofSupply
January2015 153 850+745=1,595 9.60% 55 7.83
February2015 216 1,198+593=1,791 12.10% 40 6.19
March2015 302 1,338+672=2,010 15.00% 43 4.72
April2015 352 1,426+608=2,034 17.30% 45 3.88
May2015 359 1,367+613=1,980 18.10% 48 3.65
June2015 399 1,310+611=1,921 20.80% 48 3.04
July2015 324 1,212+582=1,794 18.10% 47 3.84
August2015 281 1,245+514=1,759 16.00% 47 4.37
September2015 259 1,227+657=1,884 13.70% 49 4.99
October2015 237 1,293+587=1,888 12.60% 50 5.76
November2015 195 1,366+489=1,855 10.50% 50 6.94
December2015 152 1,353+343=1,696 9.00% 56 7.39
January2016 129 1,124+601=1,725 7.50% 59 9.71
City of Calgary Apartment Homes Sales DataMonthly January 2012 – January 2016
The following table shows the City of Airdrie Apartment Sales Data year over year for the last five years.
Month/Year ApartmentSales
PreviousMonthEndInventory+Inventory
AddedDuringtheMonth
%ofAvailableInventorySold
DaysonMarket
MonthsofSupply
January2012 180 815+513=1,328 14.06% 64 5.23
January2013 206 583+458=1,041 25.00% 62 3.24
January2014 263 477+490=967 27.20% 43 2.13
January2015 153 850+745=1,595 9.60% 55 7.83
January2016 129 1,124+601=1,725 7.50% 59 9.71
10
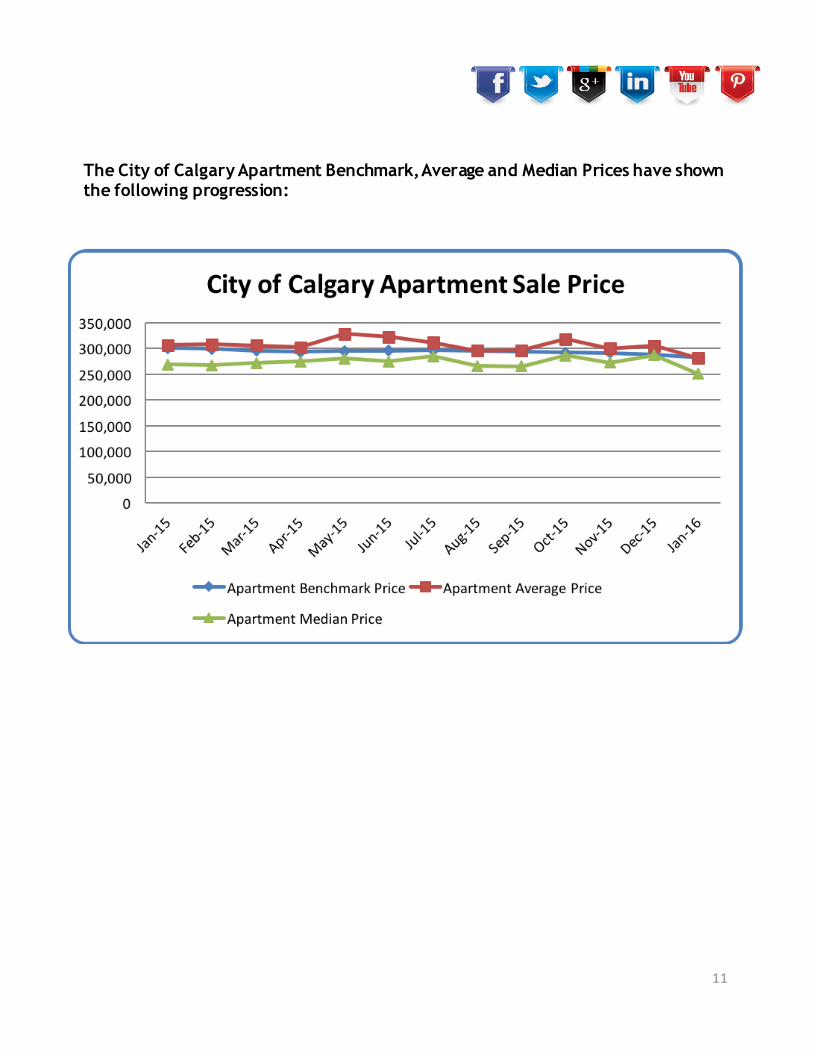
The City of Calgary Apartment Benchmark, Average and Median Prices have shown the following progression:
11

Rural Rockyview Detached Sales DataYearly – January 2015 – January 2016
The following table shows the City of Calgary Detached Homes Sales Data for each month for the last year.
Month/Year DetachedSales
PreviousMonthEndInventory+InventoryAdded
DuringtheMonth
%ofAvailableInventorySold
DaysonMarket
MonthsofSupply
January2015 19 220+88=308 6.17% 142 13.05
February2015 20 248+76=324 6.17% 74 13.85
March2015 23 277+82=345 6.67% 86 12.87
April2015 28 296+68=364 7.69% 71 10.89
May2015 35 305+87=392 8.93% 78 9.43
June2015 41 330+84=414 9.90% 97 7.93
July2015 29 325+62=387 7.49% 84 10.55
August2015 14 306+68=374 3.74% 73 23.62
September2015 15 314+66=380 3.95% 96 20.27
October2015 22 305+53=358 6.15% 104 13.00
November2015 19 287+41=328 5.80% 106 14.05
December2015 16 270+46=316 5.10% 136 13.38
January2016 5 214+63=277 1.80% 83 46.00
Rural Rockyview Detached Sales DataMonthly – January 2012 – January 2016
The following table shows the City of Airdrie Apartment Sales Data year over year for the last five years.
Month/Year DetachedSales PreviousMonthEndInventory+Inventory
AddedDuringtheMonth
%ofAvailableInventorySold
DaysonMarket
MonthsofSupply
January2012 18 263+107=370 4.86% 103 17.33
January2013 14 274+120=394 3.55% 174 22.43
January2014 17 251+97=348 4.89% 65 15.76
January2015 15 220+88=308 6.17% 142 13.05
January2016 16 214+63=277 1.80% 83 46.00
12
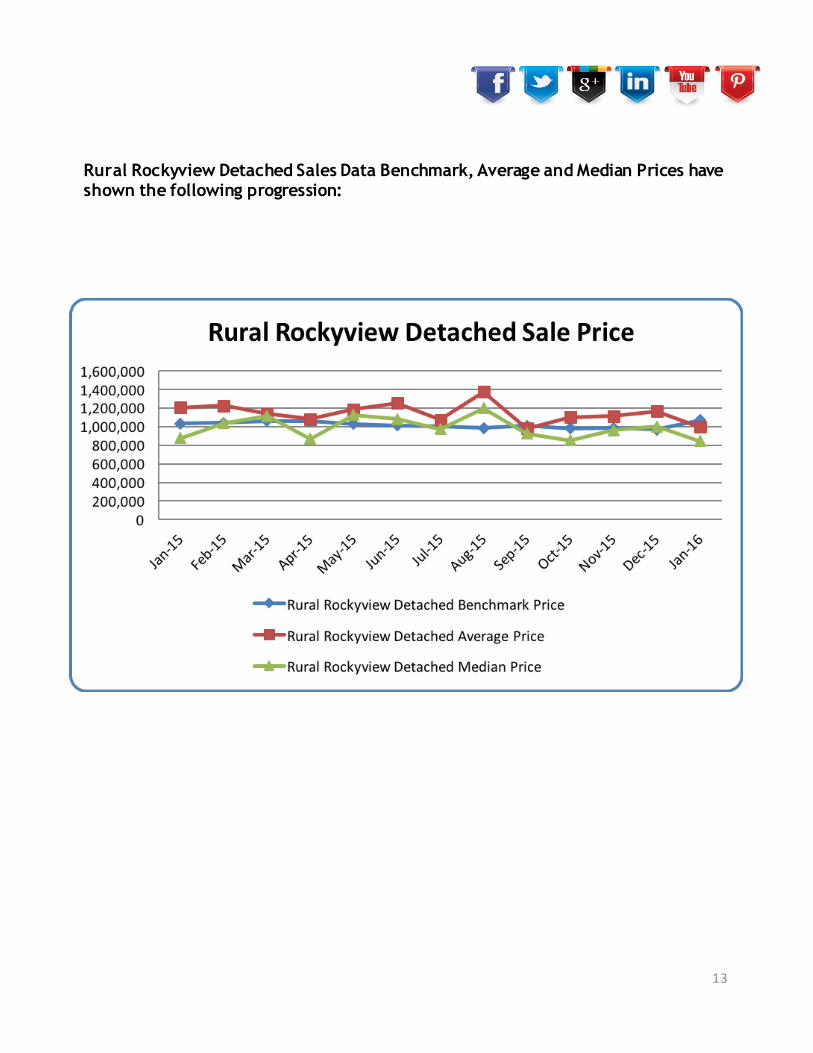
Rural Rockyview Detached Sales Data Benchmark, Average and Median Prices have shown the following progression:
13

“Energy market uncertainty and a soft labour market are weighing on many aspects of our economy, including the housing sector.” said CREB® chief economist Ann-Marie Lurie.
“”
14

Rural Foothills Detached Sales DataYearly – January 2015 – January 2016
The following table shows the City of Calgary Detached Homes Sales Data for each month for the last year.
Month/Year DetachedSales
PreviousMonthEndInventory+InventoryAdded
DuringtheMonth
%ofAvailableInventorySold
DaysonMarket
MonthsofSupply
January2015 8 124+33=157 5.10% 151 15.50
February2015 17 124+40=164 10.37% 139 8.18
March2015 14 139+47=186 7.50% 139 12.00
April2015 14 156_54=210 6.67% 98 13.21
May2015 24 185+63=248 9.68% 102 8.38
June2015 17 201+51=252 6.75% 52 12.59
July2015 16 214+40=254 6.30% 86 13.25
August2015 10 212+39=251 3.98% 56 20.40
September2015 18 204+36=236 7.63% 130 9.89
October2015 15 178+36=214 7.01%% 123 10.47
November2015 14 157+23=180 7.78% 81 9.86
December2015 13 139+15=154 8.40% 98 8.31
January2016 6 109+31=140 4.29% 125 17.67
Rural Foothills Detached Sales DataMonthly – January 2012 – January 2016
The following table shows the City of Airdrie Apartment Sales Data year over year for the last five years.
Month/Year DetachedSales PreviousMonthEndInventory+Inventory
AddedDuringtheMonth
%ofAvailableInventorySold
DaysonMarket
MonthsofSupply
January2012 7 159+52=211 3.32% 126 25.71
January2013 11 144+61=205 5.36% 156 14.55
January2014 16 121+33=154 10.39% 111 7.50
January2015 8 124+33=157 5.10% 151 20.67
January2016 6 109+31=140 4.29% 125 15.50
15
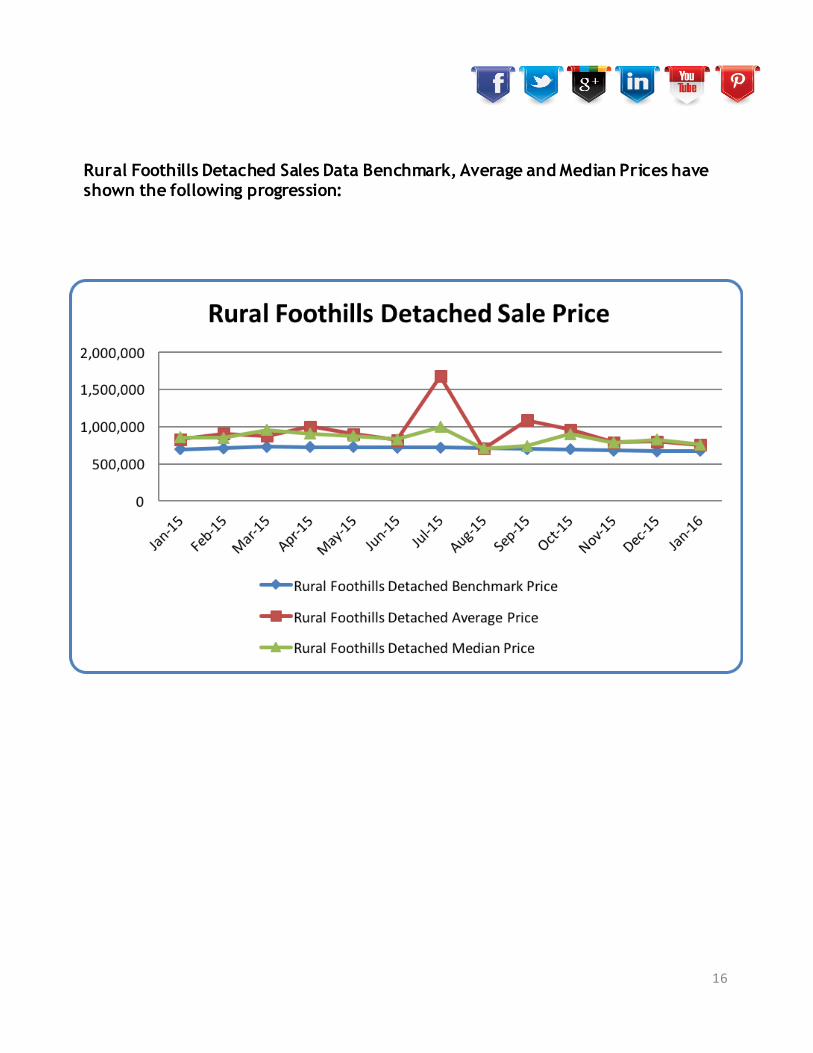
Rural Foothills Detached Sales Data Benchmark, Average and Median Prices have shown the following progression:
16

City of Airdrie Detached Sales DataYearly – January 2015 – January 2016
The following table shows the City of Calgary Detached Homes Sales Data for each month for the last year.
Month/Year DetachedSales
PreviousMonthEndInventory+InventoryAdded
DuringtheMonth
%ofAvailableInventorySold
DaysonMarket
MonthsofSupply
January2015 40 125+156=281 14.20% 42 5.20
February2015 70 208+148=356 19.70% 35 3.51
March2015 93 246+133=379 24.50% 38 2.62
April2015 92 244+140=384 24.00% 40 2.66
May2015 111 245+159=404 27.50% 41 2.16
June2015 117 240+157=397 29.50% 43 2.06
July2015 106 240+128=368 28.80% 37 2.16
August2015 88 229+127=356 24.70% 40 2.58
September2015 86 227+115=342 25.10% 52 2.55
October2015 64 219+122=341 18.80% 50 3.66
November2015 55 234+93=327 16.80% 45 4.18
December2015 42 230+59=289 14.50% 53 4.83
January2016 43 203+118=321 13.40% 62 5.12
City of Airdrie Detached Sales DataMonthly – January 2012 – January 2016
The following table shows the City of Airdrie Apartment Sales Data year over year for the last five years.
Month/Year DetachedSales PreviousMonthEndInventory+Inventory
AddedDuringtheMonth
%ofAvailableInventorySold
DaysonMarket
MonthsofSupply
January2011 48 192+120=312 15.40% 77 4.63
January2012 58 122+91=213 27.20% 65 2.17
January2013 51 95+100=195 26.20% 43 2.25
January2014 40 125+156=281 14.20% 42 5.20
January2015 43 203+118=321 13.40% 62 5.12
17
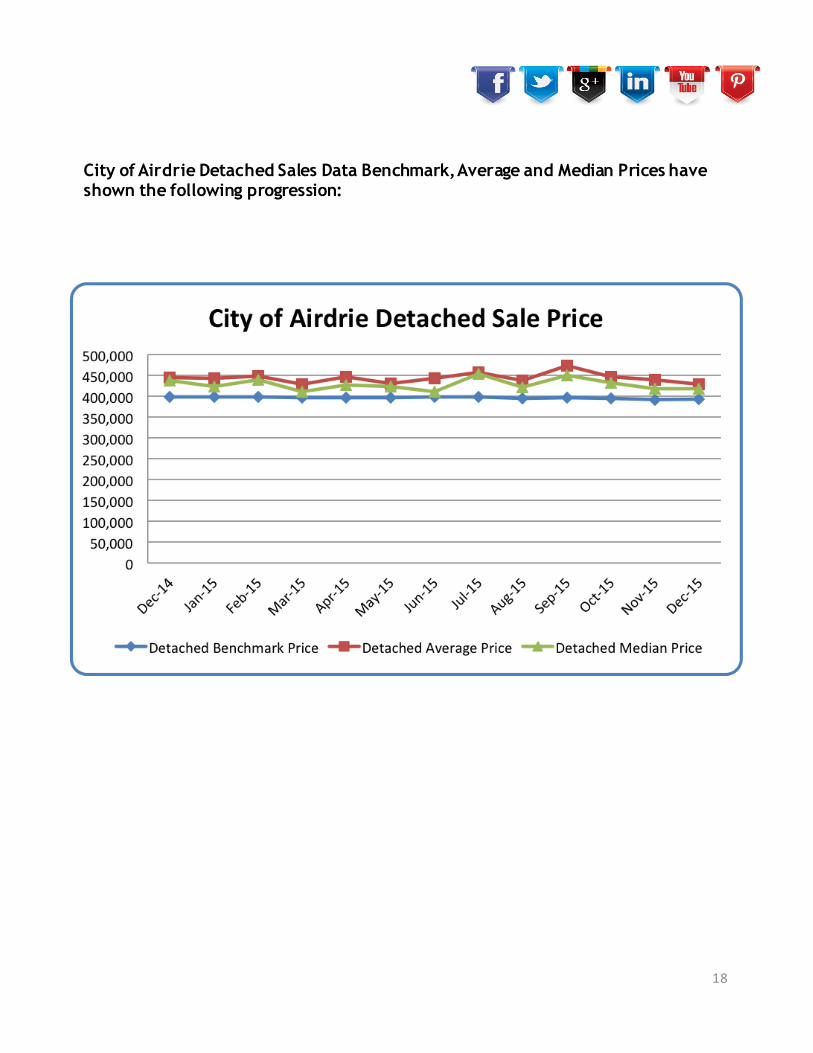
City of Airdrie Detached Sales Data Benchmark, Average and Median Prices have shown the following progression:
18

City of Airdrie Semi-Detached Sales DataYearly – January 2015 – January 2016
The following table shows the City of Airdrie Semi-Detached Sales Data for each month for the last year.
Month/Year Semi-detachedSales
PreviousMonthEndInventory+InventoryAdded
DuringtheMonth
%ofAvailableInventorySold
DaysonMarket
MonthsofSupply
January2015 3 4+20=24 12.50% 14 6.67
February2015 8 20+20=40 20.00% 42 3.38
March2015 12 27+11=38 31.60% 37 1.67
April2015 12 20+17=37 32.40% 29 1.83
May2015 9 22+12=34 26.50% 32 2.11
June2015 12 19+20=39 30.80% 36 1.92
July2015 16 23+13=36 44.44% 35 1.31
August2015 12 21+16=37 32.40% 50 1.67
September2015 8 20+11=31 25.80% 26 2.88
October2015 9 23+10=33 27.30% 41 2.00
November2015 11 18+8=26 42.30% 29 1.45
December2015 4 16+5=21 19.00% 66 2.75
January2016 2 11+10=21 9.50% 41 8.50
City of Airdrie Semi-Detached Sales DataMonthly – January 2012 – January 2016
The following table shows the City of Airdrie Apartment Sales Data year over year for the last five years.
Month/Year Semi-detachedSales
PreviousMonthEndInventory+Inventory
AddedDuringtheMonth
%ofAvailableInventorySold
DaysonMarket
MonthsofSupply
January2012 2 11+6=17 11.80% 74 5.50
January2013 4 11+5=16 25.00% 57 2.50
January2014 3 6+7=13 23.10% 34 2.00
January2015 3 4+20=24 12.50% 14 6.67
January2016 2 11+10=21 9.50% 41 8.50
19
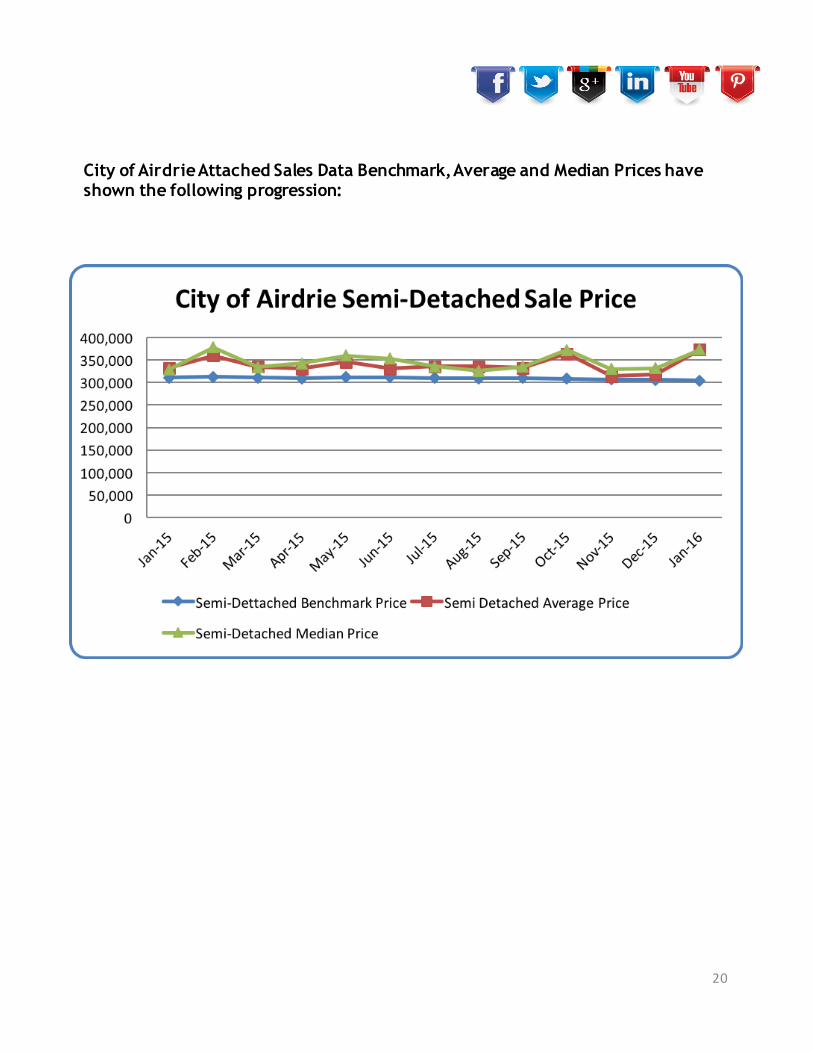
City of Airdrie Attached Sales Data Benchmark, Average and Median Prices have shown the following progression:
20
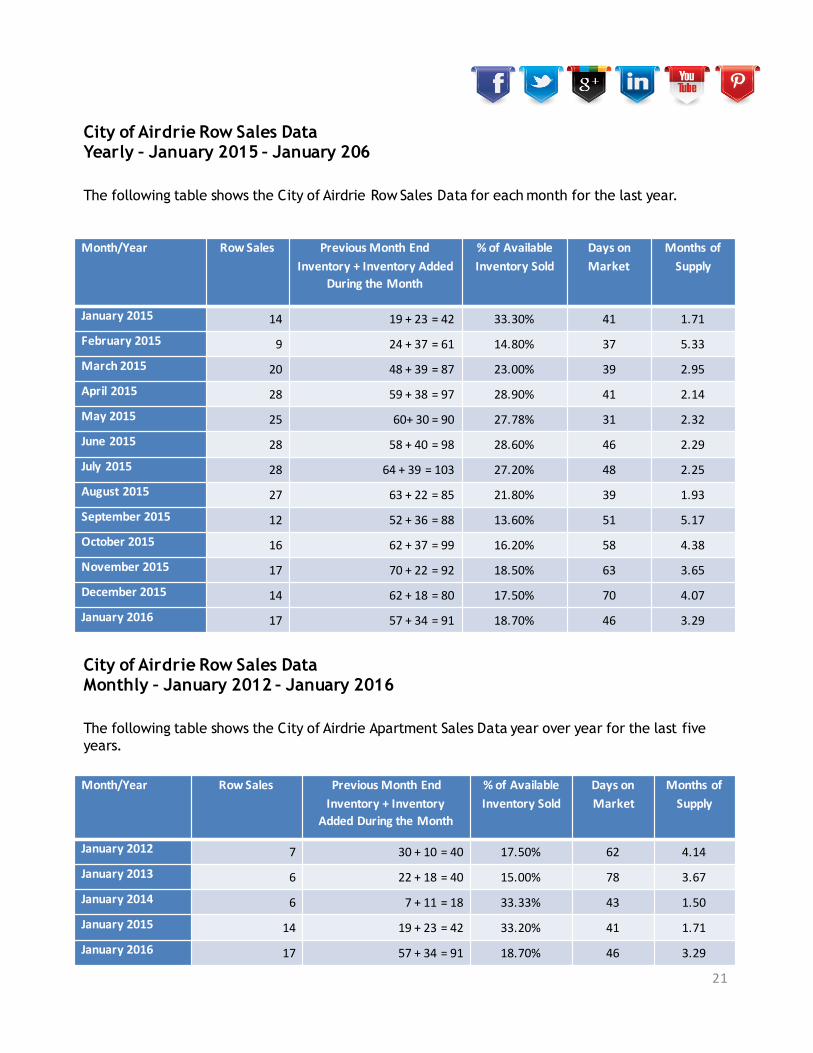
City of Airdrie Row Sales DataYearly – January 2015 – January 206
The following table shows the City of Airdrie Row Sales Data for each month for the last year.
Month/Year RowSales PreviousMonthEndInventory+InventoryAdded
DuringtheMonth
%ofAvailableInventorySold
DaysonMarket
MonthsofSupply
January2015 14 19+23=42 33.30% 41 1.71
February2015 9 24+37=61 14.80% 37 5.33
March2015 20 48+39=87 23.00% 39 2.95
April2015 28 59+38=97 28.90% 41 2.14
May2015 25 60+30=90 27.78% 31 2.32
June2015 28 58+40=98 28.60% 46 2.29
July2015 28 64+39=103 27.20% 48 2.25
August2015 27 63+22=85 21.80% 39 1.93
September2015 12 52+36=88 13.60% 51 5.17
October2015 16 62+37=99 16.20% 58 4.38
November2015 17 70+22=92 18.50% 63 3.65
December2015 14 62+18=80 17.50% 70 4.07
January2016 17 57+34=91 18.70% 46 3.29
City of Airdrie Row Sales DataMonthly – January 2012 – January 2016
The following table shows the City of Airdrie Apartment Sales Data year over year for the last five years.
Month/Year RowSales PreviousMonthEndInventory+Inventory
AddedDuringtheMonth
%ofAvailableInventorySold
DaysonMarket
MonthsofSupply
January2012 7 30+10=40 17.50% 62 4.14
January2013 6 22+18=40 15.00% 78 3.67
January2014 6 7+11=18 33.33% 43 1.50
January2015 14 19+23=42 33.20% 41 1.71
January2016 17 57+34=91 18.70% 46 3.29
21
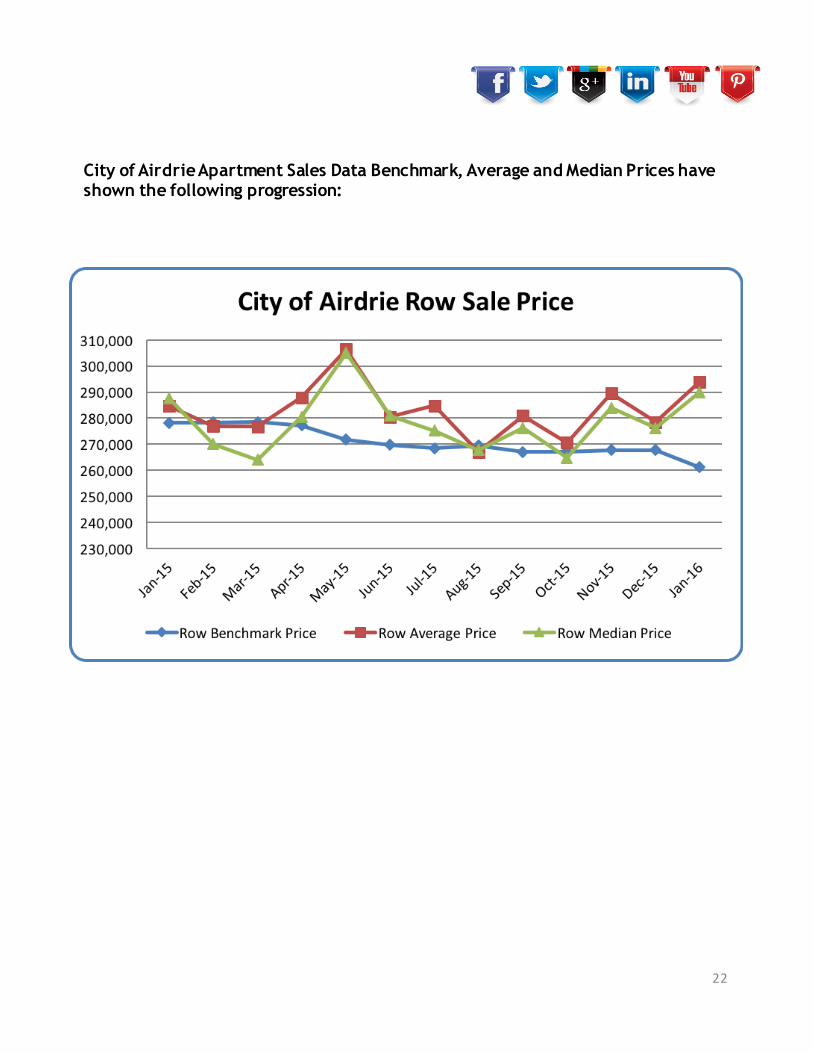
City of Airdrie Apartment Sales Data Benchmark, Average and Median Prices have shown the following progression:
22

City of Airdrie Apartment Sales DataYearly – January 2015 – January 2016
The following table shows the City of Airdrie Apartment Sales Data for each month for the last year.
Month/Year ApartmentSales
PreviousMonthEndInventory+InventoryAdded
DuringtheMonth
%ofAvailableInventorySold
DaysonMarket
MonthsofSupply
January2015 7 19+25=44 15.90% 40 5.14
February2015 12 35+25=60 20.00% 29 3.58
March2015 12 42+11=53 20.00% 50 2.77
April2015 6 36+19=55 10.90% 70 7.50
May2015 7 45+22=67 10.45% 36 7.14
June2015 9 50+26=76 11.84% 111 6.22
July2015 13 56+18=74 17.57%% 57 3.92
August2015 8 51+19=70 11.43% 61 5.88
September2015 12 47+17=64 18.75% 50 3.50
October2015 6 42+15=57 10.53% 57 6.00
November2015 6 36+6=42 14.29% 51 3.83
December2015 6 23+6=29 20.69% 55 3.17
January2016 3 19+21=40 7.50% 99 11.00
City of Airdrie Apartment Sales DataMonthly – January 2012 – January 2016
The following table shows the City of Airdrie Apartment Sales Data year over year for the last five years.
Month/Year ApartmentSales PreviousMonthEndInventory+Inventory
AddedDuringtheMonth
%ofAvailableInventorySold
DaysonMarket
MonthsofSupply
January2012 5 32+6=38 13.16% 75 5.80
January2013 7 15+12=27 25.93% 67 2.57
January2013 7 9+7=16 43.75% 38 0.71
January2014 7 19+25=44 15.90% 40 5.14
January2015 3 19+21=40 7.50% 99 11.00
23
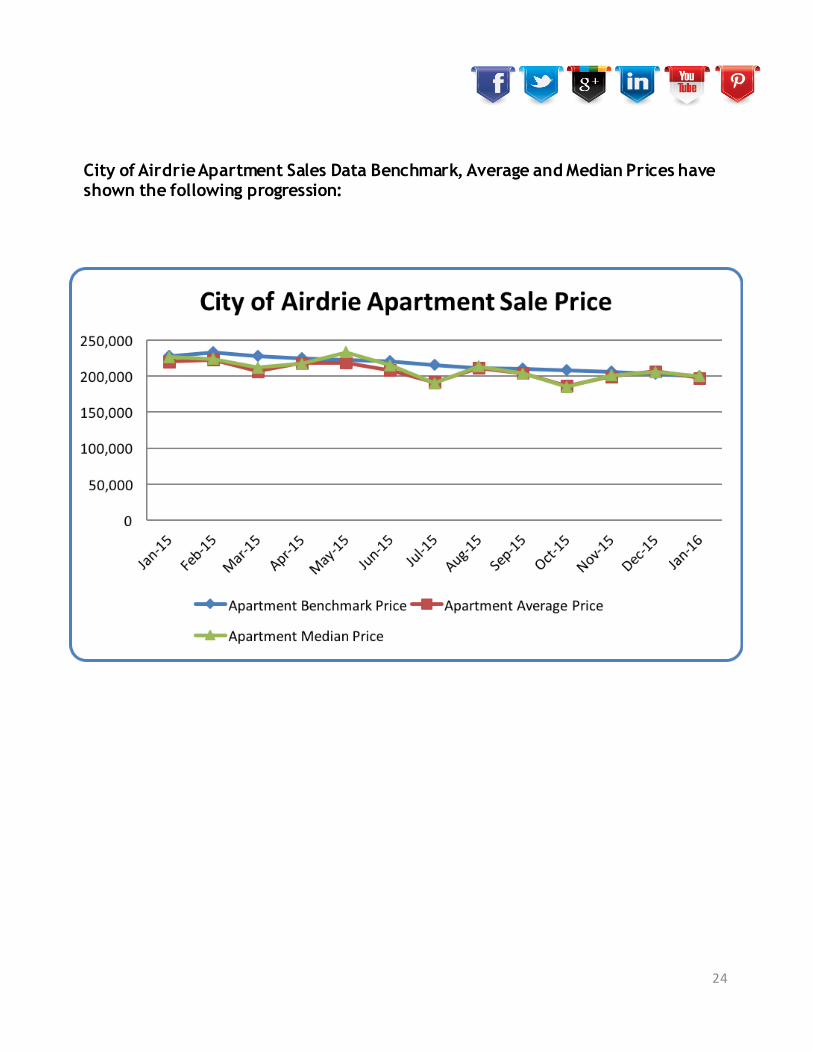
City of Airdrie Apartment Sales Data Benchmark, Average and Median Prices have shown the following progression:
24

Curious About theValue of Your Home?
Asyoucansee,currentmarketconditions playacriticalroleindeterminingthevalueofyourhome.
Equallyimportanthowever,ishavinganexperiencedandknowledgeableprofessionalRealtor®onyourside.
ColdwellBankerCompleteRealEstatewouldwelcometheopportunity todiscussanyofyourRealEstateneedsatyourconvenience.
#yesyoumatter
Request Your Free Home Evaluation Today!
ColdwellBankerCompleteRealEstatePhone: 403-686-1455
25