Embed Size (px)
Citation preview
Monthly Indicators A RESEARCH TOOL PROVIDED BY THE GREATER BOSTON ASSOCIATION OF REALTORS®
December 2014 Quick Facts
+ 1.3%Year-Over-Year(YoY) Change inClosed Sales
Single-Family Only
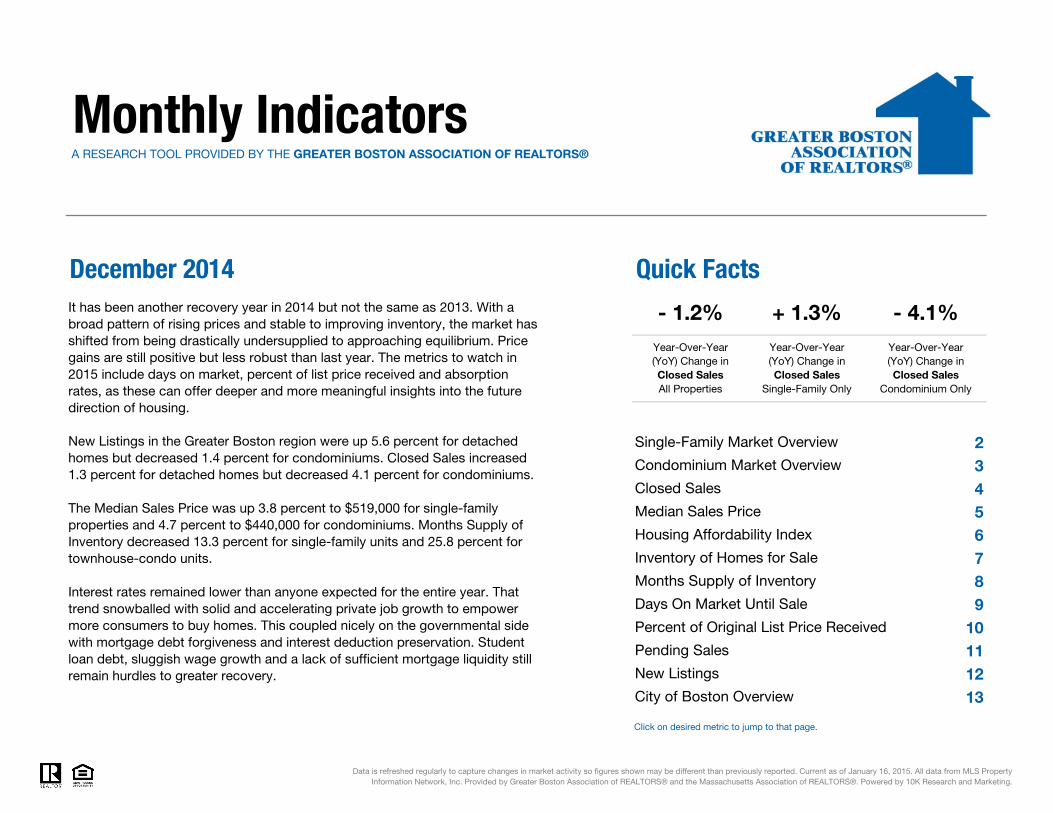
It has been another recovery year in 2014 but not the same as 2013. With a broad pattern of rising prices and stable to improving inventory, the market has shifted from being drastically undersupplied to approaching equilibrium. Price gains are still positive but less robust than last year. The metrics to watch in 2015 include days on market, percent of list price received and absorption rates, as these can offer deeper and more meaningful insights into the future direction of housing.
- 4.1%Year-Over-Year(YoY) Change inClosed Sales
Condominium Only
- 1.2%Year-Over-Year(YoY) Change inClosed SalesAll Properties
23456789
10111213
Data is refreshed regularly to capture changes in market activity so figures shown may be different than previously reported. Current as of January 16, 2015. All data from MLS PropertyInformation Network, Inc. Provided by Greater Boston Association of REALTORS® and the Massachusetts Association of REALTORS®. Powered by 10K Research and Marketing.
New Listings in the Greater Boston region were up 5.6 percent for detached homes but decreased 1.4 percent for condominiums. Closed Sales increased 1.3 percent for detached homes but decreased 4.1 percent for condominiums.
The Median Sales Price was up 3.8 percent to $519,000 for single-family properties and 4.7 percent to $440,000 for condominiums. Months Supply of Inventory decreased 13.3 percent for single-family units and 25.8 percent for townhouse-condo units.
Interest rates remained lower than anyone expected for the entire year. That trend snowballed with solid and accelerating private job growth to empower more consumers to buy homes. This coupled nicely on the governmental side with mortgage debt forgiveness and interest deduction preservation. Student loan debt, sluggish wage growth and a lack of sufficient mortgage liquidity still remain hurdles to greater recovery.
Single-Family Market Overview
Condominium Market Overview
Closed Sales
Median Sales Price
Housing Affordability Index
Inventory of Homes for Sale
Click on desired metric to jump to that page.
Months Supply of Inventory
Days On Market Until Sale
Percent of Original List Price Received
City of Boston Overview
Pending Sales
New Listings

Single-Family Market Overview Key market metrics for the current month and year-to-date figures for Single-Family Homes Only.
Key Metrics Historical Sparklines Dec-2013 Dec-2014 + / – YTD 2013 YTD 2014 + / –
Median Sales Price
- 12.2% -- --
- 3.2% 90 86 - 4.3%
--
Housing Affordability Index
Inventory of Homes for Sale
$500,000 + 5.0%
90 87
1,936 1,700
$519,000 + 3.8% $499,900
10,756 - 5.4%Closed Sales 900 912 + 1.3% 11,369
$525,000
12-2011 12-2012 12-2013 12-2014
12-2011 12-2012 12-2013 12-2014
12-2011 12-2012 12-2013 12-2014
12-2011 12-2012 12-2013 12-2014
97.0% 97.5%
- 4.0%
+ 0.5%Percent of OriginalList Price Received
Days on Market Until Sale
95.9%
+ 7.0%
- 0.5%
74
95.4%
Pending Sales - 3.2%11,025466 554 + 18.9% 11,394
Months Supply of Inventory 2.2
70 65
-- -- --1.9 - 13.3%
68
All data from MLS Property Information Network, Inc. Provided by the Greater Boston Association of REALTORS® and the Massachusetts Association of REALTORS®. Powered by 10K Research and Marketing. | Click for Cover Page | 2
New Listings 396 418 + 5.6% 14,538 14,651 + 0.8%
0 0 0 3 0
12-2011 12-2012 12-2013 12-2014
12-2011 12-2012 12-2013 12-2014
12-2011 12-2012 12-2013 12-2014
12-2011 12-2012 12-2013 12-2014
12-2011 12-2012 12-2013 12-2014

Condominium Market Overview Key market metrics for the current month and year-to-date figures for Condominium Properties Only.
Key Metrics Historical Sparklines Dec-2013 Dec-2014 + / – YTD 2013 YTD 2014 + / –
- 5.7%
Median Sales Price $420,400 $440,000 + 4.7% $405,000 $430,000 + 6.2%
Closed Sales 790 758 - 4.1% 10,378 9,791
- 5.4%
Inventory of Homes for Sale 1,321 940 - 28.8% -- -- --
Housing Affordability Index 107 102 - 4.0% 111 105
12-2011 12-2012 12-2013 12-2014
12-2011 12-2012 12-2013 12-2014
12-2011 12-2012 12-2013 12-2014
12-2011 12-2012 12-2013 12-2014
--
Days on Market Until Sale 55 52 - 5.3% 53 53 + 0.7%
Months Supply of Inventory 1.7 1.2 - 25.8% -- --
+ 0.6%
Pending Sales 413 452 + 9.4% 10,463 9,862 - 5.7%
Percent of OriginalList Price Received
98.0% 98.0% + 0.0% 98.9% 99.4%
- 6.3%
All data from MLS Property Information Network, Inc. Provided by the Greater Boston Association of REALTORS® and the Massachusetts Association of REALTORS®. Powered by 10K Research and Marketing. | Click for Cover Page | 3
New Listings 362 357 - 1.4% 12,653 11,859
0 0 0 3 0
12-2011 12-2012 12-2013 12-2014
12-2011 12-2012 12-2013 12-2014
12-2011 12-2012 12-2013 12-2014
12-2011 12-2012 12-2013 12-2014
12-2011 12-2012 12-2013 12-2014
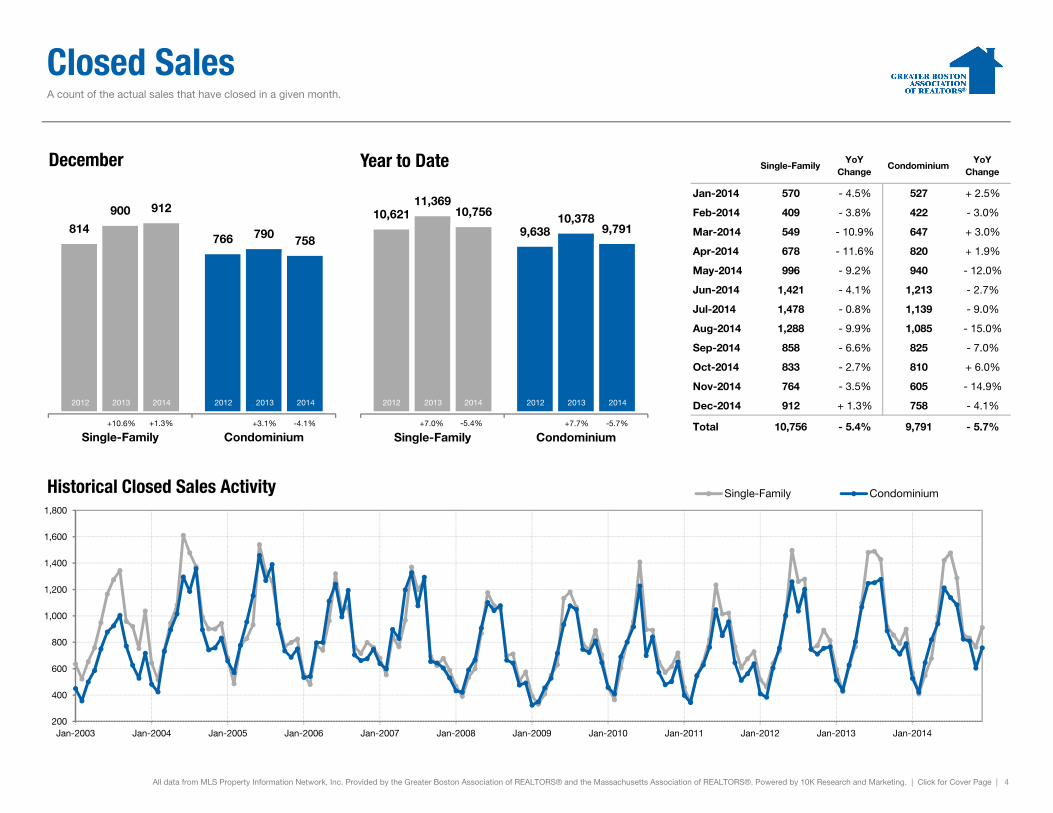
Closed Sales A count of the actual sales that have closed in a given month.
Single-FamilyYoY
ChangeCondominium
YoYChange
Jan-2014 570 - 4.5% 527 + 2.5%
Feb-2014 409 - 3.8% 422 - 3.0%
Mar-2014 549 - 10.9% 647 + 3.0%
Apr-2014 678 - 11.6% 820 + 1.9%
May-2014 996 - 9.2% 940 - 12.0%
Jun-2014 1,421 - 4.1% 1,213 - 2.7%
Jul-2014 1,478 - 0.8% 1,139 - 9.0%
Aug-2014 1,288 - 9.9% 1,085 - 15.0%
Sep-2014 858 - 6.6% 825 - 7.0%
Oct-2014 833 - 2.7% 810 + 6.0%
Nov-2014 764 - 3.5% 605 - 14.9%
Dec-2014 912 + 1.3% 758 - 4.1%
814766
900
790
912
758
December
20142013 20142013
10,6219,638
11,36910,37810,756
9,791
Year to Date
20142013 201420132012 2012 2012 2012
Total 10,756 - 5.4% 9,791 - 5.7%
All data from MLS Property Information Network, Inc. Provided by the Greater Boston Association of REALTORS® and the Massachusetts Association of REALTORS®. Powered by 10K Research and Marketing. | Click for Cover Page | 4
Single-Family Condominium
200
400
600
800
1,000
1,200
1,400
1,600
1,800
Jan-2003 Jan-2004 Jan-2005 Jan-2006 Jan-2007 Jan-2008 Jan-2009 Jan-2010 Jan-2011 Jan-2012 Jan-2013 Jan-2014
Historical Closed Sales Activity Single-Family Condominium
-4.1%+3.1%+10.6%
Single-Family Condominium-5.7%+7.7%+7.0%+1.3% -5.4%
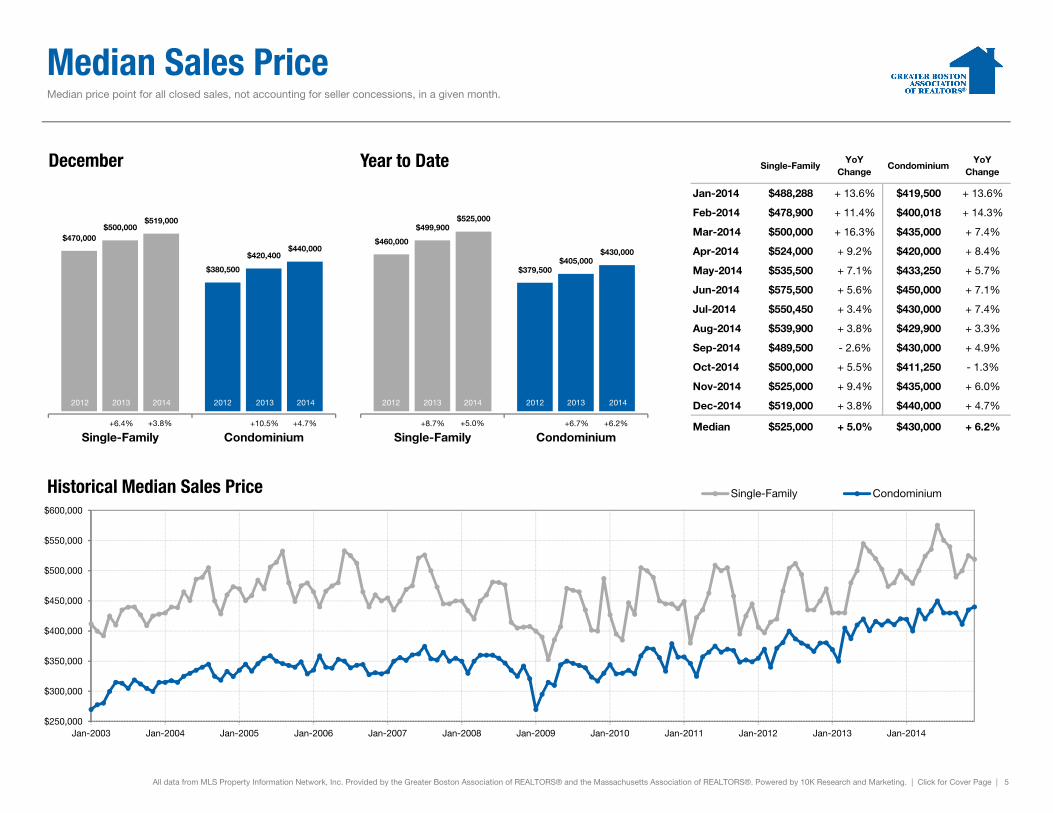
Median Sales Price Median price point for all closed sales, not accounting for seller concessions, in a given month.
Single-FamilyYoY
ChangeCondominium
YoYChange
Jan-2014 $488,288 + 13.6% $419,500 + 13.6%
Feb-2014 $478,900 + 11.4% $400,018 + 14.3%
Mar-2014 $500,000 + 16.3% $435,000 + 7.4%
Apr-2014 $524,000 + 9.2% $420,000 + 8.4%
May-2014 $535,500 + 7.1% $433,250 + 5.7%
Jun-2014 $575,500 + 5.6% $450,000 + 7.1%
Jul-2014 $550,450 + 3.4% $430,000 + 7.4%
Aug-2014 $539,900 + 3.8% $429,900 + 3.3%
Sep-2014 $489,500 - 2.6% $430,000 + 4.9%
Oct-2014 $500,000 + 5.5% $411,250 - 1.3%
Nov-2014 $525,000 + 9.4% $435,000 + 6.0%
Dec-2014 $519,000 + 3.8% $440,000 + 4.7%
$470,000
$380,500
$500,000
$420,400
$519,000
$440,000
December
20142013 20142013
$460,000
$379,500
$499,900
$405,000
$525,000
$430,000
Year to Date
20142013 201420132012 2012 2012 2012
Median $525,000 + 5.0% $430,000 + 6.2%
All data from MLS Property Information Network, Inc. Provided by the Greater Boston Association of REALTORS® and the Massachusetts Association of REALTORS®. Powered by 10K Research and Marketing. | Click for Cover Page | 5
Single-Family Condominium
$250,000
$300,000
$350,000
$400,000
$450,000
$500,000
$550,000
$600,000
Jan-2003 Jan-2004 Jan-2005 Jan-2006 Jan-2007 Jan-2008 Jan-2009 Jan-2010 Jan-2011 Jan-2012 Jan-2013 Jan-2014
Historical Median Sales Price Single-Family Condominium
+4.7%+10.5%+6.4%
Single-Family Condominium+6.2%+6.7%+8.7%+3.8% +5.0%
Housing Affordability Index
Single-FamilyYoY
ChangeCondominium
YoYChange
Jan-2014 87 - 22.9% 101 - 22.9%
Feb-2014 90 - 18.5% 108 - 20.5%
Mar-2014 86 - 21.5% 99 - 15.0%
Apr-2014 82 - 18.2% 102 - 17.6%
May-2014 82 - 11.3% 102 - 10.1%
Jun-2014 77 - 4.9% 98 - 6.2%
Jul-2014 80 - 3.7% 102 - 7.3%
Aug-2014 82 - 2.5% 103 - 2.1%
Sep-2014 89 + 1.4% 102 - 5.8%
Oct-2014 89 - 4.8% 108 + 1.8%
Nov-2014 85 - 12.9% 103 - 10.1%
Dec-2014 87 - 3.2% 102 - 4.0%
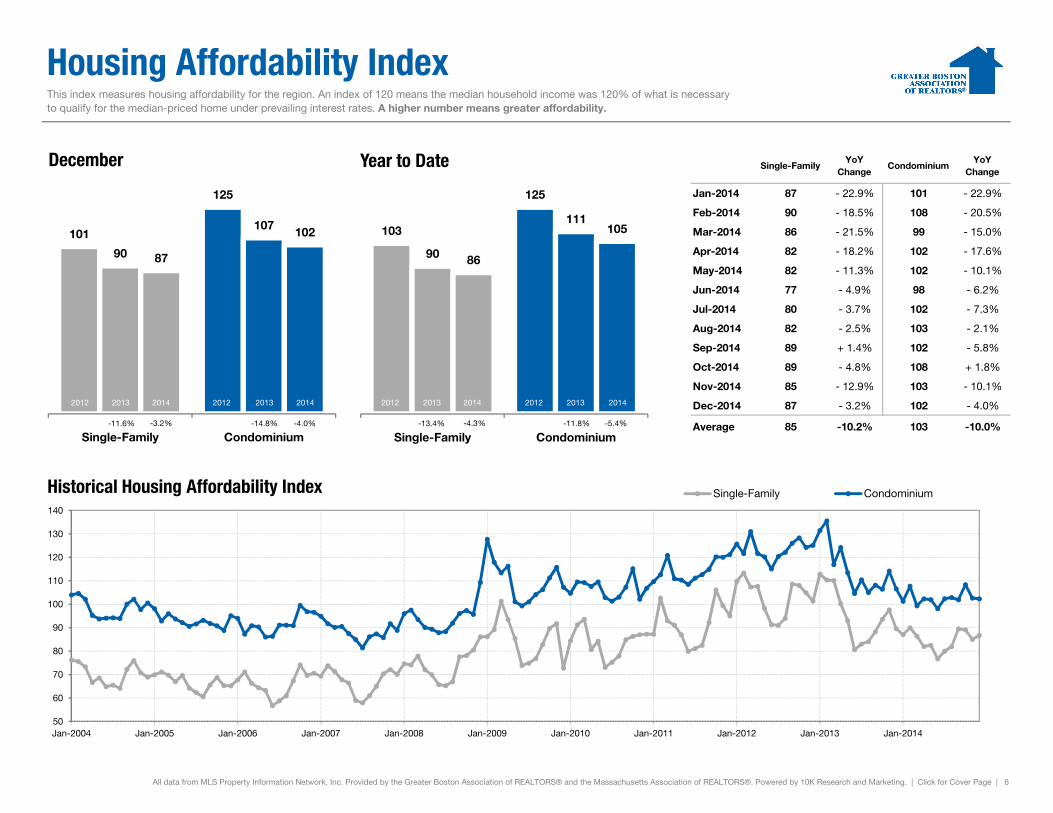
This index measures housing affordability for the region. An index of 120 means the median household income was 120% of what is necessary to qualify for the median-priced home under prevailing interest rates. A higher number means greater affordability.
101
125
90
107
87
102
December
103
125
90
111
86
105
Year to Date
20142013 20142013 20142013 201420132012 2012 2012 2012
Average 85 -10.2% 103 -10.0%
All data from MLS Property Information Network, Inc. Provided by the Greater Boston Association of REALTORS® and the Massachusetts Association of REALTORS®. Powered by 10K Research and Marketing. | Click for Cover Page | 6
Single-Family Condominium
50
60
70
80
90
100
110
120
130
140
Jan-2004 Jan-2005 Jan-2006 Jan-2007 Jan-2008 Jan-2009 Jan-2010 Jan-2011 Jan-2012 Jan-2013 Jan-2014
Historical Housing Affordability Index Single-Family Condominium
-4.0%-14.8%-11.6%
Single-Family Condominium-5.4%-11.8%-13.4%-3.2% -4.3%
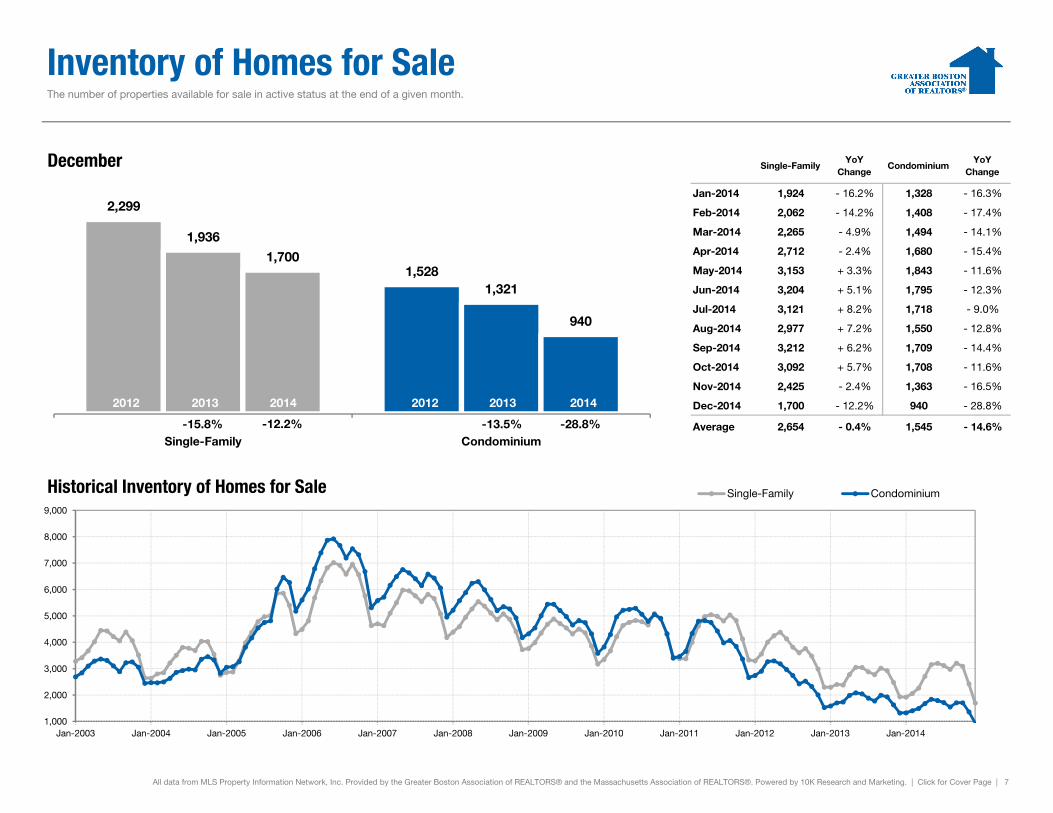
Inventory of Homes for Sale The number of properties available for sale in active status at the end of a given month.
Single-FamilyYoY
ChangeCondominium
YoYChange
Jan-2014 1,924 - 16.2% 1,328 - 16.3%
Feb-2014 2,062 - 14.2% 1,408 - 17.4%
Mar-2014 2,265 - 4.9% 1,494 - 14.1%
Apr-2014 2,712 - 2.4% 1,680 - 15.4%
May-2014 3,153 + 3.3% 1,843 - 11.6%
Jun-2014 3,204 + 5.1% 1,795 - 12.3%
Jul-2014 3,121 + 8.2% 1,718 - 9.0%
Aug-2014 2,977 + 7.2% 1,550 - 12.8%
Sep-2014 3,212 + 6.2% 1,709 - 14.4%
Oct-2014 3,092 + 5.7% 1,708 - 11.6%
Nov-2014 2,425 - 2.4% 1,363 - 16.5%
Dec-2014 1,700 - 12.2% 940 - 28.8%
2,299
1,528
1,936
1,321
1,700
940
December
20142013 201420132012 2012
Average 2,654 - 0.4% 1,545 - 14.6%
All data from MLS Property Information Network, Inc. Provided by the Greater Boston Association of REALTORS® and the Massachusetts Association of REALTORS®. Powered by 10K Research and Marketing. | Click for Cover Page | 7
Single-Family Condominium
1,000
2,000
3,000
4,000
5,000
6,000
7,000
8,000
9,000
Jan-2003 Jan-2004 Jan-2005 Jan-2006 Jan-2007 Jan-2008 Jan-2009 Jan-2010 Jan-2011 Jan-2012 Jan-2013 Jan-2014
Historical Inventory of Homes for Sale Single-Family Condominium
-28.8%-13.5%-15.8% -12.2%
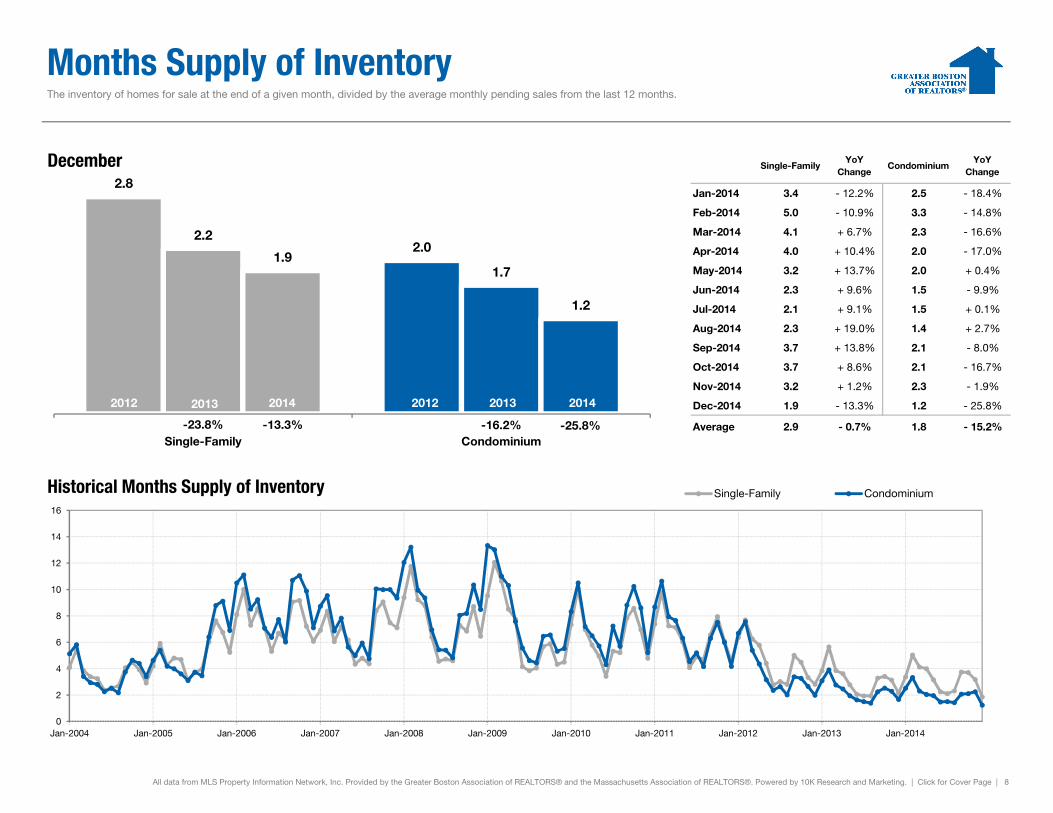
Months Supply of Inventory The inventory of homes for sale at the end of a given month, divided by the average monthly pending sales from the last 12 months.
Single-FamilyYoY
ChangeCondominium
YoYChange
Jan-2014 3.4 - 12.2% 2.5 - 18.4%
Feb-2014 5.0 - 10.9% 3.3 - 14.8%
Mar-2014 4.1 + 6.7% 2.3 - 16.6%
Apr-2014 4.0 + 10.4% 2.0 - 17.0%
May-2014 3.2 + 13.7% 2.0 + 0.4%
Jun-2014 2.3 + 9.6% 1.5 - 9.9%
Jul-2014 2.1 + 9.1% 1.5 + 0.1%
Aug-2014 2.3 + 19.0% 1.4 + 2.7%
Sep-2014 3.7 + 13.8% 2.1 - 8.0%
Oct-2014 3.7 + 8.6% 2.1 - 16.7%
Nov-2014 3.2 + 1.2% 2.3 - 1.9%
Dec-2014 1.9 - 13.3% 1.2 - 25.8%
2.8
2.02.2
1.71.9
1.2
December
20142013 201420132012 2012
Average 2.9 - 0.7% 1.8 - 15.2%
All data from MLS Property Information Network, Inc. Provided by the Greater Boston Association of REALTORS® and the Massachusetts Association of REALTORS®. Powered by 10K Research and Marketing. | Click for Cover Page | 8
Single-Family Condominium
0
2
4
6
8
10
12
14
16
Jan-2004 Jan-2005 Jan-2006 Jan-2007 Jan-2008 Jan-2009 Jan-2010 Jan-2011 Jan-2012 Jan-2013 Jan-2014
Historical Months Supply of Inventory Single-Family Condominium
-25.8%-16.2%-23.8% -13.3%
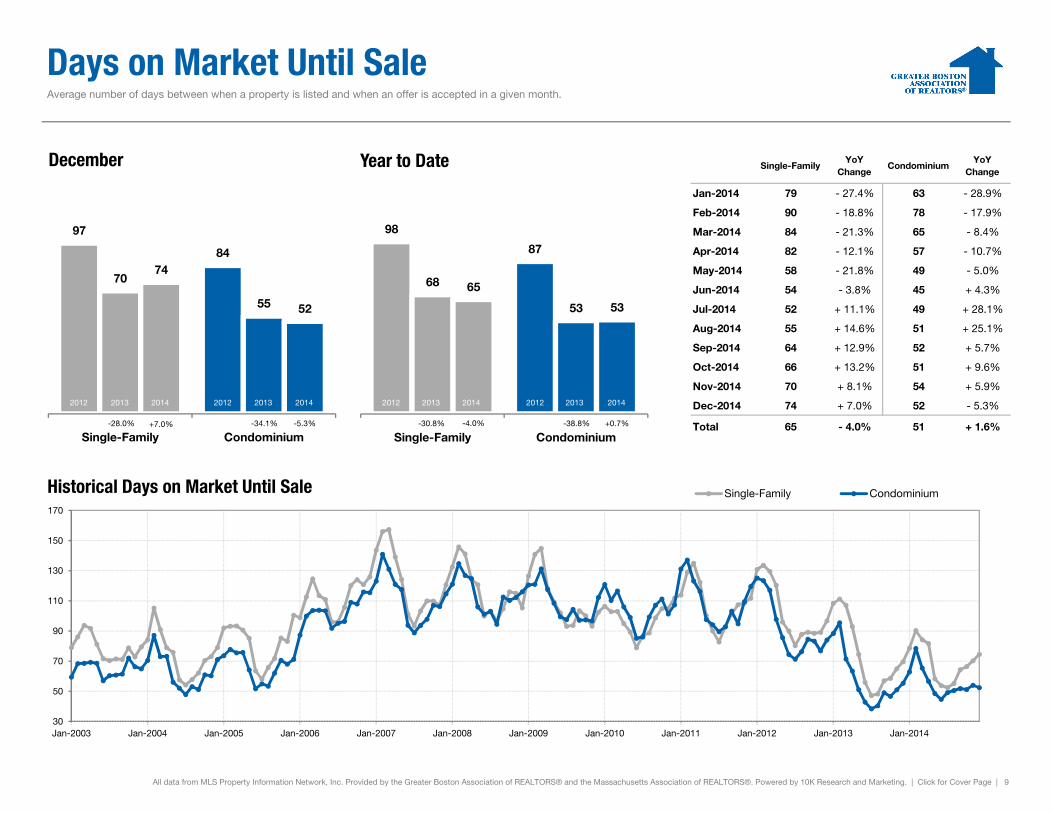
Days on Market Until Sale Average number of days between when a property is listed and when an offer is accepted in a given month.
Single-FamilyYoY
ChangeCondominium
YoYChange
Jan-2014 79 - 27.4% 63 - 28.9%
Feb-2014 90 - 18.8% 78 - 17.9%
Mar-2014 84 - 21.3% 65 - 8.4%
Apr-2014 82 - 12.1% 57 - 10.7%
May-2014 58 - 21.8% 49 - 5.0%
Jun-2014 54 - 3.8% 45 + 4.3%
Jul-2014 52 + 11.1% 49 + 28.1%
Aug-2014 55 + 14.6% 51 + 25.1%
Sep-2014 64 + 12.9% 52 + 5.7%
Oct-2014 66 + 13.2% 51 + 9.6%
Nov-2014 70 + 8.1% 54 + 5.9%
Dec-2014 74 + 7.0% 52 - 5.3%
97
84
70
55
74
52
December
98
87
68
53
65
53
Year to Date
20142013 20142013 20142013 201420132012 2012 2012 2012
Total 65 - 4.0% 51 + 1.6%
All data from MLS Property Information Network, Inc. Provided by the Greater Boston Association of REALTORS® and the Massachusetts Association of REALTORS®. Powered by 10K Research and Marketing. | Click for Cover Page | 9
Single-Family Condominium
30
50
70
90
110
130
150
170
Jan-2003 Jan-2004 Jan-2005 Jan-2006 Jan-2007 Jan-2008 Jan-2009 Jan-2010 Jan-2011 Jan-2012 Jan-2013 Jan-2014
Historical Days on Market Until Sale Single-Family Condominium
-5.3%-34.1%-28.0%
Single-Family Condominium+0.7%-38.8%-30.8%+7.0% -4.0%
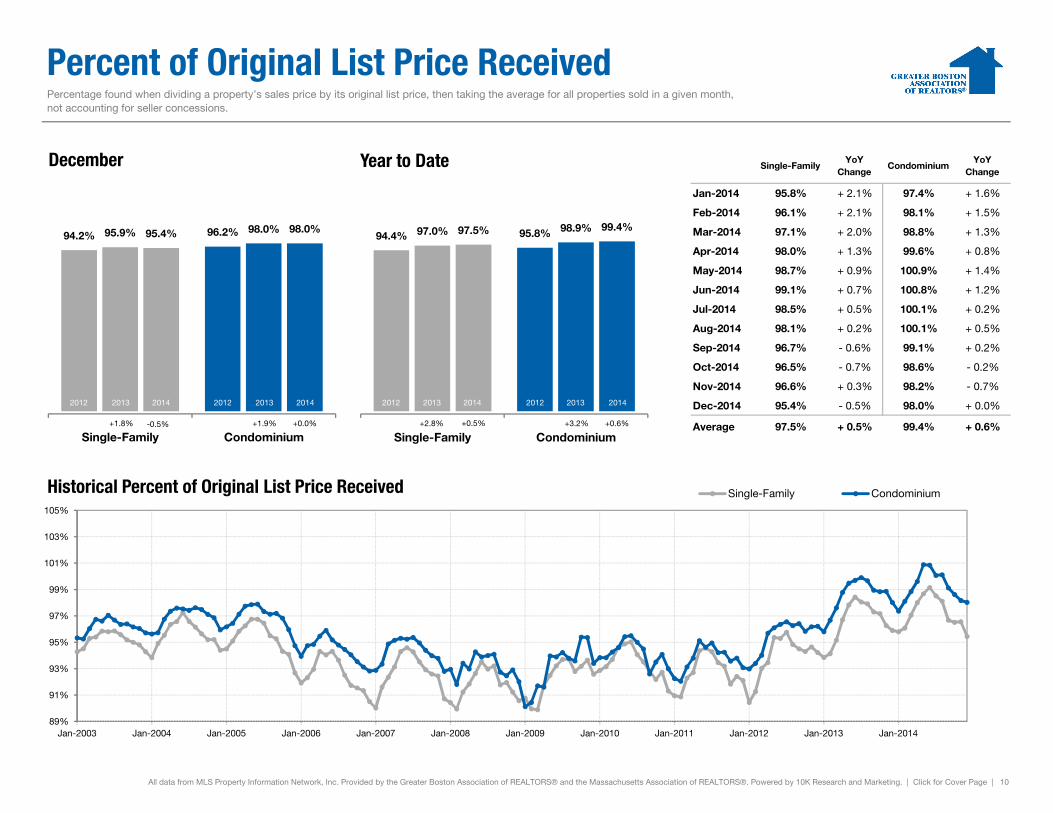
Percent of Original List Price Received
Single-FamilyYoY
ChangeCondominium
YoYChange
Jan-2014 95.8% + 2.1% 97.4% + 1.6%
Feb-2014 96.1% + 2.1% 98.1% + 1.5%
Mar-2014 97.1% + 2.0% 98.8% + 1.3%
Apr-2014 98.0% + 1.3% 99.6% + 0.8%
May-2014 98.7% + 0.9% 100.9% + 1.4%
Jun-2014 99.1% + 0.7% 100.8% + 1.2%
Jul-2014 98.5% + 0.5% 100.1% + 0.2%
Aug-2014 98.1% + 0.2% 100.1% + 0.5%
Sep-2014 96.7% - 0.6% 99.1% + 0.2%
Oct-2014 96.5% - 0.7% 98.6% - 0.2%
Nov-2014 96.6% + 0.3% 98.2% - 0.7%
Dec-2014 95.4% - 0.5% 98.0% + 0.0%
Percentage found when dividing a property’s sales price by its original list price, then taking the average for all properties sold in a given month, not accounting for seller concessions.
94.2% 96.2%95.9% 98.0%95.4% 98.0%
December
94.4% 95.8%97.0% 98.9%97.5% 99.4%
Year to Date
20142013 20142013 20142013 201420132012 2012 2012 2012
Average 97.5% + 0.5% 99.4% + 0.6%
All data from MLS Property Information Network, Inc. Provided by the Greater Boston Association of REALTORS® and the Massachusetts Association of REALTORS®. Powered by 10K Research and Marketing. | Click for Cover Page | 10
Single-Family Condominium
89%
91%
93%
95%
97%
99%
101%
103%
105%
Jan-2003 Jan-2004 Jan-2005 Jan-2006 Jan-2007 Jan-2008 Jan-2009 Jan-2010 Jan-2011 Jan-2012 Jan-2013 Jan-2014
Historical Percent of Original List Price Received Single-Family Condominium
+0.0%+1.9%+1.8%
Single-Family Condominium+0.6%+3.2%+2.8%-0.5% +0.5%
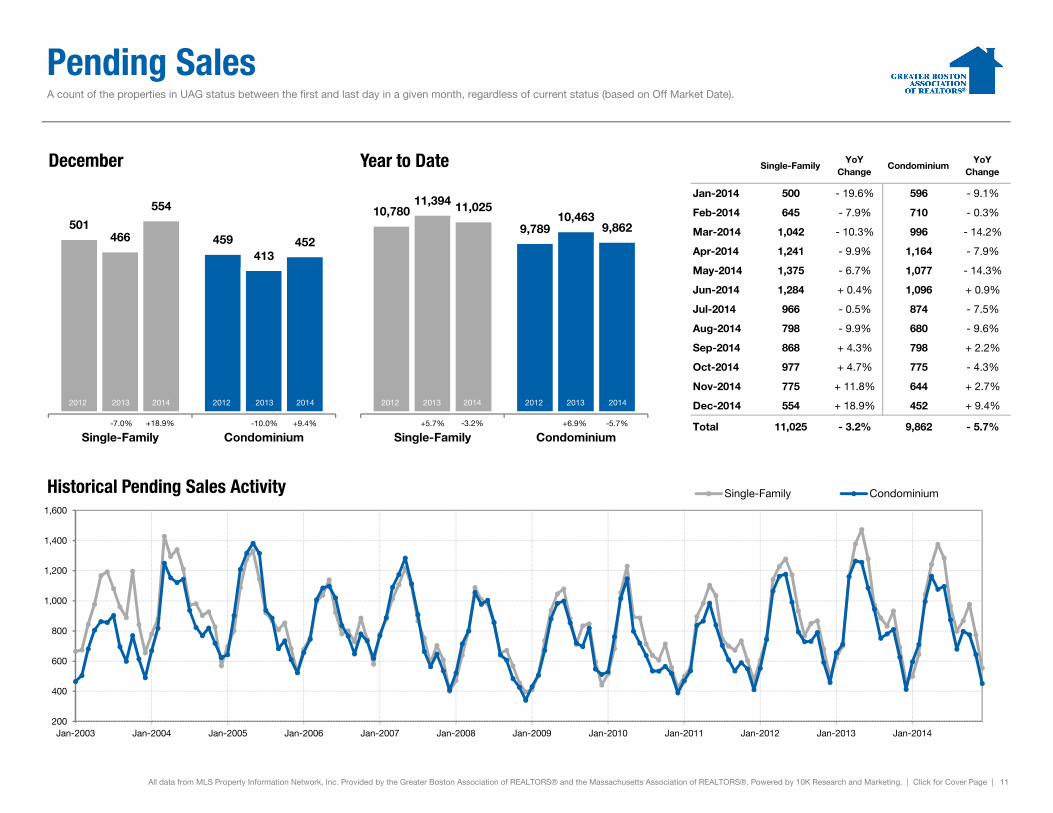
Pending Sales A count of the properties in UAG status between the first and last day in a given month, regardless of current status (based on Off Market Date).
Single-FamilyYoY
ChangeCondominium
YoYChange
Jan-2014 500 - 19.6% 596 - 9.1%
Feb-2014 645 - 7.9% 710 - 0.3%
Mar-2014 1,042 - 10.3% 996 - 14.2%
Apr-2014 1,241 - 9.9% 1,164 - 7.9%
May-2014 1,375 - 6.7% 1,077 - 14.3%
Jun-2014 1,284 + 0.4% 1,096 + 0.9%
Jul-2014 966 - 0.5% 874 - 7.5%
Aug-2014 798 - 9.9% 680 - 9.6%
Sep-2014 868 + 4.3% 798 + 2.2%
Oct-2014 977 + 4.7% 775 - 4.3%
Nov-2014 775 + 11.8% 644 + 2.7%
Dec-2014 554 + 18.9% 452 + 9.4%
501459466
413
554
452
December
10,7809,789
11,39410,463
11,025
9,862
Year to Date
20142013 20142013 20142013 201420132012 2012 2012 2012
Total 11,025 - 3.2% 9,862 - 5.7%
All data from MLS Property Information Network, Inc. Provided by the Greater Boston Association of REALTORS® and the Massachusetts Association of REALTORS®. Powered by 10K Research and Marketing. | Click for Cover Page | 11
Single-Family Condominium
200
400
600
800
1,000
1,200
1,400
1,600
Jan-2003 Jan-2004 Jan-2005 Jan-2006 Jan-2007 Jan-2008 Jan-2009 Jan-2010 Jan-2011 Jan-2012 Jan-2013 Jan-2014
Historical Pending Sales Activity Single-Family Condominium
+9.4%-10.0%-7.0%
Single-Family Condominium-5.7%+6.9%+5.7%+18.9% -3.2%
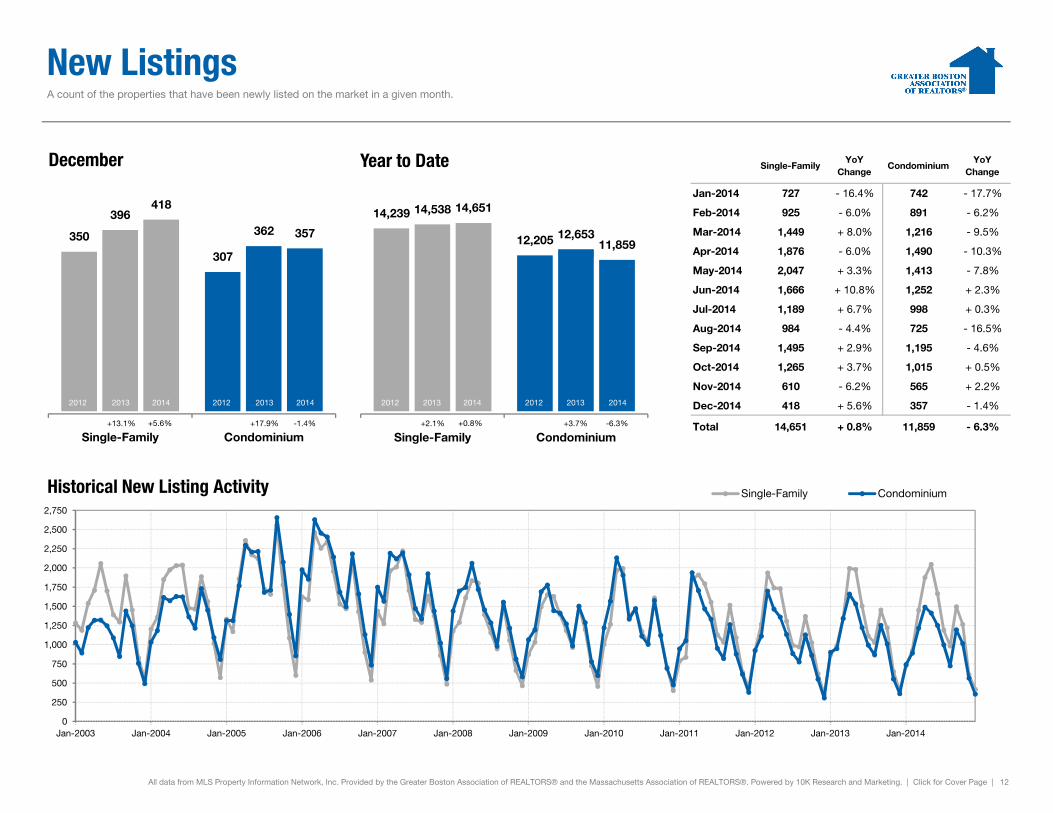
New Listings A count of the properties that have been newly listed on the market in a given month.
Single-FamilyYoY
ChangeCondominium
YoYChange
Jan-2014 727 - 16.4% 742 - 17.7%
Feb-2014 925 - 6.0% 891 - 6.2%
Mar-2014 1,449 + 8.0% 1,216 - 9.5%
Apr-2014 1,876 - 6.0% 1,490 - 10.3%
May-2014 2,047 + 3.3% 1,413 - 7.8%
Jun-2014 1,666 + 10.8% 1,252 + 2.3%
Jul-2014 1,189 + 6.7% 998 + 0.3%
Aug-2014 984 - 4.4% 725 - 16.5%
Sep-2014 1,495 + 2.9% 1,195 - 4.6%
Oct-2014 1,265 + 3.7% 1,015 + 0.5%
Nov-2014 610 - 6.2% 565 + 2.2%
Dec-2014 418 + 5.6% 357 - 1.4%
350
307
396362
418
357
December
14,239
12,205
14,538
12,653
14,651
11,859
Year to Date
20142013 20142013 20142013 201420132012 2012 2012 2012
Total 14,651 + 0.8% 11,859 - 6.3%
All data from MLS Property Information Network, Inc. Provided by the Greater Boston Association of REALTORS® and the Massachusetts Association of REALTORS®. Powered by 10K Research and Marketing. | Click for Cover Page | 12
Single-Family Condominium
0
250
500
750
1,000
1,250
1,500
1,750
2,000
2,250
2,500
2,750
Jan-2003 Jan-2004 Jan-2005 Jan-2006 Jan-2007 Jan-2008 Jan-2009 Jan-2010 Jan-2011 Jan-2012 Jan-2013 Jan-2014
Historical New Listing Activity Single-Family Condominium
-1.4%+17.9%+13.1%
Single-Family Condominium-6.3%+3.7%+2.1%+5.6% +0.8%
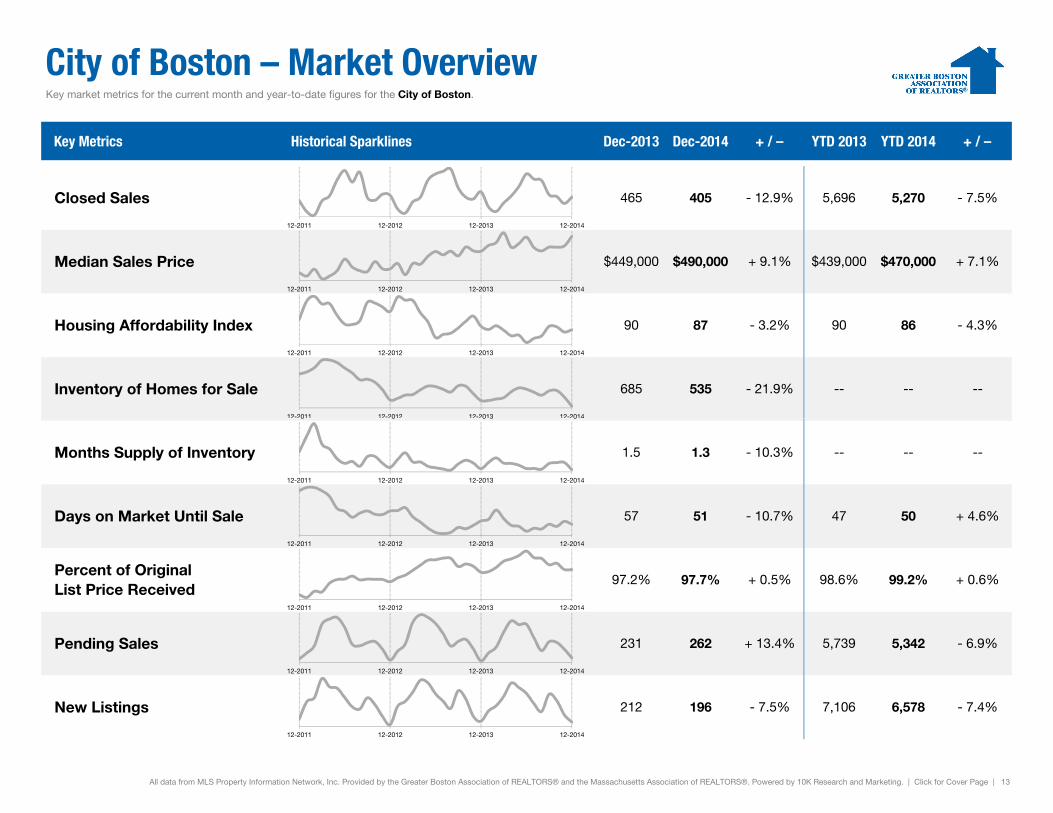
City of Boston – Market Overview Key market metrics for the current month and year-to-date figures for the City of Boston.
Key Metrics Historical Sparklines Dec-2013 Dec-2014 + / – YTD 2013 YTD 2014 + / –
- 7.5%
Median Sales Price $449,000 $490,000 + 9.1% $439,000 $470,000 + 7.1%
Closed Sales 465 405 - 12.9% 5,696 5,270
- 4.3%
Inventory of Homes for Sale 685 535 - 21.9% -- -- --
Housing Affordability Index 90 87 - 3.2% 90 86
12-2011 12-2012 12-2013 12-2014
12-2011 12-2012 12-2013 12-2014
12-2011 12-2012 12-2013 12-2014
12-2011 12-2012 12-2013 12-2014
--
Days on Market Until Sale 57 51 - 10.7% 47 50 + 4.6%
Months Supply of Inventory 1.5 1.3 - 10.3% -- --
+ 0.6%
Pending Sales 231 262 + 13.4% 5,739 5,342 - 6.9%
Percent of OriginalList Price Received
97.2% 97.7% + 0.5% 98.6% 99.2%
- 7.4%
All data from MLS Property Information Network, Inc. Provided by the Greater Boston Association of REALTORS® and the Massachusetts Association of REALTORS®. Powered by 10K Research and Marketing. | Click for Cover Page | 13
New Listings 212 196 - 7.5% 7,106 6,578
0 0 0 3 0
12-2011 12-2012 12-2013 12-2014
12-2011 12-2012 12-2013 12-2014
12-2011 12-2012 12-2013 12-2014
12-2011 12-2012 12-2013 12-2014
12-2011 12-2012 12-2013 12-2014


![The Greater Boston Housing Report Card 2019 Supply, …...The Greater Boston Housing Report Card 2019 | 13 [DEMOGRAPHICS] Racial diversity is increasing across most of Greater Boston](https://img.pdfslide.net/doc/110x75/5f063b8a7e708231d416f5d6/the-greater-boston-housing-report-card-2019-supply-the-greater-boston-housing.jpg)