Embed Size (px)
Citation preview

Table of
Contents
Key Statistics for December
Sales 2016 Residential Sales Stats Year-to-Year Total Sales by Map Area Median 2016 Median Sales Stats Year-to-Year Median Sales by Map Area Listings 2016 Active Listings by Map Area 2016 Total Active Listings vs. Total Sales Year-to-Year Active Listings by Map Area Inventory 2016 Months of Inventory by Map Area Year-to-Year Months of Inventory
Summary
About Hady Chahine Contact Information

Key Statistics for December
Back to Table of Contents
= trending positive = trending positive
= trending negative = trending negative
Month-to-Month Comparison Nov 2016 Dec 2016 Delta (qty) Delta (%) Increase Decrease
Total Sales 16 12 -4 -25.00%
Median Sales Price 1,449,500 1,435,863 (13,637) -0.94%
Median Days to Sell 33 27 -6 -18.18%
Listings 62 54 -8 -12.90%
Sales/Listing Ratio 25.8% 22.2% -3.6% -13.95%
Months of Inventory 4.0 5.0 1 25.00%
Monthly Comparison Year-to-Year Dec 2015 Dec 2016 Delta Delta Increase Decrease
Total Sales 21 12 -9 -42.86%
Median Sales Price 1,575,000 1,435,863 (139,137) -8.83%
Median Days to Sell 34 27 -7 -20.59%
Listings 47 54 7 14.89%
Months of Inventory 2.0 5.0 3 150.00%
Back to Table of Contents
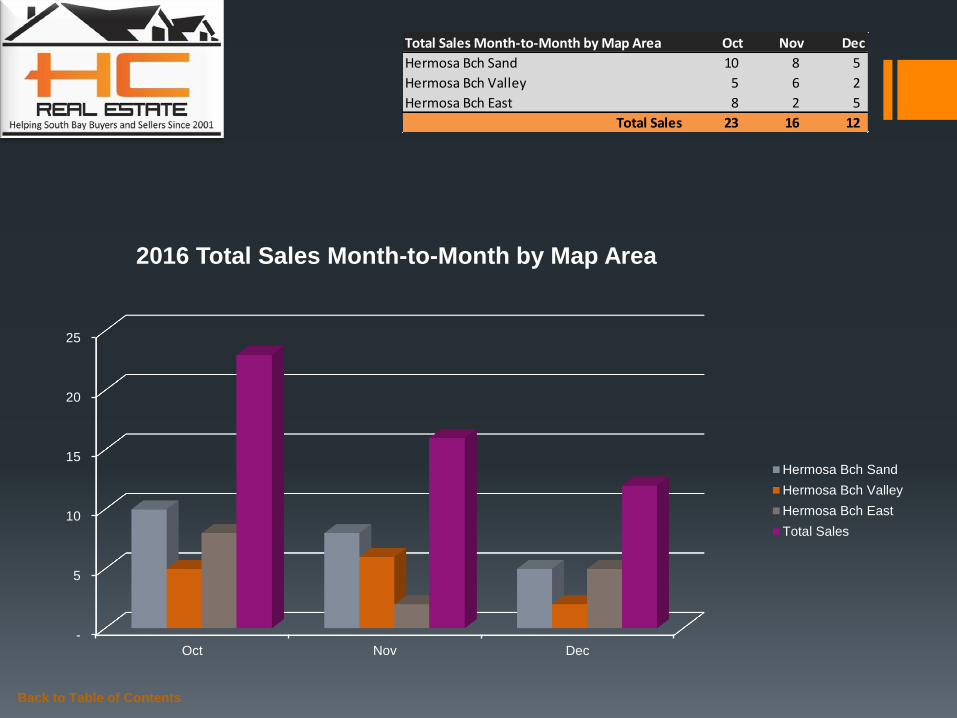
Total Sales Month-to-Month by Map Area Oct Nov Dec
Hermosa Bch Sand 10 8 5
Hermosa Bch Valley 5 6 2
Hermosa Bch East 8 2 5
Total Sales 23 16 12
-
5
10
15
20
25
Oct Nov Dec
2016 Total Sales Month-to-Month by Map Area
Hermosa Bch Sand
Hermosa Bch Valley
Hermosa Bch East
Total Sales

Back to Table of Contents
Total Sales Year-to-Year by Map Area 2014 2015 2016
Hermosa Bch Sand 7 12 5
Hermosa Bch Valley 4 4 2
Hermosa Bch East 4 5 5
Total Sales 15 21 12
-
5
10
15
20
25
2014 2015 2016
Total Sales Year-to-Year by Map Area: December
Hermosa Bch Sand
Hermosa Bch Valley
Hermosa Bch East
Total Sales

Back to Table of Contents
Median Sales Price Month-to-Month by Map Area Oct Nov Dec
Hermosa Bch Sand 2,497,063 1,949,500 2,300,000
Hermosa Bch Valley 1,785,000 1,102,500 862,500
Hermosa Bch East 1,850,000 1,367,000 1,444,000
Market Median Sales Price 1,975,000 1,449,500 1,435,863
-
500,000
1,000,000
1,500,000
2,000,000
2,500,000
Oct Nov Dec
2016 Median Sales Price Month-to-Month by Map Area
Hermosa Bch Sand
Hermosa Bch Valley
Hermosa Bch East
Market Median Sales Price

Back to Table of Contents
Median Sales Price Year-to-Year by Map Area 2014 2015 2016
Hermosa Bch Sand 1,875,000 2,282,500 2,300,000
Hermosa Bch Valley 1,360,000 938,500 862,500
Hermosa Bch East 1,460,000 1,500,000 1,444,000
Market Median Sales Price 1,570,000 1,575,000 1,435,863
-
500,000
1,000,000
1,500,000
2,000,000
2,500,000
2014 2015 2016
Median Sales Price Year-to-Year by Map Area: December
Hermosa Bch Sand
Hermosa Bch Valley
Hermosa Bch East
Market Median Sales Price

Back to Table of Contents
Active Listings vs. Total Sales by Map Area Jan Feb Mar Apr May Jun Jul Aug Sep Oct Nov Dec
Hermosa Bch Sand 21 24 24 36 35 40 48 41 42 35 33 31
Hermosa Bch Valley 11 9 8 10 13 13 11 13 17 16 11 11
Hermosa Bch East 6 11 19 25 19 19 18 16 13 18 18 12
Total Active Listings 38 44 51 71 67 72 77 70 72 69 62 54
-
5
10
15
20
25
30
35
40
45
50
Jan Feb Mar Apr May Jun Jul Aug Sep Oct Nov Dec
2016 Active Listings by Map Area
Hermosa Bch Sand
Hermosa Bch Valley
Hermosa Bch East

Back to Table of Contents
Active Listings vs. Total Sales by Map Area Jan Feb Mar Apr May Jun Jul Aug Sep Oct Nov Dec
Hermosa Bch Sand 21 24 24 36 35 40 48 41 42 35 33 31
Hermosa Bch Valley 11 9 8 10 13 13 11 13 17 16 11 11
Hermosa Bch East 6 11 19 25 19 19 18 16 13 18 18 12
Total Active Listings 38 44 51 71 67 72 77 70 72 69 62 54
Total Sales 10 18 16 18 18 22 23 26 20 23 16 12
Sales/Listings Ratio 26.3% 40.9% 31.4% 25.4% 26.9% 30.6% 29.9% 37.1% 27.8% 33.3% 25.8% 22.2%
-
10
20
30
40
50
60
70
80
Jan Feb Mar Apr May Jun Jul Aug Sep Oct Nov Dec
2016 Total Active Listings vs. Total Sales
Total Active Listings
Total Sales

Back to Table of Contents
Active Listings Year-to-Year by Map Area 2014 2015 2016
Hermosa Bch Sand 26 27 31
Hermosa Bch Valley 11 14 11
Hermosa Bch East 5 6 12
Total Active Listings 42 47 54
-
10
20
30
40
50
60
2014 2015 2016
Active Listings Year-to-Year by Map Area: December
Hermosa Bch Sand
Hermosa Bch Valley
Hermosa Bch East
Total Active Listings

Back to Table of Contents
Months of Inventory by Map Area Jan Feb Mar Apr May Jun Jul Aug Sep Oct Nov Dec
Hermosa Bch Sand 3.0 2.0 3.0 6.0 4.0 6.0 5.0 3.0 5.0 4.0 4.0 6.0
Hermosa Bch Valley 6.0 2.0 2.0 2.0 7.0 3.0 2.0 3.0 6.0 3.0 2.0 6.0
Hermosa Bch East 6.0 4.0 6.0 4.0 2.0 2.0 2.0 2.0 1.0 2.0 9.0 2.0
-
1.0
2.0
3.0
4.0
5.0
6.0
7.0
8.0
9.0
Jan Feb Mar Apr May Jun Jul Aug Sep Oct Nov Dec
2016 Months of Inventory by Map Area
Hermosa Bch Sand
Hermosa Bch Valley
Hermosa Bch East

Back to Table of Contents
Months of Inventory Year-to-Year Jan Feb Mar Apr May Jun Jul Aug Sep Oct Nov Dec
2014 3.0 3.0 5.0 2.0 3.0 3.0 3.0 2.0 2.0 3.0 4.0 2.0
2015 2.0 5.0 2.0 2.0 4.0 3.0 4.0 3.0 3.0 3.0 2.0 2.0
2016 4.0 2.0 3.0 4.0 4.0 3.0 3.0 3.0 4.0 3.0 4.0 5.0
-
0.5
1.0
1.5
2.0
2.5
3.0
3.5
4.0
4.5
5.0
Jan Feb Mar Apr May Jun Jul Aug Sep Oct Nov Dec
Months of Inventory Year-to-Year
2014
2015
2016

Summary Investment in Hermosa Beach residential properties stalled a bit in December as several key metrics unperformed month-over-month including total sales (-25%), median sales price (-0.94%), net listings (-12.9%), and the sales-listing ratio (-13.95%). During this time, however, the median days to sell improved 18.18%. Year-over-year months of inventory data point increased 150% from 2015 to 2016.
In December, C.A.R. reported ““Demand for homes continued to outstrip supply, causing the Unsold Inventory Index to decline to 3.1 months in November from 4.2 months in November 2015.” http://www.car.org/newsstand/newsreleases/2016releases/nov2016sales?view=Standard
For listing or buying questions or representation, or further information on market trending behavior, please feel free to contact me anytime. I look forward to hearing from you!
Back to Table of Contents
Month-to-Month Comparison Nov 2016 Dec 2016 Delta (qty) Delta (%) Increase Decrease
Total Sales 16 12 -4 -25.00%
Median Sales Price 1,449,500 1,435,863 (13,637) -0.94%
Median Days to Sell 33 27 -6 -18.18%
Listings 62 54 -8 -12.90%
Sales/Listing Ratio 25.8% 22.2% -3.6% -13.95%
Months of Inventory 4.0 5.0 1 25.00%
Monthly Comparison Year-to-Year Dec 2015 Dec 2016 Delta Delta Increase Decrease
Total Sales 21 12 -9 -42.86%
Median Sales Price 1,575,000 1,435,863 (139,137) -8.83%
Median Days to Sell 34 27 -7 -20.59%
Listings 47 54 7 14.89%
Months of Inventory 2.0 5.0 3 150.00%

About
Hady Chahine…
Serving South Bay Home Buyers and Sellers Since 2001
RE/MAX Top 4 Team in California – 2012
RE/MAX 100% Club - 2011
Shorewood Realtors Top 5% in Overall Sales 2001-2006, 2008-2010
Back to Table of Contents

The information being provided by CARETS (CLAW, CRISNet MLS, DAMLS, CRMLS, i-Tech MLS, and/or VCRDS) is for the visitor’s personal, non-commercial use and may not be used for
any purpose other than to identify prospective properties visitor may be interested in purchasing. Any information relating to a property referenced on this web site comes from the Internet
Data Exchange (IDX) program of CARETS. This web site may reference real estate listing(s) held by a brokerage firm other than the broker and/or agent who owns this web site. The accuracy
of all information, regardless of source, including but not limited to square footages and lot sizes, is deemed reliable but not guaranteed and should be personally verified through personal
inspection by and/or with the appropriate professionals.
Hady Chahine
• 310-404-5361
Back to Table of Contents
Listings MLS BLOG Website