Embed Size (px)
Citation preview

Introduction
• This is the Gera Pune Residential Realty Report for January ’15 to June ‘15. The last report was released in January ‘15.
• A total of 3,067 live projects were tracked after a comprehensive listing exercise covering a radius of 30 km from the Pune City Center ( Shivaji nagar)
• The methodology for collecting information is based on proprietary interviewing techniques developed in-house
© Gera Developments Pvt. Ltd. 2
Key Metrics Tracked
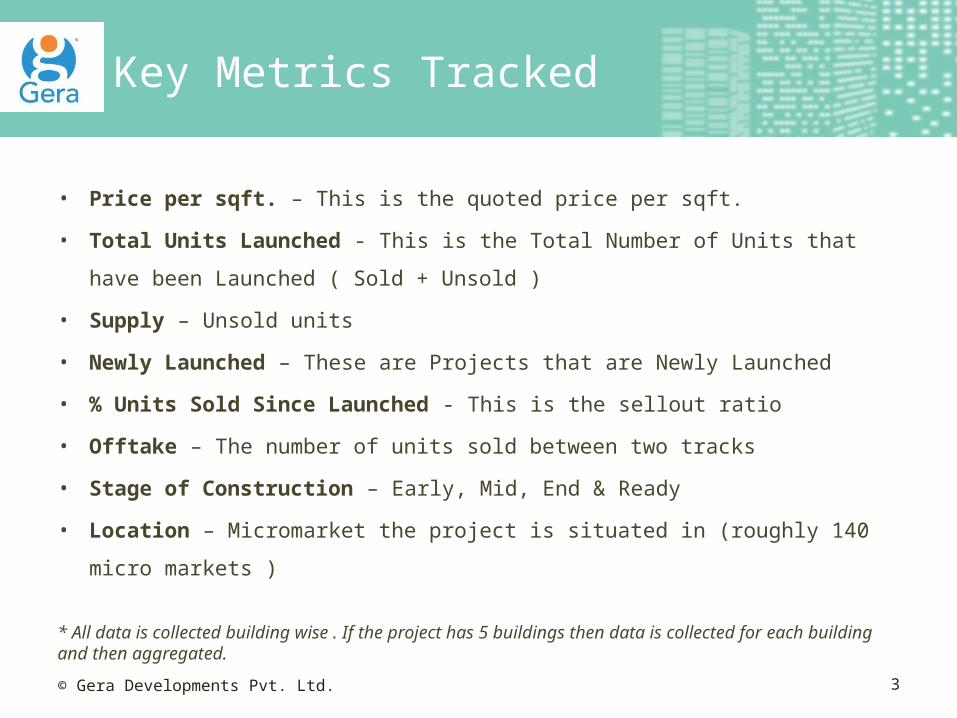
• Price per sqft. – This is the quoted price per sqft.
• Total Units Launched - This is the Total Number of Units that have
been Launched ( Sold + Unsold )
• Supply – Unsold units
• Newly Launched – These are Projects that are Newly Launched
• % Units Sold Since Launched - This is the sellout ratio
• Offtake – The number of units sold between two tracks
• Stage of Construction – Early, Mid, End & Ready
• Location – Micromarket the project is situated in (roughly 140 micro
markets )
* All data is collected building wise . If the project has 5 buildings then data is collected for each building and then aggregated. © Gera Developments Pvt. Ltd. 3

Executive Summary
• Residential market under stress
• Regulatory changes will add to the challenges
• Challenging & competitive times lead to the emergence of a better product, more customer centricity, greater customer focus on delivery track records
• Slow down in price appreciation from 12.47% for June ’12 – June ’13 to 10.03% from June ’13 – June ’14 and now down to 3.33% for June ’14 – June ’15
• The half yearly growth rate has also slowed down from 3.04% during the period June ’14 – Dec ’14 down to 0.27% for the period January ’15 - June ’15
© Gera Developments Pvt. Ltd. 4
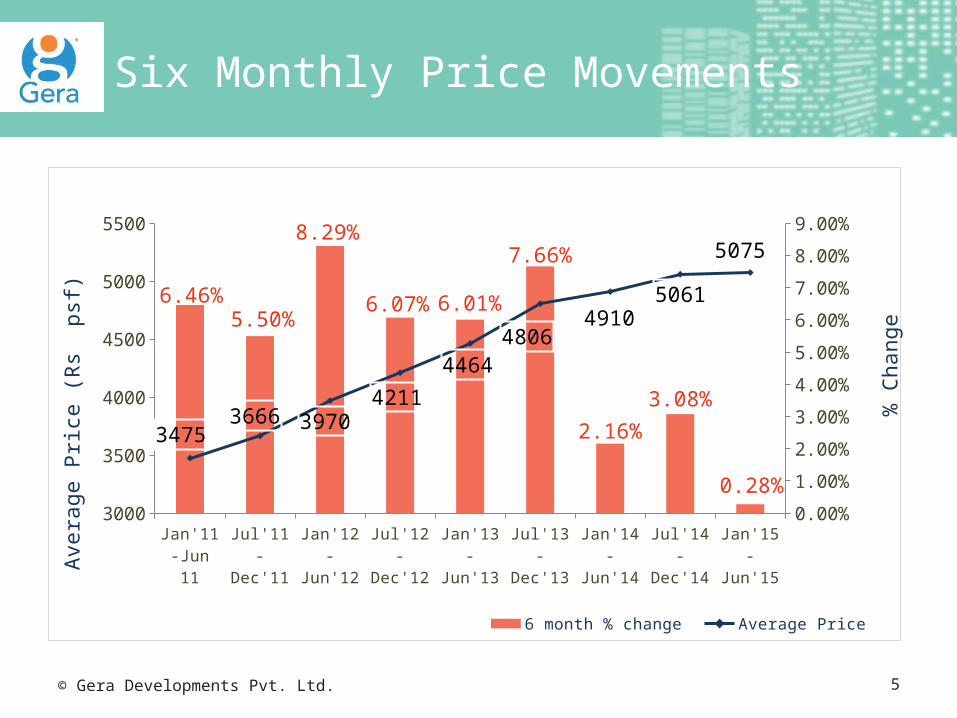
Six Monthly Price Movements
Jan'11 -Jun 11
Jul'11 -Dec'11
Jan'12 -Jun'12
Jul'12 -Dec'12
Jan'13 -Jun'13
Jul'13 -Dec'13
Jan'14 -Jun'14
Jul'14 -Dec'14
Jan'15 -Jun'15
3000
3500
4000
4500
5000
5500
0.00%
1.00%
2.00%
3.00%
4.00%
5.00%
6.00%
7.00%
8.00%
9.00%
6.46%5.50%
8.29%
6.07% 6.01%
7.66%
2.16%
3.08%
0.28%
34753666 3970
4211
44644806
49105061
5075
6 month % change Average Price
Ave
rage P
rice
(R
s p
sf)
% C
hange
© Gera Developments Pvt. Ltd. 5
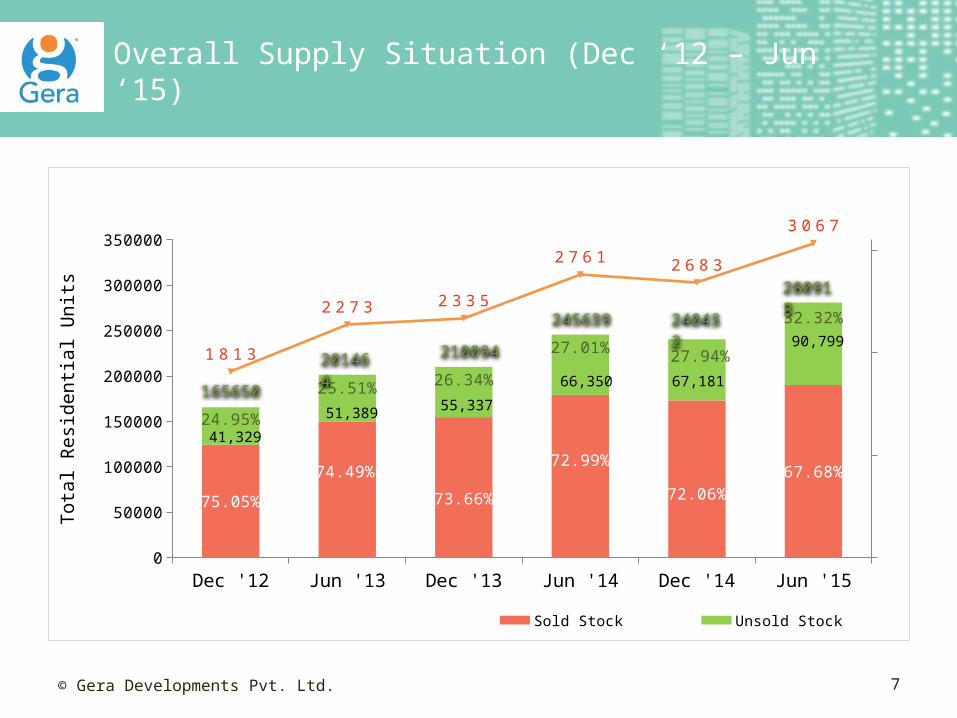
Overall Supply
• The past12 months has seen a significant increase of 14.36% in the gross inventory from 245,639 (June ’14) to 280,913 (June ’15) units
• The unsold stock (inventory with developers for sale) has shown a steep jump of 36.85% in the same period from 66,350 (June ’14) to 90,799 (June ’15) units
© Gera Developments Pvt. Ltd. 6
Overall Supply Situation (Dec ‘12 – Jun ‘15)
Dec '12 Jun '13 Dec '13 Jun '14 Dec '14 Jun '150
50000
100000
150000
200000
250000
300000
350000
75.05%
74.49%
73.66%
72.99%
72.06%67.68%
24.95%
25.51% 26.34%
27.01% 27.94%
32.32%
1 8 1 3
2 2 7 3 2 3 3 5
2 7 6 1 2 6 8 3
3 0 6 7
Sold Stock Unsold Stock No of Projects
To
tal R
esi
de
nti
al U
nit
s
165650
201464
210094
245639
280913
240432
© Gera Developments Pvt. Ltd. 7
90,799
67,18166,350
55,33751,389
41,329

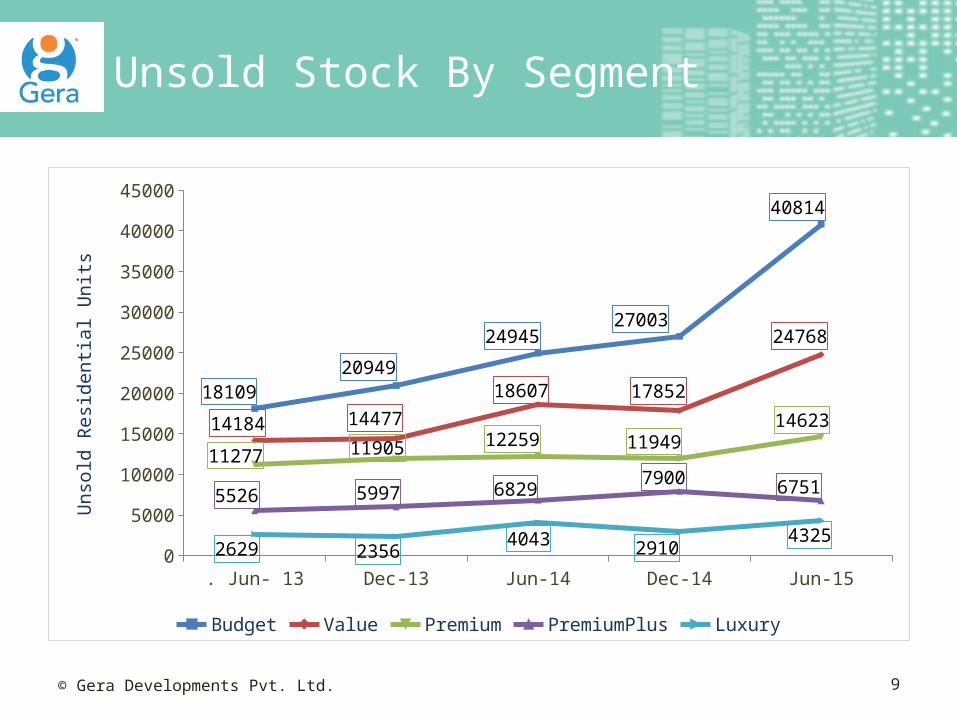
Unsold Stock By Segment
• The Budget Category (where prices presently are below Rs.4,247 psf) has seen an increase of 125% from 18,019 unsold units to 40,814 unsold units.
• The next highest increase is the Value Category (current prices between Rs.4,248 & Rs.5,309 psf) with an increase of 75% from 14,184 units to 24,768 units.
• The Luxury Segment has the next highest increase in unsold inventory at 65% from 2,629 units unsold rising to 4,325 units.
• The Premium and Premium Plus category have relatively low increases at 30% & 22% respectively.
© Gera Developments Pvt. Ltd. 8
Unsold Stock By Segment
. Jun- 13 Dec-13 Jun-14 Dec-14 Jun-150
5000
10000
15000
20000
25000
30000
35000
40000
45000
1810920949
2494527003
40814
14184 1447718607 17852
24768
11277 11905 12259 1194914623
5526 5997 68297900 6751
2629 23564043 2910
4325
Budget Value PremiumPremiumPlus Luxury
Un
sold
Re
sid
en
tia
l U
nit
s
© Gera Developments Pvt. Ltd. 9
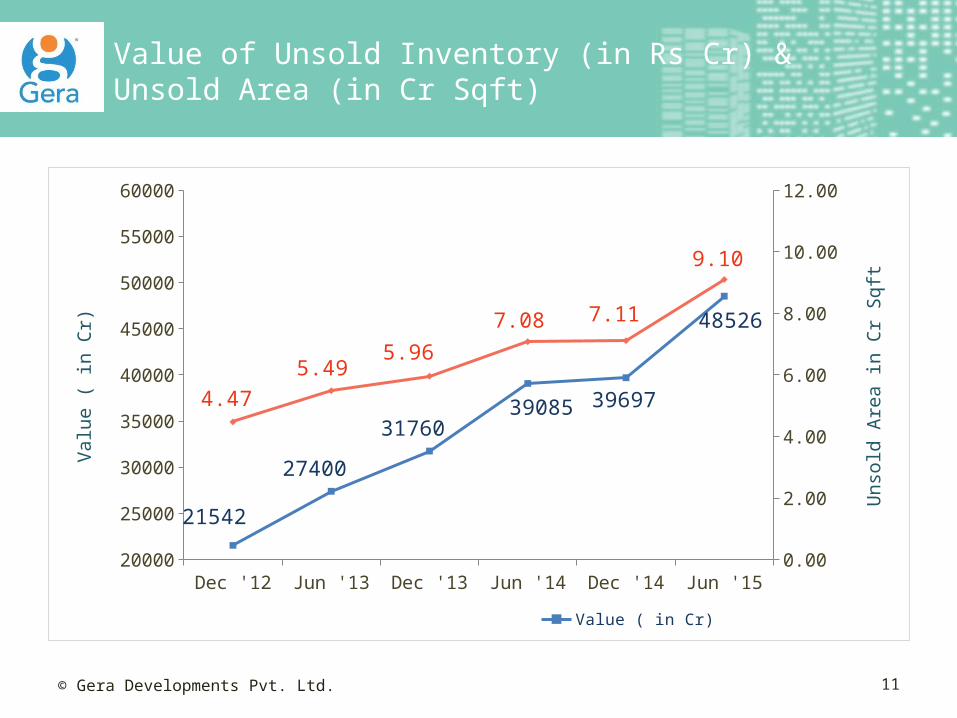
Value of Unsold Inventory (in Rs Cr) & Unsold Area (in Cr Sqft)
• The gross value of the unsold inventory stands at Rs.48,526 crores.
• Opportunity for the state government to garner nearly Rs.3000 crores by way of stamp duty, LBT & VAT.
© Gera Developments Pvt. Ltd. 10
Value of Unsold Inventory (in Rs Cr) & Unsold Area (in Cr Sqft)
Dec '12 Jun '13 Dec '13 Jun '14 Dec '14 Jun '1520000
25000
30000
35000
40000
45000
50000
55000
60000
0.00
2.00
4.00
6.00
8.00
10.00
12.00
21542
27400
3176039085 39697
48526
4.47
5.495.96
7.08 7.11
9.10
Value ( in Cr) Unsold area (in Cr Sqft)
Va
lue
( in
Cr)
Un
sold
Are
a in
Cr
Sq
ft
© Gera Developments Pvt. Ltd. 11
Fresh Supply Launched (PMC vs Non PMC)
• Only 24.55% of the stock added between January ’15 to June ’15 is within PMC limits indicating that most of the incremental stock is added outside the Pune Municipal Corporation limits.
• Indicates the growth of the city outward.
• Will lead to declining revenues by way of development charges and premiums for the PMC.
© Gera Developments Pvt. Ltd. 12
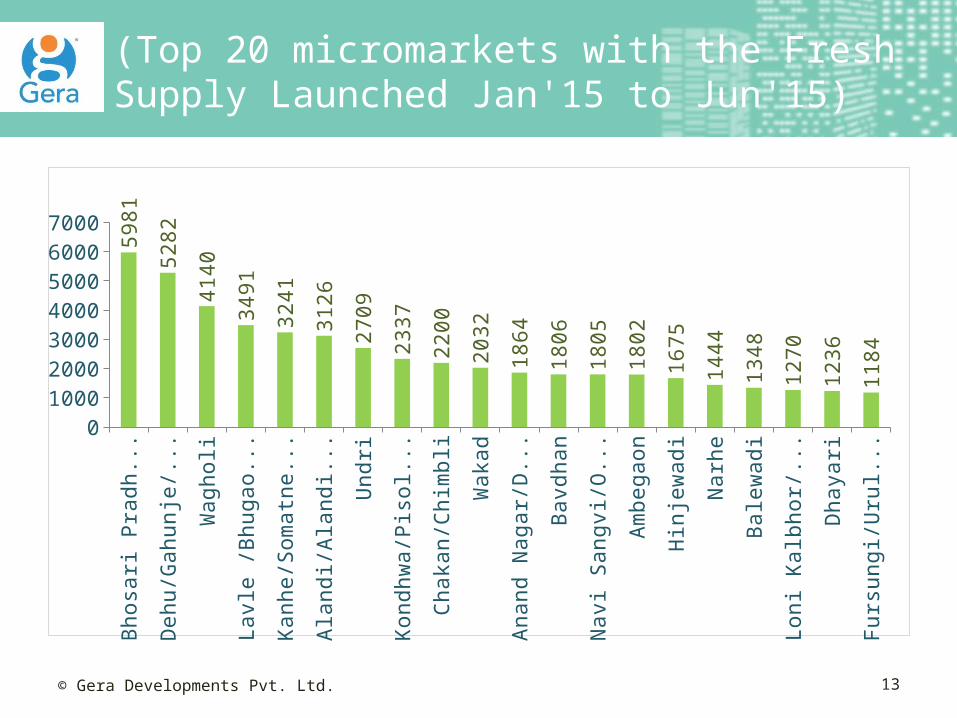
(Top 20 micromarkets with the Fresh Supply Launched Jan'15 to Jun'15)
Bhosa
ri P
radhik
a..
.
Dehu/G
ahunje
/K..
.
Wagholi
Lavl
e /
Bhugaon..
.
Kanhe/S
om
atn
e .
..
Ala
ndi/A
landi R
o..
.
Undri
Kondhw
a/P
isoli/
...
Chaka
n/C
him
bli
Waka
d
Anand N
agar/
Da..
.
Bavd
han
Navi
Sangvi
/Old
...
Am
begaon
Hin
jew
adi
Narh
e
Bale
wadi
Loni K
alb
hor/
Uru
...
Dhaya
ri
Furs
ungi/U
ruli
D..
.01000200030004000500060007000
5981
5282
4140
3491
3241
3126
2709
2337
2200
2032
1864
1806
1805
1802
1675
1444
1348
1270
1236
1184
© Gera Developments Pvt. Ltd. 13

Fresh supply launched (PMC vs Non PMC)
Dec '12 Jun '13 Dec '13 Jun '14 Dec '14 Jun '150
10000
20000
30000
40000
50000
60000
70000
20.00%
25.00%
30.00%
35.00%
40.00%
45.00%
43457
51746
40935
60066
46826
63998
13934 15222 16703 1803613483 15709
32.06%
29.42%
40.80%
30.03%28.79%
24.55%
Pune ( PMC + Non PMC) PMC % PMC to Pune
© Gera Developments Pvt. Ltd. 14

Top 10 Micromarkets with the Highest Price Gains in the last 2 years
All
Ma
rke
ts
Ara
nye
shw
ar.
..
Aku
rdi/N
igd
i...
Era
nd
wa
ne
/...
Ma
nja
ri
Fu
rsu
ng
i/U
ru..
.
Bo
at
Clu
b R
...
Ma
rke
t Y
ard
...
Wa
rje
Ka
tra
j/K
he
d..
.
Ch
inch
wa
d..
.0.00%
5.00%
10.00%
15.00%
20.00%
25.00%
30.00%
35.00%
40.00%
45.00%
13.6
7%
39.9
1%
29.8
1%
25.9
0%
22.6
8%
20.5
9%
18.5
7%
18.2
7%
17.9
2%
17.5
1%
17.1
4%
© Gera Developments Pvt. Ltd. 15
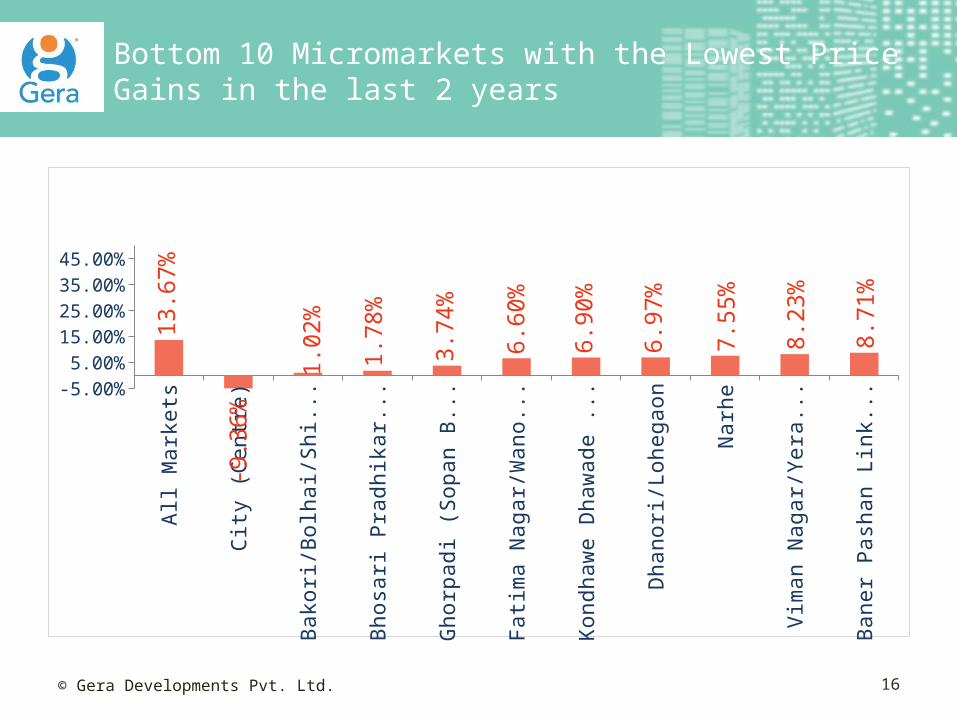
Bottom 10 Micromarkets with the Lowest Price Gains in the last 2 years
All
Mark
ets
Cit
y (C
entr
e)
Bako
ri/B
olh
ai/Shir
sat.
..
Bhosa
ri P
radhik
ara
n/C
...
Ghorp
adi (S
opan B
aug)
Fati
ma N
agar/
Wanow
r...
Kondhaw
e D
haw
ade /
...
Dhanori
/Lohegaon
Narh
e
Vim
an N
agar/
Yera
wada
Baner
Pash
an L
ink
R..
.-5.00%5.00%
15.00%25.00%35.00%45.00%
13.6
7%
-9.3
6%
1.0
2%
1.7
8%
3.7
4%
6.6
0%
6.9
0%
6.9
7%
7.5
5%
8.2
3%
8.7
1%
© Gera Developments Pvt. Ltd. 16
Conclusion
• Big picture shows a challenging scenario
• The market has expanded in terms of supply and at the same
time, while sales numbers have dropped, they continue to happen
• Prices will not see any significant correction unless something
drastic happens
• Regulatory impact will further push prices up when the time is
right (ReRA, MHA)
• Time is right to buy a home
• Govt. should focus on generating revenue by lowering tax rates
for faster sales, increased momentum & higher GDP
© Gera Developments Pvt. Ltd. 17