Embed Size (px)
Citation preview

TechnologyOfficeOutlook
United States2015
JLL TECHNOLOGY OFFICE OUTLOOK
tech’sfirmly planted roots
as well as opportunities for branching out.In examining
markets across the country for their attractiveness to the technology industry, we hope to showcase…
< 2 0 1 5 >
WHAT WE LEARNED < 2 0 1 5 >
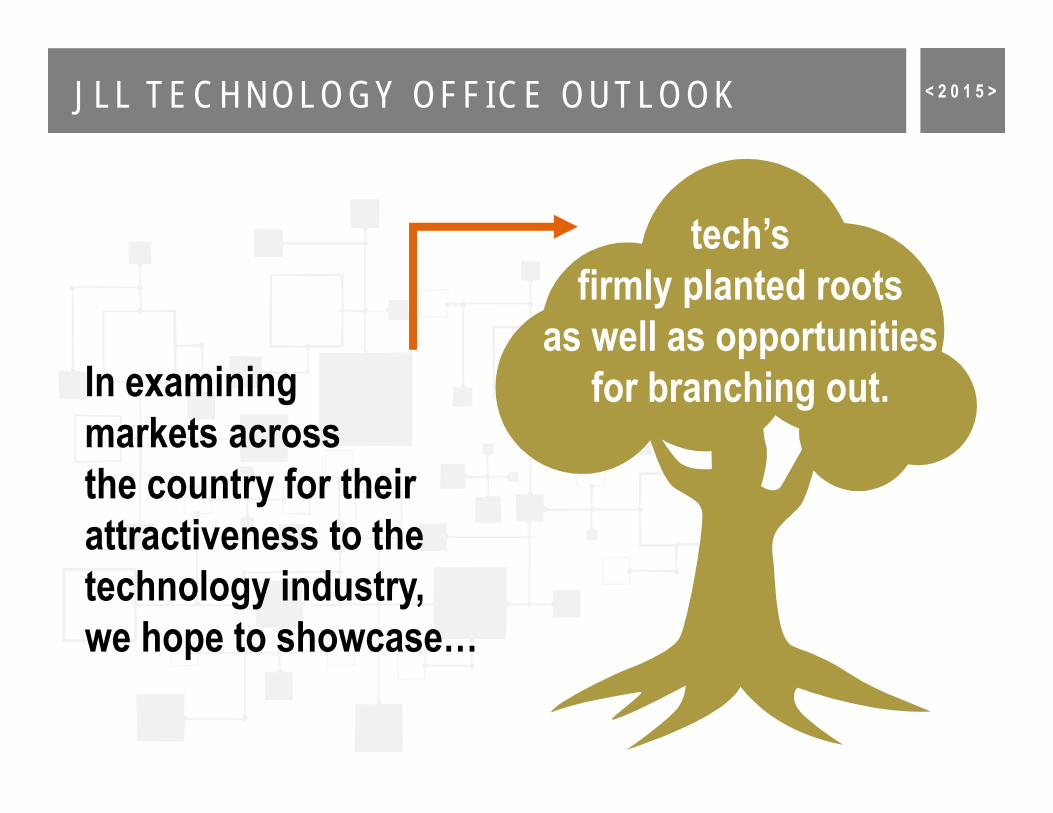
Proximity to a hub is not necessarily enough: Local markets with an existing techcluster that are also more affordable than the Bay Area will likely experience accelerated industry growth as firms explore new marketsfor expansion.
1.Secondary markets are quickly catching up: In 2015, roughly 60% of unicorn companies were located in San Francisco and Silicon Valley, down from almost 76% in 2014.
2.Startup momentum will cost you: Markets with the greatest startup momentum, characterized by access to capital, innovation and top talent (such as New York, San Francisco and Silicon Valley), are also the most expensive.
3.
EXAMINING 4 QUESTIONS < 2 0 1 5 >
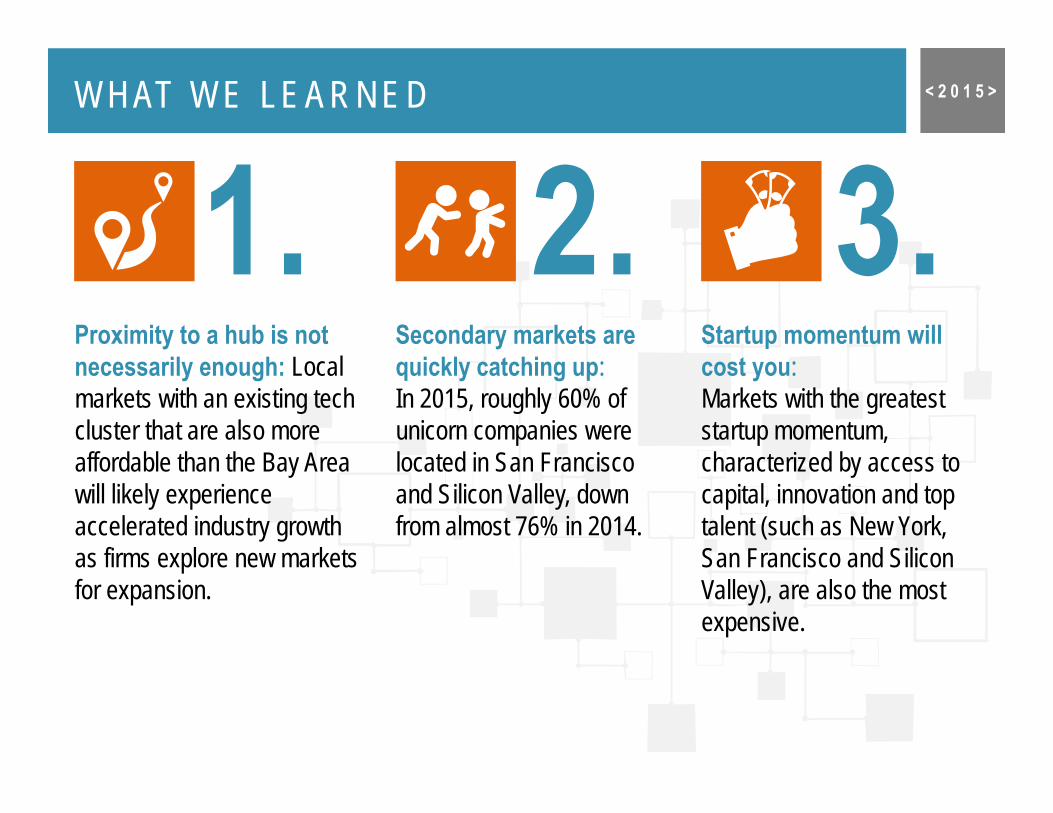
1. Where are companies leasing space and expanding?
3. Where are venture capitalists placing their bets?
4. What markets will become the next hotspots?
2. Where is the real estate cost highest and where can you find both value and talent to grow your company?
JLL TECHNOLOGY OFFICE OUTLOOK < 2 0 1 5 >
TECHis the elusive linchpin that
separates the growing companies from those that
are shrinking
JLL TECHNOLOGY OFFICE OUTLOOK < 2 0 1 5 >
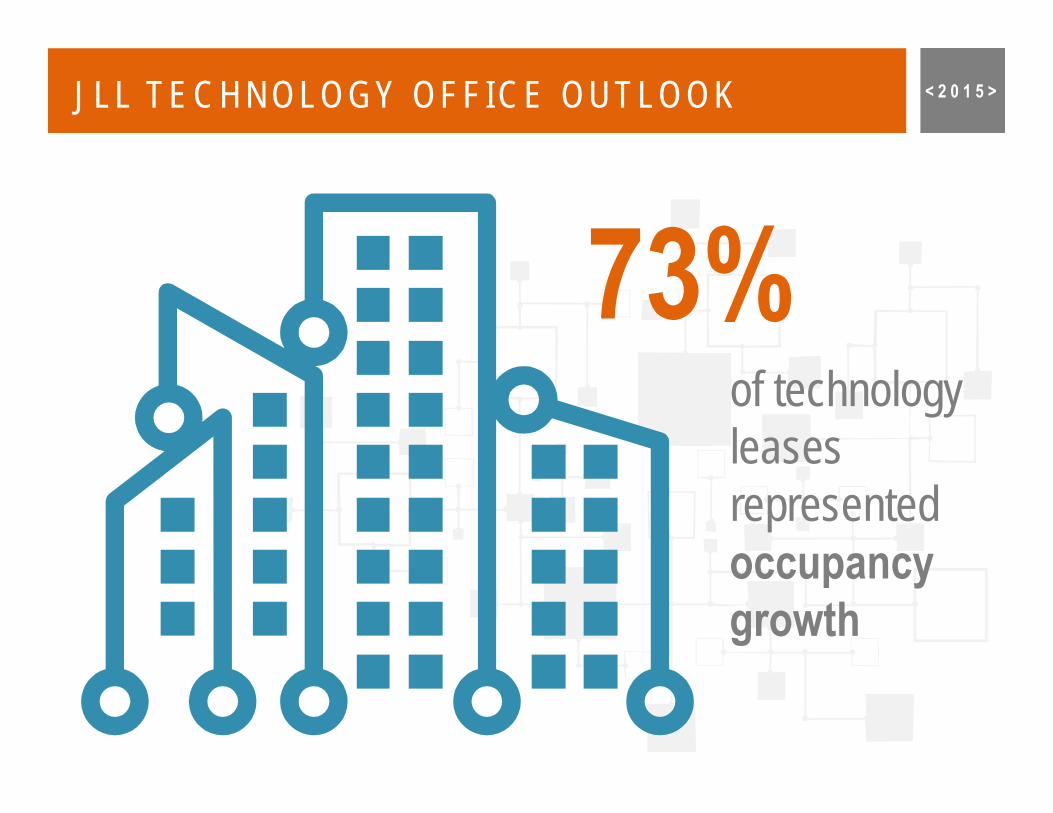
73% of technology leases represented occupancy growth
JLL TECHNOLOGY OFFICE OUTLOOK < 2 0 1 5 >
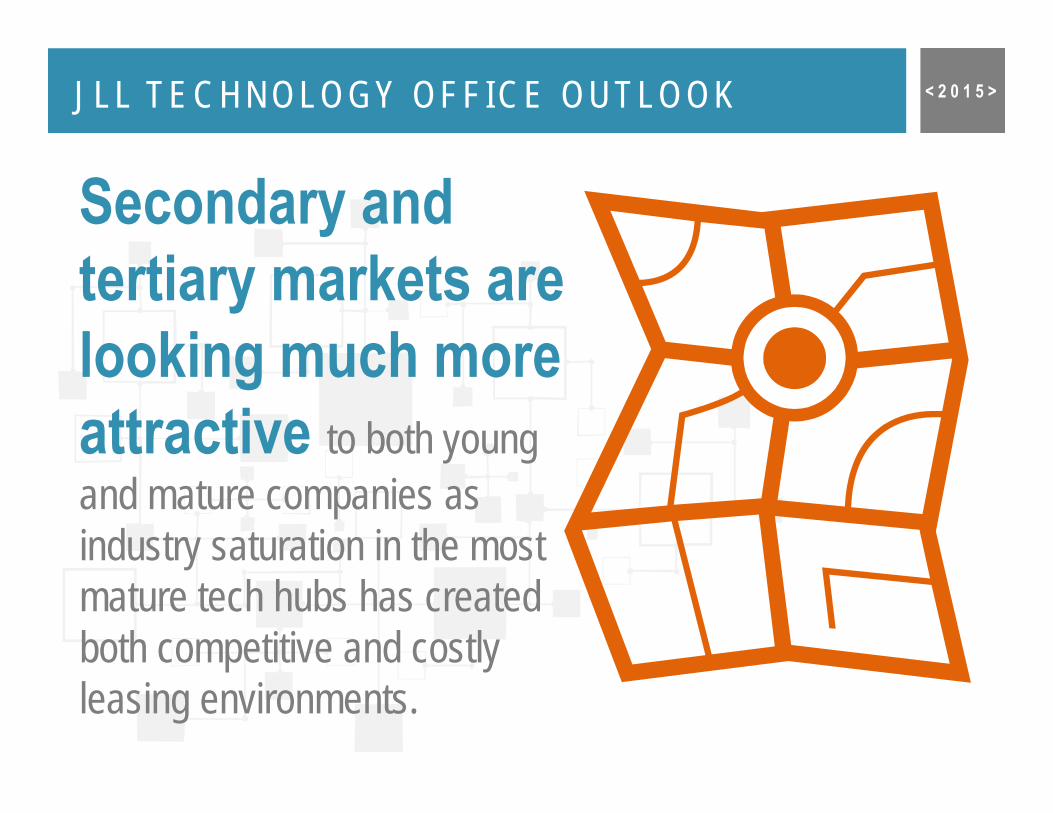
Secondary and tertiary markets are looking much more attractive to both young and mature companies as industry saturation in the most mature tech hubs has created both competitive and costly leasing environments.
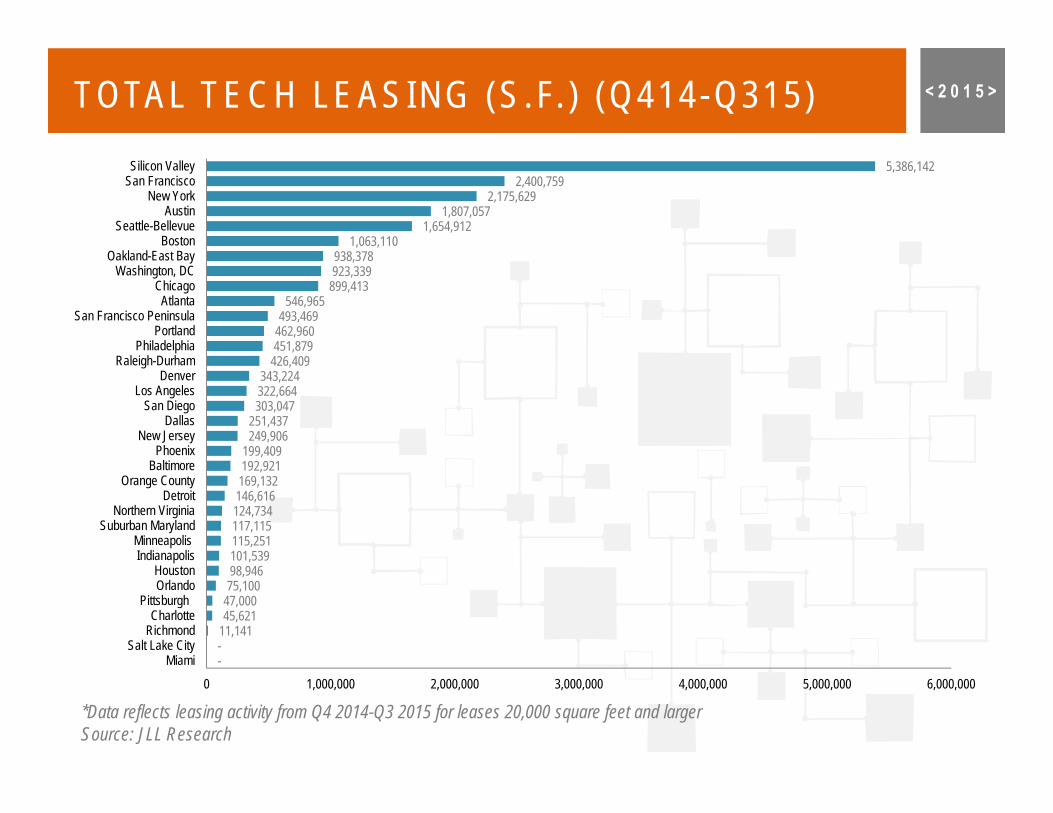
TOTAL TECH LEASING (S .F. ) (Q414-Q315) < 2 0 1 5 >
--11,141 45,621 47,000 75,100 98,946 101,539 115,251 117,115 124,734 146,616 169,132 192,921 199,409
249,906 251,437
303,047 322,664 343,224
426,409 451,879 462,960 493,469
546,965 899,413 923,339 938,378
1,063,110 1,654,912
1,807,057 2,175,629
2,400,759 5,386,142
0 1,000,000 2,000,000 3,000,000 4,000,000 5,000,000 6,000,000
MiamiSalt Lake City
RichmondCharlotte
PittsburghOrlandoHouston
IndianapolisMinneapolis
Suburban MarylandNorthern Virginia
DetroitOrange County
BaltimorePhoenix
New JerseyDallas
San DiegoLos Angeles
DenverRaleigh-Durham
PhiladelphiaPortland
San Francisco PeninsulaAtlanta
ChicagoWashington, DC
Oakland-East BayBoston
Seattle-BellevueAustin
New YorkSan FranciscoSilicon Valley
*Data reflects leasing activity from Q4 2014-Q3 2015 for leases 20,000 square feet and largerSource: JLL Research
JLL TECHNOLOGY OFFICE OUTLOOK < 2 0 1 5 >
Demand toward creative space is intensifying not only among technology companies but throughout the office-using
workforce and will begin to push rents
at a faster rate.
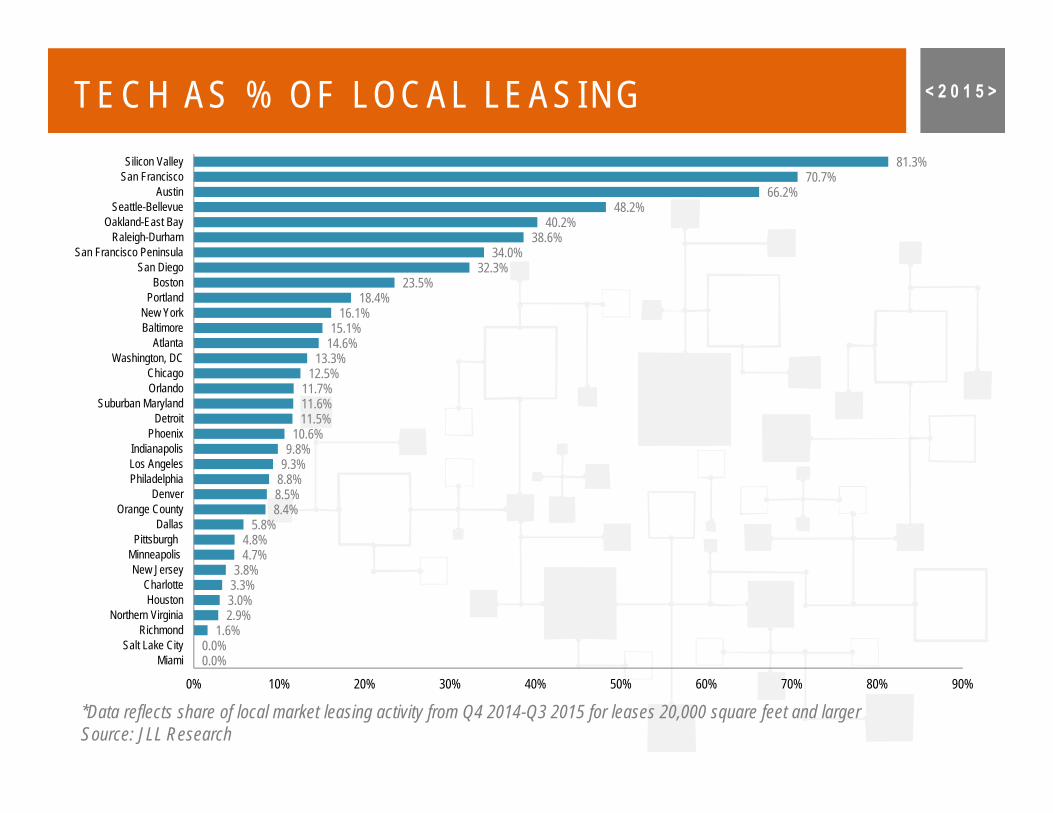
TECH AS % OF LOCAL LEASING < 2 0 1 5 >
*Data reflects share of local market leasing activity from Q4 2014-Q3 2015 for leases 20,000 square feet and largerSource: JLL Research
0.0%0.0%
1.6%2.9%3.0%3.3%3.8%
4.7%4.8%
5.8%8.4%8.5%8.8%9.3%9.8%
10.6%11.5%11.6%11.7%
12.5%13.3%
14.6%15.1%
16.1%18.4%
23.5%32.3%
34.0%38.6%
40.2%48.2%
66.2%70.7%
81.3%
0% 10% 20% 30% 40% 50% 60% 70% 80% 90%
MiamiSalt Lake City
RichmondNorthern Virginia
HoustonCharlotte
New JerseyMinneapolis
PittsburghDallas
Orange CountyDenver
PhiladelphiaLos AngelesIndianapolis
PhoenixDetroit
Suburban MarylandOrlandoChicago
Washington, DCAtlanta
BaltimoreNew York
PortlandBoston
San DiegoSan Francisco Peninsula
Raleigh-DurhamOakland-East Bay
Seattle-BellevueAustin
San FranciscoSilicon Valley
JLL TECHNOLOGY OFFICE OUTLOOK < 2 0 1 5 >
Within the primary tech hubsthe technology industry’s saturation and fast growth has created highly competitiveleasing conditions.
JLL TECHNOLOGY OFFICE OUTLOOK < 2 0 1 5 >
With an average vacancy rate of 7.6%in the 15 most expensive tech submarkets,
tech companies in need of those locations must be
willing to pay.
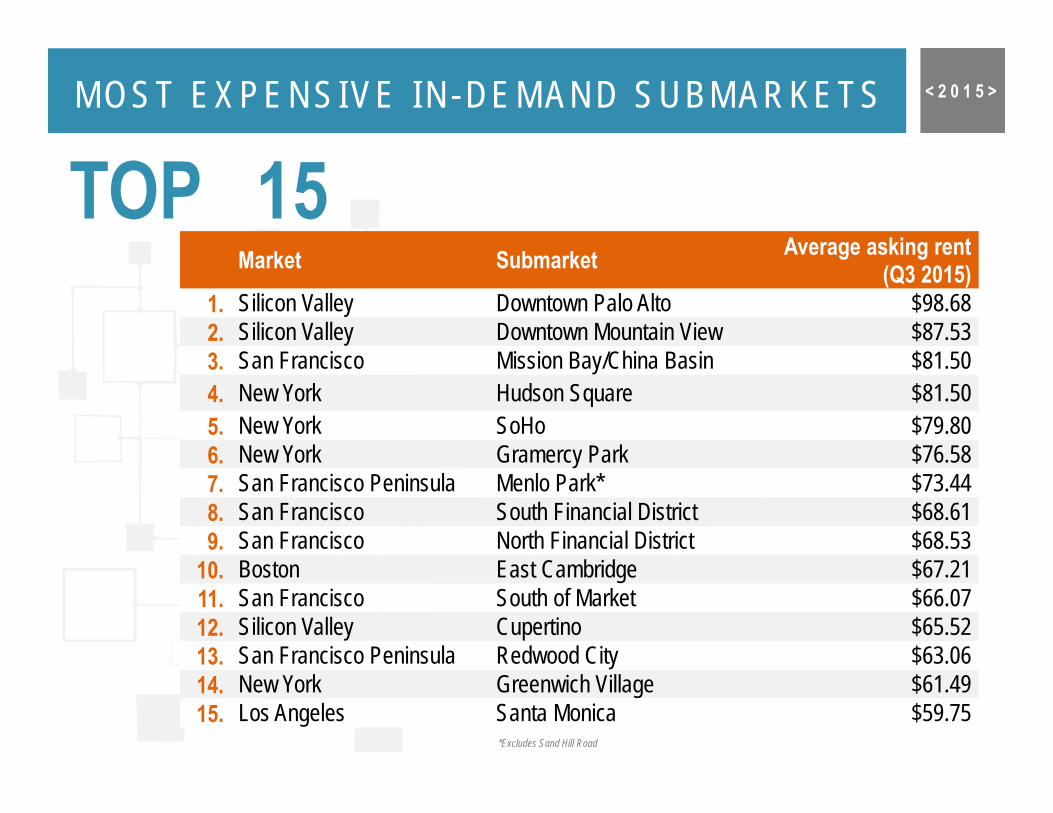
MOST EXPENSIVE IN-DEMAND SUBMARKETS < 2 0 1 5 >
Market Submarket Average asking rent (Q3 2015)
1. Silicon Valley Downtown Palo Alto $98.682. Silicon Valley Downtown Mountain View $87.533. San Francisco Mission Bay/China Basin $81.504. New York Hudson Square $81.505. New York SoHo $79.806. New York Gramercy Park $76.587. San Francisco Peninsula Menlo Park* $73.448. San Francisco South Financial District $68.619. San Francisco North Financial District $68.53
10. Boston East Cambridge $67.2111. San Francisco South of Market $66.0712. Silicon Valley Cupertino $65.5213. San Francisco Peninsula Redwood City $63.0614. New York Greenwich Village $61.4915. Los Angeles Santa Monica $59.75
TOP 15
*Excludes Sand Hill Road
JLL TECHNOLOGY OFFICE OUTLOOK < 2 0 1 5 >
Does concentration of brand-name headquarter location present potential risk to
the market or does it simply affirm its place
as the epicenter of the technology industry?
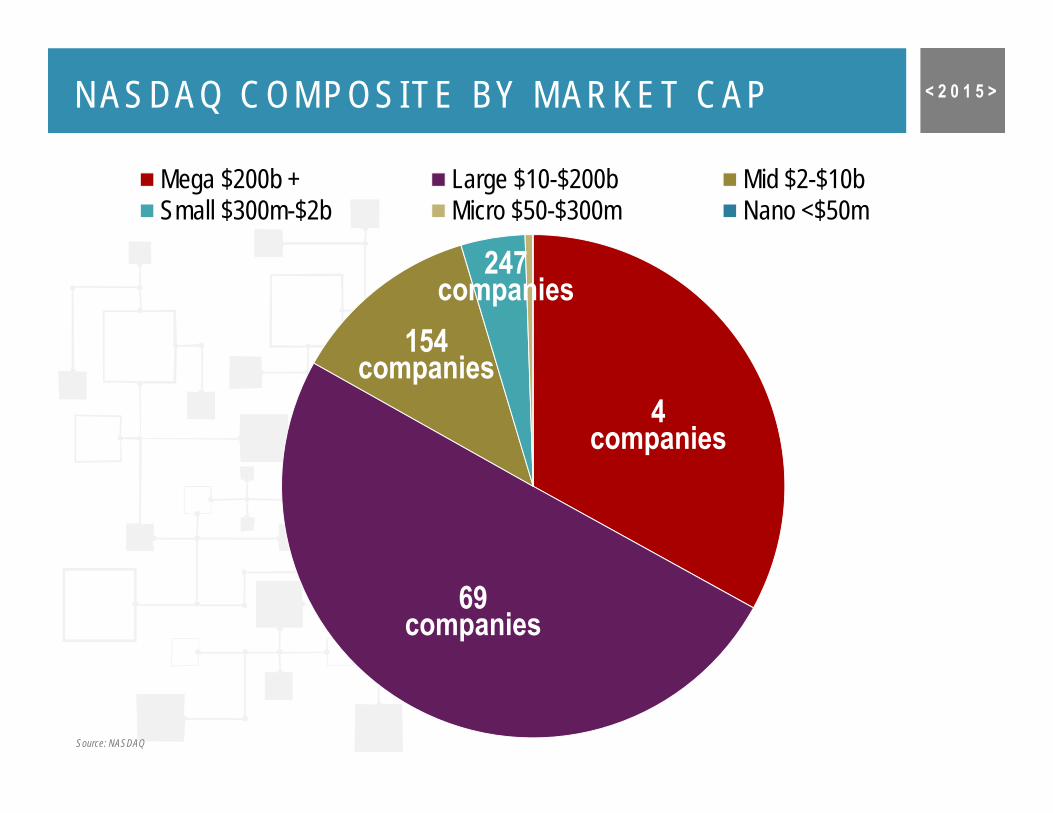
NASDAQ COMPOSITE BY MARKET CAP < 2 0 1 5 >
Mega $200b + Large $10-$200b Mid $2-$10bSmall $300m-$2b Micro $50-$300m Nano <$50m
69 companies
4 companies
154 companies
247 companies
Source: NASDAQ
JLL TECHNOLOGY OFFICE OUTLOOK < 2 0 1 5 >
83% of the NASDAQ composite lies with just 73 tech companies
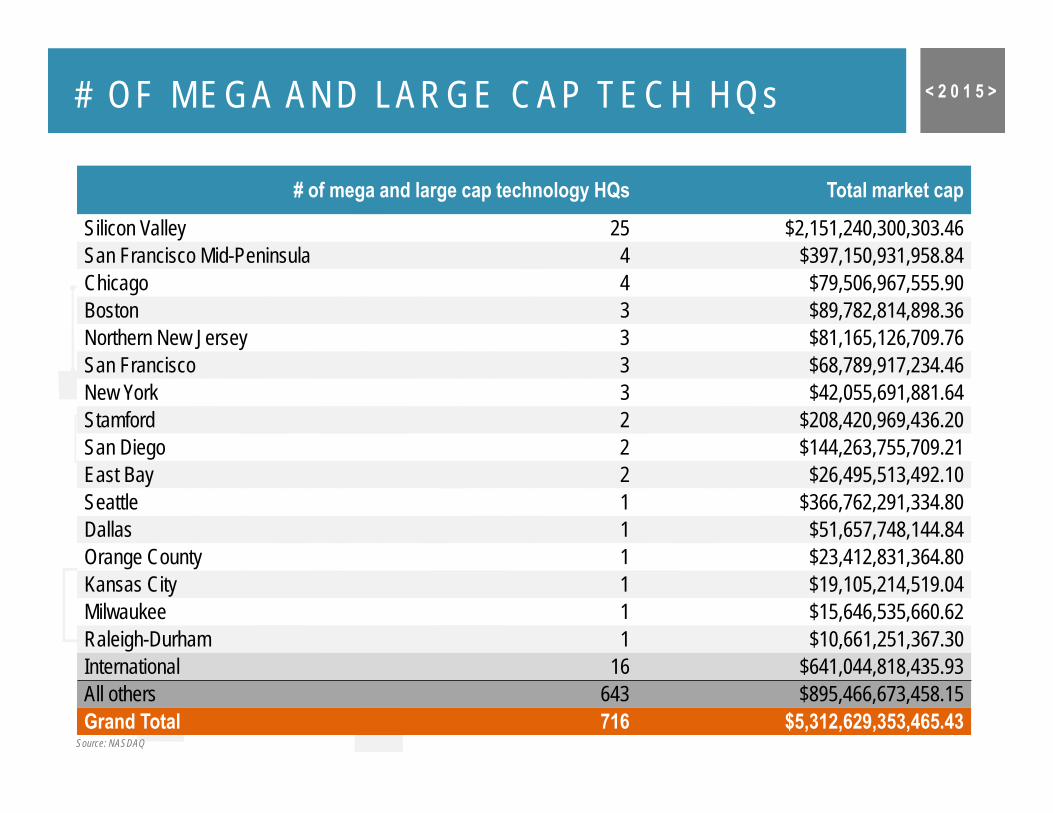
# OF MEGA AND LARGE CAP TECH HQs < 2 0 1 5 >
# of mega and large cap technology HQs Total market cap
Silicon Valley 25 $2,151,240,300,303.46 San Francisco Mid-Peninsula 4 $397,150,931,958.84 Chicago 4 $79,506,967,555.90 Boston 3 $89,782,814,898.36 Northern New Jersey 3 $81,165,126,709.76 San Francisco 3 $68,789,917,234.46 New York 3 $42,055,691,881.64 Stamford 2 $208,420,969,436.20 San Diego 2 $144,263,755,709.21 East Bay 2 $26,495,513,492.10 Seattle 1 $366,762,291,334.80 Dallas 1 $51,657,748,144.84 Orange County 1 $23,412,831,364.80 Kansas City 1 $19,105,214,519.04 Milwaukee 1 $15,646,535,660.62 Raleigh-Durham 1 $10,661,251,367.30 International 16 $641,044,818,435.93 All others 643 $895,466,673,458.15 Grand Total 716 $5,312,629,353,465.43
Source: NASDAQ
JLL TECHNOLOGY OFFICE OUTLOOK < 2 0 1 5 >
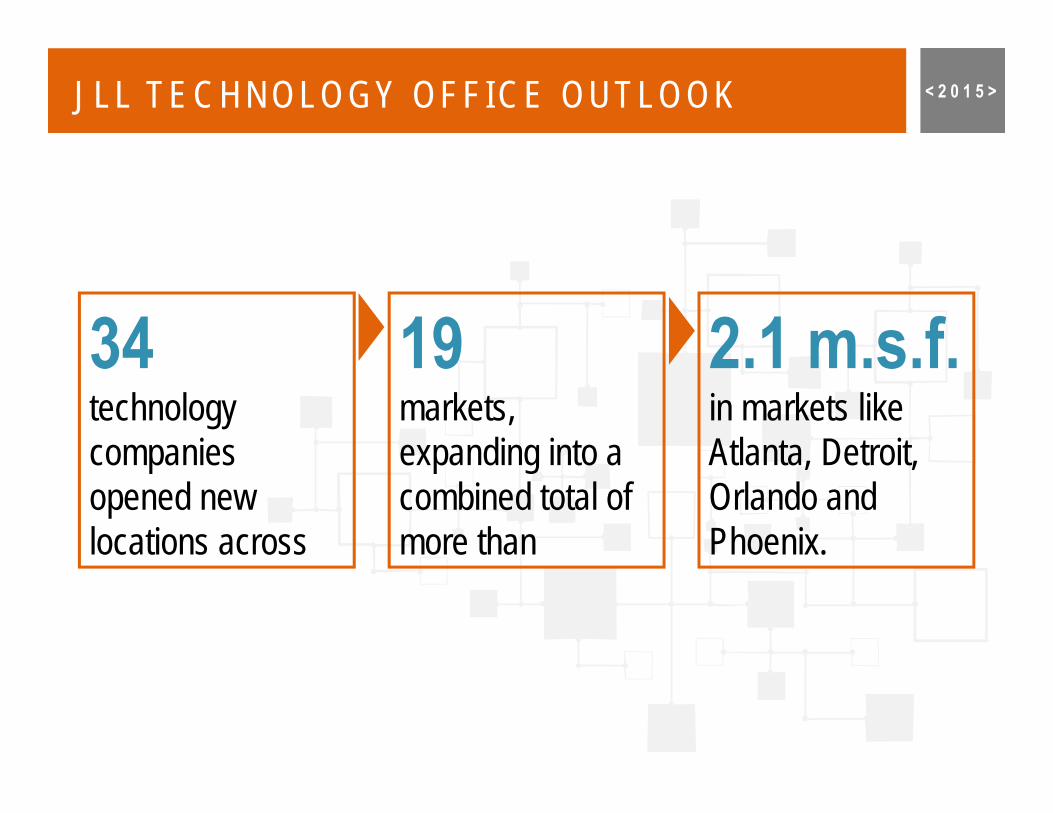
34technology companies opened new locations across
19markets, expanding into a combined total of more than
2.1 m.s.f.in markets like Atlanta, Detroit, Orlando and Phoenix.
JLL TECHNOLOGY OFFICE OUTLOOK < 2 0 1 5 >
The number of unicorns in the industry has nearly tripled.
JLL TECHNOLOGY OFFICE OUTLOOK < 2 0 1 5 >
The trend of tech growth in secondary markets is beginning to dispel the traditional mentality that startups need to locate to the Bay Area in order to have access to private capital.
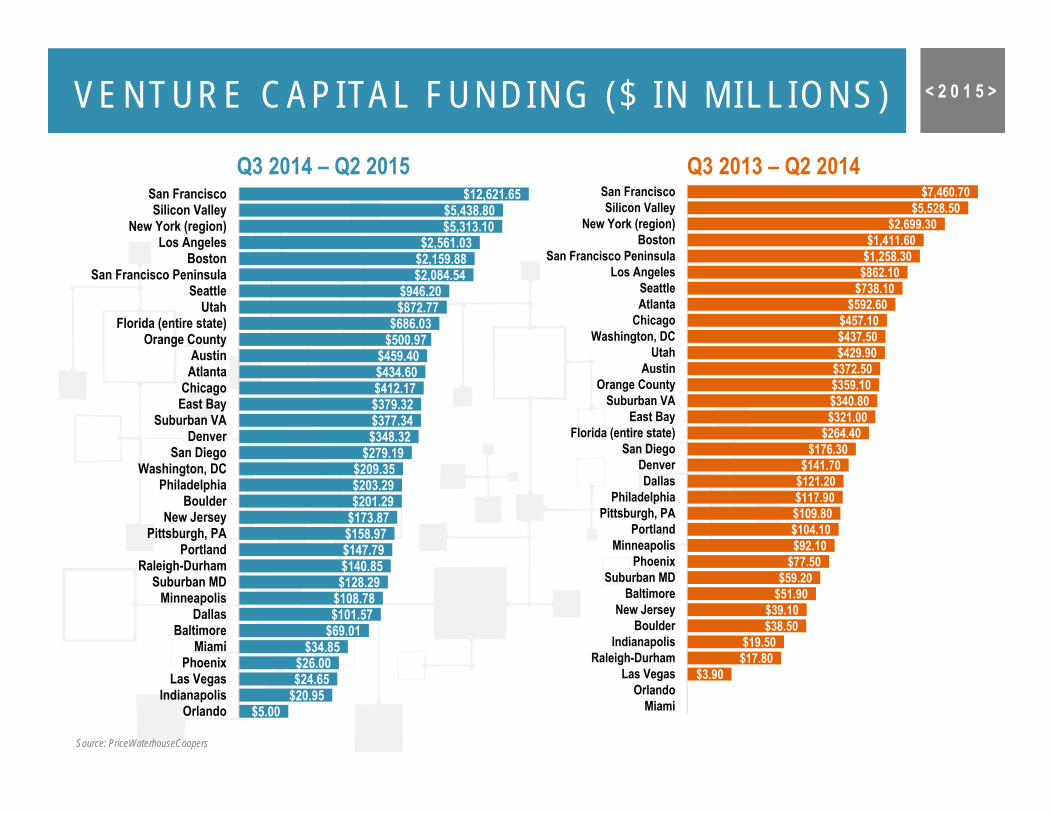
VENTURE CAPITAL FUNDING ($ IN MILL IONS) < 2 0 1 5 >
$5.00$20.95$24.65$26.00
$34.85$69.01$101.57$108.78$128.29$140.85$147.79$158.97$173.87$201.29$203.29$209.35
$279.19$348.32$377.34$379.32$412.17$434.60$459.40
$500.97$686.03
$872.77$946.20
$2,084.54$2,159.88$2,561.03
$5,313.10$5,438.80
$12,621.65
OrlandoIndianapolis
Las VegasPhoenix
MiamiBaltimore
DallasMinneapolis
Suburban MDRaleigh-Durham
PortlandPittsburgh, PA
New JerseyBoulder
PhiladelphiaWashington, DC
San DiegoDenver
Suburban VAEast BayChicago
AtlantaAustin
Orange CountyFlorida (entire state)
UtahSeattle
San Francisco PeninsulaBoston
Los AngelesNew York (region)
Silicon ValleySan Francisco
$3.90$17.80$19.50
$38.50$39.10
$51.90$59.20
$77.50$92.10$104.10$109.80$117.90$121.20$141.70
$176.30$264.40
$321.00$340.80$359.10$372.50$429.90$437.50$457.10
$592.60$738.10$862.10$1,258.30$1,411.60
$2,699.30$5,528.50
$7,460.70
MiamiOrlando
Las VegasRaleigh-Durham
IndianapolisBoulder
New JerseyBaltimore
Suburban MDPhoenix
MinneapolisPortland
Pittsburgh, PAPhiladelphia
DallasDenver
San DiegoFlorida (entire state)
East BaySuburban VA
Orange CountyAustin
UtahWashington, DC
ChicagoAtlantaSeattle
Los AngelesSan Francisco Peninsula
BostonNew York (region)
Silicon ValleySan Francisco
Source: PriceWaterhouseCoopers
Q3 2014 – Q2 2015 Q3 2013 – Q2 2014
JLL TECHNOLOGY OFFICE OUTLOOK < 2 0 1 5 >
The Locator Matrix is a tool for growing startups and established tech firms to determine the best location for continued company expansion.
THE JLL LOCATOR MATRIX < 2 0 1 5 >
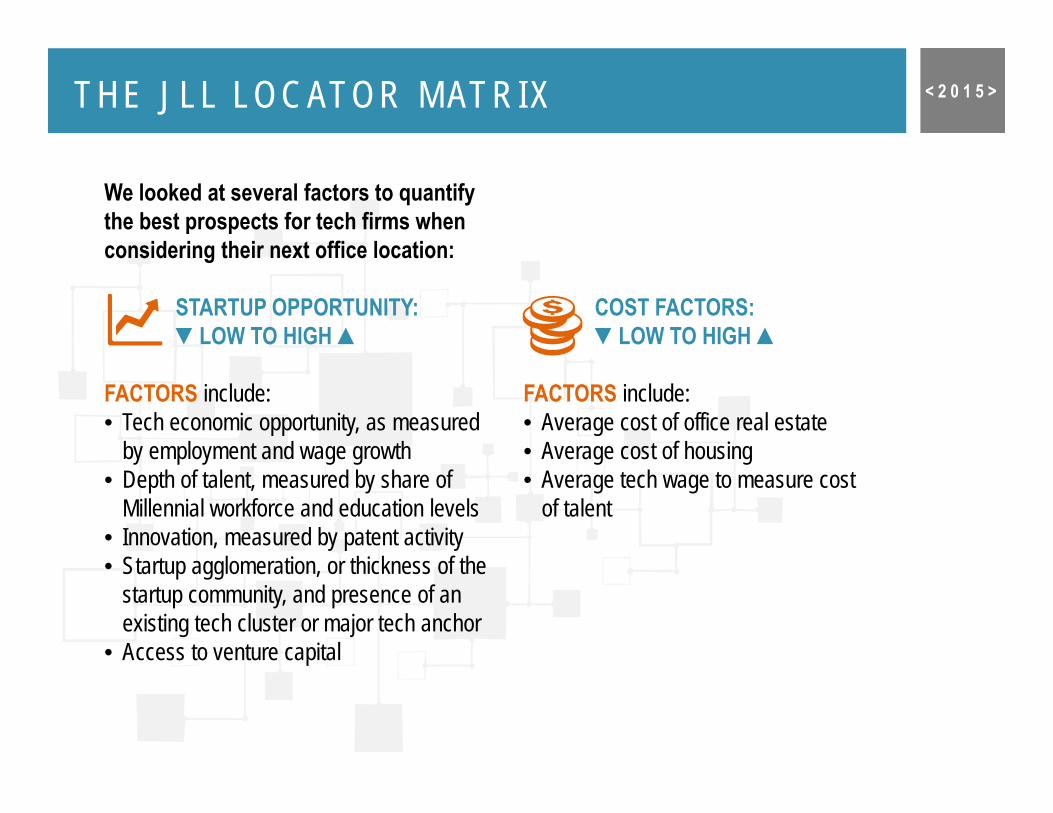
We looked at several factors to quantify the best prospects for tech firms when considering their next office location:
STARTUP OPPORTUNITY:▼LOW TO HIGH ▲
FACTORS include:• Tech economic opportunity, as measured
by employment and wage growth• Depth of talent, measured by share of
Millennial workforce and education levels• Innovation, measured by patent activity• Startup agglomeration, or thickness of the
startup community, and presence of an existing tech cluster or major tech anchor
• Access to venture capital
COST FACTORS:▼LOW TO HIGH ▲
FACTORS include:• Average cost of office real estate• Average cost of housing• Average tech wage to measure cost
of talent
JLL TECHNOLOGY OFFICE OUTLOOK < 2 0 1 5 >
The results of our model divide the markets into four different quadrants, making it clear which markets present the best opportunity for growth based on the cost and startup momentum.
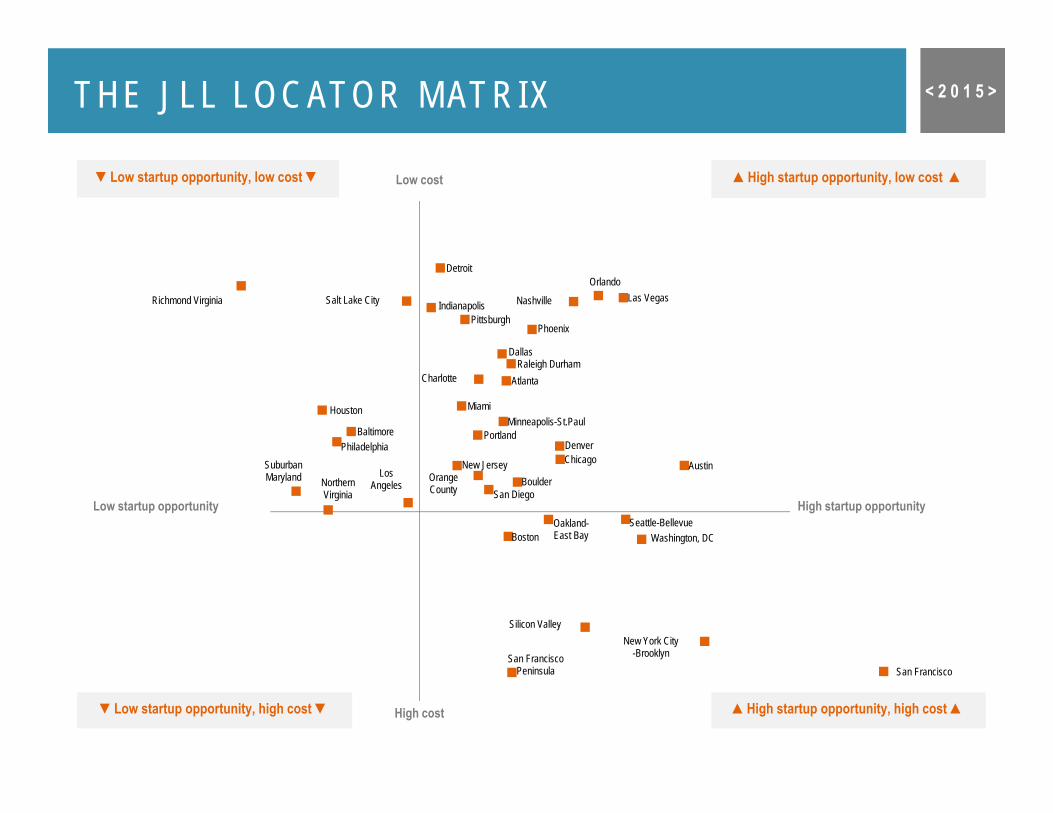
THE JLL LOCATOR MATRIX < 2 0 1 5 >
Atlanta
Austin
Baltimore
Boston
Boulder
Charlotte
Chicago
Dallas
Denver
Detroit
IndianapolisLas Vegas
LosAngeles
MiamiMinneapolis-St.Paul
Nashville
New Jersey
New York City-Brooklyn
Northern Virginia
Oakland-East Bay
Orange County
Orlando
Philadelphia
PhoenixPittsburgh
Portland
Raleigh Durham
Richmond Virginia Salt Lake City
San Diego
San Francisco
Seattle-Bellevue
San Francisco Peninsula
Silicon Valley
Suburban Maryland
Washington, DC
Houston
Low startup opportunity
Low cost
High cost
High startup opportunity
▼Low startup opportunity, high cost ▼
▲High startup opportunity, low cost ▲
▲High startup opportunity, high cost ▲
▼Low startup opportunity, low cost ▼
JLL TECHNOLOGY OFFICE OUTLOOK < 2 0 1 5 >
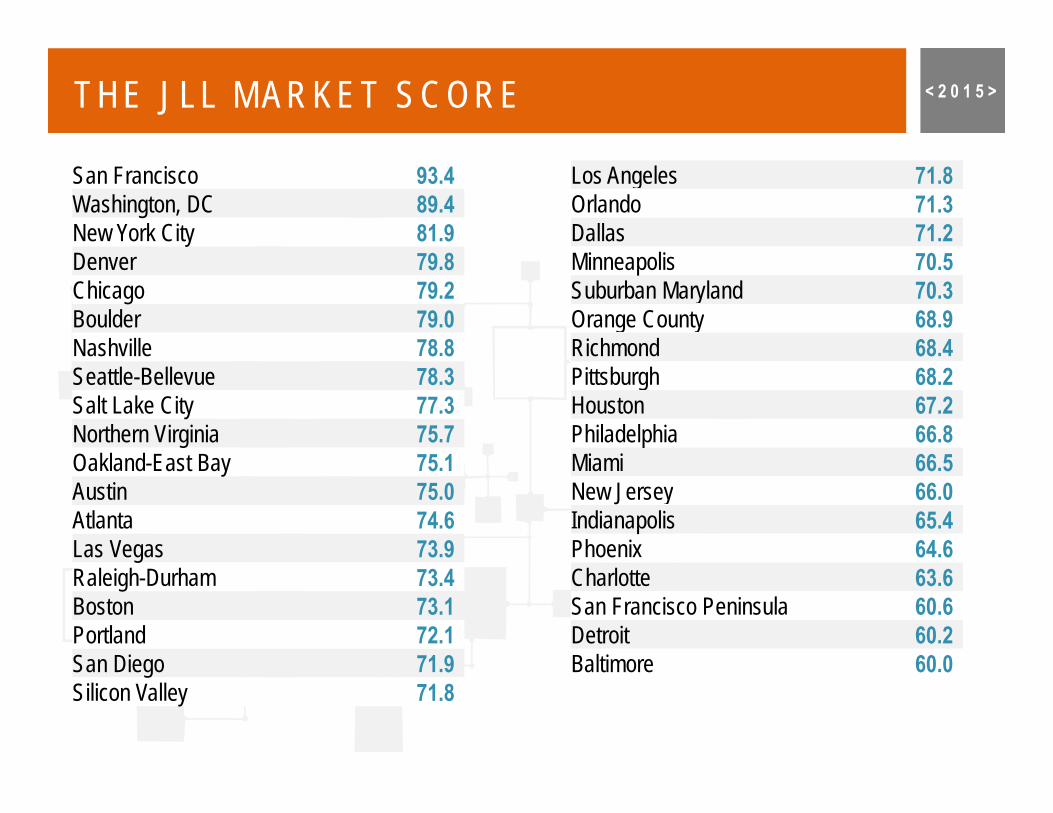
The Market Score is a tool for real estate investors to determine momentum and potential investment opportunity in a particular market with tech in mind.
T
THE MARKET SCORE
L
JLL TECHNOLOGY OFFICE OUTLOOK < 2 0 1 5 >
Our ranking model revealed that San Francisco provides real estate investors the best mix of favorable attributes for those already invested in a tech market or targeting tech markets for acquisition opportunities.
JLL TECHNOLOGY OFFICE OUTLOOK < 2 0 1 5 >
As the traditional tech markets like San Francisco and New York become increasingly unaffordable for younger firms, markets like Denver, Boulder, Nashville and Salt Lake City are poised to capture the next wave of tech demand.
JLL TECHNOLOGY OFFICE OUTLOOK < 2 0 1 5 >
As for the bottom five markets in this year’s ranking, the biggest surprise may be the San Francisco Peninsula’sposition toward the bottom.
THE JLL MARKET SCORE < 2 0 1 5 >
San Francisco 93.4Washington, DC 89.4New York City 81.9Denver 79.8Chicago 79.2Boulder 79.0Nashville 78.8Seattle-Bellevue 78.3Salt Lake City 77.3Northern Virginia 75.7Oakland-East Bay 75.1Austin 75.0Atlanta 74.6Las Vegas 73.9Raleigh-Durham 73.4Boston 73.1Portland 72.1San Diego 71.9Silicon Valley 71.8
Los Angeles 71.8Orlando 71.3Dallas 71.2Minneapolis 70.5Suburban Maryland 70.3Orange County 68.9Richmond 68.4Pittsburgh 68.2Houston 67.2Philadelphia 66.8Miami 66.5New Jersey 66.0Indianapolis 65.4Phoenix 64.6Charlotte 63.6San Francisco Peninsula 60.6Detroit 60.2Baltimore 60.0

us.jl
l.com
/tech
-out
look
TechnologyOfficeOutlook
United States2015
© Copyright 2015 Jones Lang LaSalle
CONTACTS:
1. Amber SchiadaVice President, Director of ResearchNorthern California & Rocky Mountain Region+1 415 395 [email protected]
2. Julia GeorgulesVice President, Director of U.S. Office ResearchAmericas Research+1 415 354 [email protected]
FOR MORE INFO ON THE:
<TECHNOLOGY OFFICE OUTOOK>
REACH OUT TO:
OR VISIT:us.jll.com/tech-outlook


![[IoT Tech Expo] Smart Cities – Leveraging Messaging from Project to City to Nation](https://img.pdfslide.net/doc/110x75/58a1bafd1a28ab537c8b63e3/iot-tech-expo-smart-cities-leveraging-messaging-from-project-to-city.jpg)