Embed Size (px)
Citation preview


2 | P a g e
Welcome to Redwoods Research’s Mid-Year Residential Research Report for 2017 released in the month of July.
This report is a compilation of the general residential market in Bengaluru. The data provided in the report is an interpretation of the Supply, Demand and Capital
Value trends in the city’s Primary Residential Sector. It comprehends a cohesive research by the Redwoods team of Research analysts and
experts. The result of the extensive on-field research involving the tracking of market trends from
over 1,496 ongoing residential projects.
To summarize, the report covers and entails all the significant projects located in various micro-markets across Bengaluru, studied and elucidated over the past 5-years on a half-yearly basis.
Note: The data analysis does not represent the entire market.
The report consists of three main parts:
Part One - the general economic conditions and their probable effect on the Bengaluru Residential Real Estate market.
Part Two - the analytical data from over 1,496 residential projects across Bengaluru.
Part Three - detailed list of ongoing residential developments across the city.
Dear Reader,
We hope that you enjoy this report as much as we did gathering the data; conducting comparative studies to bring forth valuable updates and information concerning Bengaluru Residential Real Estate.
Anticipating your valuable feedback; you can always contact the Redwoods Research team for all your doubts and concerns.
Warm Regards,
Anuj Nautiyal, MD, Redwoods Group
LJ Hooker Research India is now Redwoods Research
Embracing our potential as the market’s leading provider of realty services, Redwoods Corporation has successfully exited from the LJ Hooker franchise. Redwoods Research is back with the same team of Real Estate experts and analysts with boosted dynamism backed by on-field experience to bring you the latest updates and reports, aiding you to make better Real Estate decisions.
IMPORTANT NOTES -TO BE READ IN CONJUNCTION WITH THIS REPORT This report is compiled from primary data sourced by the in-house Redwoods research team from developers, prospective
customers as well as general market information and previously published works.
Redwoods does not make any claim as to the inclusiveness or accuracy of this information or comments provided, and this
information should not be used by third parties, or banked upon while making financial decisions. The reader should at all times
count on their independent research and information, and use this report as a guide only. Redwoods has taken due care in the
collection of the data. However, Redwoods does not warrant the accuracy of the information provided in this presentation. The
presentation is available only on an "as is” basis and without any warranties expressed or implied. Redwoods Corporation
disclaims all warranties including any implied warranty of merchantability and appropriateness for any purpose.
Without prejudice to the above, Redwoods will not be liable for any kind of damage arising from the use of this presentation,
including, but not limited to direct, indirect, incidental, punitive, special, consequential, and/or exemplary damages including
but not limited to damages for loss or profit goodwill resulting from:
The fallacy and/or inaccuracy of the information.
Any action taken, proceeding initiated, the transaction entered into, on the basis of the information available in this presentation. If you believe that there are any omissions or imprecisions in the report, please write to [email protected]
IMPORTANT NOTES -TO BE READ IN CONJUNCTION WITH THIS REPORT This report is compiled by the Redwoods’ research team using primary data collected from developers, real estate agents;
previously published reports, and general market information.
Redwoods does not make any claim as to the inclusiveness or accuracy of this information or comments provided, and this
information should not be used by third parties, or banked upon while making financial decisions. The reader must at all times
rely on their independent research and information, and use this report as a guide only. Redwoods has taken due care in the
collection of the data. The presentation is available only on an "as is” basis and without any warranties expressed or implied.
Redwoods Corporation disclaims all warranties including any implied warranty of merchantability and appropriateness for any
purpose.
Without prejudice to the above, Redwoods will not be liable for any kind of damage arising from the use of this presentation,
including, but not limited to direct, indirect, incidental, punitive, special, consequential, and/or exemplary damages including
but not limited to damages for loss or profit goodwill resulting from:
The fallacy and/or inaccuracy of the information.
Any action taken, proceeding initiated, the transaction entered into, on the basis of the information available in this presentation. If you believe that there are any omissions or imprecisions in the report, please write to [email protected]

3 | P a g e
TABLE OF CONTENTS PART – I MACRO ECONOMIC REVIEW AND PREDICTIONS ...................................................................... 4
EXECUTIVE SUMMARY – MACRO MARKET CONDITIONS ................................................................... 4
INTRODUCTION ............................................................................................................................... 4
PREDICTION FOR THE BANGALORE RESIDENTIAL MARKET ................................................................ 6
PART – II STATISTICAL REPORT ON BENGALURU RESIDENTIAL MARKET ................................................ 7
EXECUTIVE SUMMARY ........................................................................................................................ 7
BENGALURU PRIMARY RESIDENTIAL MARKET – MACRO ANALYSIS ................................................... 8
KEY INDICATORS .............................................................................................................................. 8
KEY AVERAGES ................................................................................................................................ 9
DEVELOPMENT WISE PRICE TREND ................................................................................................ 9
DEVELOPMENT WISE PERFORMANCE INDICATORS ..................................................................... 10
REGION WISE PRICE TREND .......................................................................................................... 11
REGION WISE PERFORMANCE INDICATORS ................................................................................. 12
REGION WISE SALES VELOCITY ..................................................................................................... 12
REGION WISE MONTH INVENTORY............................................................................................... 12
INVENTORY MOVEMENT DURING LAST 6 MONTH ....................................................................... 13
YEARLY LAUNCHES COMPARISON ................................................................................................ 14
RESIDENTIAL MARKET DYNAMICS ................................................................................................ 15
DETAILED ANALYSIS ON THE BUDGET CATEGORIES ..................................................................... 16
REGION WISE RESIDENTIAL MARKET DYNAMICS ......................................................................... 19
PROMINENT/EMERGING RESIDENTIAL CLUSTERS AROUND BENGALURU ................................... 21
PART- III PRIMARY PROJECT SOURCE DATA ............................................................................ 24
APARTMENT DEVELOPMENTS .......................................................................................................... 24
BANGALORE - CENTRAL ................................................................................................................ 24

4 | P a g e
PART – I MACRO ECONOMIC REVIEW AND PREDICTIONS
EXECUTIVE SUMMARY – MACRO MARKET CONDITIONS
INTRODUCTION – THE INDIAN ECONOMY & REAL ESTATE India was considered to be the fastest growing economy in the year 2014. However, in the recent
years, the Indian economy has been noting a slow growth rate as most of our economic directories
are expressing a weakening trend. According to the financial experts and economists, India's growth
is expected to reverberate to 7.2% in the 2017–18 fiscal and 7.7% in 2018–19.
India’s GDP growth decelerated ominously to 6.1 percent YoY in 1Q17 from 7.0 per cent in 4Q16
which is thus far the lowest recorded growth rate. The reason being the slowdown in consumer
spending, and a drop in the investments; following the demonetization program in November 2016
which drained out 86 percent of currency circulating in the market. In addition to these afore
mentioned facts, the government changed the GDP base year to 2011-2012 from 2004-2005.
As widely expected, the Reserve Bank of India retained its benchmark repo rate at 6.25 percent on 7
June 2017 with claims that the decision has been unwavering with the perspective of a neutral
monetary policy. The reverse repo rate was also left untouched at 6 percent, following a 25bps cut in
April 2017. Interest Rate in India averaged 6.69 percent in between 2000 to 2017, reaching an all-
time high of 14.50 percent in August of 2000 and a record low of 4.25 percent in April of 2009.
Consumer prices in India increased 2.18 percent year-on-year in May of 2017, slackening from a 2.99
percent rise in April which was below market expectations of 2.6 percent. The inflation record was
low for the second consecutive month as there was a drop in the food prices with pulses and
vegetables in the lead. Inflation Rate in India averaged 7.06 percent in the last five years. It reached
an all-time high of 12.17 percent in November 2013 and recorded a low rate of 2.18 percent in May
2017.

5 | P a g e
In addition to the above-mentioned changes, the Govt. of India introduced two major phenomena,
the RERA and the GST which thus far has and will have a huge impact on the realty business both
directly and indirectly. These two economic marvels of India are motivating the realty sector to
become more transparent and process driven. However, this transition isn't an easy one as proven
by the heterogeneous implementation of the RERA with varying degrees of dilution. Most of the key
states are yet to come out with the RERA rules, and those states that have the rules either lack a
website or do not have a RERA regulator in place; and, the states having all of the aforementioned
factors have issues with the real estate developers as they are demanding more time to understand
the process of RERA registration.
Goods and Service Tax (GST)
The conception of GST is to account for the ‘tax credits’ while aiming to rationalize tax structure
alongside bringing in price uniformity.
The Goods and Services Tax (GST) that rolled out on the Friday of 1-July-2017 has four tax slabs
of 5%, 12%, 18%, and 28%, for various items and categories.
Economic and real estate experts have foretold that the GST would bring in a lot of transparency
while minimizing fraudulent transactions.
Under the current tax laws - VAT and Service tax charged by different Contractors and excise
duty, entry tax, octroi is paid on the procurements.
The effective GST rate on under-construction projects will be 12 per cent only in contrast to 18
per cent as there will be a diminution in the cost of the land. It is believed that Supply chain
mechanism in real estate sector would be revamped after implementation of the GST.
The sole purpose of this is to reduce and eliminate instances of cascading taxes or ‘tax-on-tax’
paid at different stages of the supply chain.
Real Estate Regulation Act (RERA)
RERA, which came into force on the 1st of May 2017 in India, demands compulsory registration
of all the residential realty projects under the Regulatory Act for plot sizes that are more than
500sqm. It is also applicable to certain ongoing, under construction projects.
RERA aims to protect the interest of home-buyers while bringing in transparency and
accountability into the otherwise unregulated realty market.
Builders are expected to disclose project related information including project plan, layout, and
government approvals- related information to the concerned RERA regulator.
Many states like Uttar Pradesh, Gujarat, Kerala, Odisha, Andhra Pradesh, Madhya Pradesh, Bihar and
union territories, NCT of Delhi, Andaman and Nicobar Islands, Chandigarh, Dadra and Nagar Haveli,
Daman and Diu, Lakshadweep and recently Karnataka have notified rules for the implementation of
RERA 2016. So far only Maharashtra and Madhya Pradesh have established a Regulatory Authority as
required under the RERA Act.

6 | P a g e
PREDICTION FOR THE BENGALURU RESIDENTIAL MARKET
GENERAL COMMENT
Indian Real estate market has been through a phase of transformation in the past 6 months where
there have been 3 significant events that have impacted the industry both directly and indirectly.
These events include Demonetisation, Goods and Services Tax (GST), and Real Estate Regulation and
Development Act (RERA) in the economic and regulatory front; which brought along them the mixed
feelings of hope and apprehension.
Albeit the fact that these aforementioned events have the potential to deliver proper control
mechanism into the system from the standpoint of a long term goal, but in short term, it slowed
down the economic activities and created an ambiguity in the mind of everybody especially the
stake holders of the real estate.
During the last 6 months, the market started seeing certain improvements. And in terms of its new
launches, the market observed an upsurge of 120% with 9.8 Mn Sq. ft., which is double the value
when compared to EOY-2016 Residential Report (released in the month of Jan 2017). The Weighted
Average Price for residential market observed an upsurge by 2.3%, increasing to INR 5,437 per Sq. ft.
And this infers to the improvements in terms of the developer’s confidence.
PREDICTION FOR THE SECOND HALF 2017
Bengaluru Real Estate Market was going through a tough phase during the past few years, and
especially in the last one-and-a-half year due to uncertainty associated with the notifications of the
aforementioned acts. Now it is going to be more promising and hopeful as the regulatory acts are
already implemented and are in the process of execution.
Proper Execution of Real Estate Regulation Act is going to be a game changer as it will ensure
accountability and transparency while delivering confidence and consistency in the growth of the
Realty sector; also, it attempts to ensure the promises given by the developers are fulfilled while
penalizing the defaulters and the fly-by-night operators in the industry.
We anticipate that a lot more new launches would come into place especially in the Value Homes
and Budget Home Category in the city suburbs. Also, the Weighted Average price is expected to see
a 3-4% increase during the second half of 2017.

7 | P a g e
PART – II STATISTICAL REPORT ON BENGALURU RESIDENTIAL MARKET
EXECUTIVE SUMMARY Fundamental figures
Bengaluru residential market witnessed a slight escalation in its Weighted Average Capital Value
by 2.3% from INR 5,314 per Sq. ft. to INR 5,437 per Sq. ft.
The Bengaluru residential market would require 39 Months to offload its Unsold Inventory. Sales Velocity plummeted by 4.9% and reached an all-time low of 0.86% since 2012. On a yearly basis, the Compound Annual Growth Rate (CAGR) for the Average Capital Value
stands at 2.73%. The average size of an Apartment stands at 1,630 Sq. ft. while the Row House & Villa are offering
an average size of 3,293 Sq. ft. and 3,321 Sq. ft. respectively.
Category wise highlights
Sales Velocity of Residential Apartments and Plots dropped by -16.5% and -24.4% respectively,
whereas the Row houses and Villa Developments observed a slight increase in its Sales Velocity
by 1% and 09% respectively.
Months Inventory for apartment and plot recorded at 40 and 30 Months respectively.
Average capital value of North-east and North-west saw a slight rise by 3.6% and 3%, and
reached INR 5,461 and INR 5,796 respectively.
Central Region observed an increase in its Sales Velocity by 6.3% and reached 1.02% whereas, all
other regions observed a drop.
Eastern Regions such as North-east and South-east witnessed a drop by -18.9% and -19.8%,
while reaching 0.9% and 0.8% respectively.
The Months Inventory level further amplified for all regions. And, South-east Region recorded
the Maximum Months Inventory of 44 Months followed by Central Region with 41 Months.
The lowest Months Inventory recorded in North-east Region with 31 Months.
New launches
During the last 6 months, i.e., the 1st half of 2017, an upsurge of 120% in the New Launches was
witnessed while about 9.8 Mn Sq. ft. of Apartment Developments was added in the Residential
Market.
Weighted Average Capital Value of the newly launched apartment stands at INR 3,315 per Sq. ft.
which is -28% fall when compared to the previous period.
Nearly 68% of newly launched apartments fall under the Budget Homes Category (30-60lakh),
and these are the developments causing a drop in its average price.
Inventory status
Bengaluru Residential Market has an inventory of 113,338 units in which 94,670 units accounting
for 84% remain unsold, followed by plotted developments contributing to 12% (13,930) of the
inventory.
Bengaluru has a Total supply of Residential Development spread across 576.9 Mn Sq. ft. of which
177.1 Mn Sq. ft. remains unsold translating to INR 87,287 crores of unsold units.
Eastern region contributes 76% of the unsold Inventory of where the South-east shares 45% and
the North-east shares 32% of the unsold units.
Budget Homes and Mid-range Homes (30 lakh-1 crores) contribute to the maximum share of
73% of the unsold inventory of which the Budget Homes share 45% and Mid-range share 28%.

8 | P a g e
BENGALURU PRIMARY RESIDENTIAL MARKET – MACRO ANALYSIS
KEY INDICATORS
Bengaluru residential market witnessed a slight escalation in its weighted average Capital Value by 2.3% from INR 5,314 per Sq. ft. to INR 5,437 per sq. ft.
Sales Velocity further plummeted by 4.9% and reached an all-time low of 0.86% since 2012; at this pace, the Bengaluru residential market would require 39 months to offload its unsold inventory.
Period Sales Velocity Months Inventory Average Price Psf
Jul-13 4.20% 8.60 4,753
Jan-14 2.2% (-47.6%) 16 (84.9%) 4,936 (3.9%)
Jul-14 2.3% (4.5%) 15 (-5.7%) 5,030 (1.9%)
Jan-15 2.2% (-4.3%) 16 (9.2%) 4,866 (-3.3%)
Jul-15 1.6% (-27.3%) 22 (32.9%) 5,261 (8.1%)
Jan-16 1.1% (-31.3%) 31 (42.9%) 5,333 (1.4%)
Jul-16 1% (-7.7%) 33 (6.3%) 5,334 (+)
Jan-17 0.9% (-11.1%) 37 (11.8%) 5,314 (-0.4%)
Jul-17 0.9% (-4.9%) 39 (6.1%) 5,437 (2.3%)
CAGR -27.21% 35.45% 2.73%
The Compound Annual Growth Rate (CAGR) for the Average Capital Value stands at 2.73% on a yearly basis.
Sales velocity has been giving a negative growth of 27.21%.
2.89%
4.22%
2.15% 2.26% 2.19%
1.59%
1.12% 1.02% 0.90% 0.86%
4,702 4,7534,936 5,030
4,866
5,261 5,333 5,334 5,314 5,437
0%
1%
2%
3%
4%
5%
6%
0
5
10
15
20
25
30
35
40
45
De
c-1
2
Jul-
13
Jan
-14
Jul-
14
Jan
-15
Jul-
15
Jan
-16
Juy-
16
Jan
-17
Jul-
17
Months Inventory Sales Velocity Average Price Psf

9 | P a g e
KEY AVERAGES Type Average Ticket Size in lakhs (INR) Average Size
Jan-16 Jul-16 Jan-17 Jul-17 Jan-16 Jul-16 Jan-17 July-17
Apartment 106 102 (-3.8%) 98 (-3.9%) 103 (5.1%) 1,657 1,640 (-1%) 1,615 (-1.5%) 1,630 (.9%)
Row House 226 228 (.93%) 269 (18%) 270 (.4%) 3,107 3,107 (.0%) 3,292 (6%) 3,293 (.0%)
Villa 233 229 (-1.7%) 232 (1.3%) 242 (4.3%) 3,287 3,242 (-1.4%) 3,261 (.6%) 3,321 (1.8%)
Residential apartment ticket size for a unit has stretched back to 1.03 crore. Whereas the other developments such as Villa and Row house increased further by 4% and 0.4% respectively.
The average size of an apartment stands at 1,630 Sq. ft. Row House & Villa are offering at an average of 3,293 Sq. ft. and 3,321 Sq. ft. respectively.
DEVELOPMENT WISE PRICE TREND
Price Trend Apartment Plot Row House Villa
Jul-13 4,549 1,290 5,595 6,036
Jul-14 4,821 (6%) 1,682 (30.4%) 6,096 (9%) 6,508 (7.8%)
Jul-15 5,099 (5.8%) 1,951 (16%) 6,551 (7.5%) 6,409 (-1.5%)
Jul-16 5,181 (1.6%) 1,863 (-4.5%) 6,991 (6.7%) 6,342 (-1%)
Jul-17 5,299 (2.3%) 2,092 (12.3%) 8,035 (14.9%) 6,609 (4.2%)
CAGR 3.10% 10.16% 7.51% 1.83%
Among all residential developments, Plotted schemes are giving the highest CAGR of 10.16% followed by Row house and apartment by 7.51% and 3.1% respectively.
During the past 6 months, Apartment prices ascended by 2.3% as compared to the previous period.
A slight increase in its average prices across the developments during the last 6 months has been observed.
4,549 4,821 5,099 5,181 5,299
1,290 1,682 1,951 1,863 2,092
5,595 6,096
6,551 6,991
8,035
6,036 6,508
6,409 6,342
6,609
1,000 2,000 3,000 4,000 5,000 6,000 7,000 8,000 9,000
Jul-13 Jul-14 Jul-15 Jul-16 Jul-17
Apartment Plot Row House Villa

10 | P a g e
DEVELOPMENT WISE SALES VELOCITY
Sales Velocity Apartment Plot Row House Villa
Jul-13 4.3% 5.3% 5.4% 3.7%
Jul-14 2.3% (-46.2%) 1.4% (-74.2%) 3% (-44.5%) 1.7% (-54.2%)
Jul-15 1.6% (-30.1%) 2.3% (67.9%) 1.5% (-50.2%) 1.5% (-7.8%)
Jul-16 1% (-35.6%) 1.3% (-44.8%) 0.3% (-77.7%) 0.8% (-48.7%)
Jul-17 0.9% (-16.5%) 1% (-24.4%) 1% (197%) 0.9% (8.9%)
Sales Velocity of residential apartment and plots dropped by -16.5% and -24.4% respectively whereas the Row house and Villa developments observed a slight increase in its Sales Velocity by 1% and 09% respectively.
DEVELOPMENT WISE MONTHS INVENTORY
Months Inventory Apartment Plot Row House Villa
Jul-13 8 4 7 13
Jul-14 15 (77.1%) 15 (297.3%) 9 (34.3%) 23 (80%)
Jul-15 22 (47.6%) 12 (-21.8%) 21 (118.1%) 23 (.4%)
Jul-16 33 (49.8%) 17 (49.6%) 86 (320%) 42 (86.7%)
Jul-17 40 (21.8%) 30 (71.5%) 25 (-71.3%) 34 (-19%)
Months Inventory for apartment and plot recorded at 40 and 30 months respectively.
DEVELOPMENT WISE PERFORMANCE INDICATORS
0.0%
1.0%
2.0%
3.0%
4.0%
5.0%
6.0%
Jul-13 Jul-14 Jul-15 Jul-16 Jul-17
Sales Velocity
Apartment Plot
Row House Villa
0
20
40
60
80
100
Jul-13 Jul-14 Jul-15 Jul-16 Jul-17
Months Inventory
Apartment Plot Row House Villa

11 | P a g e
REGION WISE PRICE TREND
Price Trend Central North East North West South East South West
Jul-13 15,383 4,636 4,422 3,913 4,055
Jul-14 14,013 (-8.9%) 4,886 (5.4%) 5,168 (16.9%) 4,221 (7.9%) 4,408 (8.7%)
Jul-15 13,466 (-3.9%) 5,100 (4.4%) 5,344 (3.4%) 4,409 (4.5%) 4,651 (5.5%)
Jul-16 13,560 (.7%) 5,271 (3.4%) 5,627 (5.3%) 4,457 (1.1%) 4,846 (4.2%)
Jul-17 11,872 (-12.4%) 5,461 (3.6%) 5,796 (3%) 4,740 (6.3%) 5,576 (15.1%)
All regions except the Central region recorded a rise in the Average Capital Value. Central Region recorded an average capital value of an INR 11,872 per Sq. ft. which is a 12% drop compared to the previous price.
Average capital value of North East and North West saw a slight rise by 3.6% and 3% and reached INR 5,461 and INR 5,796 respectively.
4,636
4,886
5,100 5,271
5,461
4,422
5,168
5,344
5,627 5,796
3,913
4,221
4,409 4,457
4,740
3,500
4,000
4,500
5,000
5,500
6,000
Jul-13 Jul-14 Jul-15 Jul-16 Jul-17
Central North East North West South East South West

12 | P a g e
REGION WISE PERFORMANCE INDICATORS
REGION WISE SALES VELOCITY
Year Central North-east North-west South-east South-west
Jul-13 1.7% 4.3% 5.2% 3.9% 4.2%
Jul-14 3.6% (109.2%) 2.3% (-46.9%) 1.5% (-70.8%) 2.2% (-42.1%) 2.7% (-35.4%)
Jul-15 1.1% (-69.9%) 1.5% (-33.8%) 1.2% (-17.9%) 1.8% (-19.3%) 1.6% (-41.6%)
Jul-16 .96% (-11.9%) 1.1% (-29.8%) 0.9% (-29%) 1% (-43.9%) 1.1% (-34.4%)
Jul-17 1.02% (6.3%) 0.9% (-18.9%) 0.8% (-6.8%) 0.8% (-19.8%) 1% (-1.9%)
Central Region observed a surge in its Sales Velocity by 6.3% and touched 1.02% whereas all other regions observed a drop. Eastern Regions such as North-east and South-east witnessed a drop by -18.9% and -19.8% while reaching to 0.9% and 0.8% respectively.
REGION WISE MONTH INVENTORY
Year Central North-east North-west South-east South-west
Jul-13 14 9 7 9 10
Jul-14 9 (-34%) 15 (73.9%) 25 (246.5%) 15 (64.8%) 14 (35.6%)
Jul-15 37 (301.1%) 25 (60.8%) 25 (2%) 17 (15.3%) 26 (83%)
Jul-16 51 (36.5%) 33 (32.9%) 30 (19.5%) 33 (89.6%) 34 (29.8%)
Jul-17 41 (-20.2%) 38 (15%) 31 (4.3%) 44 (34.8%) 35 (3.6%)
The Months Inventory level augmented further for all regions, and South-east Region recorded the Maximum Month Inventory of 44 Months followed by Central Region with 41 Months.
The lowest Months Inventory recorded in North-east Region with 31 Months.
0.0%
1.0%
2.0%
3.0%
4.0%
5.0%
6.0%
Jul-13 Jul-14 Jul-15 Jul-16 Jul-17
Region Wise Sales Velocity
Central North-east North-west
South-east South-west
0
10
20
30
40
50
60
Jul-13 Jul-14 Jul-15 Jul-16 Jul-17
Region Wise Months Inventory
Central North-east North-west
South-east South-west
13 | P a g e
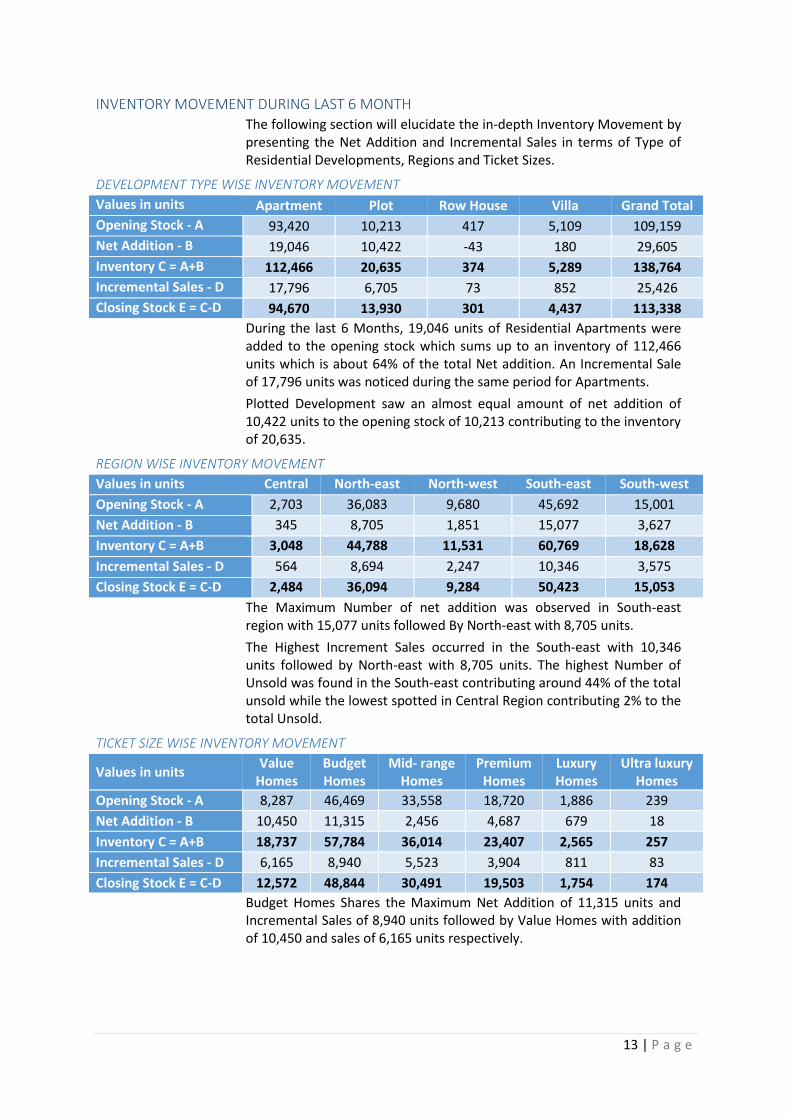
INVENTORY MOVEMENT DURING LAST 6 MONTH The following section will elucidate the in-depth Inventory Movement by
presenting the Net Addition and Incremental Sales in terms of Type of Residential Developments, Regions and Ticket Sizes.
DEVELOPMENT TYPE WISE INVENTORY MOVEMENT
Values in units Apartment Plot Row House Villa Grand Total
Opening Stock - A 93,420 10,213 417 5,109 109,159
Net Addition - B 19,046 10,422 -43 180 29,605
Inventory C = A+B 112,466 20,635 374 5,289 138,764
Incremental Sales - D 17,796 6,705 73 852 25,426
Closing Stock E = C-D 94,670 13,930 301 4,437 113,338
During the last 6 Months, 19,046 units of Residential Apartments were added to the opening stock which sums up to an inventory of 112,466 units which is about 64% of the total Net addition. An Incremental Sale of 17,796 units was noticed during the same period for Apartments.
Plotted Development saw an almost equal amount of net addition of 10,422 units to the opening stock of 10,213 contributing to the inventory of 20,635.
REGION WISE INVENTORY MOVEMENT
Values in units Central North-east North-west South-east South-west
Opening Stock - A 2,703 36,083 9,680 45,692 15,001
Net Addition - B 345 8,705 1,851 15,077 3,627
Inventory C = A+B 3,048 44,788 11,531 60,769 18,628
Incremental Sales - D 564 8,694 2,247 10,346 3,575
Closing Stock E = C-D 2,484 36,094 9,284 50,423 15,053
The Maximum Number of net addition was observed in South-east region with 15,077 units followed By North-east with 8,705 units.
The Highest Increment Sales occurred in the South-east with 10,346 units followed by North-east with 8,705 units. The highest Number of Unsold was found in the South-east contributing around 44% of the total unsold while the lowest spotted in Central Region contributing 2% to the total Unsold.
TICKET SIZE WISE INVENTORY MOVEMENT
Values in units Value
Homes Budget Homes
Mid- range Homes
Premium Homes
Luxury Homes
Ultra luxury Homes
Opening Stock - A 8,287 46,469 33,558 18,720 1,886 239
Net Addition - B 10,450 11,315 2,456 4,687 679 18
Inventory C = A+B 18,737 57,784 36,014 23,407 2,565 257
Incremental Sales - D 6,165 8,940 5,523 3,904 811 83
Closing Stock E = C-D 12,572 48,844 30,491 19,503 1,754 174
Budget Homes Shares the Maximum Net Addition of 11,315 units and Incremental Sales of 8,940 units followed by Value Homes with addition of 10,450 and sales of 6,165 units respectively.

14 | P a g e
YEARLY LAUNCHES COMPARISON
NEW LAUNCHES IN RESIDENTIAL APARTMENTS
Launched during Total Size in Mn Sq. ft. Unsold Size in Mn Sq. ft. Average Price per Sq. ft.
1st half 2013 57.3 14.6 4,585
2nd half 2013 42.6 (-25.6%) 19.3 (32.2%) 4,612 (0.6%)
1st half 2014 39.5 (-7.3%) 18.7 (-3%) 4,709 (2.1%)
2nd half 2014 47.1 (18.9%) 28.1 (50.6%) 4,937 (4.9%)
1st half 2015 29.5 (-37.2%) 23.2 (-17.7%) 5,852 (18.5%)
2nd Half 2015 22.68 (-23.1%) 18.11 (-21.9%) 4,998 (-14.6%)
1st Half 2016 11.41 (-49.7%) 8.4 (-53.5) 4,799 (-4%)
2nd Half 2016 4.5 (-60.9%) 3.3 (-61.0%) 4,651 (-3.1%)
1st Half 2017 9.8 (120.7%) 8 (144.3%) 3,315 (-28.7%)
During the last 6 month (1st Half-2017) in the Residential Market where Apartment Developments were concerned, an upsurge of 120% in its New Launches was witnessed. There are about 9.8 Mn Sq. ft. of apartment developments that were added during these last 6 month.
Weighted Average Capital Value of the newly launched apartment stands at INR 3,315 per Sq. ft. which is -28% fall when compared to the previous period.
Nearly 68% of Newly launched apartments fall under the Budget Homes Category (30-60lakh), and these are the developments causing a drop in its average price.
TICKET PRICE WISE NEW LAUNCHES
Values Value
Homes Budget Homes
Mid-range Homes
Premium Homes
Luxury Homes
Total size in mn sq. ft. 0.1 8.7 1.0 .02 .02
Unsold size in mn sq. ft. 0.1 7.2 0.7 0.002 0.016
Average Price per sq. ft. 2,293 3,147 4,746 9,450 15,000
Ticket size 14.3 lakh 43 lakh 62 lakh 2 crore 3 crore
4,585 4,612 4,709 4,937
5,852
4,998 4799 4,651
3,315
-
1,000
2,000
3,000
4,000
5,000
6,000
7,000
-
10.0
20.0
30.0
40.0
50.0
60.0
70.0
Launchedduring 1sthalf 2013
Launchedduring 2ndhalf 2013
Launchedduring 1sthalf 2014
Launchedduring 2ndhalf 2014
Launchedduring 1sthalf 2015
Launchedduring 2ndhalf 2015
Launchedduring 1sthalf 2016
Launchedduring 2ndhalf 2016
Launchedduring 1sthalf 2017
Total Size in mn sft Unsold Size in mn sft Average Price psf

15 | P a g e
RESIDENTIAL MARKET DYNAMICS
DEVELOPMENT TYPE WISE MARKET DYNAMICS
Values Apartment Plot Row House Villa Grand Total
Total Supply in units 279,088 49,051 1,246 15,062 344,447
Unsold Units 94,670 13,930 301 4,437 113,338
Total Size in Mn sq. ft. 413.8 110.3 4.0 48.9 576.9
Unsold Size in Mn sq. ft. 135.3 27.0 0.9 14.0 177.1
Value of Unsold In Crores 71,667 5,650 751 9,220 87,287
Bengaluru Residential Market has an inventory of 113,338 units in which 94,670 units accounting to 84% remain unsold, followed by plotted developments contributing to 12% (13,930) of the inventory.
Bengaluru has a Total supply of Residential Development spread across 576.9 Mn Sq. ft. of which 177.1 Mn Sq. ft. remains unsold translating to INR 87,287 crores of unsold units.
As far as the Value of unsold inventory is concerned, Villa developments contribute as the second highest supply with 11% (INR 9,220 crores).
REGION WISE MARKET DYNAMICS
Values Central North-east North-west South-east South-west
Total Supply in units 5,995 98,236 31,448 123,898 35,819
Unsold Units 2,484 31,694 8,042 44,329 12,859
Total Size in Mn sq. ft. 14.0 163.4 47.7 188.9 52.6
Unsold Size in Mn sq. ft. 5.6 49.6 12.2 63.8 19.0
Value of Unsold In Crores 6,700 27,070 7,048 30,229 10,591
Eastern region contributes 76% of the unsold Inventory of where the South-east shares 45% and the North-east shares 32% of the unsold units.
South-east has an unsold inventory of 63.8 Mn Sq. ft. translating into INR 30,229 crores of unsold units.
PRICE CATEGORY WISE MARKET DYNAMICS
Values Value
Homes Budget Homes
Mid- range
Premium Homes
Luxury Homes
Ultra-luxury
Total Supply in units 14,512 121,568 89,857 61,087 7,848 524
Unsold Units 6,184 44,443 27,896 18,987 1,724 174
Total Size in Mn sq. ft. 11.7 143.1 132.1 145.0 31.8 2.9
Unsold Size in Mn sq. ft. 4.8 51.7 40.7 45.4 6.6 1.0
Value of Unsold In Crores 1,322 20,395 21,153 29,207 7,235 2,326
Budget Homes and Mid-range Homes (30 lakh-1 crore) contribute to the maximum share of 73% of the unsold inventory of which the Budget Homes share 45% and Mid-range share 28%.
Value Homes(Less than 30 Lakh) contributes only 2% of the unsold inventory which translates to 6,184 units.

16 | P a g e
UNSOLD INVENTORY DISTRIBUTION BY CATEGORY WISE
DETAILED ANALYSIS ON THE BUDGET CATEGORIES
VALUE HOMES (LESS THAN 30 LAKH BUDGET)
Apartment Plot
H2-2016 H1-2017 H2-2016 H1-2017
Total Supply in units 13,488 14,512 16,470 19,453
Unsold Units 5,425 6,184 2,862 6,388
Total Size in Mn sq. ft. 10.9 11.7 32.4 36.7
Unsold Size in Mn sq. ft. 4.2 4.8 6.2 11.8
Value of Unsold Inventory In Crores 1165 1,322 661 1,254
Average Price perSq. ft.INR 2,663 2,730 1,144 1,066
Sales Velocity 0.90% 1.0% 1.44% 1.2%
Months Inventory 44.9 41.2 12.1 28.5
Average Size in sq. ft. 924 906 1,807 1,784
The Apartment category in Value Homes section witnessed an 8% increase in its Supply units and 14% increase in its unsold units. Average Capital Value increased by 3% and touched to INR 2,730 per sq. ft.
Apartments in Value homes observed a 1% sales velocity and have around 41.2 Months of inventory to offload, and the average size in this category stands at 906 Sq. ft.
Plotted developments in Value Home category attained a Sales Velocity of 1.2% which is a 17% drop as compared to the previous period.
Apartment83.53%
Plot12.29
%
Row House0.27%
Villa3.91%
Central2.50% North-east
31.88%
North-west8.09%
South-east44.59%
South-west
12.94%Value
Homes6.22%
Budget Homes44.71%
Mid- Range28.06%
Premium Homes19.10%
Luxury Homes1.73%
Ultra-luxury0.18%

17 | P a g e
BUDGET HOMES (30 LAKHS TO 60 LAKHS)
Apartment Plot Villa
H2-2016 H1-2017 H2-2016 H1-2017 H2-2016 H1-2017
Total Supply in units 120,807 121,255 18,462 19,220 448 313
Unsold Units 42,450 44,374 3,912 4,401 107 69
Total Size in Mn Sq. ft. 141.9 142.6 39.8 40.5 0.8 0.6
Unsold Size in Mn Sq. ft. 48.9 51.6 7.2 8.0 0.2 0.1
Value of Unsold In Crores 20,060 20,363 1521 1,725 51 32
Average Price perSq. ft.INR 3,779 3,947 2,087 2,160 2,500 2,681
Sales Velocity 1.01% 0.9% 1.26% 0.8% 2.08% 0.4%
Months Inventory 34.9 41.0 16.9 27.0 11.5 56.1
Average Size in Sq. ft. 1,239 1,231 2,121 2,049 1,824 1,658
Apartments in the Budget Homes category saw a drop in its Sales Velocity where it reached a mark 0.9% - a drop by 11% where the unsold inventory went up by 5%.
Unsold Inventory of plotted development in Budget homes increased by 13% and Sales Velocity dropped by 37%.
Budget category Villa development saw a sharp drop of 81% in its sales velocity.
MID-RANGE HOMES (60 LAKHS TO 1 CRORE)
Apartment Plot Row House Villa
H2-16 H1-17 H2-16 H1-17 H2-16 H1-17 H2-16 H1-17
Total Supply in units 92,677 86,831 6,549 6,726 207 207 3,963 2,819
Unsold Units 29,778 26,907 2,736 2,595 116 86 928 903
Total Size in Mn Sq. ft. 136.8 126.4 16.1 16.3 0.5 0.5 7.5 5.3
Unsold Size in Mn Sq. ft. 44.3 38.8 6.0 5.6 0.3 0.2 1.8 1.7
Value of Unsold In Crores 22,750 20,308 1,736 1,903 100 73 813 772
Avg. Price perSq. ft.INR 5,088 5,233 3,313 3,406 3,900 3,800 4,394 4,523
Sales Velocity 0.86% 0.85% 1.43% 1.2% 2.74% 2.4% 1.30% 0.1%
Months Inventory 37.3 37 29.1 33.5 20.5 17.2 18.1 -
Average Size in sq. ft. 1,496 1,500 2,442 2,311 2,244 2,244 1,902 1,895
Mid-range category apartment saw a drop of 10% in its unsold inventory from the 2nd half of 2016. Sales Velocity of the same remains unaffected during the 1st half of 2017.
Plotted development in the Mid-range category fell 18% in its Sales velocity and touched to 1.2%.
Row house development Unsold inventory has reduced by -26% and noted 3% decline in its price as well and not stands at 3,800 per Sq. ft.

18 | P a g e
PREMIUM HOMES (1 CRORE TO 3 CRORES)
Apartment Plot Row House Villa
H2-16 H1-17 H2-16 H1-17 H2-16 H1-17 H2-16 H1-17
Total Supply in units 47,703 51,624 3,761 3,369 1,278 928 8,614 8,535
Unsold Units 14,678 16,041 703 516 254 185 3,085 2,761
Total Size in Mn Sq. ft. 106.5 114.5 17.5 15.3 3.9 2.9 28.1 27.5
Unsold Size in Mn Sq. ft. 32.5 35.7 2.2 1.5 0.8 0.6 10.2 9.0
Value of Unsold InCrores 22,596 23,571 937 670 558 405 5,629 5,231
Avg. Price perSq. ft.INR 7,016 6,594 4,243 4,430 6,870 6,826 5,903 5,799
Sales Velocity 0.83% 0.7% 1.24% 0.2% 0.52% 0.5% 0.44% 0.7%
Months Inventory 37.2 44.2 15.1 73.7 38.1 39.6 81.9 44.3
Average Size in Sq. ft. 2,370 2,282 3,771 3,593 3,097 3,199 3,206 3,182
The Apartment in the Premium home category saw an increase in its supply and unsold by 8% and 9% respectively. Whereas the Sales Velocity has come down to 0.7% which is about -16% drop resulting in 44.2 Months of inventory to sell.
Plotted development in this category witnessed a sharp decline of 84% in its Sales Velocity, while Villa development saw a 59% increase when compared to the second half 2017.
LUXURY HOMES (3 CRORES TO 8 CRORES)
Apartment Villa
H2-16 H1-17 H2-16 H1-17
Total Supply in units 3,662 4,623 3,060 3,225
Unsold Units 963 1,062 921 662
Total Size in Mn Sq. ft. 14.0 17.1 13.5 14.7
Unsold Size in Mn Sq. ft. 3.5 3.7 3.9 2.9
Value of Unsold Inventory In Crores 4,292 4,439 3,633 2,795
Average Price perSq. ft.INR 12,802 12,056 9,300 9,704
Sales Velocity 0.44% 1.2% 0.56% 1.9%
Months Inventory 59.4 18.7 54.2 11.1
Average Size in Sq. ft. 3,761 3,604 4,544 4,782
Under Luxury homes category, Apartment and Villa development offer most of the options. Apartment witnessed a 26% and a 10% increase in its supply and unsold respectively. Sales Velocity has improved by 173% reaching 1.2%.
Villa development under Luxury homes observed a 239% increase from 0.56% to 1.9% resulting in lowering of the Months Inventory to 11.1 months.

19 | P a g e
ULTRA-LUXURY HOMES (8 CRORES TO 25 CRORES)
Apartment Row House Villa
H2-16 H1-17 H2-16 H1-17 H2-16 H1-17
Total Supply in units 232 243 111 111 209 170
Unsold Units 126 102 45 30 68 42
Total Size in Mn sq. ft. 1.3 1.4 0.6 0.6 1.2 0.9
Unsold Size in Mn sq. ft. 0.7 0.6 0.2 0.2 0.4 0.2
Value of Unsold Inventory In Crores 1960 1,664 405 273 630 389
Average Price per Sq. ft. INR 25,429 28,384 18,000 18,220 13,980 17,440
Sales Velocity 0.89% 2.1% - 2.3% 0.64% 2.5%
Months Inventory 60.8 19.9 - 12.0 51.0 9.7
Average Size in sq. ft. 5,021 5,591 5,000 5,000 6,738 5,313
In Ultra luxury category, all residential developments observed a good amount of Sales Velocity achieving more than 2.1%. Average size of an individual unit in this category is starting from 5000 Sq. ft.
The luxury segment Apartment has an unsold inventory of 6 lakh Sq. ft, which translates to a value of INR 1,664 crores.
REGION WISE RESIDENTIAL MARKET DYNAMICS The following section sheds light on the region wise residential market
dynamics.
BENGALURU - CENTRAL MARKET DYNAMICS
Apartment Row House
H2-16 H2-17 H2-16 H2-17
Total Supply in units 5,714 5,990 77 5
Unsold Units 2,697 2,481 6 3
Total Size in Mn Sq. ft. 13.4 14.0 0.2 0.0
Unsold Size in Mn Sq. ft. 6.3 5.6 0.0 0.0
Value of Unsold Inventory In Crores 7,599 6,673 48 28
Average Price perSq. ft.INR 15,471 11,855 13,750 18,400
Sales Velocity 1.6% 1.0% - 6.7%
Months Inventory 28.8 40.7 - 9.0
Average Size in Sq. ft. 3,149 2,953 4,028 5,000
Bengaluru Central region witnessed a drop in its Sales Velocity by -38% while its month inventory increased to 40.7 Months. Average size of an apartment has tumbled down to -6% reducing to 2,953 Sq. ft.
Unsold inventory size of an Apartment in central region reduced by -11% and reached to 5.6 Mn Sq. ft. And, average capital value decreased by 23% and touched to INR 11,855 per Sq. ft.
Row house development in the Central Region has only 3 units to be sold and the average price per Sq. ft.is Rs.18,400.

20 | P a g e
BENGALURU NORTH-EAST MARKET DYNAMICS
Apartment Plot Row House Villa
H2-16 H1-17 H2-16 H1-17 H2-16 H1-17 H2-16 H1-17
Total Supply in units 95,863 93,791 11,400 15,567 1,025 714 3,757 3,731
Unsold Units 31,668 30,380 2,820 4,400 320 201 1,275 1,113
Total Size in Mn Sq. ft. 151.6 146.6 24.6 32.9 3.3 2.4 14.0 14.4
Unsold Size in Mn Sq. ft. 47.3 45.0 5.7 9.0 1.0 0.6 4.6 3.9
Value of Unsold In Crore 24,778 23,448 1,089 1,448 833 535 3,427 3,087
Avg. Price perSq. ft.INR 4,931 5,210 1,898 1,614 6,995 8,555 8,306 7,844
Sales Velocity 1.0% 0.8% 2.2% 1.4% 1.2% 1.7% - 1.5%
Months Inventory 34.2 39.2 11.4 20.7 25.6 17.0 - 19.4
Average Size in Sq. ft. 1,657 1,611 1,980 1,934 3,330 3,287 4,063 3,991
North-east region has an unsold of 30,380 units which translates to a value of INR 23,448 crores. During the last period Unsold inventory levels reduced by 4% from 31,668 units.
Sales Velocity of apartment in the North-east region has dropped to 0.8% and Months Inventory level increased to 39.2 Months. Average price of apartments in the North-east increased by 6% and reached INR 5,210 per Sq. ft.
Plotted Developments in the North-east region witnessed a surge in its supply and Unsold inventory by 37% and 56% respectively. Whereas, the Sales Velocity saw a drop by 36% and touched to 1.4%.
BENGALURU NORTH-WEST MARKET DYNAMICS
Apartment Plot Villa
H2-16 H1-17 H2-16 H1-17 H2-16 H1-17
Total Supply in units 31,386 30,420 3,914 4,046 1,478 1,028
Unsold Units 8,098 7,720 1,100 1,242 482 322
Total Size in Mn sq. ft. 44.1 44.2 9.2 9.6 4.7 3.6
Unsold Size in Mn sq. ft. 11.5 11.1 2.8 3.1 1.6 1.1
Value of Unsold Inventory In Crores 6,526 6,023 478 542 1,601 1,025
Average Price perSq. ft.INR 5,340 5,444 2,667 1,766 7,562 9,344
Sales Velocity 0.8% 0.8% 1.6% 0.9% 1.8% 2.5%
Months Inventory 33.7 33.5 17.8 35.6 18.2 12.3
Average Size in sq. ft. 1,626 1,729 2,256 2,262 3,532 3,636
Bengaluru North-west region has seen a 3% decrease in its supply and a 5% decrease in its unsold units. Average price of an apartment rise by 2% and stands at 5,444 per Sq. ft.
Plotted developments in North-west saw a decline in its Sales Velocity by -44% which translates to 35 Months of Unsold Inventory.

21 | P a g e
BENGALURU SOUTH-EAST MARKET DYNAMICS
Apartment Plot Row House Villa
H2-16 H1-17 H2-16 H1-17 H2-16 H1-17 H2-16 H1-17
Total Supply in units 111,840 113,373 21,817 22,104 345 317 11,249 10,208
Unsold Units 38,521 41,312 3,818 6,094 54 47 3,299 2,970
Total Size in Mn Sq. ft. 154.2 157.1 50.2 47.6 1.1 1.0 32.6 30.8
Unsold Size in Mn Sq.ft. 50.8 54.8 8.8 11.2 0.2 0.2 10.1 8.9
Value of Unsold InCrore 24,056 25,050 1,753 2,063 116 96 5,690 5,084
Avg. Price per Sq. ft.INR 4,455 4,575 1,758 1,840 6,977 6,019 5,262 5,736
Sales Velocity 0.9% 0.8% 1.0% 0.8% - 0.4% 0.8% 0.4%
Months Inventory 38.8 43.1 17.6 33.9 - 40.3 35.0 69.5
Average Size in Sq. ft. 1,463 1,469 2,198 2,133 3,096 3,212 2,819 2,917
Bengaluru South-east have witnessed an 8% increase in its Apartment development, and nearly 4 Mn Sq. ft. has further been added during this period. Average price of an apartment in South-east is increased by 3%.
BENGALURU SOUTH-WEST MARKET DYNAMICS
Apartment Plot Row House Villa
H2-16 H1-17 H2-16 H1-17 H2-16 H1-17 H2-16 H1-17
Total Supply in units 33,766 35,514 8,111 7,334 174 210 95 95
Unsold Units 12,436 12,777 2,475 2,194 37 50 53 32
Total Size in Mn Sq. ft. 48.0 51.9 21.8 20.2 0.5 0.6 0.2 0.2
Unsold Size in Mn Sq. ft. 18.1 18.8 4.3 3.7 0.1 0.1 0.1 0.1
Value of Unsold In Crores 9,863 10,475 1,536 1,596 75 93 39 24
Avg. Price perSq. ft.INR 4,885 5,571 2,502 4,261 7,490 6,848 4,200 4,300
Sales Velocity 0.9% 1.0% 1.0% 0.6% 0.3% -0.6% - 3.7%
Months Inventory 42.0 34.7 30.1 48.5 74.0 -42.9 - 9.1
Average Size in Sq. ft. 1,518 1,608 2,387 2,386 2,695 2,710 1,733 1,733
South west region’s average apartment price has increased by 14% and the price of plotted development increased by 70%. South-west has 18.8 Mn Sq. ft. of Unsold Inventory in it apartment developments.
Villa development attained the highest Sales Velocity of 3.7% in South east region.
PROMINENT/EMERGING RESIDENTIAL CLUSTERS AROUND BENGALURU
Location Total Units
Total Size in Mn sq.ft.
Unsold Size in Mn sq.ft.
Value of Unsold in
crore
Weighted Average Price
Whitefield 29,841 49.7 14.6 7,854 5,369
Electronic City 28,933 38.3 19.7 7,575 3,842
Sarjapur Road 20,279 31.5 7.7 3,689 4,818
Yelahanka 11,781 19.9 5.4 3,081 5,704
Kanakapura Road 11,612 16.2 5.0 2,458 4,947
Thanisandra Main Road 10,256 14.6 4.9 2,488 5,103
JP Nagar 8,024 14.1 5.9 3,371 5,727
Hennur Road 9,029 14.0 4.3 2,183 5,119
Begur Road 8,702 13.2 4.8 2,485 5,215

22 | P a g e
Location Total Units
Total Size in Mn sq.ft.
Unsold Size in Mn sq.ft.
Value of Unsold in
crore
Weighted Average Price
Haralur Road 7,686 12.4 3.9 2,166 5,585
Hebbal 4,906 12.3 2.5 1,832 7,429
Sarjapur 6,095 11.2 3.8 1,561 4,095
Gunjur 5,125 10.0 4.0 2,213 5,575
Hosur Road 7,335 10.0 2.0 937 4,765
Devanahalli 5,699 9.7 3.4 1,613 4,730
Marathahalli 4,549 9.1 1.9 1,138 6,017
KR Puram 5,556 9.0 1.9 898 4,808
Hoskote 5,990 7.6 2.3 861 3,822
Bannerghatta Road 3,444 6.7 1.9 1,287 6,693
Varthur 5,206 6.5 2.0 796 4,065
Banashankari 3,903 6.5 3.1 2,009 6,447
Jakkur 3,568 6.2 1.4 775 5,374
Binnipete 3,298 6.2 3.0 2,209 7,307
Koramangala 2,579 6.2 1.5 1,426 9,258
Horamavu 3,379 5.9 2.4 1,397 5,718
Yeshwanthpur 2,967 5.8 2.0 1,442 7,367
Jalahalli 4,144 5.6 1.6 778 5,004
Jigani -Anekal Road 1,350 5.4 1.7 1,064 6,202
Doddaballapur Road 4,350 4.9 1.1 469 4,238
Sahakar Nagar 2,846 4.8 1.7 1,104 6,424
Mysore Road 3,688 4.7 1.7 779 4,578
Kengeri 4,171 4.6 1.1 468 4,171
Old Madras Road 4,189 4.6 1.9 815 4,328
Bellandur 2,323 4.3 1.1 594 5,652
Rajajinagar 1,762 3.8 1.0 1,138 11,783
Chandapura - Anekal Road 3,516 3.7 1.0 273 2,840
Vidyaranyapura 3,244 3.7 1.2 510 4,095
Old Airport Road 1,269 3.5 0.5 643 12,847
Rajarajeshwari Nagar 2,518 3.2 1.2 562 4,572
Mahadhevapura 1,877 3.1 1.3 819 6,178
Avalahalli 2,469 2.6 1.5 668 4,427
HSR Layout 1,576 2.2 1.1 789 7,084
Attibelle 2,469 2.1 0.7 221 3,082
Hosa Road 1,654 2.1 0.7 281 4,199
Tumkur Road 1,875 1.9 0.6 248 4,304
Chandapura 1,874 1.8 1.3 322 2,511
Uttarahalli 1,164 1.5 0.2 120 4,970
Whitefield, Electronic city and Sarjapur Road are the highest contributors of Primary Residential Supply. These three residential pockets offer 42 Mn Sq. ft. of the Unsold Inventory.

23 | P a g e
ANNEXURE- REGIONS AND ITS LOCATION DETAILS
Regions Locations
Central
Binnipete, Lalbagh, Rajajinagar, Indiranagar, Mekri Circle, Vittal Mallya Road, Cunningham Road, Frazer Town, Sankey Road, Richmond Road, Sadashiva Nagar, Shivaji Nagar, MG road, Wheeler Road, Kalasipalayam, Domlur, Wilson Garden, Benson Town, Jayamahal, Richards Park
North-east
Whitefield, Devanahalli, Thanisandra Main Road, Hennur Road, Yelahanka, Hoskote, Hebbal, Horamavu, Old Madras Road, KR Puram, Jakkur, Mahadhevapura, Chikkaballapur, Old Airport Road, Marathahalli, Nandi Hills, Hennur, Outer Ring Road, Avalahalli, Bagalur, Banaswadi, Vidhyanagar Cross, Kodigehalli, Kammanahalli, Ramamurthi Nagar, ITPL , CV Raman Nagar, Kalyan Nagar, H Cross, RT Nagar, Budigere Cross, RMV Extension
North-west Yelahanka, Doddaballapur Road, Yeshwanthpur, Sahakar Nagar, Jalahalli, Vidyaranyapura, Nelamangala, Tumkur Road, IVC Road, Magadi Road, Kannahalli, Nagarbhavi, Rajajinagar, Mathikere, Kodigehalli, Malleshwaram, Rajankunte
South-east
Electronic City, Sarjapur Road, Begur Road, Gunjur, Sarjapur, Haralur Road, Bannerghatta Road, Varthur, Jigani -Anekal Road, Hosur Road, Bagalur, HSR Layout, Attibelle, Avalahalli, Chandapura - Anekal Road, Jigani, Marathahalli, Bellandur , Koramangala, Hosa Road, Hosur, Gottigere, Bellandur, Kasavanahalli, Varthur Road, Hulimavu Main Road, Narayanaghatta, Bommasandra, Outer Ring Road, Anekal, Anjanapura, Jayanagar, BTM Layout, Panathur, Uttarahalli, Jagadenahalli, Bommanahalli, Adugodi, Wilson Garden, Marsur
South-west Kanakapura Road, JP Nagar, Banashankari, Mysore Road, Kengeri, Rajarajeshwari Nagar, Jigani, Uttarahalli, Kumbalgudu, Sulikere, Kumaraswamy Layout, Jayanagar, Bidadi
PRICE CATEGORY AND ITS TICKET SIZES
Price Category Ticket Size
Value Homes 0 - 30 Lakhs
Budget Homes 30 Lakhs - 60 Lakhs
Mid-range 60 Lakhs - 1 Crore
Premium 1 Crore - 3 Crore
Luxury 3 Crore - 8 Crore
Ultra-Luxury 8 Crore - 23 Crore
GLOSSARY Inventory: It is the unsold stock between two dates of survey. It covers all new launches (new additions) as well as carry forward inventory from the previous survey: Previous Unsold + New Additions.
Sales Velocity: This signifies demand – supply scenario in a market. It is the ratio between monthly sales and total supply and gives an idea of gestation period of a project as per the existing dynamics. Ideally SV shall be between 2.75% and 3%. The pace translates into gestation period of a maximum of 36 months of a project.
Months Inventory: This represents the number of months required for the inventory in the market to be absorbed according to the existing demand. It is calculated by dividing the closing stock (marketable stock) by monthly sales.
Weighted Average Price: This represents average price of the city/location against the unsold stock. Every project’s unsold stock is multiplied with its price and summation of this product is divided by total unsold stock to derive the weighted average price.

24 | P a g e
PART- III PRIMARY PROJECT SOURCE DATA
APARTMENT DEVELOPMENTS
BENGALURU - CENTRAL

25 | P a g e