Embed Size (px)
Citation preview

The$Home$Sales$Real$Estate$Report$$The$Woodlands$|$March$5th,$2015$Lis>ng$Inventory$Month$By$Month$Home$Sales$Month$By$Month$$Average$Sold$Price$/$Median$Sold$Price$–$Month$By$Month$Average$Price$Per$Square$Foot$–$Month$By$Month$Average$Days$On$Market$–$Month$By$Month$Months$Supply$of$For$Sale$Inventory$–$Month$By$Month$$$$
9000 Forest Crossing Drive | The Woodlands TX 77381 | 281-367-3531
281-367-3531
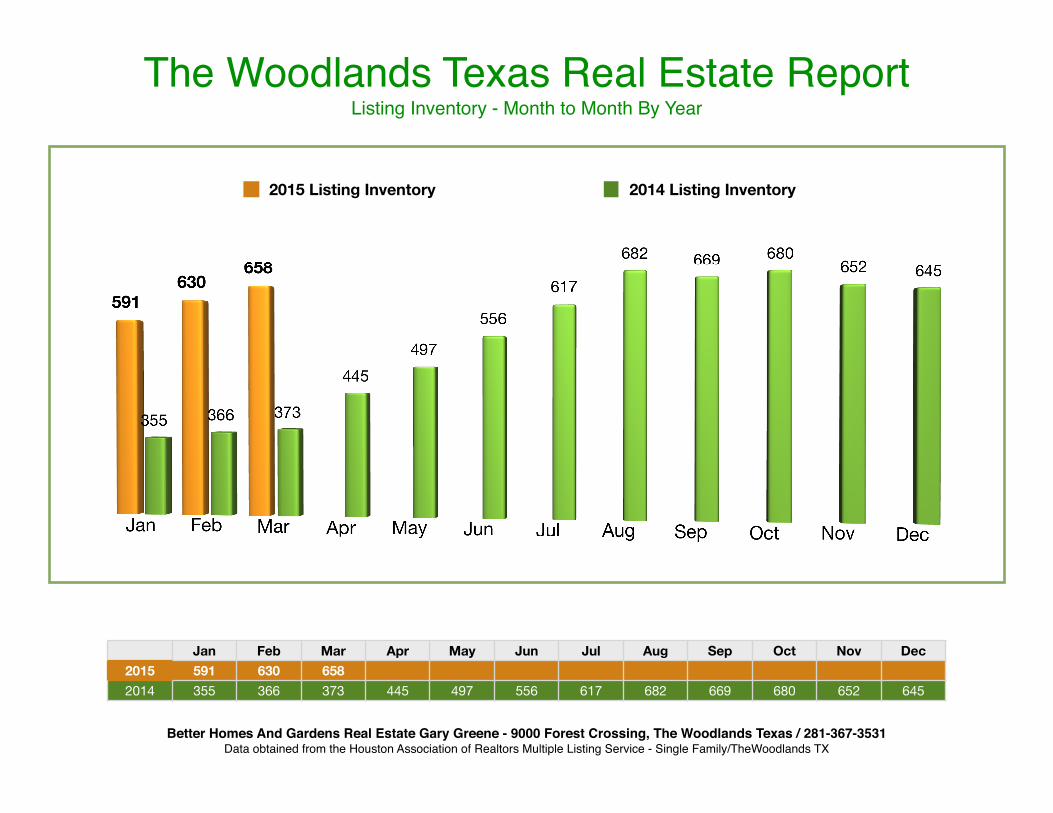
The Woodlands Texas Real Estate ReportListing Inventory - Month to Month By Year
Jan Feb Mar Apr May Jun Jul Aug Sep Oct Nov Dec2015 591 630 6582014 355 366 373 445 497 556 617 682 669 680 652 645
Better Homes And Gardens Real Estate Gary Greene - 9000 Forest Crossing, The Woodlands Texas / 281-367-3531Data obtained from the Houston Association of Realtors Multiple Listing Service - Single Family/TheWoodlands TX
2015 Listing Inventory 2014 Listing Inventory
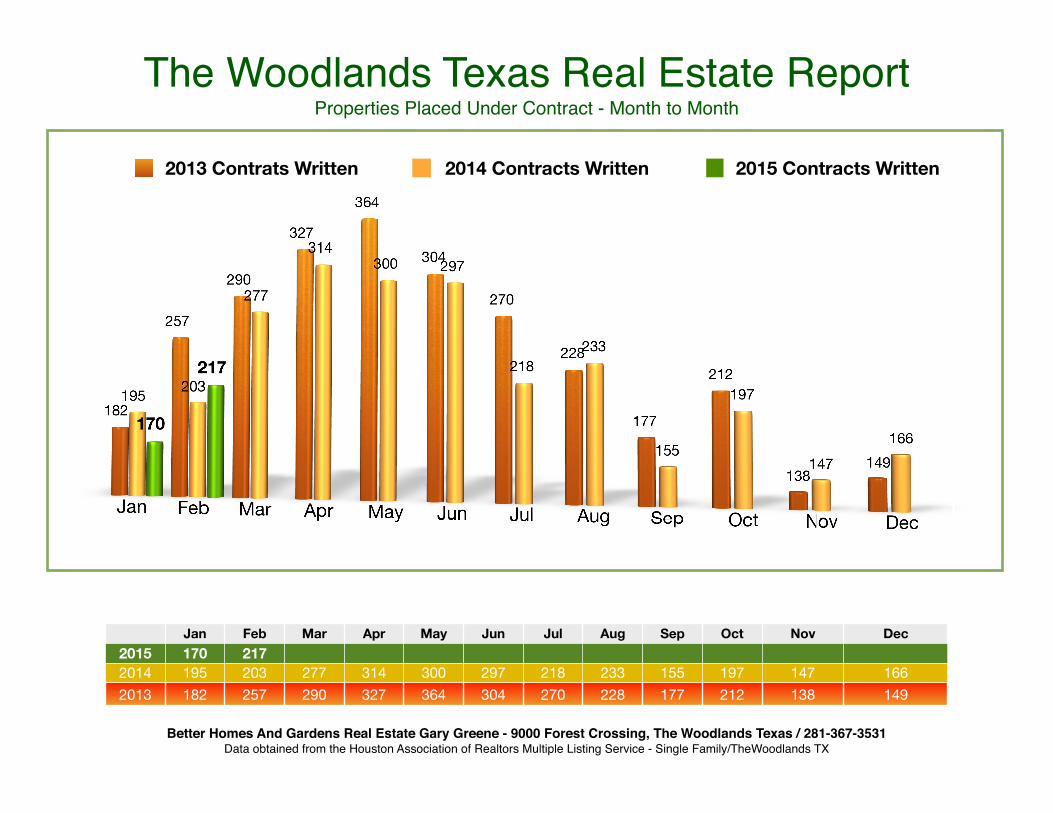
The Woodlands Texas Real Estate ReportProperties Placed Under Contract - Month to Month
Jan Feb Mar Apr May Jun Jul Aug Sep Oct Nov Dec2015 170 2172014 195 203 277 314 300 297 218 233 155 197 147 1662013 182 257 290 327 364 304 270 228 177 212 138 149
Better Homes And Gardens Real Estate Gary Greene - 9000 Forest Crossing, The Woodlands Texas / 281-367-3531Data obtained from the Houston Association of Realtors Multiple Listing Service - Single Family/TheWoodlands TX
2013 Contrats Written 2014 Contracts Written 2015 Contracts Written
KEY INFORMATION
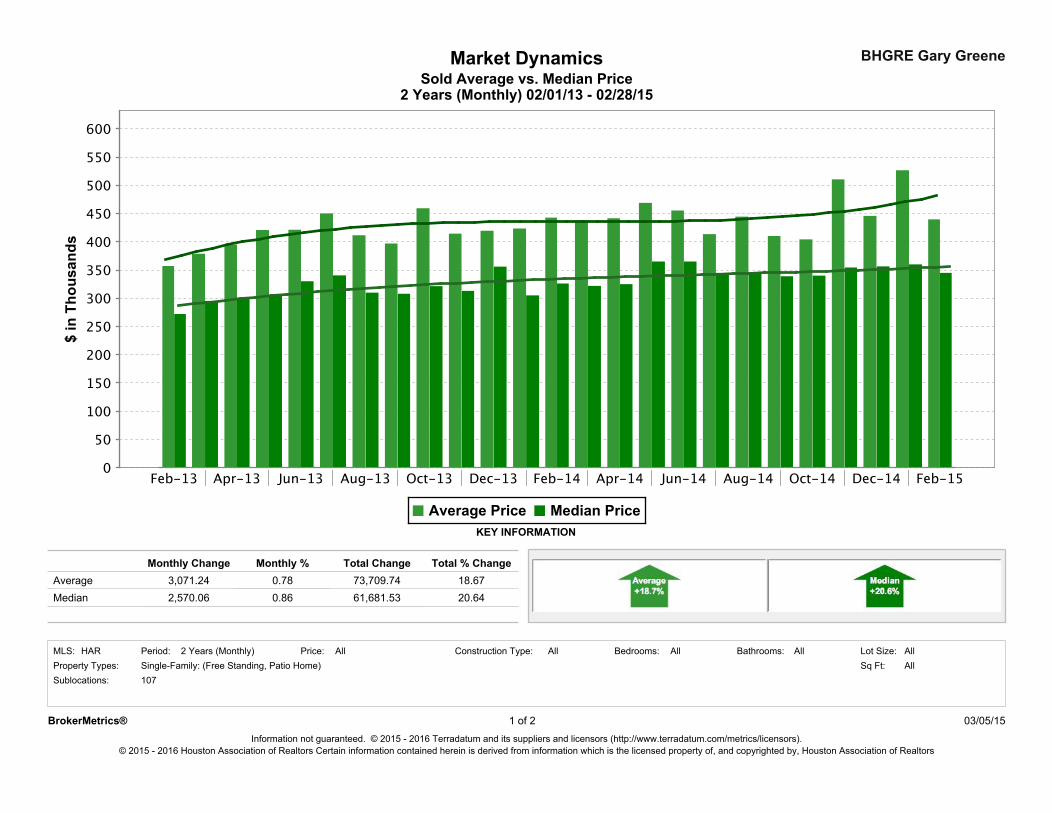
2 Years (Monthly) 02/01/13 - 02/28/15
Market Dynamics BHGRE Gary GreeneSold Average vs. Median Price
Monthly % Total % Change
20.640.78
Monthly Change
2,570.06Median
Total ChangeAverage 3,071.24 73,709.74 18.67
61,681.530.86
Sublocations:All
Bathrooms:Single-Family: (Free Standing, Patio Home) Sq Ft:
HAR AllAll AllAllAll Lot Size:Bedrooms:Property Types:
107
2 Years (Monthly) Construction Type:Price:Period:MLS:
03/05/15BrokerMetrics®Information not guaranteed. © 2015 - 2016 Terradatum and its suppliers and licensors (http://www.terradatum.com/metrics/licensors).
© 2015 - 2016 Houston Association of Realtors Certain information contained herein is derived from information which is the licensed property of, and copyrighted by, Houston Association of Realtors
1 of 2
BHGRE Gary Greene
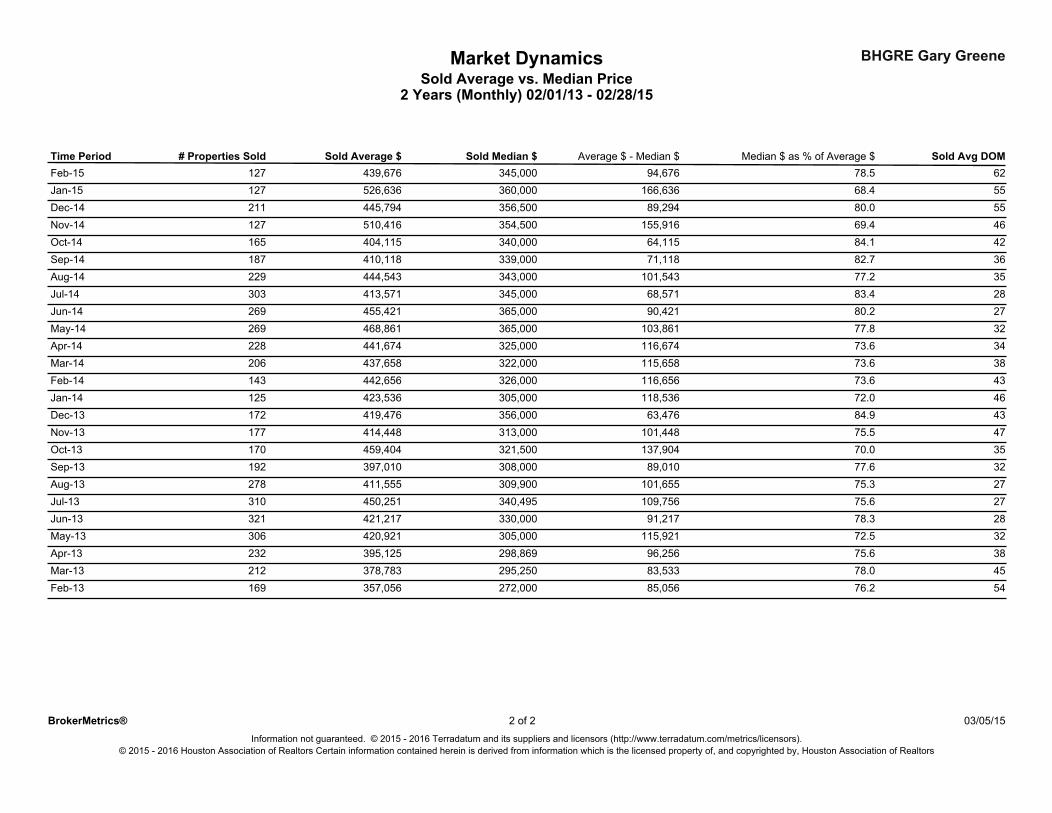
2 Years (Monthly) 02/01/13 - 02/28/15
Market DynamicsSold Average vs. Median Price
Time Period # Properties Sold Sold Average $ Sold Median $ Sold Avg DOMAverage $ - Median $ Median $ as % of Average $127Feb-15 439,676 78.5345,000 94,676 62127Jan-15 526,636 68.4360,000 166,636 55211Dec-14 445,794 80.0356,500 89,294 55127Nov-14 510,416 69.4354,500 155,916 46165Oct-14 404,115 84.1340,000 64,115 42187Sep-14 410,118 82.7339,000 71,118 36229Aug-14 444,543 77.2343,000 101,543 35303Jul-14 413,571 83.4345,000 68,571 28269Jun-14 455,421 80.2365,000 90,421 27269May-14 468,861 77.8365,000 103,861 32228Apr-14 441,674 73.6325,000 116,674 34206Mar-14 437,658 73.6322,000 115,658 38143Feb-14 442,656 73.6326,000 116,656 43125Jan-14 423,536 72.0305,000 118,536 46172Dec-13 419,476 84.9356,000 63,476 43177Nov-13 414,448 75.5313,000 101,448 47170Oct-13 459,404 70.0321,500 137,904 35192Sep-13 397,010 77.6308,000 89,010 32278Aug-13 411,555 75.3309,900 101,655 27310Jul-13 450,251 75.6340,495 109,756 27321Jun-13 421,217 78.3330,000 91,217 28306May-13 420,921 72.5305,000 115,921 32232Apr-13 395,125 75.6298,869 96,256 38212Mar-13 378,783 78.0295,250 83,533 45169Feb-13 357,056 76.2272,000 85,056 54
© 2015 - 2016 Houston Association of Realtors Certain information contained herein is derived from information which is the licensed property of, and copyrighted by, Houston Association of Realtors
2 03/05/152 ofBrokerMetrics®Information not guaranteed. © 2015 - 2016 Terradatum and its suppliers and licensors (http://www.terradatum.com/metrics/licensors).
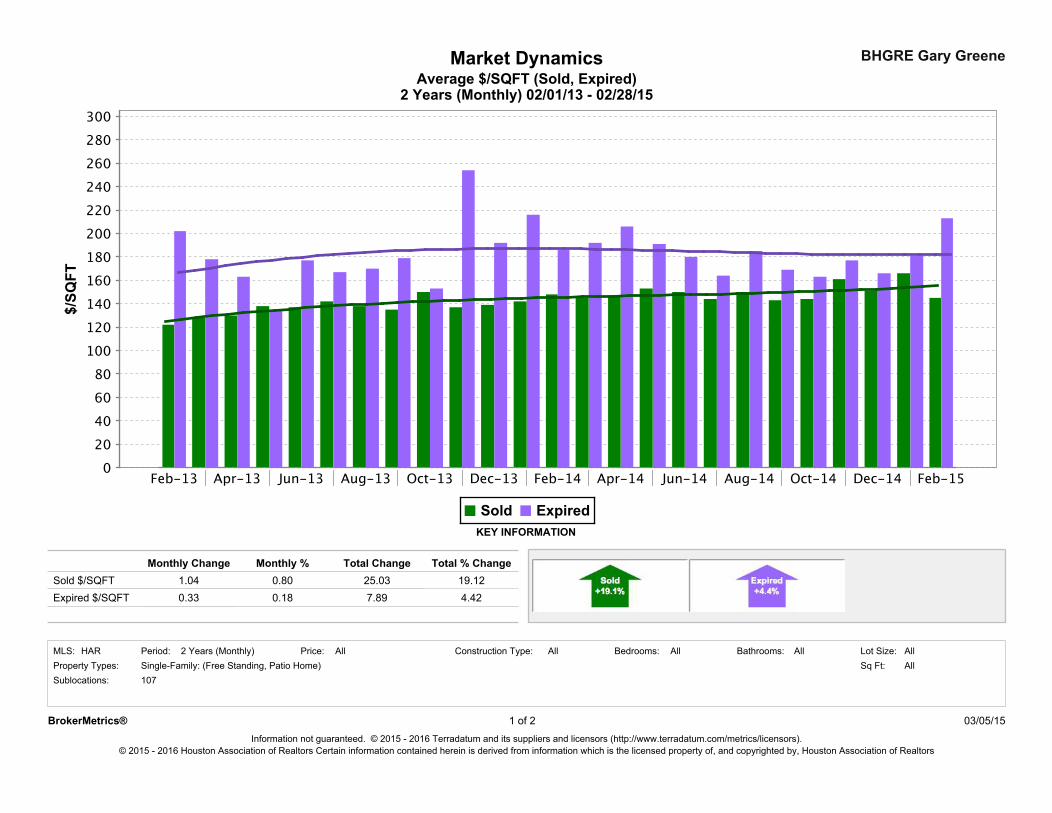
Market DynamicsAverage $/SQFT (Sold, Expired)
2 Years (Monthly) 02/01/13 - 02/28/15
BHGRE Gary Greene
Price:
0.80
AllAll All
0.1825.03
Property Types:HAR
Expired $/SQFTSold $/SQFT
MLS: All
0.33
Bathrooms:
1.04
All
4.427.89
Construction Type:
Total Change
Sq Ft:
Monthly Change
2 Years (Monthly)
Sublocations:
All
19.12
Lot Size:Period:
Monthly %
Bedrooms:
KEY INFORMATION
Total % Change
Single-Family: (Free Standing, Patio Home)107
03/05/15BrokerMetrics®Information not guaranteed. © 2015 - 2016 Terradatum and its suppliers and licensors (http://www.terradatum.com/metrics/licensors).
© 2015 - 2016 Houston Association of Realtors Certain information contained herein is derived from information which is the licensed property of, and copyrighted by, Houston Association of Realtors
1 of 2
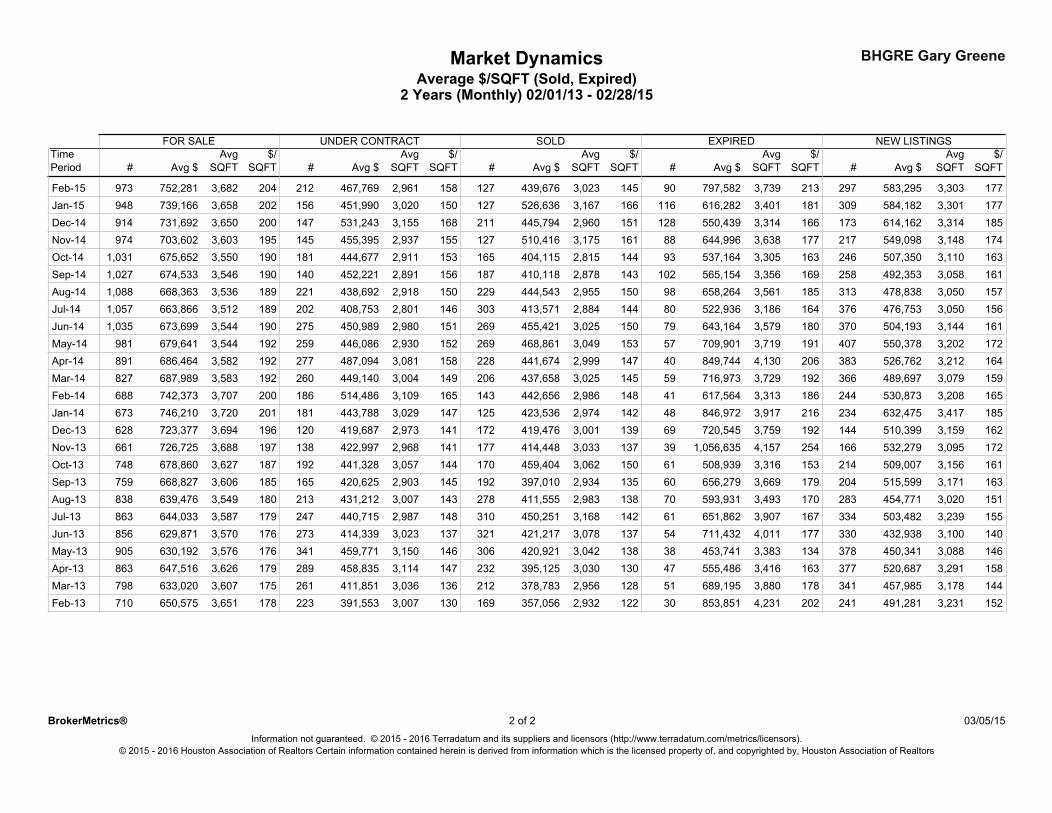
Average $/SQFT (Sold, Expired)2 Years (Monthly) 02/01/13 - 02/28/15
Market Dynamics BHGRE Gary Greene
#
FOR SALE
SQFTPeriod$/Avg
SQFTTime
Avg $
UNDER CONTRACT
# Avg $Avg
SQFT$/
SQFT
SOLD EXPIRED NEW LISTINGS
# # #Avg $ Avg $ Avg $Avg
SQFT$/
SQFTAvg
SQFT$/
SQFTAvg
SQFT$/
SQFT
204Feb-15 973 3,682752,281 212 467,769 2,961 158 127 90 297439,676 797,582 583,2953,023 145 3,739 213 3,303 177202Jan-15 948 3,658739,166 156 451,990 3,020 150 127 116 309526,636 616,282 584,1823,167 166 3,401 181 3,301 177200Dec-14 914 3,650731,692 147 531,243 3,155 168 211 128 173445,794 550,439 614,1622,960 151 3,314 166 3,314 185195Nov-14 974 3,603703,602 145 455,395 2,937 155 127 88 217510,416 644,996 549,0983,175 161 3,638 177 3,148 174190Oct-14 1,031 3,550675,652 181 444,677 2,911 153 165 93 246404,115 537,164 507,3502,815 144 3,305 163 3,110 163190Sep-14 1,027 3,546674,533 140 452,221 2,891 156 187 102 258410,118 565,154 492,3532,878 143 3,356 169 3,058 161189Aug-14 1,088 3,536668,363 221 438,692 2,918 150 229 98 313444,543 658,264 478,8382,955 150 3,561 185 3,050 157189Jul-14 1,057 3,512663,866 202 408,753 2,801 146 303 80 376413,571 522,936 476,7532,884 144 3,186 164 3,050 156190Jun-14 1,035 3,544673,699 275 450,989 2,980 151 269 79 370455,421 643,164 504,1933,025 150 3,579 180 3,144 161192May-14 981 3,544679,641 259 446,086 2,930 152 269 57 407468,861 709,901 550,3783,049 153 3,719 191 3,202 172192Apr-14 891 3,582686,464 277 487,094 3,081 158 228 40 383441,674 849,744 526,7622,999 147 4,130 206 3,212 164192Mar-14 827 3,583687,989 260 449,140 3,004 149 206 59 366437,658 716,973 489,6973,025 145 3,729 192 3,079 159200Feb-14 688 3,707742,373 186 514,486 3,109 165 143 41 244442,656 617,564 530,8732,986 148 3,313 186 3,208 165201Jan-14 673 3,720746,210 181 443,788 3,029 147 125 48 234423,536 846,972 632,4752,974 142 3,917 216 3,417 185196Dec-13 628 3,694723,377 120 419,687 2,973 141 172 69 144419,476 720,545 510,3993,001 139 3,759 192 3,159 162197Nov-13 661 3,688726,725 138 422,997 2,968 141 177 39 166414,448 1,056,635 532,2793,033 137 4,157 254 3,095 172187Oct-13 748 3,627678,860 192 441,328 3,057 144 170 61 214459,404 508,939 509,0073,062 150 3,316 153 3,156 161185Sep-13 759 3,606668,827 165 420,625 2,903 145 192 60 204397,010 656,279 515,5992,934 135 3,669 179 3,171 163180Aug-13 838 3,549639,476 213 431,212 3,007 143 278 70 283411,555 593,931 454,7712,983 138 3,493 170 3,020 151179Jul-13 863 3,587644,033 247 440,715 2,987 148 310 61 334450,251 651,862 503,4823,168 142 3,907 167 3,239 155176Jun-13 856 3,570629,871 273 414,339 3,023 137 321 54 330421,217 711,432 432,9383,078 137 4,011 177 3,100 140176May-13 905 3,576630,192 341 459,771 3,150 146 306 38 378420,921 453,741 450,3413,042 138 3,383 134 3,088 146179Apr-13 863 3,626647,516 289 458,835 3,114 147 232 47 377395,125 555,486 520,6873,030 130 3,416 163 3,291 158175Mar-13 798 3,607633,020 261 411,851 3,036 136 212 51 341378,783 689,195 457,9852,956 128 3,880 178 3,178 144178Feb-13 710 3,651650,575 223 391,553 3,007 130 169 30 241357,056 853,851 491,2812,932 122 4,231 202 3,231 152
© 2015 - 2016 Houston Association of Realtors Certain information contained herein is derived from information which is the licensed property of, and copyrighted by, Houston Association of Realtors
2 03/05/152 ofBrokerMetrics®Information not guaranteed. © 2015 - 2016 Terradatum and its suppliers and licensors (http://www.terradatum.com/metrics/licensors).
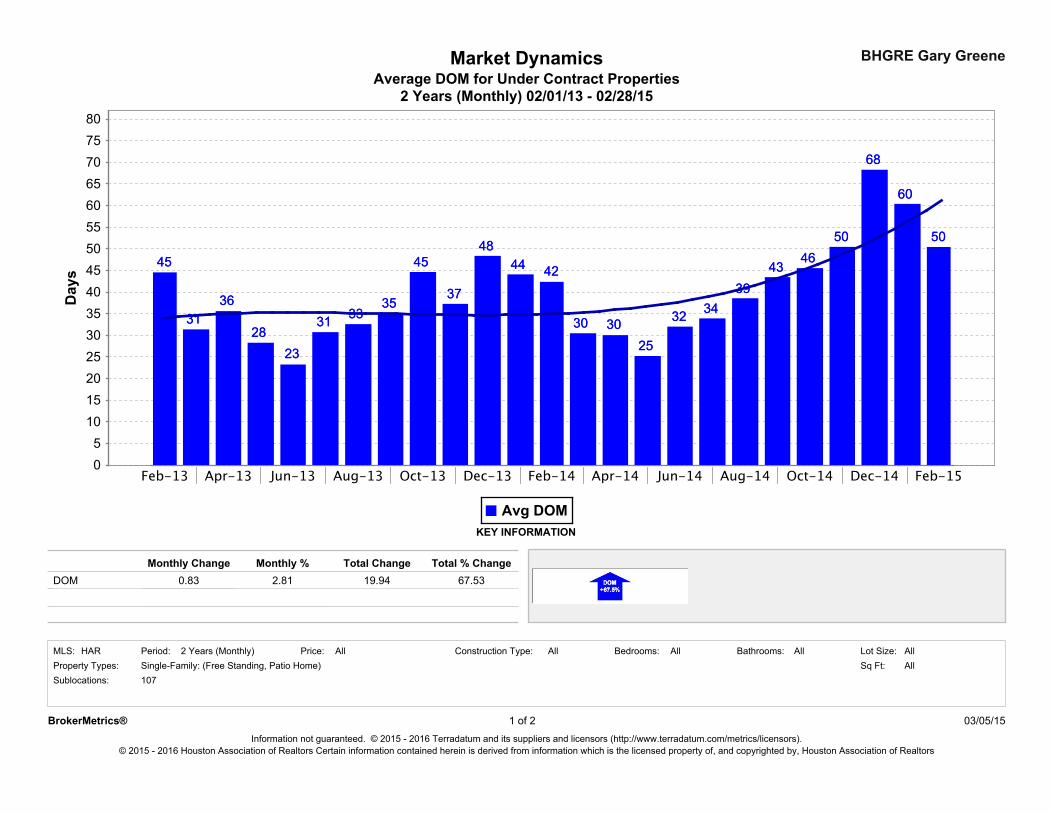
BHGRE Gary GreeneMarket Dynamics
2 Years (Monthly) 02/01/13 - 02/28/15Average DOM for Under Contract Properties
Monthly %0.83
107
Total % Change
Sq Ft:Bathrooms:All All
DOM
Construction Type:
Sublocations:
Period:Property Types:
19.94 67.53Monthly Change
2.81
Lot Size:All
KEY INFORMATION
Single-Family: (Free Standing, Patio Home) AllHAR AllBedrooms:
Total Change
AllMLS: Price:2 Years (Monthly)
Information not guaranteed. © 2015 - 2016 Terradatum and its suppliers and licensors (http://www.terradatum.com/metrics/licensors).
BrokerMetrics® 1 of 2
© 2015 - 2016 Houston Association of Realtors Certain information contained herein is derived from information which is the licensed property of, and copyrighted by, Houston Association of Realtors
03/05/15
Average DOM for Under Contract PropertiesMarket Dynamics BHGRE Gary Greene
2 Years (Monthly) 02/01/13 - 02/28/15
Period Avg DOM Avg CDOMContract# UnderTime
50Feb-15 9021260Jan-15 8115668Dec-14 9514750Nov-14 7614546Oct-14 6418143Sep-14 6114039Aug-14 4922134Jul-14 4420232Jun-14 4227525May-14 2925930Apr-14 4627730Mar-14 4826042Feb-14 5718644Jan-14 7018148Dec-13 6112037Nov-13 5313845Oct-13 6219235Sep-13 5816533Aug-13 4421331Jul-13 4724723Jun-13 4227328May-13 3834136Apr-13 6328931Mar-13 5126145Feb-13 67223
2
© 2015 - 2016 Houston Association of Realtors Certain information contained herein is derived from information which is the licensed property of, and copyrighted by, Houston Association of Realtors
03/05/15Information not guaranteed. © 2015 - 2016 Terradatum and its suppliers and licensors (http://www.terradatum.com/metrics/licensors).
BrokerMetrics® 2 of
! Page 1 9000 Forest Crossing The Woodlands, Texas 77381 Office: 281.367.3531 or 800.932.7253
The Woodlands Texas Real Estate Report Months Supply Of “For Sale” Listing Inventory – February 2nd, 2015
Q. Is it still a Seller’s Market? According to real estate economists a six-month supply of For Sale Inventory represents a balanced market. Over six months of For Sale Inventory indicates a buyer’s market. Less than six months of inventory in considered a seller’s market. As we can see from these inventory numbers below, sellers priced under $700,000 enjoy a seller’s market. Here’s a break down by price.
PRICE RANGE MONTHS SUPPLY OF LISTING INVENTORY
$000,000 – $200,000 . . . . . . . . . . . . . . . . . . . . 21 Days $200,001 – $300,000 . . . . . . . . . . . . . . . . . . . . 1.7 Months
$300,001 – $400,000 . . . . . . . . . . . . . . . . . . . . 2.3 Months $400,001 – $500,000 . . . . . . . . . . . . . . . . . . . . 3.2 Months $500,001 – $600,000 . . . . . . . . . . . . . . . . . . . . 3.2 Months $600,001 – $700,000 . . . . . . . . . . . . . . . . . . . . 5.6 Months $700,001 – $800,000 . . . . . . . . . . . . . . . . . . . . 6.6 Months $800,001 – $900,000 . . . . . . . . . . . . . . . . . . . . 7.2 Months $900,001 – $1,000,000 . . . . . . . . . . . . . . . . . . . 9.1 Months
$1,000,001 - $1,500,000 . . . . . . . . . . . . . . . . . 8.9 Months $1,500,001 - $2,000,000 . . . . . . . . . . . . . . . . 14.2 Months
$2,000,001+ . . . . . . . . . . . . . . . . . . . . . . . . . . 23.0 Months All Price Ranges . . . . . . . . . . . . . . . . . . . . . . . . 3.3 Months
What does this mean? For Buyers: When shopping seller’s market price ranges, when you find something you love, don’t hesitate to submit an offer. If you snooze you lose out. When shopping buyer’s market price ranges the services of a shrewd negotiator will help you secure the very best price and terms. What ever your price range, to buy your property for the best possible price and terms call us today – 281-367-3531 For Sellers: In a buyer’s market you’ll need maximum exposure, fierce marketing and a skilled negotiator to help you win. What ever your price range, to sell your property for HIGHEST possible price and the BEST possible terms call us today. 281-367-3531
Closing Thoughts: While mulling over these inventory numbers, keep in mind these figures represent big averages across The Woodlands. Real estate is hyper local in nature and market conditions for your specific property, in your specific neighborhood may be different that the big average you see above.
To find out what’s happening in your neighborhood, contact us and we’ll provide you with an up to the minute, on-target Months Supply of Inventory report. Give us a call and we’ll send you your free report – pronto.
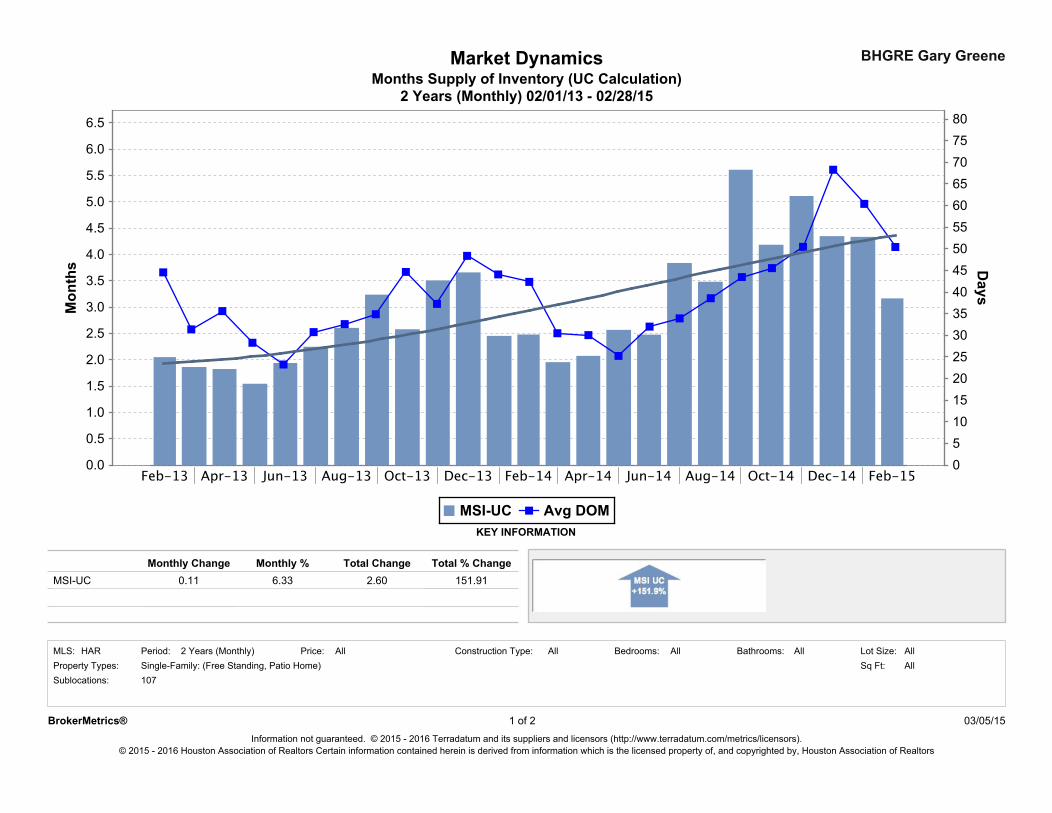
Months Supply of Inventory (UC Calculation)Market Dynamics
2 Years (Monthly) 02/01/13 - 02/28/15
BHGRE Gary Greene
Sublocations:
151.91
Price:HAR Bedrooms:Period:
Monthly %MSI-UC
2 Years (Monthly)
107
6.33
Single-Family: (Free Standing, Patio Home)
Total % Change
Property Types:
KEY INFORMATION
AllAll Lot Size:All
2.60Monthly Change
0.11Total Change
Sq Ft:AllAll Bathrooms:MLS: AllConstruction Type:
Information not guaranteed. © 2015 - 2016 Terradatum and its suppliers and licensors (http://www.terradatum.com/metrics/licensors).
BrokerMetrics® 1 of 2
© 2015 - 2016 Houston Association of Realtors Certain information contained herein is derived from information which is the licensed property of, and copyrighted by, Houston Association of Realtors
03/05/15
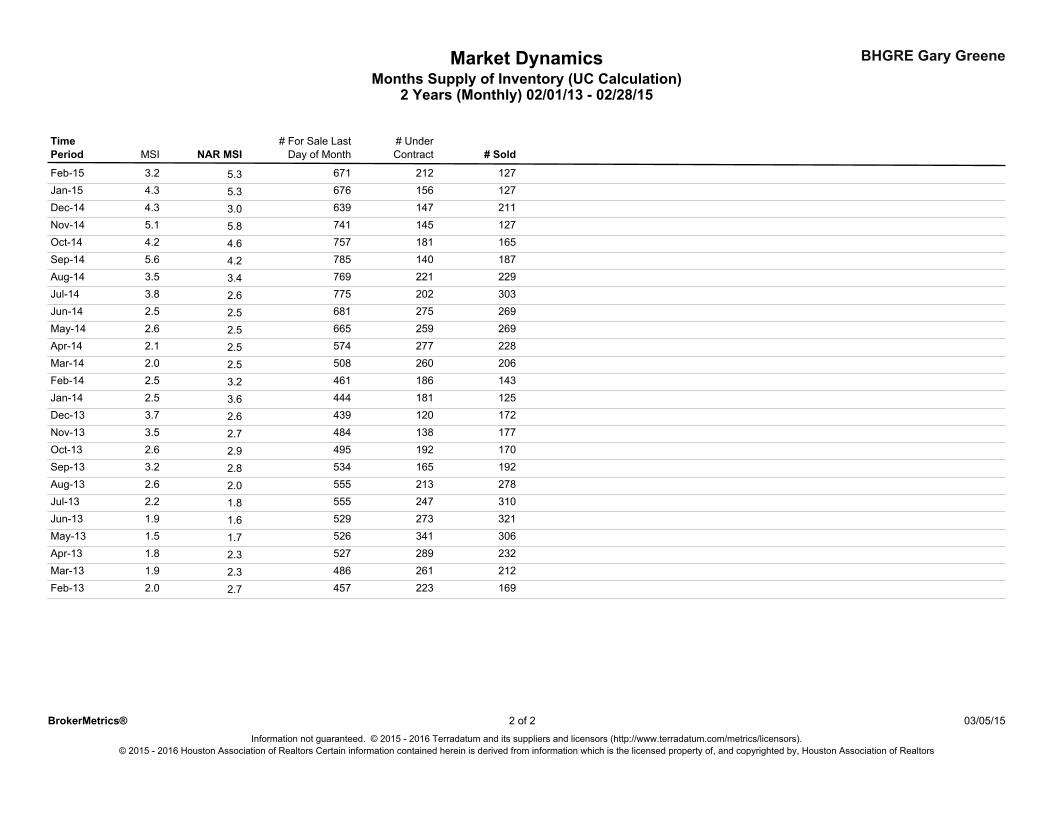
BHGRE Gary GreeneMarket DynamicsMonths Supply of Inventory (UC Calculation)
2 Years (Monthly) 02/01/13 - 02/28/15
Period NAR MSI # SoldMSI# For Sale Last
Day of Month# UnderContract
Time
5.3Feb-15 212 1276713.2
5.3Jan-15 156 1276764.3
3.0Dec-14 147 2116394.3
5.8Nov-14 145 1277415.1
4.6Oct-14 181 1657574.2
4.2Sep-14 140 1877855.6
3.4Aug-14 221 2297693.5
2.6Jul-14 202 3037753.8
2.5Jun-14 275 2696812.5
2.5May-14 259 2696652.6
2.5Apr-14 277 2285742.1
2.5Mar-14 260 2065082.0
3.2Feb-14 186 1434612.5
3.6Jan-14 181 1254442.5
2.6Dec-13 120 1724393.7
2.7Nov-13 138 1774843.5
2.9Oct-13 192 1704952.6
2.8Sep-13 165 1925343.2
2.0Aug-13 213 2785552.6
1.8Jul-13 247 3105552.2
1.6Jun-13 273 3215291.9
1.7May-13 341 3065261.5
2.3Apr-13 289 2325271.8
2.3Mar-13 261 2124861.9
2.7Feb-13 223 1694572.0
2
© 2015 - 2016 Houston Association of Realtors Certain information contained herein is derived from information which is the licensed property of, and copyrighted by, Houston Association of Realtors
03/05/15Information not guaranteed. © 2015 - 2016 Terradatum and its suppliers and licensors (http://www.terradatum.com/metrics/licensors).
BrokerMetrics® 2 of


![P-Woodlands County AR 2008-007401woodlands.ab.ca/wp-content/...Woodlands-County... · Woodlands County Statement 1 As at December 31 2008 2007 $ $ [restated - ASSETS see note 15]](https://img.pdfslide.net/doc/110x75/5edd405fad6a402d66684750/p-woodlands-county-ar-2008-woodlands-county-statement-1-as-at-december-31-2008.jpg)