Embed Size (px)
Citation preview
Monthly Indicators A RESEARCH TOOL PROVIDED BY THE GREATER BOSTON ASSOCIATION OF REALTORS®
November 2014 Quick Facts
- 4.3%
Year-Over-Year(YoY) Change inClosed Sales
Single-Family Only
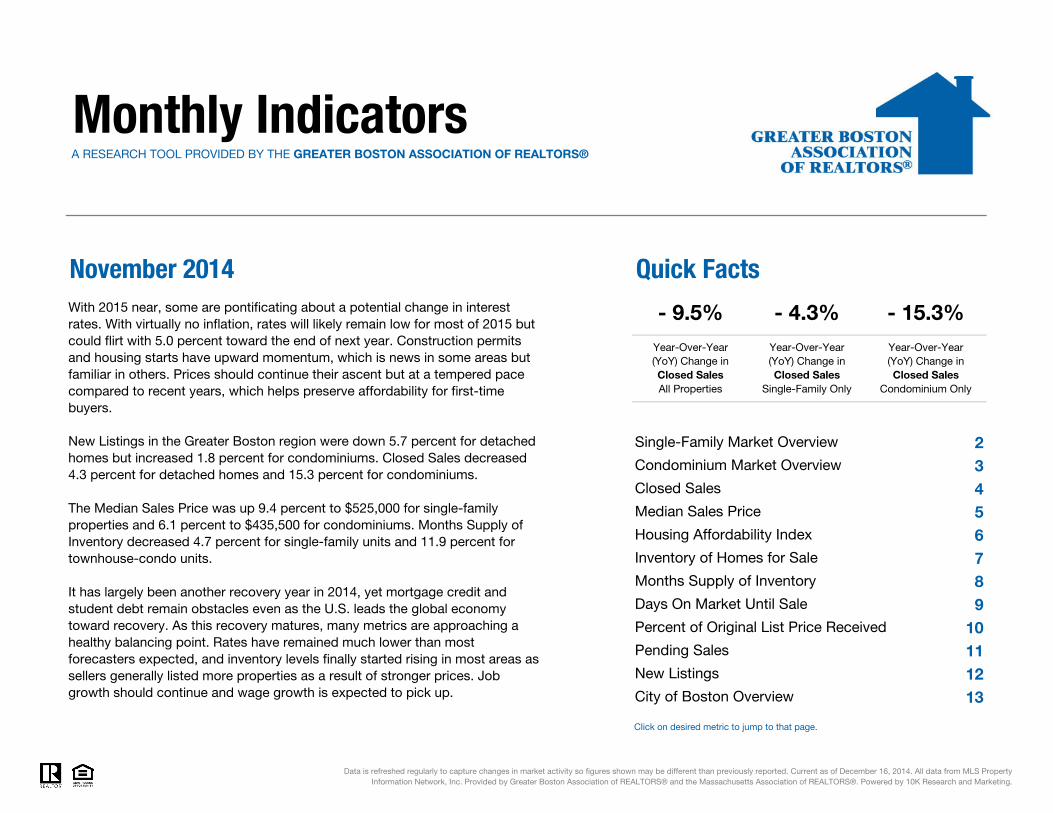
With 2015 near, some are pontificating about a potential change in interest rates. With virtually no inflation, rates will likely remain low for most of 2015 but could flirt with 5.0 percent toward the end of next year. Construction permits and housing starts have upward momentum, which is news in some areas but familiar in others. Prices should continue their ascent but at a tempered pace compared to recent years, which helps preserve affordability for first-time buyers.
- 15.3%Year-Over-Year(YoY) Change inClosed Sales
Condominium Only
- 9.5%Year-Over-Year(YoY) Change inClosed SalesAll Properties
23456789
10111213
Data is refreshed regularly to capture changes in market activity so figures shown may be different than previously reported. Current as of December 16, 2014. All data from MLS PropertyInformation Network, Inc. Provided by Greater Boston Association of REALTORS® and the Massachusetts Association of REALTORS®. Powered by 10K Research and Marketing.
New Listings in the Greater Boston region were down 5.7 percent for detached homes but increased 1.8 percent for condominiums. Closed Sales decreased 4.3 percent for detached homes and 15.3 percent for condominiums.
The Median Sales Price was up 9.4 percent to $525,000 for single-family properties and 6.1 percent to $435,500 for condominiums. Months Supply of Inventory decreased 4.7 percent for single-family units and 11.9 percent for townhouse-condo units.
It has largely been another recovery year in 2014, yet mortgage credit and student debt remain obstacles even as the U.S. leads the global economy toward recovery. As this recovery matures, many metrics are approaching a healthy balancing point. Rates have remained much lower than most forecasters expected, and inventory levels finally started rising in most areas as sellers generally listed more properties as a result of stronger prices. Job growth should continue and wage growth is expected to pick up.
Single-Family Market Overview
Condominium Market Overview
Closed Sales
Median Sales Price
Housing Affordability Index
Inventory of Homes for Sale
Click on desired metric to jump to that page.
Months Supply of Inventory
Days On Market Until Sale
Percent of Original List Price Received
City of Boston Overview
Pending Sales
New Listings

Single-Family Market Overview Key market metrics for the current month and year-to-date figures for Single-Family Homes Only.
Key Metrics Historical Sparklines Nov-2013 Nov-2014 + / – YTD 2013 YTD 2014 + / –
Median Sales Price
- 8.8% -- --
- 12.9% 94 85 - 9.5%
--
Housing Affordability Index
Inventory of Homes for Sale
$480,000 + 5.2%
98 85
2,483 2,265
$525,000 + 9.4% $499,900
9,833 - 6.1%Closed Sales 792 758 - 4.3% 10,469
$526,000
11-2011 11-2012 11-2013 11-2014
11-2011 11-2012 11-2013 11-2014
11-2011 11-2012 11-2013 11-2014
11-2011 11-2012 11-2013 11-2014
97.1% 97.7%
- 5.2%
+ 0.6%Percent of OriginalList Price Received
Days on Market Until Sale
96.3%
+ 8.2%
+ 0.3%
70
96.5%
Pending Sales - 3.7%10,526693 799 + 15.3% 10,929
Months Supply of Inventory 3.1
65 64
-- -- --3.0 - 4.7%
68
All data from MLS Property Information Network, Inc. Provided by the Greater Boston Association of REALTORS® and the Massachusetts Association of REALTORS®. Powered by 10K Research and Marketing. | Click for Cover Page | 2
New Listings 650 613 - 5.7% 14,142 14,247 + 0.7%
0 0 0 3 0
11-2011 11-2012 11-2013 11-2014
11-2011 11-2012 11-2013 11-2014
11-2011 11-2012 11-2013 11-2014
11-2011 11-2012 11-2013 11-2014
11-2011 11-2012 11-2013 11-2014

Condominium Market Overview Key market metrics for the current month and year-to-date figures for Condominium Properties Only.
Key Metrics Historical Sparklines Nov-2013 Nov-2014 + / – YTD 2013 YTD 2014 + / –
- 5.9%
Median Sales Price $410,500 $435,500 + 6.1% $405,000 $430,000 + 6.2%
Closed Sales 711 602 - 15.3% 9,588 9,025
- 10.3%
Inventory of Homes for Sale 1,628 1,215 - 25.4% -- -- --
Housing Affordability Index 114 102 - 10.2% 116 104
11-2011 11-2012 11-2013 11-2014
11-2011 11-2012 11-2013 11-2014
11-2011 11-2012 11-2013 11-2014
11-2011 11-2012 11-2013 11-2014
--
Days on Market Until Sale 51 54 + 5.6% 53 53 + 1.2%
Months Supply of Inventory 2.3 2.0 - 11.9% -- --
+ 0.6%
Pending Sales 627 667 + 6.4% 10,055 9,453 - 6.0%
Percent of OriginalList Price Received
98.9% 98.2% - 0.7% 98.9% 99.5%
- 6.5%
All data from MLS Property Information Network, Inc. Provided by the Greater Boston Association of REALTORS® and the Massachusetts Association of REALTORS®. Powered by 10K Research and Marketing. | Click for Cover Page | 3
New Listings 553 563 + 1.8% 12,291 11,488
0 0 0 3 0
11-2011 11-2012 11-2013 11-2014
11-2011 11-2012 11-2013 11-2014
11-2011 11-2012 11-2013 11-2014
11-2011 11-2012 11-2013 11-2014
11-2011 11-2012 11-2013 11-2014
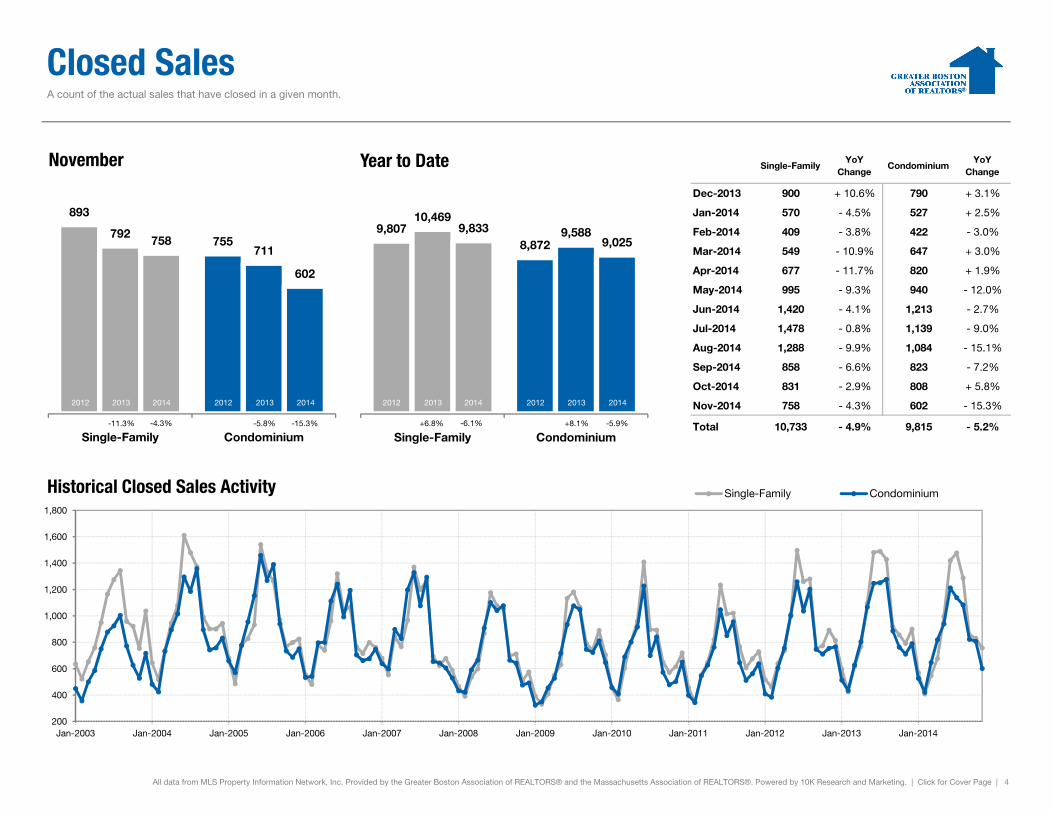
Closed Sales A count of the actual sales that have closed in a given month.
Single-FamilyYoY
ChangeCondominium
YoYChange
Dec-2013 900 + 10.6% 790 + 3.1%
Jan-2014 570 - 4.5% 527 + 2.5%
Feb-2014 409 - 3.8% 422 - 3.0%
Mar-2014 549 - 10.9% 647 + 3.0%
Apr-2014 677 - 11.7% 820 + 1.9%
May-2014 995 - 9.3% 940 - 12.0%
Jun-2014 1,420 - 4.1% 1,213 - 2.7%
Jul-2014 1,478 - 0.8% 1,139 - 9.0%
Aug-2014 1,288 - 9.9% 1,084 - 15.1%
Sep-2014 858 - 6.6% 823 - 7.2%
Oct-2014 831 - 2.9% 808 + 5.8%
Nov-2014 758 - 4.3% 602 - 15.3%
893
755792
711758
602
November
20142013 20142013
9,8078,872
10,4699,5889,833
9,025
Year to Date
20142013 201420132012 2012 2012 2012
Total 10,733 - 4.9% 9,815 - 5.2%
All data from MLS Property Information Network, Inc. Provided by the Greater Boston Association of REALTORS® and the Massachusetts Association of REALTORS®. Powered by 10K Research and Marketing. | Click for Cover Page | 4
Single-Family Condominium
200
400
600
800
1,000
1,200
1,400
1,600
1,800
Jan-2003 Jan-2004 Jan-2005 Jan-2006 Jan-2007 Jan-2008 Jan-2009 Jan-2010 Jan-2011 Jan-2012 Jan-2013 Jan-2014
Historical Closed Sales Activity Single-Family Condominium
-15.3%-5.8%-11.3%
Single-Family Condominium-5.9%+8.1%+6.8%-4.3% -6.1%
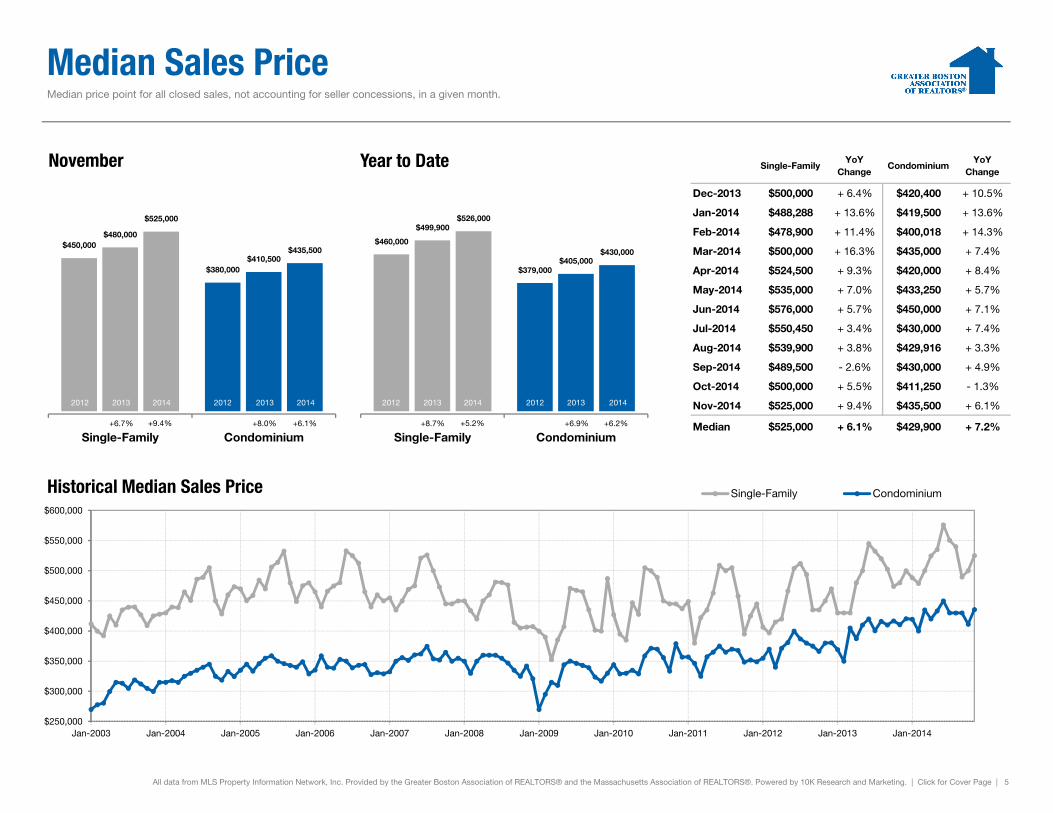
Median Sales Price Median price point for all closed sales, not accounting for seller concessions, in a given month.
Single-FamilyYoY
ChangeCondominium
YoYChange
Dec-2013 $500,000 + 6.4% $420,400 + 10.5%
Jan-2014 $488,288 + 13.6% $419,500 + 13.6%
Feb-2014 $478,900 + 11.4% $400,018 + 14.3%
Mar-2014 $500,000 + 16.3% $435,000 + 7.4%
Apr-2014 $524,500 + 9.3% $420,000 + 8.4%
May-2014 $535,000 + 7.0% $433,250 + 5.7%
Jun-2014 $576,000 + 5.7% $450,000 + 7.1%
Jul-2014 $550,450 + 3.4% $430,000 + 7.4%
Aug-2014 $539,900 + 3.8% $429,916 + 3.3%
Sep-2014 $489,500 - 2.6% $430,000 + 4.9%
Oct-2014 $500,000 + 5.5% $411,250 - 1.3%
Nov-2014 $525,000 + 9.4% $435,500 + 6.1%
$450,000
$380,000
$480,000
$410,500
$525,000
$435,500
November
20142013 20142013
$460,000
$379,000
$499,900
$405,000
$526,000
$430,000
Year to Date
20142013 201420132012 2012 2012 2012
Median $525,000 + 6.1% $429,900 + 7.2%
All data from MLS Property Information Network, Inc. Provided by the Greater Boston Association of REALTORS® and the Massachusetts Association of REALTORS®. Powered by 10K Research and Marketing. | Click for Cover Page | 5
Single-Family Condominium
$250,000
$300,000
$350,000
$400,000
$450,000
$500,000
$550,000
$600,000
Jan-2003 Jan-2004 Jan-2005 Jan-2006 Jan-2007 Jan-2008 Jan-2009 Jan-2010 Jan-2011 Jan-2012 Jan-2013 Jan-2014
Historical Median Sales Price Single-Family Condominium
+6.1%+8.0%+6.7%
Single-Family Condominium+6.2%+6.9%+8.7%+9.4% +5.2%
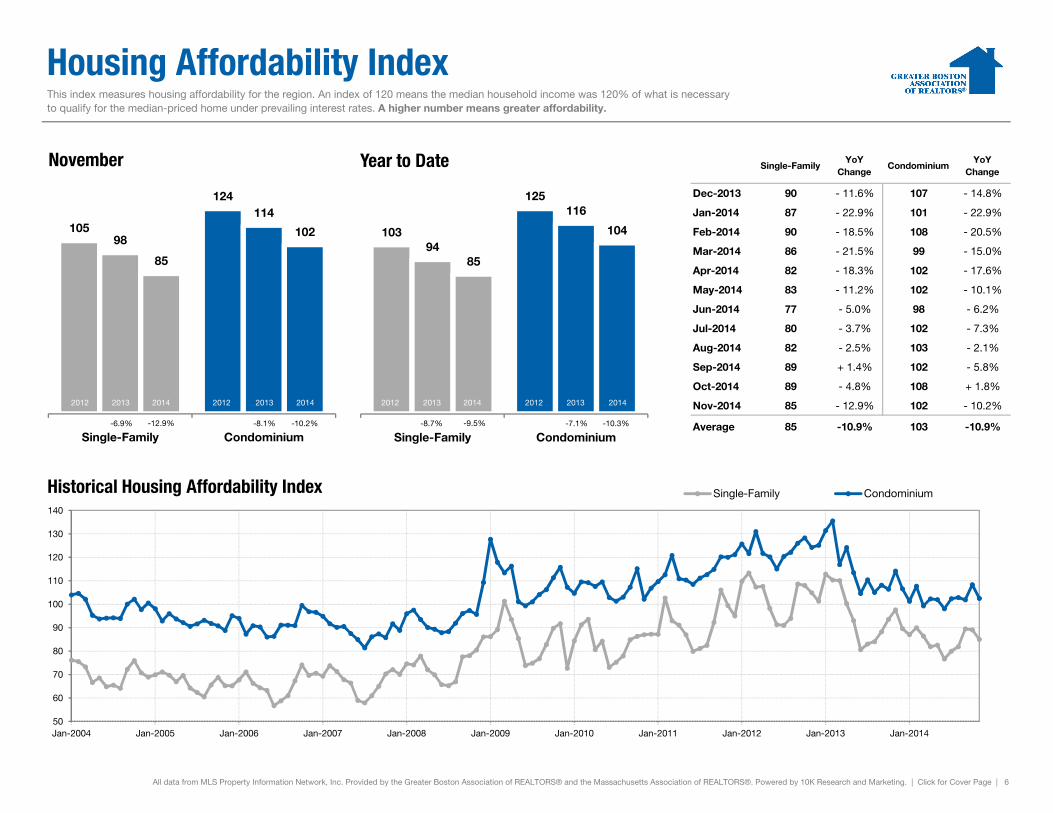
Housing Affordability Index
Single-FamilyYoY
ChangeCondominium
YoYChange
Dec-2013 90 - 11.6% 107 - 14.8%
Jan-2014 87 - 22.9% 101 - 22.9%
Feb-2014 90 - 18.5% 108 - 20.5%
Mar-2014 86 - 21.5% 99 - 15.0%
Apr-2014 82 - 18.3% 102 - 17.6%
May-2014 83 - 11.2% 102 - 10.1%
Jun-2014 77 - 5.0% 98 - 6.2%
Jul-2014 80 - 3.7% 102 - 7.3%
Aug-2014 82 - 2.5% 103 - 2.1%
Sep-2014 89 + 1.4% 102 - 5.8%
Oct-2014 89 - 4.8% 108 + 1.8%
Nov-2014 85 - 12.9% 102 - 10.2%
This index measures housing affordability for the region. An index of 120 means the median household income was 120% of what is necessary to qualify for the median-priced home under prevailing interest rates. A higher number means greater affordability.
105
124
98
114
85
102
November
103
125
94
116
85
104
Year to Date
20142013 20142013 20142013 201420132012 2012 2012 2012
Average 85 -10.9% 103 -10.9%
All data from MLS Property Information Network, Inc. Provided by the Greater Boston Association of REALTORS® and the Massachusetts Association of REALTORS®. Powered by 10K Research and Marketing. | Click for Cover Page | 6
Single-Family Condominium
50
60
70
80
90
100
110
120
130
140
Jan-2004 Jan-2005 Jan-2006 Jan-2007 Jan-2008 Jan-2009 Jan-2010 Jan-2011 Jan-2012 Jan-2013 Jan-2014
Historical Housing Affordability Index Single-Family Condominium
-10.2%-8.1%-6.9%
Single-Family Condominium-10.3%-7.1%-8.7%-12.9% -9.5%
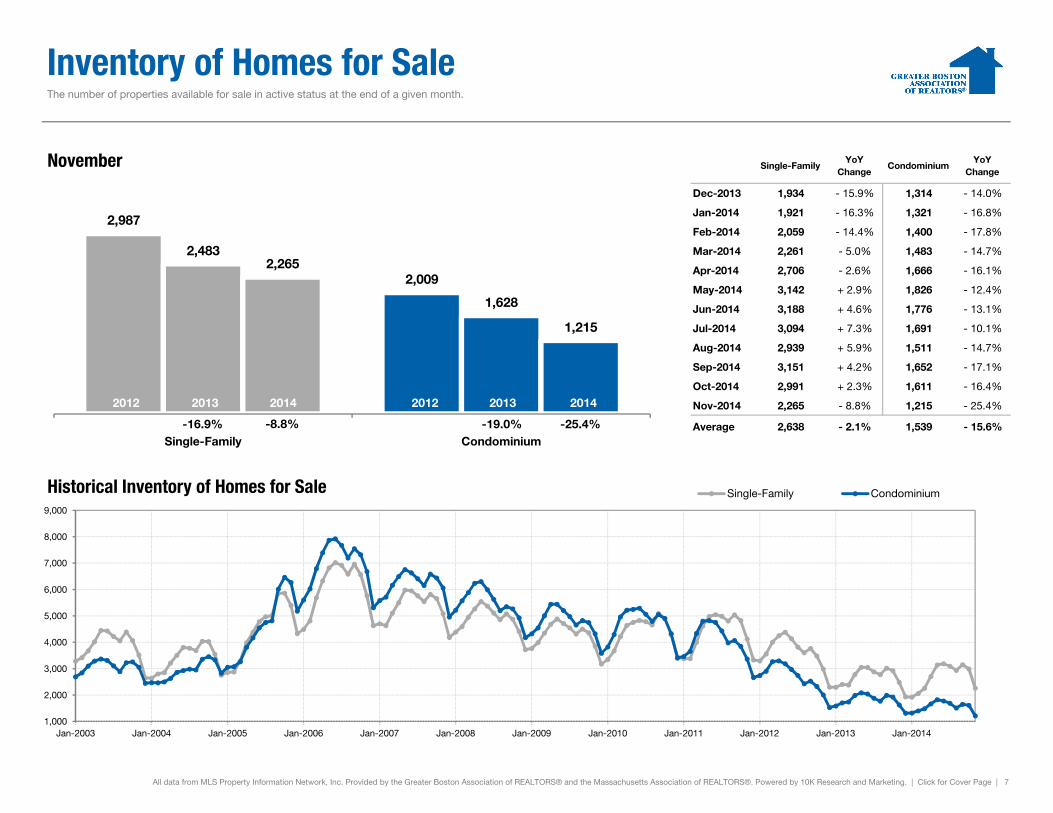
Inventory of Homes for Sale The number of properties available for sale in active status at the end of a given month.
Single-FamilyYoY
ChangeCondominium
YoYChange
Dec-2013 1,934 - 15.9% 1,314 - 14.0%
Jan-2014 1,921 - 16.3% 1,321 - 16.8%
Feb-2014 2,059 - 14.4% 1,400 - 17.8%
Mar-2014 2,261 - 5.0% 1,483 - 14.7%
Apr-2014 2,706 - 2.6% 1,666 - 16.1%
May-2014 3,142 + 2.9% 1,826 - 12.4%
Jun-2014 3,188 + 4.6% 1,776 - 13.1%
Jul-2014 3,094 + 7.3% 1,691 - 10.1%
Aug-2014 2,939 + 5.9% 1,511 - 14.7%
Sep-2014 3,151 + 4.2% 1,652 - 17.1%
Oct-2014 2,991 + 2.3% 1,611 - 16.4%
Nov-2014 2,265 - 8.8% 1,215 - 25.4%
2,987
2,009
2,483
1,628
2,265
1,215
November
20142013 201420132012 2012
Average 2,638 - 2.1% 1,539 - 15.6%
All data from MLS Property Information Network, Inc. Provided by the Greater Boston Association of REALTORS® and the Massachusetts Association of REALTORS®. Powered by 10K Research and Marketing. | Click for Cover Page | 7
Single-Family Condominium
1,000
2,000
3,000
4,000
5,000
6,000
7,000
8,000
9,000
Jan-2003 Jan-2004 Jan-2005 Jan-2006 Jan-2007 Jan-2008 Jan-2009 Jan-2010 Jan-2011 Jan-2012 Jan-2013 Jan-2014
Historical Inventory of Homes for Sale Single-Family Condominium
-25.4%-19.0%-16.9% -8.8%
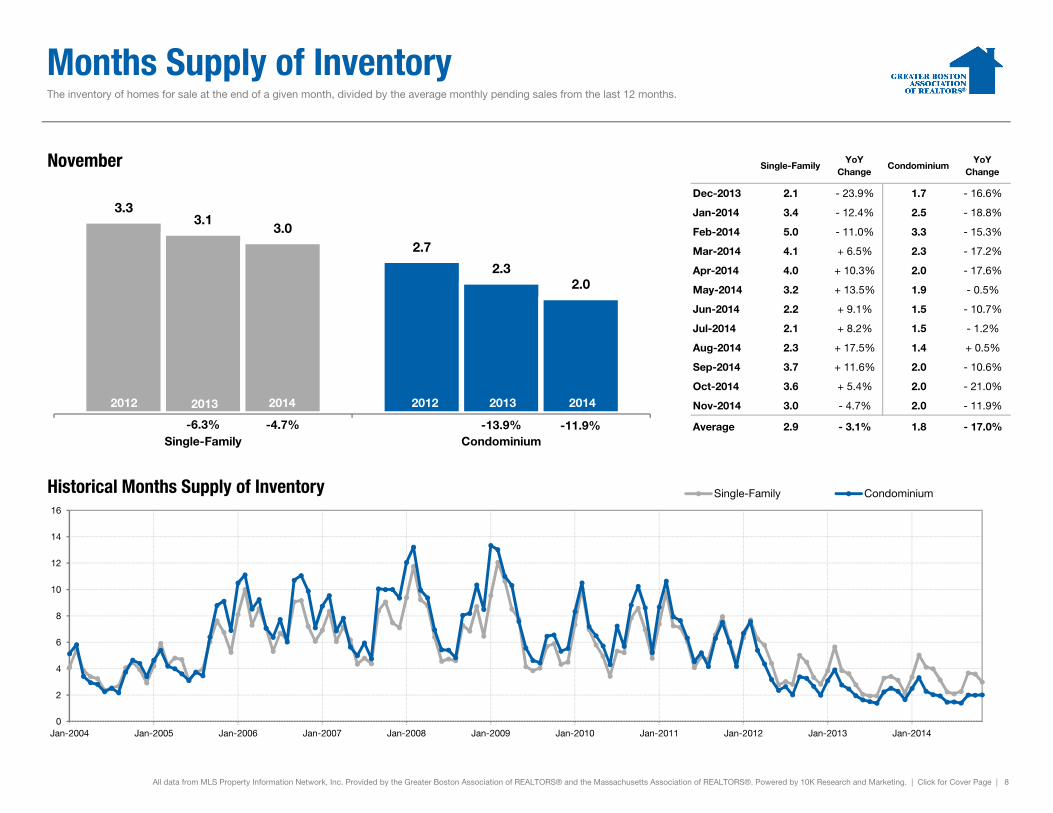
Months Supply of Inventory The inventory of homes for sale at the end of a given month, divided by the average monthly pending sales from the last 12 months.
Single-FamilyYoY
ChangeCondominium
YoYChange
Dec-2013 2.1 - 23.9% 1.7 - 16.6%
Jan-2014 3.4 - 12.4% 2.5 - 18.8%
Feb-2014 5.0 - 11.0% 3.3 - 15.3%
Mar-2014 4.1 + 6.5% 2.3 - 17.2%
Apr-2014 4.0 + 10.3% 2.0 - 17.6%
May-2014 3.2 + 13.5% 1.9 - 0.5%
Jun-2014 2.2 + 9.1% 1.5 - 10.7%
Jul-2014 2.1 + 8.2% 1.5 - 1.2%
Aug-2014 2.3 + 17.5% 1.4 + 0.5%
Sep-2014 3.7 + 11.6% 2.0 - 10.6%
Oct-2014 3.6 + 5.4% 2.0 - 21.0%
Nov-2014 3.0 - 4.7% 2.0 - 11.9%
3.3
2.7
3.1
2.3
3.0
2.0
November
20142013 201420132012 2012
Average 2.9 - 3.1% 1.8 - 17.0%
All data from MLS Property Information Network, Inc. Provided by the Greater Boston Association of REALTORS® and the Massachusetts Association of REALTORS®. Powered by 10K Research and Marketing. | Click for Cover Page | 8
Single-Family Condominium
0
2
4
6
8
10
12
14
16
Jan-2004 Jan-2005 Jan-2006 Jan-2007 Jan-2008 Jan-2009 Jan-2010 Jan-2011 Jan-2012 Jan-2013 Jan-2014
Historical Months Supply of Inventory Single-Family Condominium
-11.9%-13.9%-6.3% -4.7%
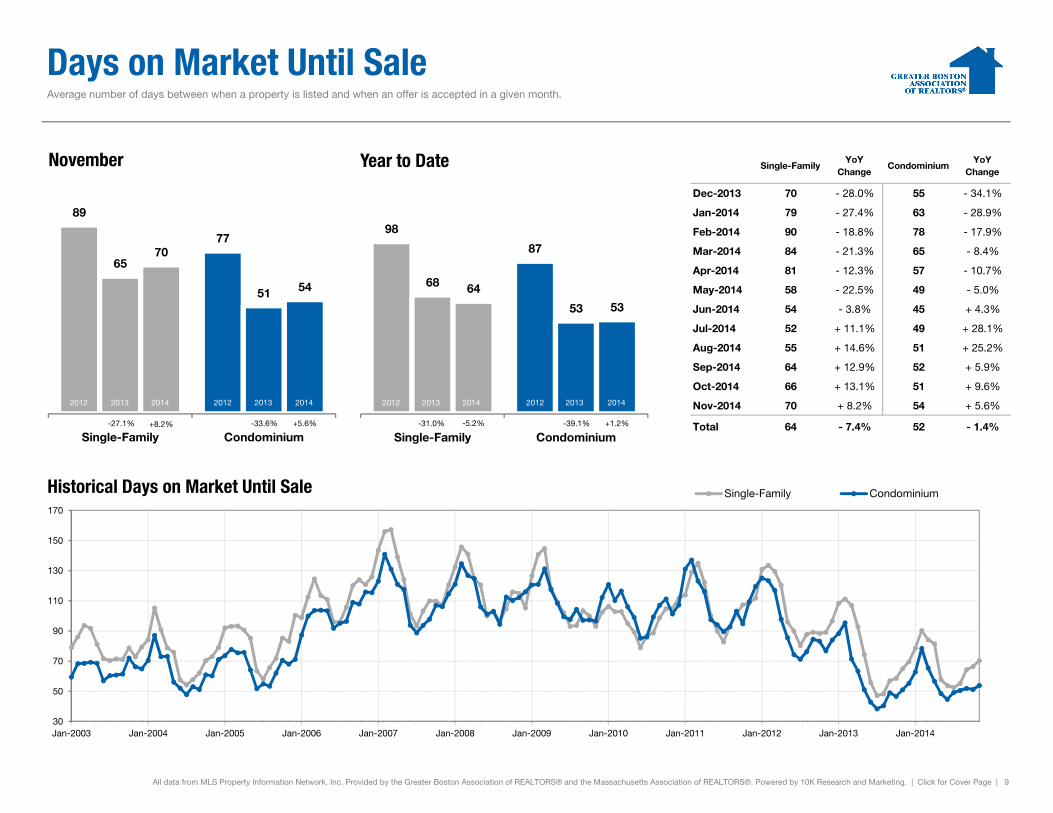
Days on Market Until Sale Average number of days between when a property is listed and when an offer is accepted in a given month.
Single-FamilyYoY
ChangeCondominium
YoYChange
Dec-2013 70 - 28.0% 55 - 34.1%
Jan-2014 79 - 27.4% 63 - 28.9%
Feb-2014 90 - 18.8% 78 - 17.9%
Mar-2014 84 - 21.3% 65 - 8.4%
Apr-2014 81 - 12.3% 57 - 10.7%
May-2014 58 - 22.5% 49 - 5.0%
Jun-2014 54 - 3.8% 45 + 4.3%
Jul-2014 52 + 11.1% 49 + 28.1%
Aug-2014 55 + 14.6% 51 + 25.2%
Sep-2014 64 + 12.9% 52 + 5.9%
Oct-2014 66 + 13.1% 51 + 9.6%
Nov-2014 70 + 8.2% 54 + 5.6%
89
77
65
51
70
54
November
98
87
68
53
64
53
Year to Date
20142013 20142013 20142013 201420132012 2012 2012 2012
Total 64 - 7.4% 52 - 1.4%
All data from MLS Property Information Network, Inc. Provided by the Greater Boston Association of REALTORS® and the Massachusetts Association of REALTORS®. Powered by 10K Research and Marketing. | Click for Cover Page | 9
Single-Family Condominium
30
50
70
90
110
130
150
170
Jan-2003 Jan-2004 Jan-2005 Jan-2006 Jan-2007 Jan-2008 Jan-2009 Jan-2010 Jan-2011 Jan-2012 Jan-2013 Jan-2014
Historical Days on Market Until Sale Single-Family Condominium
+5.6%-33.6%-27.1%
Single-Family Condominium+1.2%-39.1%-31.0%+8.2% -5.2%
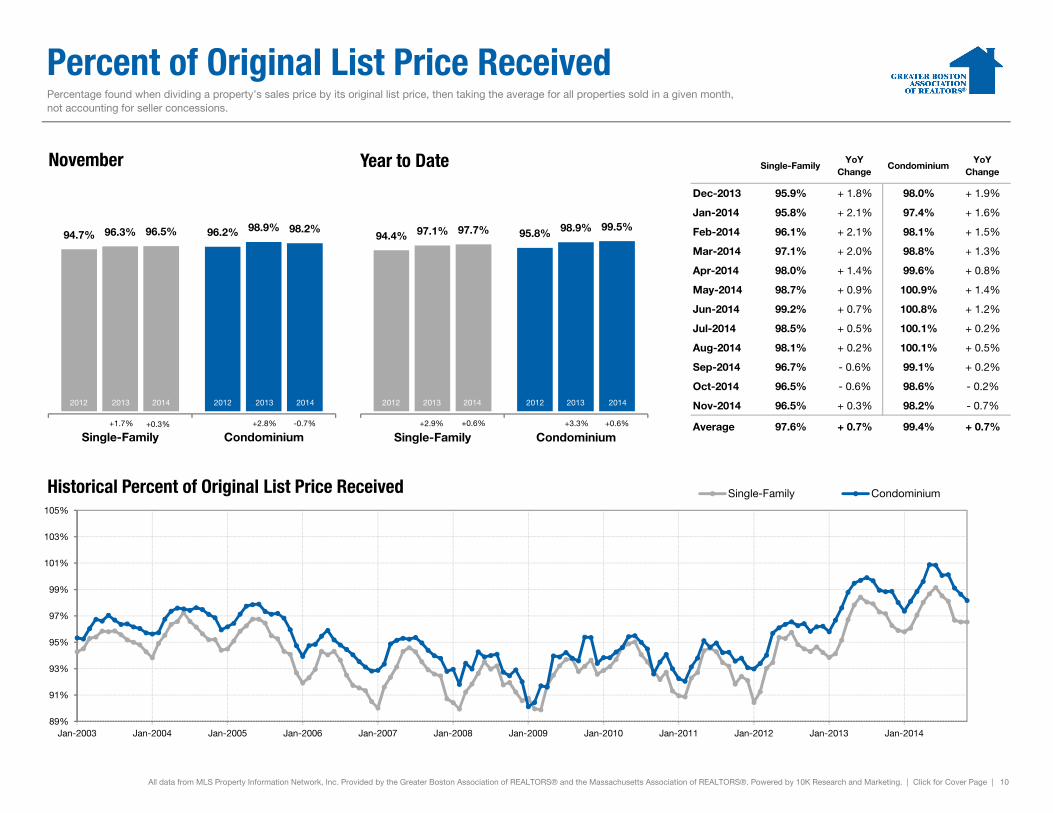
Percent of Original List Price Received
Single-FamilyYoY
ChangeCondominium
YoYChange
Dec-2013 95.9% + 1.8% 98.0% + 1.9%
Jan-2014 95.8% + 2.1% 97.4% + 1.6%
Feb-2014 96.1% + 2.1% 98.1% + 1.5%
Mar-2014 97.1% + 2.0% 98.8% + 1.3%
Apr-2014 98.0% + 1.4% 99.6% + 0.8%
May-2014 98.7% + 0.9% 100.9% + 1.4%
Jun-2014 99.2% + 0.7% 100.8% + 1.2%
Jul-2014 98.5% + 0.5% 100.1% + 0.2%
Aug-2014 98.1% + 0.2% 100.1% + 0.5%
Sep-2014 96.7% - 0.6% 99.1% + 0.2%
Oct-2014 96.5% - 0.6% 98.6% - 0.2%
Nov-2014 96.5% + 0.3% 98.2% - 0.7%
Percentage found when dividing a property’s sales price by its original list price, then taking the average for all properties sold in a given month, not accounting for seller concessions.
94.7% 96.2%96.3% 98.9%96.5% 98.2%
November
94.4% 95.8%97.1% 98.9%97.7% 99.5%
Year to Date
20142013 20142013 20142013 201420132012 2012 2012 2012
Average 97.6% + 0.7% 99.4% + 0.7%
All data from MLS Property Information Network, Inc. Provided by the Greater Boston Association of REALTORS® and the Massachusetts Association of REALTORS®. Powered by 10K Research and Marketing. | Click for Cover Page | 10
Single-Family Condominium
89%
91%
93%
95%
97%
99%
101%
103%
105%
Jan-2003 Jan-2004 Jan-2005 Jan-2006 Jan-2007 Jan-2008 Jan-2009 Jan-2010 Jan-2011 Jan-2012 Jan-2013 Jan-2014
Historical Percent of Original List Price Received Single-Family Condominium
-0.7%+2.8%+1.7%
Single-Family Condominium+0.6%+3.3%+2.9%+0.3% +0.6%
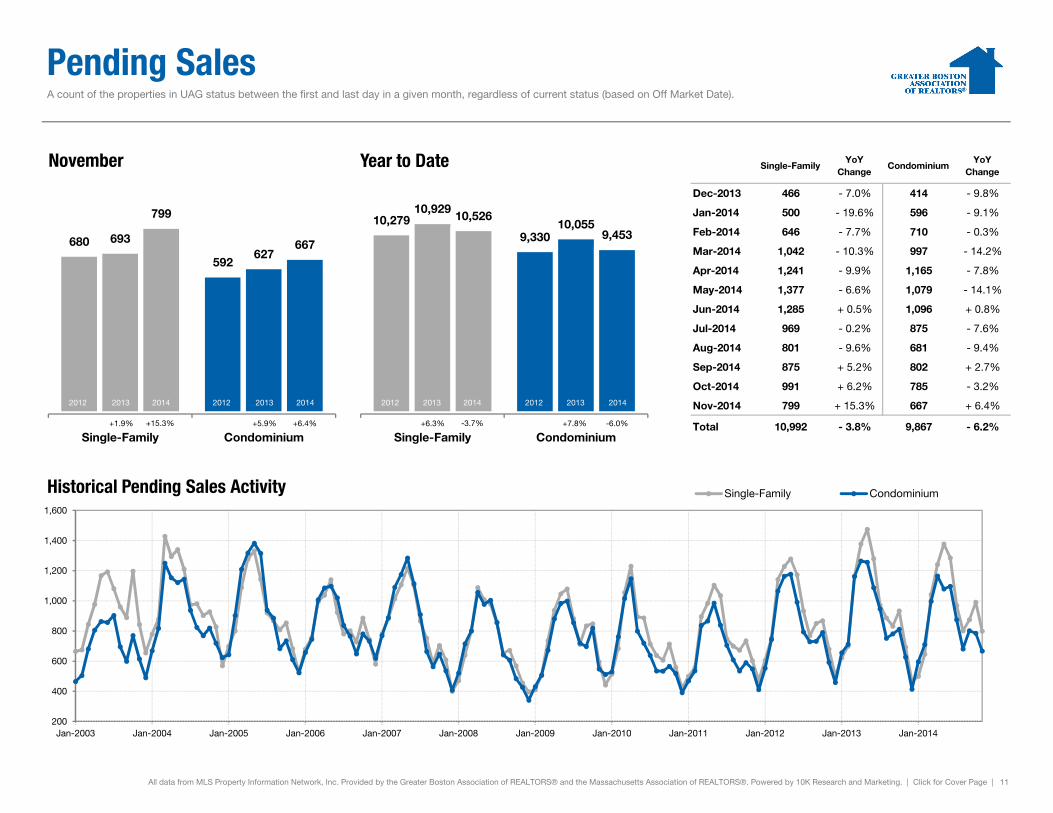
Pending Sales A count of the properties in UAG status between the first and last day in a given month, regardless of current status (based on Off Market Date).
Single-FamilyYoY
ChangeCondominium
YoYChange
Dec-2013 466 - 7.0% 414 - 9.8%
Jan-2014 500 - 19.6% 596 - 9.1%
Feb-2014 646 - 7.7% 710 - 0.3%
Mar-2014 1,042 - 10.3% 997 - 14.2%
Apr-2014 1,241 - 9.9% 1,165 - 7.8%
May-2014 1,377 - 6.6% 1,079 - 14.1%
Jun-2014 1,285 + 0.5% 1,096 + 0.8%
Jul-2014 969 - 0.2% 875 - 7.6%
Aug-2014 801 - 9.6% 681 - 9.4%
Sep-2014 875 + 5.2% 802 + 2.7%
Oct-2014 991 + 6.2% 785 - 3.2%
Nov-2014 799 + 15.3% 667 + 6.4%
680
592
693627
799
667
November
10,2799,330
10,92910,055
10,526
9,453
Year to Date
20142013 20142013 20142013 201420132012 2012 2012 2012
Total 10,992 - 3.8% 9,867 - 6.2%
All data from MLS Property Information Network, Inc. Provided by the Greater Boston Association of REALTORS® and the Massachusetts Association of REALTORS®. Powered by 10K Research and Marketing. | Click for Cover Page | 11
Single-Family Condominium
200
400
600
800
1,000
1,200
1,400
1,600
Jan-2003 Jan-2004 Jan-2005 Jan-2006 Jan-2007 Jan-2008 Jan-2009 Jan-2010 Jan-2011 Jan-2012 Jan-2013 Jan-2014
Historical Pending Sales Activity Single-Family Condominium
+6.4%+5.9%+1.9%
Single-Family Condominium-6.0%+7.8%+6.3%+15.3% -3.7%
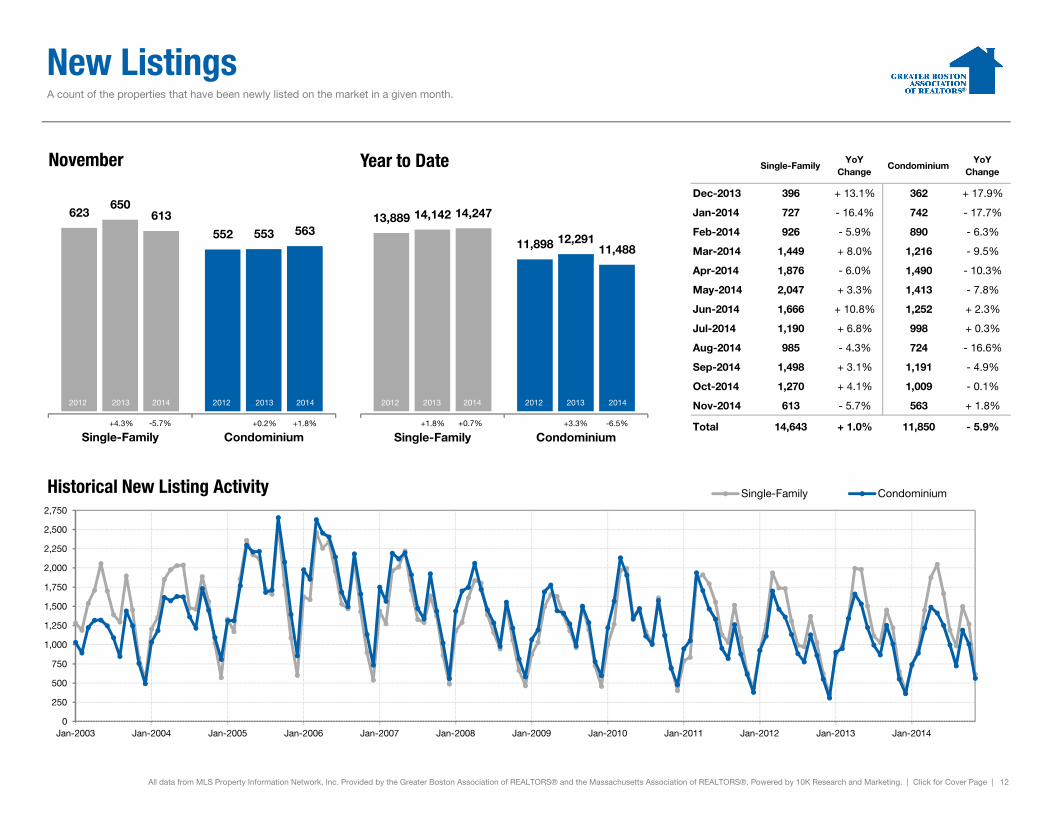
New Listings A count of the properties that have been newly listed on the market in a given month.
Single-FamilyYoY
ChangeCondominium
YoYChange
Dec-2013 396 + 13.1% 362 + 17.9%
Jan-2014 727 - 16.4% 742 - 17.7%
Feb-2014 926 - 5.9% 890 - 6.3%
Mar-2014 1,449 + 8.0% 1,216 - 9.5%
Apr-2014 1,876 - 6.0% 1,490 - 10.3%
May-2014 2,047 + 3.3% 1,413 - 7.8%
Jun-2014 1,666 + 10.8% 1,252 + 2.3%
Jul-2014 1,190 + 6.8% 998 + 0.3%
Aug-2014 985 - 4.3% 724 - 16.6%
Sep-2014 1,498 + 3.1% 1,191 - 4.9%
Oct-2014 1,270 + 4.1% 1,009 - 0.1%
Nov-2014 613 - 5.7% 563 + 1.8%
623
552
650
553
613563
November
13,889
11,898
14,142
12,291
14,247
11,488
Year to Date
20142013 20142013 20142013 201420132012 2012 2012 2012
Total 14,643 + 1.0% 11,850 - 5.9%
All data from MLS Property Information Network, Inc. Provided by the Greater Boston Association of REALTORS® and the Massachusetts Association of REALTORS®. Powered by 10K Research and Marketing. | Click for Cover Page | 12
Single-Family Condominium
0
250
500
750
1,000
1,250
1,500
1,750
2,000
2,250
2,500
2,750
Jan-2003 Jan-2004 Jan-2005 Jan-2006 Jan-2007 Jan-2008 Jan-2009 Jan-2010 Jan-2011 Jan-2012 Jan-2013 Jan-2014
Historical New Listing Activity Single-Family Condominium
+1.8%+0.2%+4.3%
Single-Family Condominium-6.5%+3.3%+1.8%-5.7% +0.7%
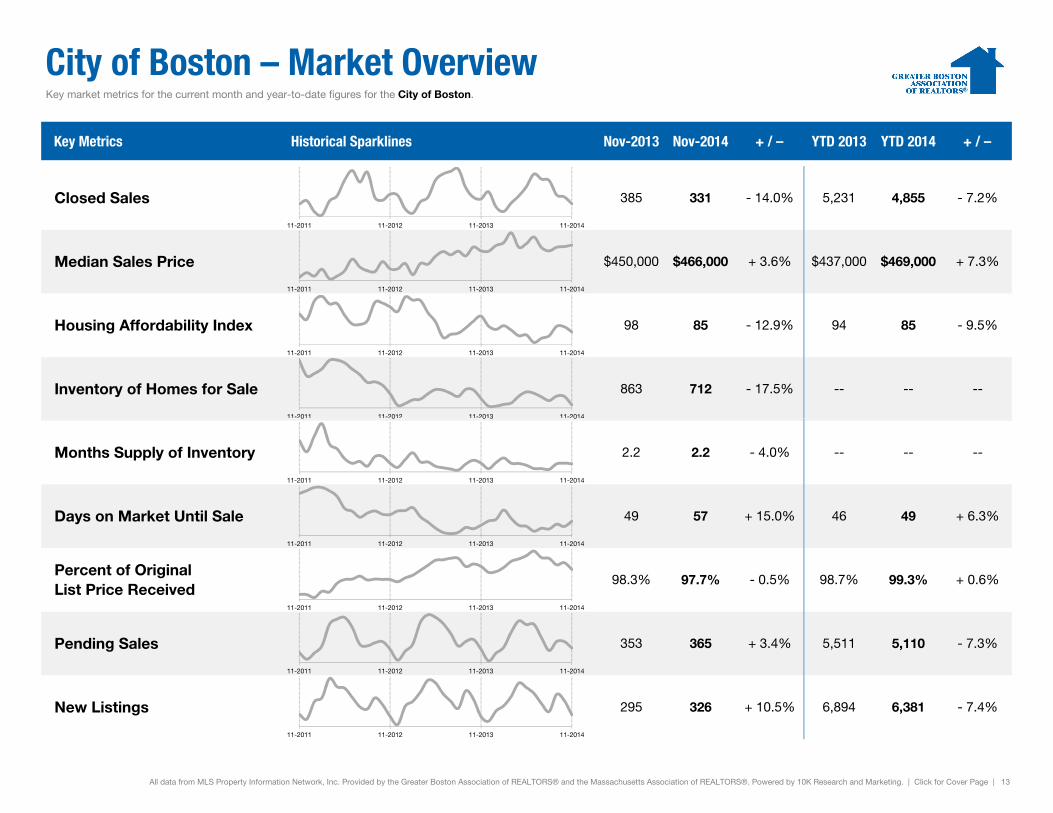
City of Boston – Market Overview Key market metrics for the current month and year-to-date figures for the City of Boston.
Key Metrics Historical Sparklines Nov-2013 Nov-2014 + / – YTD 2013 YTD 2014 + / –
- 7.2%
Median Sales Price $450,000 $466,000 + 3.6% $437,000 $469,000 + 7.3%
Closed Sales 385 331 - 14.0% 5,231 4,855
- 9.5%
Inventory of Homes for Sale 863 712 - 17.5% -- -- --
Housing Affordability Index 98 85 - 12.9% 94 85
11-2011 11-2012 11-2013 11-2014
11-2011 11-2012 11-2013 11-2014
11-2011 11-2012 11-2013 11-2014
11-2011 11-2012 11-2013 11-2014
--
Days on Market Until Sale 49 57 + 15.0% 46 49 + 6.3%
Months Supply of Inventory 2.2 2.2 - 4.0% -- --
+ 0.6%
Pending Sales 353 365 + 3.4% 5,511 5,110 - 7.3%
Percent of OriginalList Price Received
98.3% 97.7% - 0.5% 98.7% 99.3%
- 7.4%
All data from MLS Property Information Network, Inc. Provided by the Greater Boston Association of REALTORS® and the Massachusetts Association of REALTORS®. Powered by 10K Research and Marketing. | Click for Cover Page | 13
New Listings 295 326 + 10.5% 6,894 6,381
0 0 0 3 0
11-2011 11-2012 11-2013 11-2014
11-2011 11-2012 11-2013 11-2014
11-2011 11-2012 11-2013 11-2014
11-2011 11-2012 11-2013 11-2014
11-2011 11-2012 11-2013 11-2014