Embed Size (px)
Citation preview
1
PROPERTY TAX
AND STATUTORY VALUATION
2
Executive Summary: Key Findings and Recommendations
Part A: Issue 1 A study of Development Charge (DC) rate is done to gauge its applicability for the period of
1 March 2009 to 28 February 2015. Based on historical and present DC Rates imposed, an
equitable percentage of Residual Implied Freehold Land Value (FHLV) extracted by DC rate
for developers should range from 50% to 70% to incentivise redevelopments. An equitable
percentage of residual implied FHLV extracted by DC rate for the government ranges from
50% to 100%. This is on the basis that developers should not benefit from any public
infrastructural investment.
When DC Implied FHLV is more than Residual Implied FHLV, it is deemed as fair to the
government but unfair to developers. However, it may be reasonable for DC implied FHLV
to show signs of discrepancy from Residual Implied FHLV to control the redevelopments in
Singapore. The six DC Sectors from Map A analysed in this report shows an overall finding
that the DC Rates tend to be unfair for the government, but is still reasonable.
Part A: Issue 2 A policy paper is drafted to decide on the need for further delineation of 3 chosen DC Sectors
in Map B. A threshold percentage difference for delineation was established by comparing
the DC Rates of adjacent sectors. Historical transactions from the Government Land Sales
(GLS) program and the residual value of built up transaction prices were used to determine
the varying land values.
For Sector 98, a deviation of 12% in prices is determined to warrant a delineation. As such,
the sector was delineated into “Simei”, “Tanah Merah” and “Bedok and Tampines”.
However, there was no further micro delineation within divided segment. In
Sector 100, a 12% difference between land values was established as the minimum
percentage that invokes a delineation. A macro delineation was done to divide the sector into
“Punggol” and “Sengkang, Buangkok and Hougang (SBH)”. Thereafter, SBH is proposed to
be delineated further into SBH (i), SBH (ii) and SBH (iii).
For Sector 104, 10% was established as the minimum percentage difference in land value to
carry out delineation. As a result, the sector was delineated into 2 major neighbourhoods,
Bishan and Serangoon. Further micro delineation was done within the two divided segments
to better reflect the varying land values due to the amenities in the area.
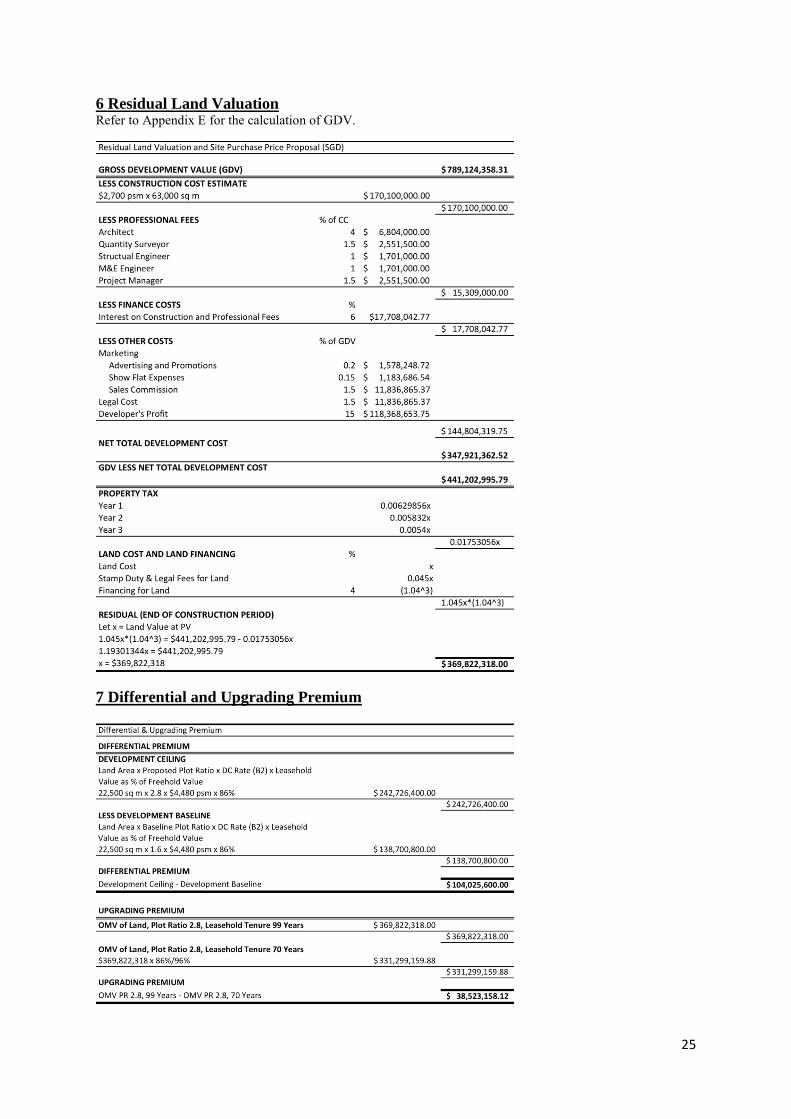
Part B The total Gross Development Value (GDV) for the proposed project amounts to
$898,580,000.00 and the Residual Land Valuation is determined to be $369,822,380.00. The
Differential Premium payable to the government for the increment in plot ratio is
$104,025,600.00 while the Upgrading Premium to extend the lease to 99 years is
approximately $38,481,438.00.
3
PART A: ISSUE 1 1
1. INTRODUCTION 1
2. DERIVATION OF DC IMPLIED FREEHOLD LAND VALUE 1
3. DERIVATION OF RESIDUAL FREEHOLD LAND VALUE 1
4. DETERMINATION OF FAIRNESS 2
5. DETERMINATION OF REASONABILITY 2
5.1 Factors Affecting Movement of DC Implied FHLVH 2
5.2 Factors Affecting Percentage of Residual FHLV Extracted by DC Rate 2
5.2.1 Urban Form 2
5.2.2 Green Development 3
6. ANALYSIS OF VARIOUS DC SECTORS 3
6.1 Sector 11 3
6.2 Sector 38 4
6.3 Sector 39 5
6.4 Sector 40 6
6.5 Sector 53 7
6.6 Sector 61 8
PART A: ISSUE 2 9
1. INTRODUCTION 9
2. ANALYSIS OF SECTOR 104 9
2.1 Macro Delineation 9
2.2 Micro Delineation: Bishan 12
2.3 Macro Delineation: Serangoon 13
3. ANALYSIS OF SECTOR 98 13
3.1 Macro Delineation: Tanah Merah 13
3.2 Macro Delineation: Simei 15
3.3 Rationale for Non-micro Delineation 17
4. ANALYSIS OF SECTOR 100 17
4.1 Macro Delineation 18
4.2 Micro Delineation: Punggol 19
4.3 Micro Delineation: Sengkang, Buangkok and Hougang 20
PART B
1. HIGHEST AND BEST USE OF THE SITE 21
1.1 Rationale for Mass-market Condominium 21
1.2 Target Market 21
1.2.1 Families with Children 21
1.2.2 HDB Upgraders from Mature Estates 21
1.2.3 Private Investors 21
1.3 Number of Units 22
1.4 Rationale for Unit Types and Distribution 22
4
2. FORECASTED SELLING PRICES AND ESTIMATION OF GROSS
DEVELOPMENT VALUE (GDV)
22
2.1 Comparable 22
2.2 Adjustments 22
2.2.1 Transaction Date 23
2.2.2 Location 23
2.2.3 Market Position 24
3. CONSTRUCTION COST 24
4. MARKETING AND LEGAL COST 24
4.1 Marketing 24
4.2 Legal Cost 24
5. FINANCING COST 24
6. RESIDUAL LAND VALUATION 25
7. DIFFERENTIAL AND UPGRADING PREMIUM 25
REFFERENCES 26
APPENDIX 29
1
PART A: ISSUE 1
1. Introduction
Development Charge (DC) is a tax levied when planning permission is granted to carry out
development projects that involved increment in land value. Ideally, an effective and accurate
DC Rates determined by the Chief Assessor will result in equal outcomes of DC Implied
Freehold Land Value (FHLV) and Residual FHLV. However, there is often a discrepancy
between DC Implied FHLV and Residual FHLV which hinder the accuracy of development
charge imposed on developers. These discrepancies are inevitable due to market
uncertainties. This section will analyse whether the DC Rates on B2 (Non-Landed
Residential) Use for various DC Sectors in Map A are fair and reasonable. This is done by
comparing DC Implied FHLV and Residual FHLV of a particular condominium in the
various sectors. Moreover, percentage of Residual FHLV extracted from the DC Rate of
various sectors are also computed.
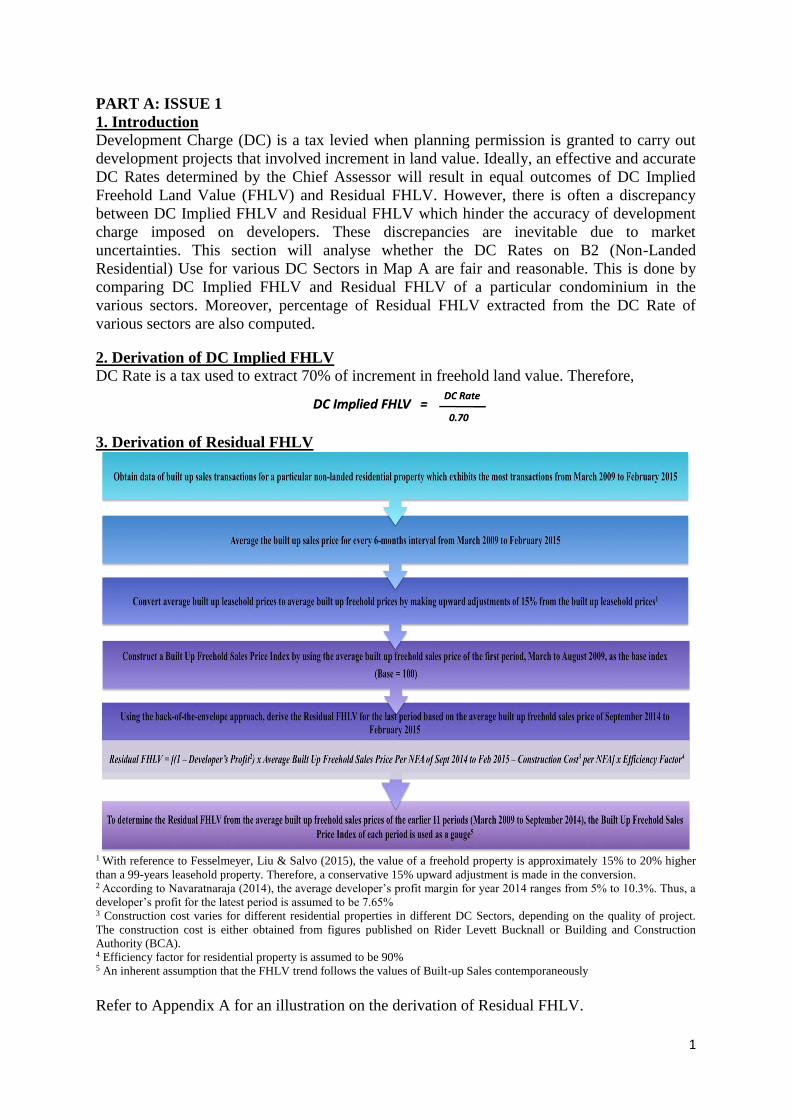
2. Derivation of DC Implied FHLV
DC Rate is a tax used to extract 70% of increment in freehold land value. Therefore,
3. Derivation of Residual FHLV
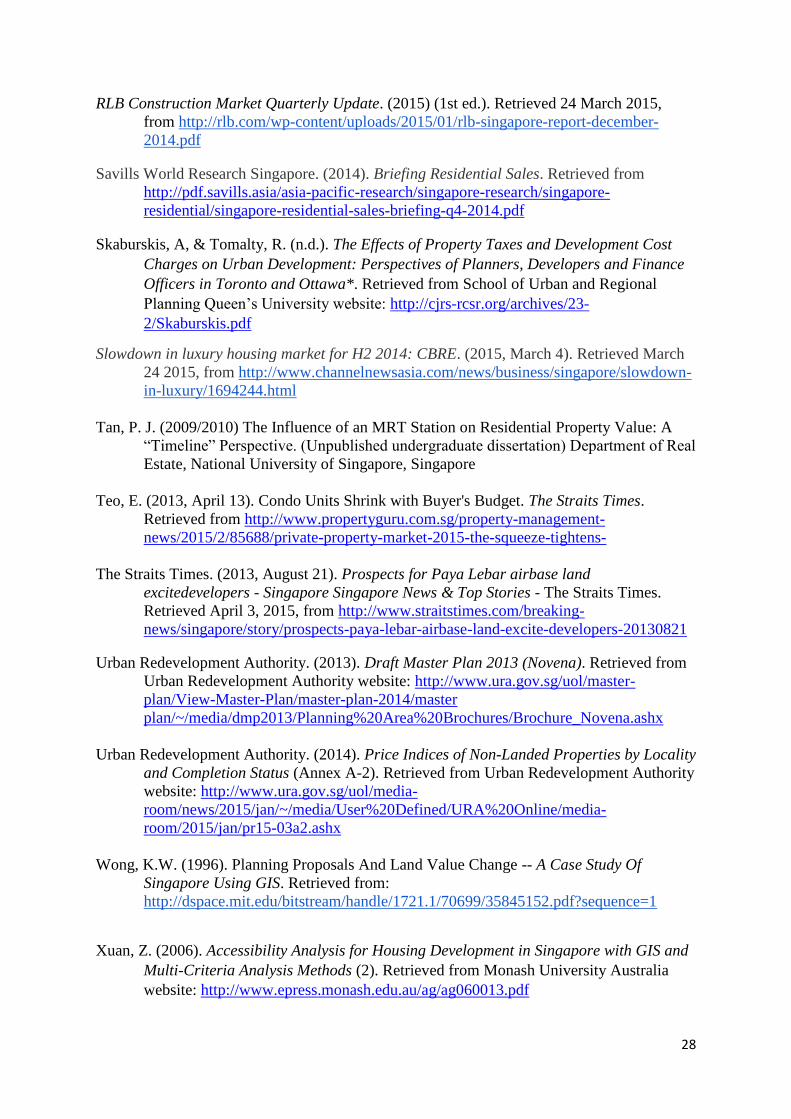
1 With reference to Fesselmeyer, Liu & Salvo (2015), the value of a freehold property is approximately 15% to 20% higher
than a 99-years leasehold property. Therefore, a conservative 15% upward adjustment is made in the conversion. 2 According to Navaratnaraja (2014), the average developer’s profit margin for year 2014 ranges from 5% to 10.3%. Thus, a
developer’s profit for the latest period is assumed to be 7.65% 3 Construction cost varies for different residential properties in different DC Sectors, depending on the quality of project.
The construction cost is either obtained from figures published on Rider Levett Bucknall or Building and Construction
Authority (BCA). 4 Efficiency factor for residential property is assumed to be 90% 5 An inherent assumption that the FHLV trend follows the values of Built-up Sales contemporaneously
Refer to Appendix A for an illustration on the derivation of Residual FHLV.
2
4. Determination of Fairness
Currently, DC rate charged on developers is used to extract 70% of windfall gain from
increment in land value arising from planning approval to intensify the use of a land.
Historically, from February 1985 to July 2007, the DC Rate only extracted 50% of the
increment in land value instead of 70%. Therefore, the determination of fairness in the
developers’ perspectives for our report is when 50% to 70% of the Residual FHLV is
extracted to account for any windfall gain. A fair DC Rate should not extract less than 50% of
the increment in land value because this will result in huge disparity across different DC
Sectors. Consequently, developers will be more inclined to redevelop lands within sectors
with lower percentage of extraction. In addition, a fair DC Rate should not extract more than
70% of the increment in land value as this diminishes the incentives for developers to
redevelop and heighten the intensity of their lands due to lower profit margin.
According to Tong and Tay (2006), the government should be entitled to extract the entire
increment in land values and the developers should not benefit from public infrastructural
investment. The government is responsible for the financing of any expenditure on public
infrastructure improvements. This allows them to impose a high development charge since no
contribution is given by developers for the increase in land value. Therefore, the
determination of fairness in the government’s perspective is assumed to be when 50% to
100% of the Residual FHLV is extracted to account for increment in land value.
5. Determination of Reasonability
5.1 Factors Affecting Movement of DC Implied FHLV
The process of estimating changes in land value through the use of DC Rate suffers from
shortcomings. One of them includes its lack of responsiveness to the changing scenarios of
land use and density patterns when there is a change in plan, often due to planners suffering
from inadequate resources (Wong, 1996). A reasonable DC Rate should incorporate and
mimic market conditions as accurately as possible. The Residual FHLV vs DC Implied
FHLV graphs will demonstrate this hypothesis as the Residual FHLV is observed to have
lead the DC Implied FHLV by approximately 6 months during increases and declines
throughout the 6 sectors that were analysed. Thus, this indicates that the movement of the DC
Rate is reasonably and carefully calibrated. Sectors which experience deviations from this
trend will be further discussed explicitly in their respective segments on Chapter 6 of the
report.
Cooling measures is a form of government legislation introduced with the aim of dampening
prices of real estate in the market. The implementation of the 5th and 8th round of cooling
measure in December 2011 and June 2013 have an effect on the movement of the Residual
FHLV. This will be seen in the graphs for various sectors in Chapter 6 of the report. The DC
Implied FHLV is deemed to move in a manner that is reasonable and in line with the market
if it takes into account the changing market sentiments due to cooling measures.
5.2 Factors Affecting Percentage of Residual FHLV Extracted by DC Rate
5.2.1 Urban Form
DC Rate has an environmental impact on the urban form of Singapore. A low DC Rate will
entice developers to substitute Government Land Sales (GLS) for En Bloc Sales and
encourage developers to build denser projects in order to harvest at the profit maximizing
position. A low percentage of extraction by DC Rate which is beyond the range of fairness
for both developers and government can still be reasonable if it implies the intention of the
government to induce developers in rejuvenating the sectors into their maximum potential. In
addition, the DC Rate can be used as a tool to control the spread of cities, the density of the
3
built form and the land use mix (Andrejs and Ray, 2000). Therefore, a high percentage of
extraction by DC Rate which is beyond the range of fairness for developers can be
reasonable.
5.2.2 Green Developments
DC Rate also affects the motivation for green developments. High DC Rate imposed on roof-
top gardens will make the LUSH (Landscaping for Urban Spaces and High-Rises) initiative
unattractive to developers (Business Times, 2009) as they would be paying additional taxes to
build unlettable green areas. Therefore, it may be reasonable for the Chief Assessor to
construct a conservative DC Rate with low percentage of extraction to engage developers in
adapting green development, aligned with the goal of transforming Singapore to a City in a
Garden. The LUSH program has since been revised in 2014 to LUSH 2.0, to improve the
benefits of creating green landscapes in developments. One of the benefits includes the
exemption of DC on green spaces for both new developments and redevelopments. As such,
the Chief Assessor is now able to adopt a DC Rate that is more reflective to the market land
value. This is illustrated in the narrowing of the DC Implied FHLV and Residual FHLV
graphs from 2014 onwards in the various DC sectors shown in subsequent section.
6. Analysis of Various DC Sectors
6.1 Sector 11
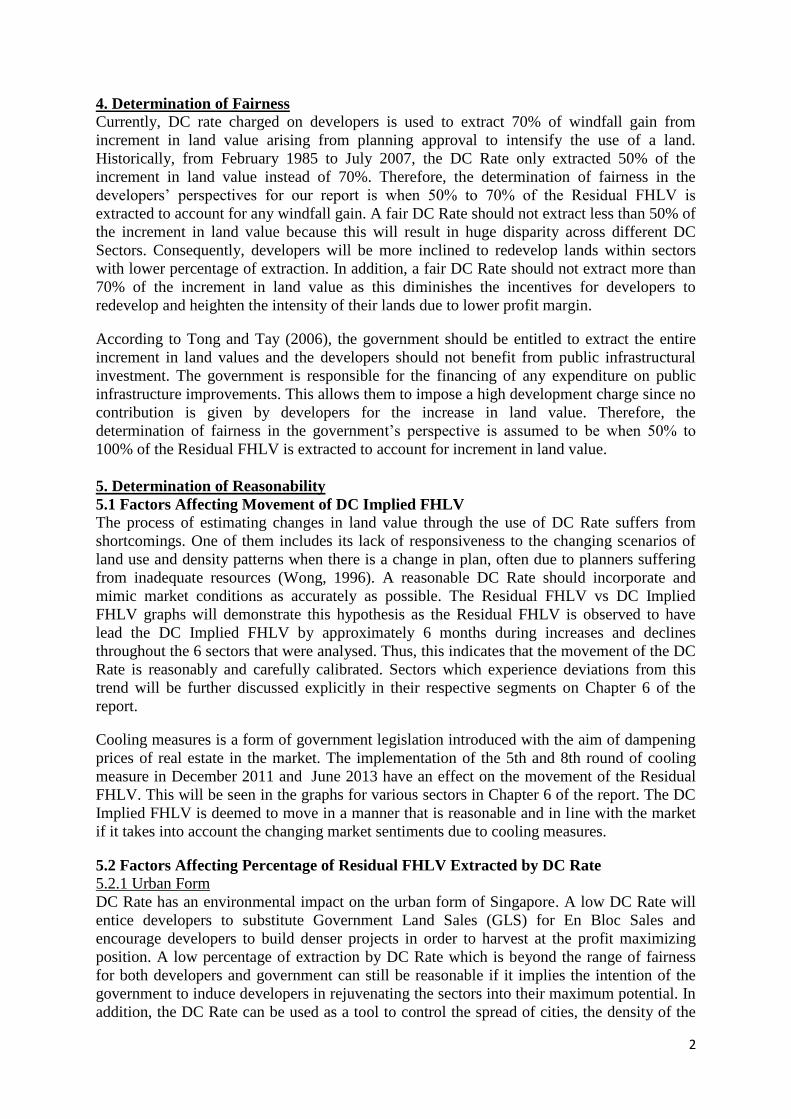
There is an overall upward trend and an increase of 44.4% in the DC Implied FHLV of Sector
11 from March 2009 to September 2014. The DC Implied FHLV was at its lowest level of
$9,000 on March 2009 and September 2009. In contrast, the highest level of the DC Implied
FHLV was observed on September 2013 and March 2014 at $13,500. The DC Implied FHLV
has remained constant from March 2009 to September 2009, before rising steeply by 44.4%
from September 2009 to September 2011. However, the DC Implied FHLV faced a large
decrease of 7.69% on March 2012. It then plateaued until March 2013 and climbed by 12.5%
on September 2013. The Implied DC FHLV had a brief plateau from September 2013 to
March 2014 and finally, dropped slightly by 3.7% on September 2014.
The DC Implied FHLV is compared with the Residual FHLV in Sector 11. The Residual
FHLV is obtained based on the latest 6-months transactions for condominium units of The
Sail @ Marina Bay. As shown in the graph above, the DC Implied FHLV is consistently
below the Residual FHLV across the 12 periods. This is as expected due to the tendency of
4
the Chief Assessor on being conservative in determining DC Rates. The percentage of
Residual FHLV extracted by the DC Rate are lower than 50% from March 2009 to March
2014. This gives unfair outcomes to developers outside sector 11 and the government.
However, the low DC Rates imposed are considered to be reasonable as this sector is
envisioned to be Singapore’s new growth area that encapsulates the essence of a global city -
live, work and play. The planning authorities encourage the development of modern
residential properties that seamlessly integrate with the bustling commercial and
entertainment activities in the sector. As a result, incentives through lower DC Rates may be
given to attract developers on redevelopments. Nevertheless, the DC Rate for the B2 Use in
this sector might not be very relevant currently. This is because residential developments
available in the sector are all relatively new, hence there is no favorable opportunity for any
redevelopment yet.
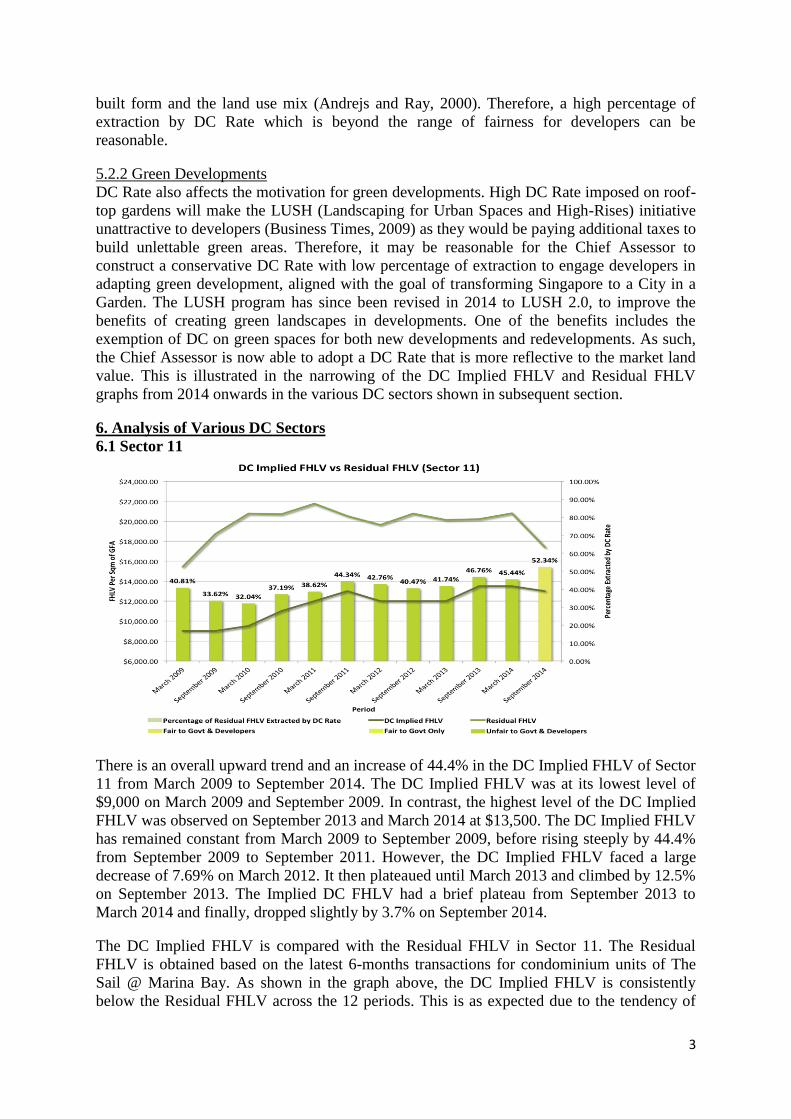
6.2 Sector 38
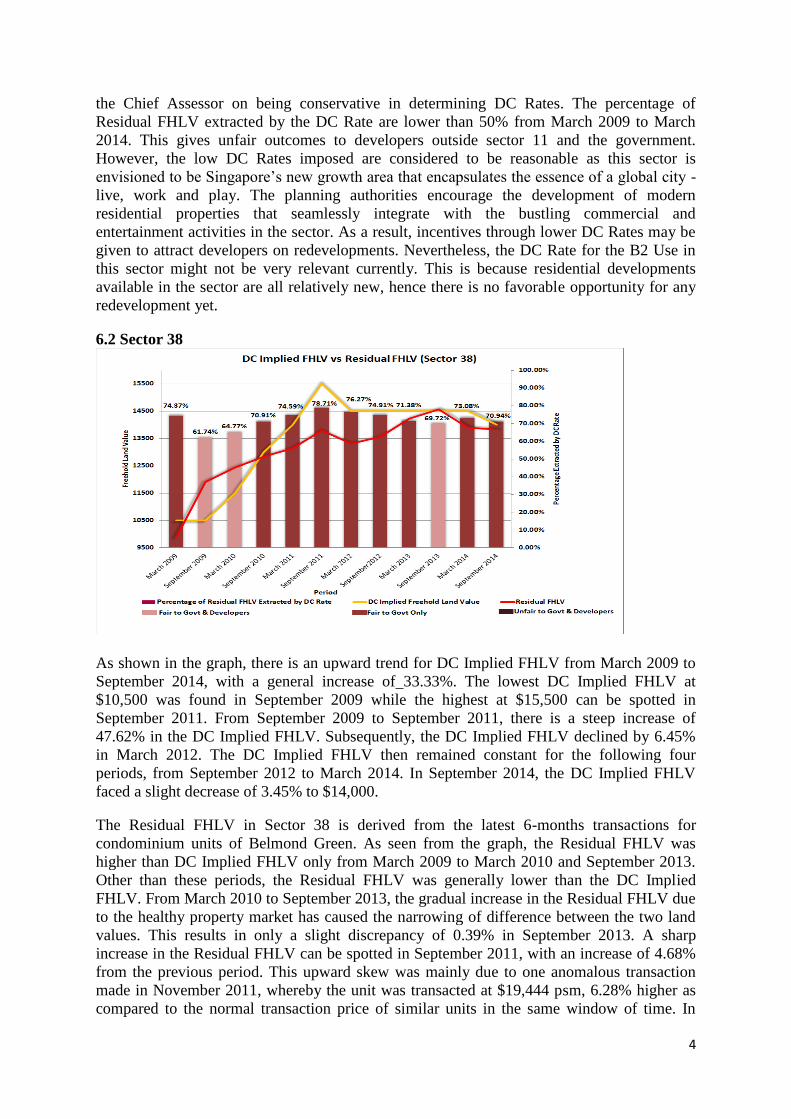
As shown in the graph, there is an upward trend for DC Implied FHLV from March 2009 to
September 2014, with a general increase of 33.33%. The lowest DC Implied FHLV at
$10,500 was found in September 2009 while the highest at $15,500 can be spotted in
September 2011. From September 2009 to September 2011, there is a steep increase of
47.62% in the DC Implied FHLV. Subsequently, the DC Implied FHLV declined by 6.45%
in March 2012. The DC Implied FHLV then remained constant for the following four
periods, from September 2012 to March 2014. In September 2014, the DC Implied FHLV
faced a slight decrease of 3.45% to $14,000.
The Residual FHLV in Sector 38 is derived from the latest 6-months transactions for
condominium units of Belmond Green. As seen from the graph, the Residual FHLV was
higher than DC Implied FHLV only from March 2009 to March 2010 and September 2013.
Other than these periods, the Residual FHLV was generally lower than the DC Implied
FHLV. From March 2010 to September 2013, the gradual increase in the Residual FHLV due
to the healthy property market has caused the narrowing of difference between the two land
values. This results in only a slight discrepancy of 0.39% in September 2013. A sharp
increase in the Residual FHLV can be spotted in September 2011, with an increase of 4.68%
from the previous period. This upward skew was mainly due to one anomalous transaction
made in November 2011, whereby the unit was transacted at $19,444 psm, 6.28% higher as
compared to the normal transaction price of similar units in the same window of time. In
5
March 2012, the drop in Residual FHLV was largely due to a transaction made at a
historically low price of $15,556 psm which was 15% lower than the usual transaction price.
From the graph, it can also be observed that the percentage of Residual FHLV extracted by
DC Rate are mostly above 70% across the 12 periods. The higher percentage extracted is
considered to be reasonable as this may be an indicative of the government’s effort to control
the extent to which the sector is being developed. In Sector 38, numerous en bloc sales had
been materialised, with at least nine en bloc sales since 2006. In order to control the urban
density and development pace of the fully-developed sector, the extraction percentage of
above 70% by the DC Rate is reasonable.
The percentage of Residual FHLV extracted by DC Rate was increasing gradually from
September 2009 to September 2011 and was decreasing from September 2011 onwards. The
unusual hike in the percentage of Residual FHLV extracted by DC Rate in September 2011
was mainly due to the en bloc acquisition sale of Balmoral Condominium in Sector 38 which
raised the Chief Assessor’s expectation of property market outlook. The en bloc acquisition
sale was made in June 2011, at a unit land rate of $16,641.01 psm, which is the highest in the
past four years. The record unit land rate has boosted Chief Assessor’s expectation as the
price paid was said to be much higher than market’s anticipation. Therefore, it was
reasonable to set a higher DC Rate. This is in line with the case study done by Wong Kok
Wai (1996) which suggested that development charge rates are strongly influenced by any
sale of land parcels within the sector.
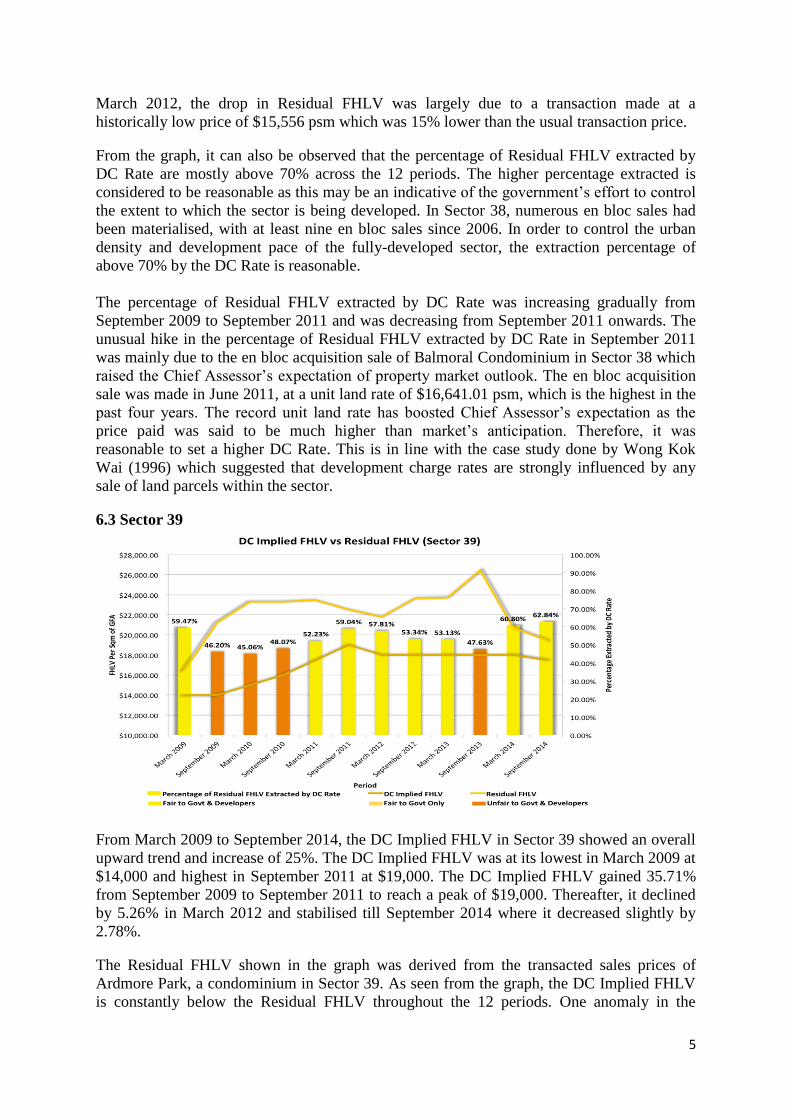
6.3 Sector 39
From March 2009 to September 2014, the DC Implied FHLV in Sector 39 showed an overall
upward trend and increase of 25%. The DC Implied FHLV was at its lowest in March 2009 at
$14,000 and highest in September 2011 at $19,000. The DC Implied FHLV gained 35.71%
from September 2009 to September 2011 to reach a peak of $19,000. Thereafter, it declined
by 5.26% in March 2012 and stabilised till September 2014 where it decreased slightly by
2.78%.
The Residual FHLV shown in the graph was derived from the transacted sales prices of
Ardmore Park, a condominium in Sector 39. As seen from the graph, the DC Implied FHLV
is constantly below the Residual FHLV throughout the 12 periods. One anomaly in the
6
Residual FHLV was found in March 2012 to September 2013 where it faced a sharp increase.
This can be explained as the built up sales transactions during this period were of units on
high floor levels. Thus, the units were transacted at a premium, resulting in the graph being
skewed upwards. Furthermore, Swire Properties acquisition of Hampton Court via an en bloc
sale in January 2013 could have re-invigorated interest in the area and thus, causing prices to
rise.
Following the slew of en bloc sales on Ardmore Point, Anderson 18, The Ardmore and Pin
Tjoe Court in 2006 and 2007, the general trend of Percentage of Residual FHLV Extracted by
DC Rate from 2009 onwards is one that is increasing. The reason for this trend is most likely
to control the extent of the redevelopments in this area.
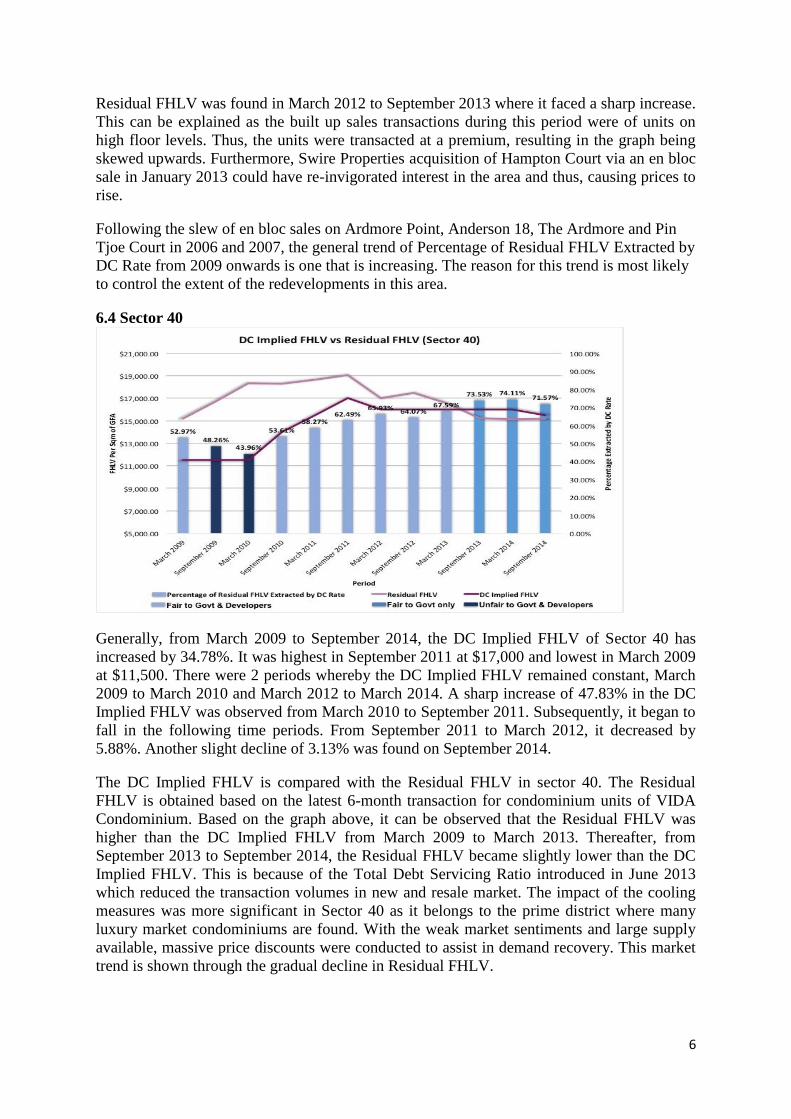
6.4 Sector 40
Generally, from March 2009 to September 2014, the DC Implied FHLV of Sector 40 has
increased by 34.78%. It was highest in September 2011 at $17,000 and lowest in March 2009
at $11,500. There were 2 periods whereby the DC Implied FHLV remained constant, March
2009 to March 2010 and March 2012 to March 2014. A sharp increase of 47.83% in the DC
Implied FHLV was observed from March 2010 to September 2011. Subsequently, it began to
fall in the following time periods. From September 2011 to March 2012, it decreased by
5.88%. Another slight decline of 3.13% was found on September 2014.
The DC Implied FHLV is compared with the Residual FHLV in sector 40. The Residual
FHLV is obtained based on the latest 6-month transaction for condominium units of VIDA
Condominium. Based on the graph above, it can be observed that the Residual FHLV was
higher than the DC Implied FHLV from March 2009 to March 2013. Thereafter, from
September 2013 to September 2014, the Residual FHLV became slightly lower than the DC
Implied FHLV. This is because of the Total Debt Servicing Ratio introduced in June 2013
which reduced the transaction volumes in new and resale market. The impact of the cooling
measures was more significant in Sector 40 as it belongs to the prime district where many
luxury market condominiums are found. With the weak market sentiments and large supply
available, massive price discounts were conducted to assist in demand recovery. This market
trend is shown through the gradual decline in Residual FHLV.
7
Furthermore, with the exception of September 2009 and March 2010, the percentages of
Residual FHLV extracted by the DC Rate are higher than 50%. This gives a fair outcome to
developers outside Sector 40 and the government. The percentage extracted by the DC Rates
are above 70% from September 2013 onwards. The general increase in percentage of
Residual FHLV extracted by the DC Rates shows that the government might be controlling
over the extent to which the sector is being developed. This is because in 2007, there was
rejuvenation efforts by the government to inject new vitality into the sector and its
surroundings (Tay, 2007). The government rejuvenation efforts were completed in April
2009. These public infrastructural investments enhanced land values in the sector. Thus, it is
reasonable to increase the percentage extracted by DC Rates to reduce excessive windfall
enjoyed by developers.
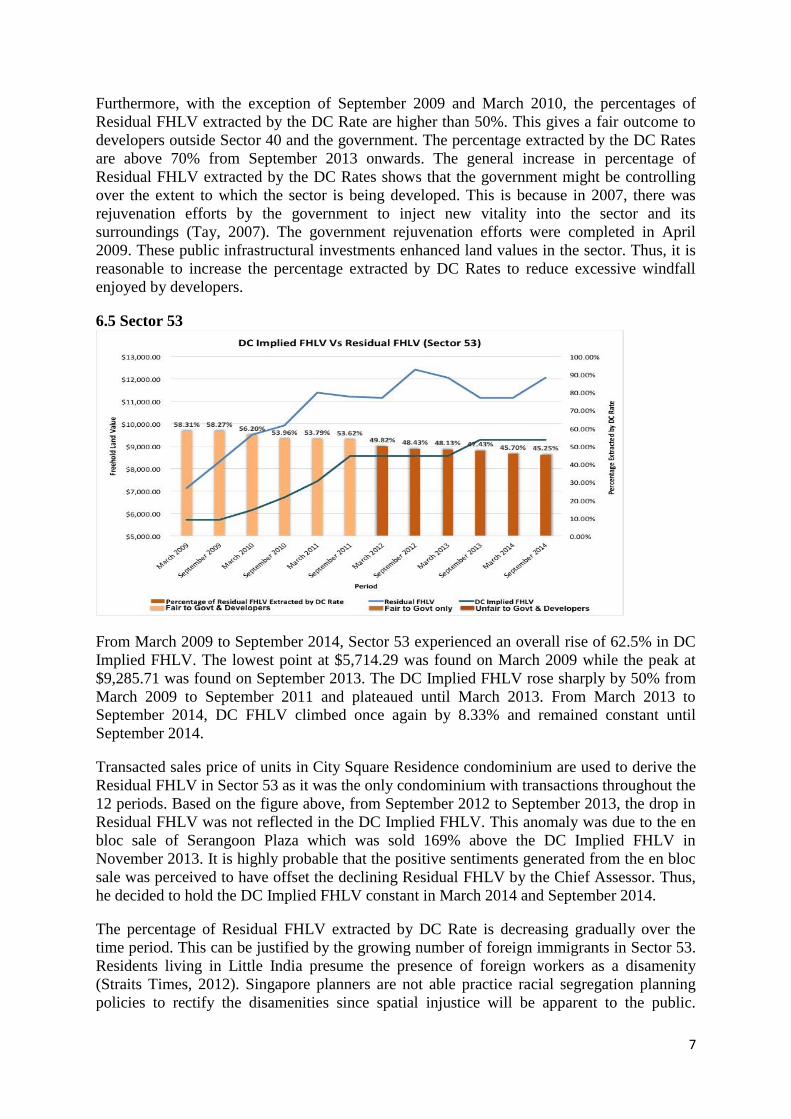
6.5 Sector 53
From March 2009 to September 2014, Sector 53 experienced an overall rise of 62.5% in DC
Implied FHLV. The lowest point at $5,714.29 was found on March 2009 while the peak at
$9,285.71 was found on September 2013. The DC Implied FHLV rose sharply by 50% from
March 2009 to September 2011 and plateaued until March 2013. From March 2013 to
September 2014, DC FHLV climbed once again by 8.33% and remained constant until
September 2014.
Transacted sales price of units in City Square Residence condominium are used to derive the
Residual FHLV in Sector 53 as it was the only condominium with transactions throughout the
12 periods. Based on the figure above, from September 2012 to September 2013, the drop in
Residual FHLV was not reflected in the DC Implied FHLV. This anomaly was due to the en
bloc sale of Serangoon Plaza which was sold 169% above the DC Implied FHLV in
November 2013. It is highly probable that the positive sentiments generated from the en bloc
sale was perceived to have offset the declining Residual FHLV by the Chief Assessor. Thus,
he decided to hold the DC Implied FHLV constant in March 2014 and September 2014.
The percentage of Residual FHLV extracted by DC Rate is decreasing gradually over the
time period. This can be justified by the growing number of foreign immigrants in Sector 53.
Residents living in Little India presume the presence of foreign workers as a disamenity
(Straits Times, 2012). Singapore planners are not able practice racial segregation planning
policies to rectify the disamenities since spatial injustice will be apparent to the public.
8
Therefore, it is reasonable for the Chief Assessor to set a low DC rate to account for this
market sentiment, encouraging further redevelopment efforts.
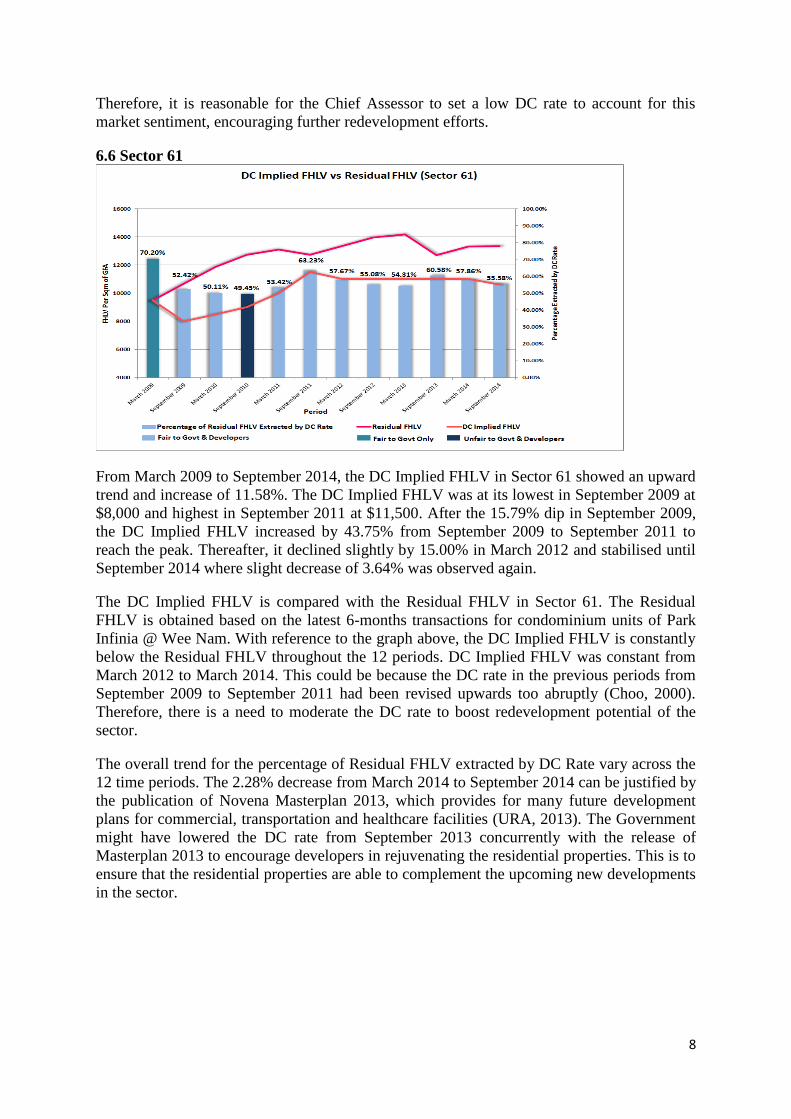
6.6 Sector 61
From March 2009 to September 2014, the DC Implied FHLV in Sector 61 showed an upward
trend and increase of 11.58%. The DC Implied FHLV was at its lowest in September 2009 at
$8,000 and highest in September 2011 at $11,500. After the 15.79% dip in September 2009,
the DC Implied FHLV increased by 43.75% from September 2009 to September 2011 to
reach the peak. Thereafter, it declined slightly by 15.00% in March 2012 and stabilised until
September 2014 where slight decrease of 3.64% was observed again.
The DC Implied FHLV is compared with the Residual FHLV in Sector 61. The Residual
FHLV is obtained based on the latest 6-months transactions for condominium units of Park
Infinia @ Wee Nam. With reference to the graph above, the DC Implied FHLV is constantly
below the Residual FHLV throughout the 12 periods. DC Implied FHLV was constant from
March 2012 to March 2014. This could be because the DC rate in the previous periods from
September 2009 to September 2011 had been revised upwards too abruptly (Choo, 2000).
Therefore, there is a need to moderate the DC rate to boost redevelopment potential of the
sector.
The overall trend for the percentage of Residual FHLV extracted by DC Rate vary across the
12 time periods. The 2.28% decrease from March 2014 to September 2014 can be justified by
the publication of Novena Masterplan 2013, which provides for many future development
plans for commercial, transportation and healthcare facilities (URA, 2013). The Government
might have lowered the DC rate from September 2013 concurrently with the release of
Masterplan 2013 to encourage developers in rejuvenating the residential properties. This is to
ensure that the residential properties are able to complement the upcoming new developments
in the sector.
9
PART A: ISSUE 2
1. Introduction
This strategy paper seeks to determine the possible need to further delineate the sectors in
Map B into more geographical sectors in order to better reflect the varying land values across
locations within the sector.
“Development Charge (DC) on the ‘appropriate geographical sector’, in relation to any
land, means the geographical sector set out in the plans in the Second Schedule within which
the land falls. DC is imposed on landowners or developers who benefit from a Written
Permission, making the approved development economically favorable, should contribute to
the state part of the benefit derived.” - Planning Act Section 40 (1)
The purpose of DC is for distributional equity and the state is justified to extract a part of the
windfall. Landowners or developers enjoys a windfall when the value of the property
increases not out of his own doing, but because of external forces. Such extrinsic forces
include general economic and population growth, spillover effects from a neighbour’s
positive use of land, favourable governmental projects and regulations. Therefore, the DC
Sectors should be delineated based on the external forces affecting different sub-segments of
the sector.
2. Analysis of Sector 104
Sector 104 is located in the Central and North-East Region of Singapore. It comprises mainly
of two large residential neighbourhoods, namely Bishan and Serangoon. Both
neighbourhoods are mature estates that generally have good amenities and high accessibility.
Delineation of the sector will be approached from a macro perspective before delving further
into micro analysis. In determining whether a new sector should be carved out or delineated,
a percentage difference of 10% and above in land value is set as the threshold for delineation.
The value of 10% was derived from analysing the average percentage difference in DC Rates
between Sector 104 and adjacent sectors.
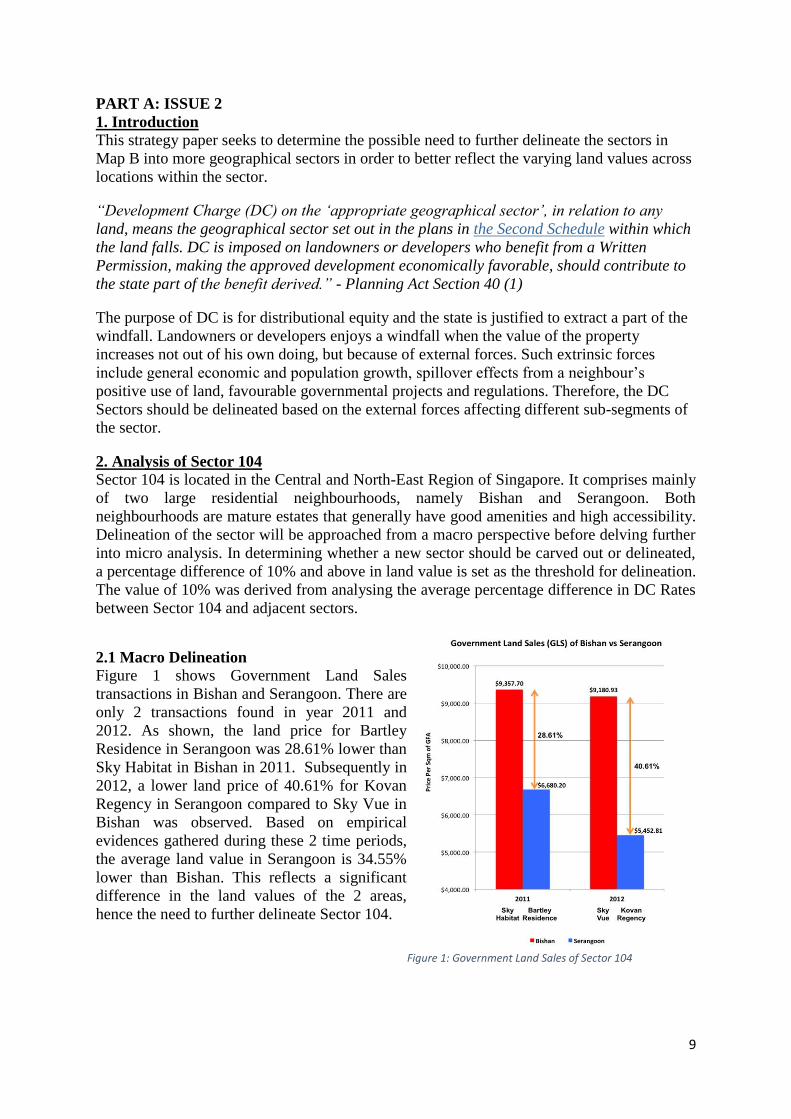
2.1 Macro Delineation
Figure 1 shows Government Land Sales
transactions in Bishan and Serangoon. There are
only 2 transactions found in year 2011 and
2012. As shown, the land price for Bartley
Residence in Serangoon was 28.61% lower than
Sky Habitat in Bishan in 2011. Subsequently in
2012, a lower land price of 40.61% for Kovan
Regency in Serangoon compared to Sky Vue in
Bishan was observed. Based on empirical
evidences gathered during these 2 time periods,
the average land value in Serangoon is 34.55%
lower than Bishan. This reflects a significant
difference in the land values of the 2 areas,
hence the need to further delineate Sector 104.
Figure 1: Government Land Sales of Sector 104
10
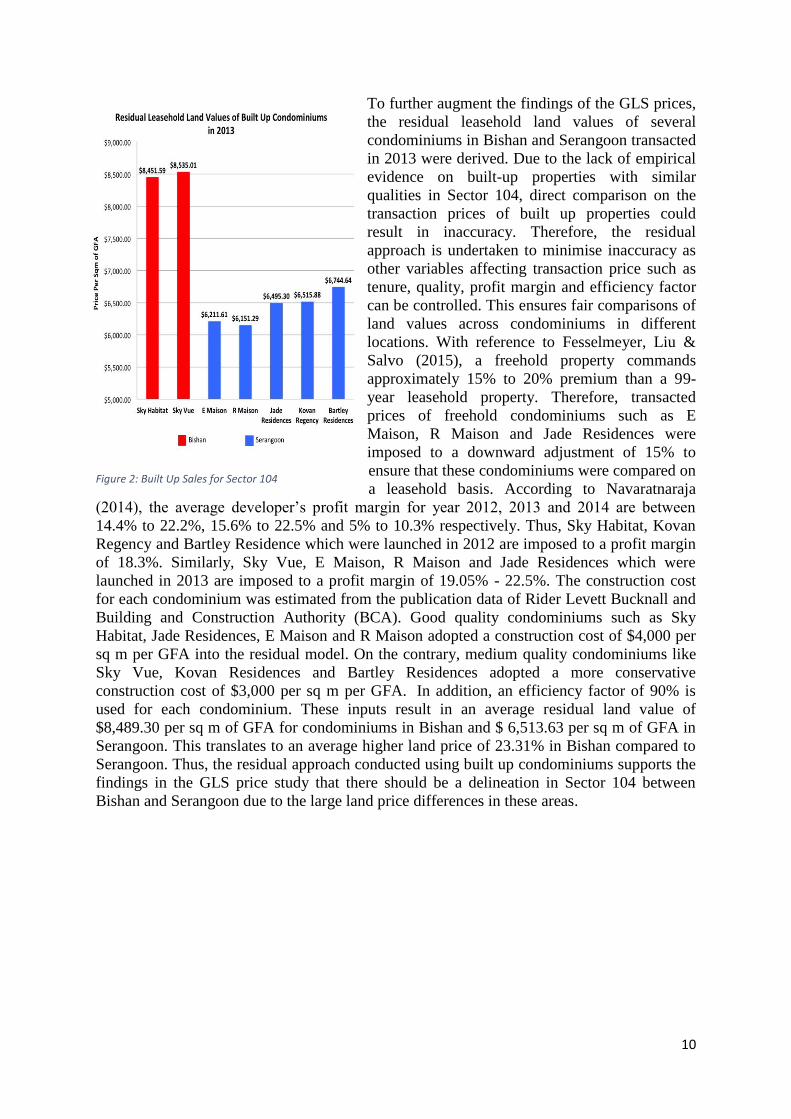
To further augment the findings of the GLS prices,
the residual leasehold land values of several
condominiums in Bishan and Serangoon transacted
in 2013 were derived. Due to the lack of empirical
evidence on built-up properties with similar
qualities in Sector 104, direct comparison on the
transaction prices of built up properties could
result in inaccuracy. Therefore, the residual
approach is undertaken to minimise inaccuracy as
other variables affecting transaction price such as
tenure, quality, profit margin and efficiency factor
can be controlled. This ensures fair comparisons of
land values across condominiums in different
locations. With reference to Fesselmeyer, Liu &
Salvo (2015), a freehold property commands
approximately 15% to 20% premium than a 99-
year leasehold property. Therefore, transacted
prices of freehold condominiums such as E
Maison, R Maison and Jade Residences were
imposed to a downward adjustment of 15% to
ensure that these condominiums were compared on
a leasehold basis. According to Navaratnaraja
(2014), the average developer’s profit margin for year 2012, 2013 and 2014 are between
14.4% to 22.2%, 15.6% to 22.5% and 5% to 10.3% respectively. Thus, Sky Habitat, Kovan
Regency and Bartley Residence which were launched in 2012 are imposed to a profit margin
of 18.3%. Similarly, Sky Vue, E Maison, R Maison and Jade Residences which were
launched in 2013 are imposed to a profit margin of 19.05% - 22.5%. The construction cost
for each condominium was estimated from the publication data of Rider Levett Bucknall and
Building and Construction Authority (BCA). Good quality condominiums such as Sky
Habitat, Jade Residences, E Maison and R Maison adopted a construction cost of $4,000 per
sq m per GFA into the residual model. On the contrary, medium quality condominiums like
Sky Vue, Kovan Residences and Bartley Residences adopted a more conservative
construction cost of $3,000 per sq m per GFA. In addition, an efficiency factor of 90% is
used for each condominium. These inputs result in an average residual land value of
$8,489.30 per sq m of GFA for condominiums in Bishan and $ 6,513.63 per sq m of GFA in
Serangoon. This translates to an average higher land price of 23.31% in Bishan compared to
Serangoon. Thus, the residual approach conducted using built up condominiums supports the
findings in the GLS price study that there should be a delineation in Sector 104 between
Bishan and Serangoon due to the large land price differences in these areas.
Figure 2: Built Up Sales for Sector 104
11
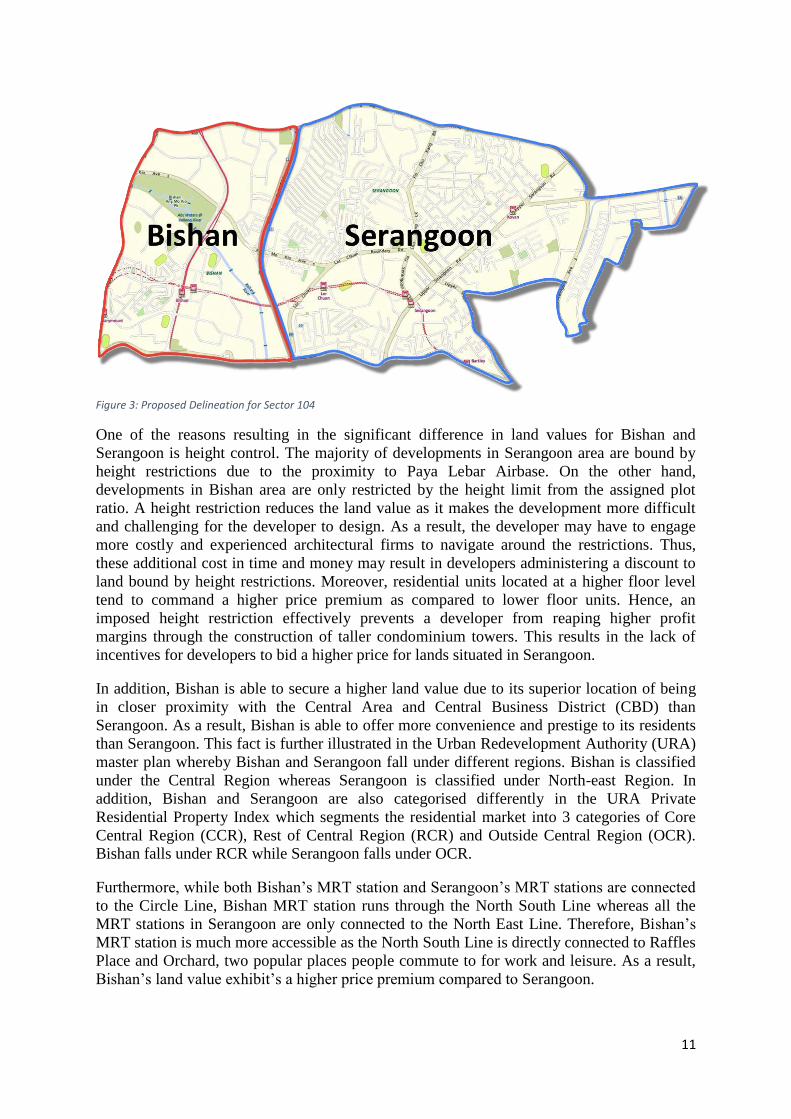
Figure 3: Proposed Delineation for Sector 104
One of the reasons resulting in the significant difference in land values for Bishan and
Serangoon is height control. The majority of developments in Serangoon area are bound by
height restrictions due to the proximity to Paya Lebar Airbase. On the other hand,
developments in Bishan area are only restricted by the height limit from the assigned plot
ratio. A height restriction reduces the land value as it makes the development more difficult
and challenging for the developer to design. As a result, the developer may have to engage
more costly and experienced architectural firms to navigate around the restrictions. Thus,
these additional cost in time and money may result in developers administering a discount to
land bound by height restrictions. Moreover, residential units located at a higher floor level
tend to command a higher price premium as compared to lower floor units. Hence, an
imposed height restriction effectively prevents a developer from reaping higher profit
margins through the construction of taller condominium towers. This results in the lack of
incentives for developers to bid a higher price for lands situated in Serangoon.
In addition, Bishan is able to secure a higher land value due to its superior location of being
in closer proximity with the Central Area and Central Business District (CBD) than
Serangoon. As a result, Bishan is able to offer more convenience and prestige to its residents
than Serangoon. This fact is further illustrated in the Urban Redevelopment Authority (URA)
master plan whereby Bishan and Serangoon fall under different regions. Bishan is classified
under the Central Region whereas Serangoon is classified under North-east Region. In
addition, Bishan and Serangoon are also categorised differently in the URA Private
Residential Property Index which segments the residential market into 3 categories of Core
Central Region (CCR), Rest of Central Region (RCR) and Outside Central Region (OCR).
Bishan falls under RCR while Serangoon falls under OCR.
Furthermore, while both Bishan’s MRT station and Serangoon’s MRT stations are connected
to the Circle Line, Bishan MRT station runs through the North South Line whereas all the
MRT stations in Serangoon are only connected to the North East Line. Therefore, Bishan’s
MRT station is much more accessible as the North South Line is directly connected to Raffles
Place and Orchard, two popular places people commute to for work and leisure. As a result,
Bishan’s land value exhibit’s a higher price premium compared to Serangoon.
12
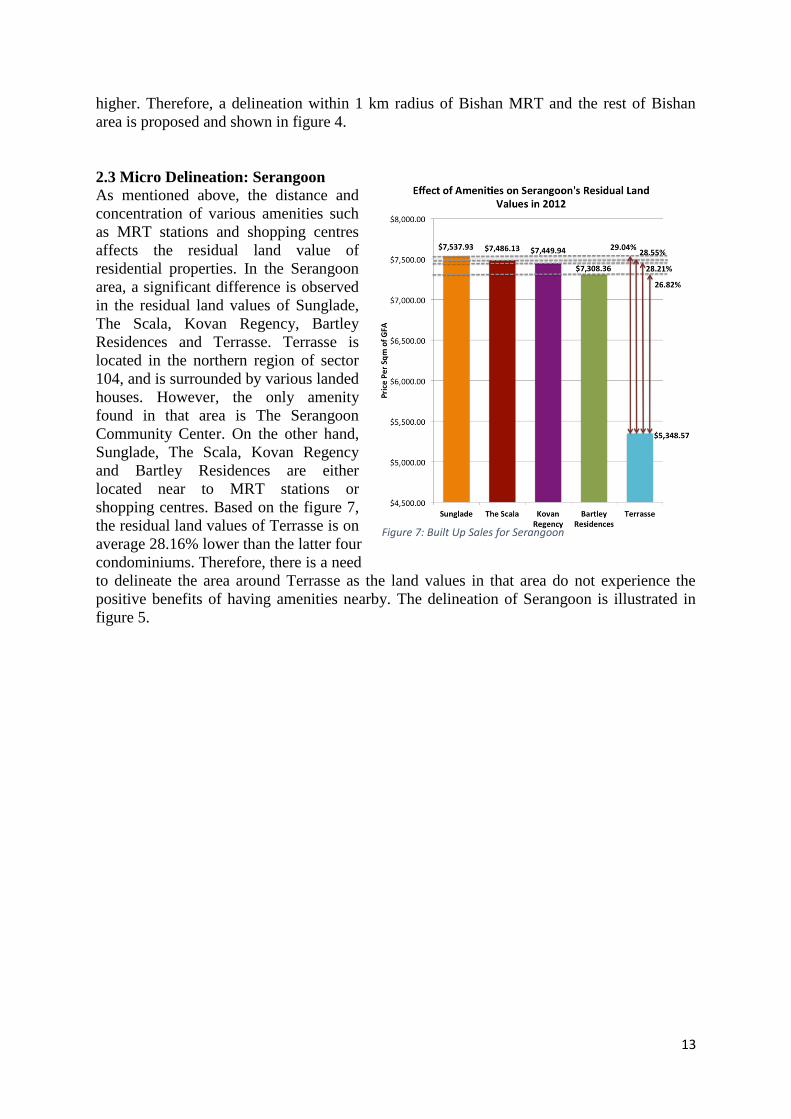
2.2 Micro Delineation: Bishan
A significant difference in land values for
residential properties located within 1 km
radius of Bishan MRT and the rest of Bishan
area can be observed. As shown in figure 6,
Sky Vue and Sky Habitat represent built-up
properties in the circled area while Clover
by the Park represent one in the rest of
Bishan area. The residual land value for
Clover by the Park is 13.41% and 12.56%
lower compared to Sky Vue and Sky Habitat
respectively. The circled area in figure 4 is a
region concentrated with several amenities
that contributes positively to residential land
values. These amenities include Bishan
MRT, Bishan Bus Interchange, Junction 8
Shopping Centre, Bishan Public Library and
Bishan Community Centre. In contrast, the
rest of Bishan area outside this circle is
generally surrounded only by
neighbourhood parks. With reference to Liu,
Yeow & Zhu (2006), residential land values
are most strongly affected by accessibility to
public transport and least affected by accessibility to parks. Amenities such as shopping
centre, schools and community centres rank in between public transport and parks. Thus, it is
reasonable that the circled area has a significantly higher land value than the rest of Bishan
area. The significantly stronger combined influence by a cluster of positive amenities in the
circled area has outweighed the minor influence by the park, which is the only amenity
provided in the rest of Bishan area. In addition, according to Navaratnarajah (2011), values of
residential properties located within 1 km radius from MRT is significantly 10% to 15%
Figure 6: Built Up Sales for Bishan
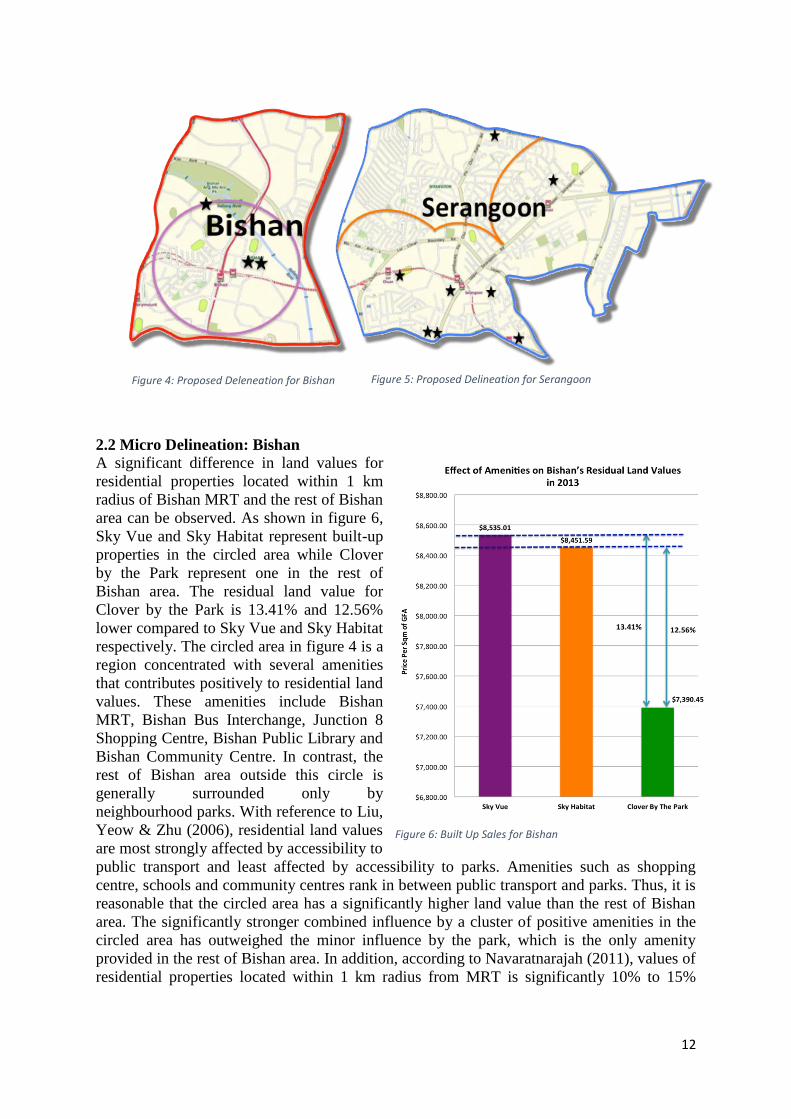
Figure 4: Proposed Deleneation for Bishan Figure 5: Proposed Delineation for Serangoon
13
higher. Therefore, a delineation within 1 km radius of Bishan MRT and the rest of Bishan
area is proposed and shown in figure 4.
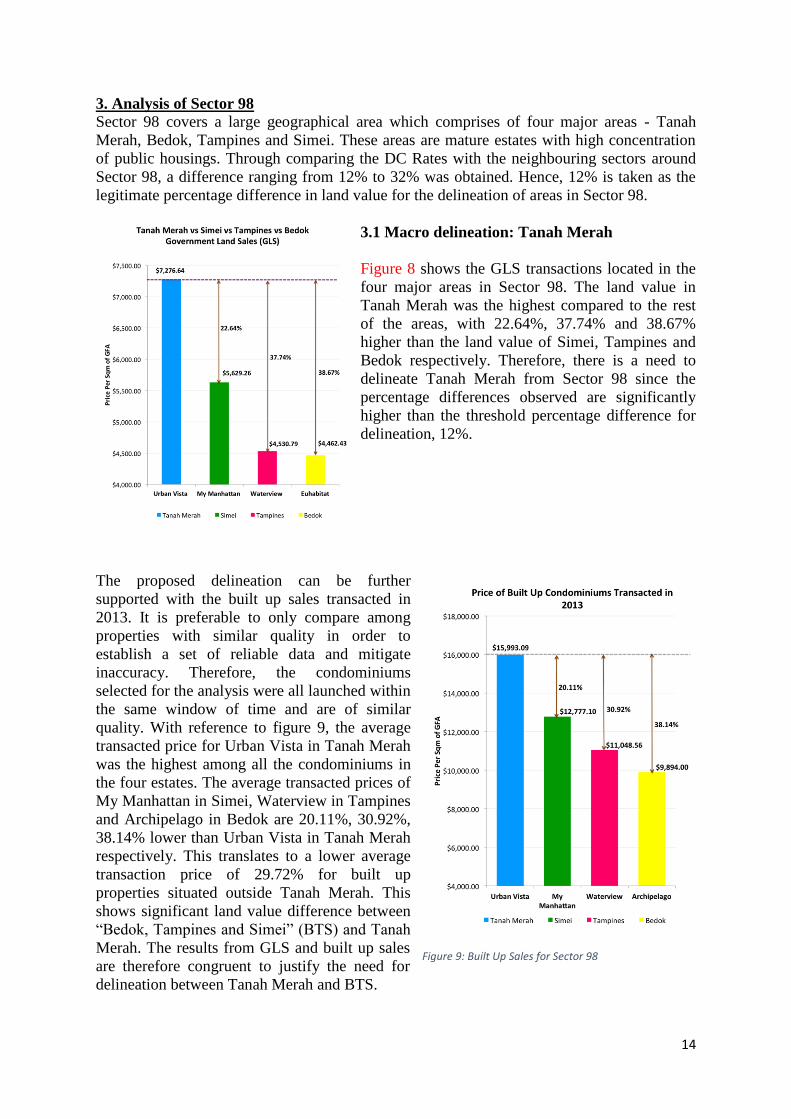
2.3 Micro Delineation: Serangoon
As mentioned above, the distance and
concentration of various amenities such
as MRT stations and shopping centres
affects the residual land value of
residential properties. In the Serangoon
area, a significant difference is observed
in the residual land values of Sunglade,
The Scala, Kovan Regency, Bartley
Residences and Terrasse. Terrasse is
located in the northern region of sector
104, and is surrounded by various landed
houses. However, the only amenity
found in that area is The Serangoon
Community Center. On the other hand,
Sunglade, The Scala, Kovan Regency
and Bartley Residences are either
located near to MRT stations or
shopping centres. Based on the figure 7,
the residual land values of Terrasse is on
average 28.16% lower than the latter four
condominiums. Therefore, there is a need
to delineate the area around Terrasse as the land values in that area do not experience the
positive benefits of having amenities nearby. The delineation of Serangoon is illustrated in
figure 5.
Figure 7: Built Up Sales for Serangoon
14
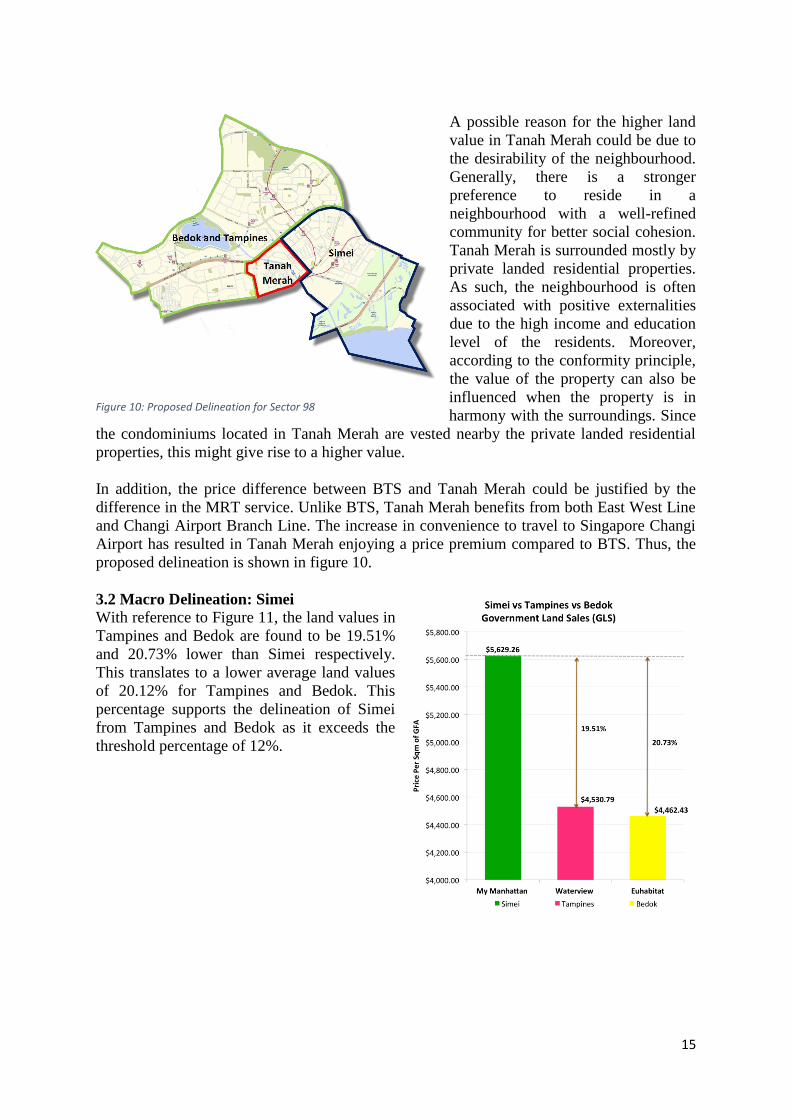
3. Analysis of Sector 98
Sector 98 covers a large geographical area which comprises of four major areas - Tanah
Merah, Bedok, Tampines and Simei. These areas are mature estates with high concentration
of public housings. Through comparing the DC Rates with the neighbouring sectors around
Sector 98, a difference ranging from 12% to 32% was obtained. Hence, 12% is taken as the
legitimate percentage difference in land value for the delineation of areas in Sector 98.
3.1 Macro delineation: Tanah Merah
Figure 8 shows the GLS transactions located in the
four major areas in Sector 98. The land value in
Tanah Merah was the highest compared to the rest
of the areas, with 22.64%, 37.74% and 38.67%
higher than the land value of Simei, Tampines and
Bedok respectively. Therefore, there is a need to
delineate Tanah Merah from Sector 98 since the
percentage differences observed are significantly
higher than the threshold percentage difference for
delineation, 12%.
The proposed delineation can be further
supported with the built up sales transacted in
2013. It is preferable to only compare among
properties with similar quality in order to
establish a set of reliable data and mitigate
inaccuracy. Therefore, the condominiums
selected for the analysis were all launched within
the same window of time and are of similar
quality. With reference to figure 9, the average
transacted price for Urban Vista in Tanah Merah
was the highest among all the condominiums in
the four estates. The average transacted prices of
My Manhattan in Simei, Waterview in Tampines
and Archipelago in Bedok are 20.11%, 30.92%,
38.14% lower than Urban Vista in Tanah Merah
respectively. This translates to a lower average
transaction price of 29.72% for built up
properties situated outside Tanah Merah. This
shows significant land value difference between
“Bedok, Tampines and Simei” (BTS) and Tanah
Merah. The results from GLS and built up sales
are therefore congruent to justify the need for
delineation between Tanah Merah and BTS.
Figure 8: Government Land Sales for Sector 98
Figure 9: Built Up Sales for Sector 98
15
A possible reason for the higher land
value in Tanah Merah could be due to
the desirability of the neighbourhood.
Generally, there is a stronger
preference to reside in a
neighbourhood with a well-refined
community for better social cohesion.
Tanah Merah is surrounded mostly by
private landed residential properties.
As such, the neighbourhood is often
associated with positive externalities
due to the high income and education
level of the residents. Moreover,
according to the conformity principle,
the value of the property can also be
influenced when the property is in
harmony with the surroundings. Since
the condominiums located in Tanah Merah are vested nearby the private landed residential
properties, this might give rise to a higher value.
In addition, the price difference between BTS and Tanah Merah could be justified by the
difference in the MRT service. Unlike BTS, Tanah Merah benefits from both East West Line
and Changi Airport Branch Line. The increase in convenience to travel to Singapore Changi
Airport has resulted in Tanah Merah enjoying a price premium compared to BTS. Thus, the
proposed delineation is shown in figure 10.
3.2 Macro Delineation: Simei With reference to Figure 11, the land values in
Tampines and Bedok are found to be 19.51%
and 20.73% lower than Simei respectively.
This translates to a lower average land values
of 20.12% for Tampines and Bedok. This
percentage supports the delineation of Simei
from Tampines and Bedok as it exceeds the
threshold percentage of 12%.
Figure 10: Proposed Delineation for Sector 98
Figure 11: Government Land Sales for BTS
16
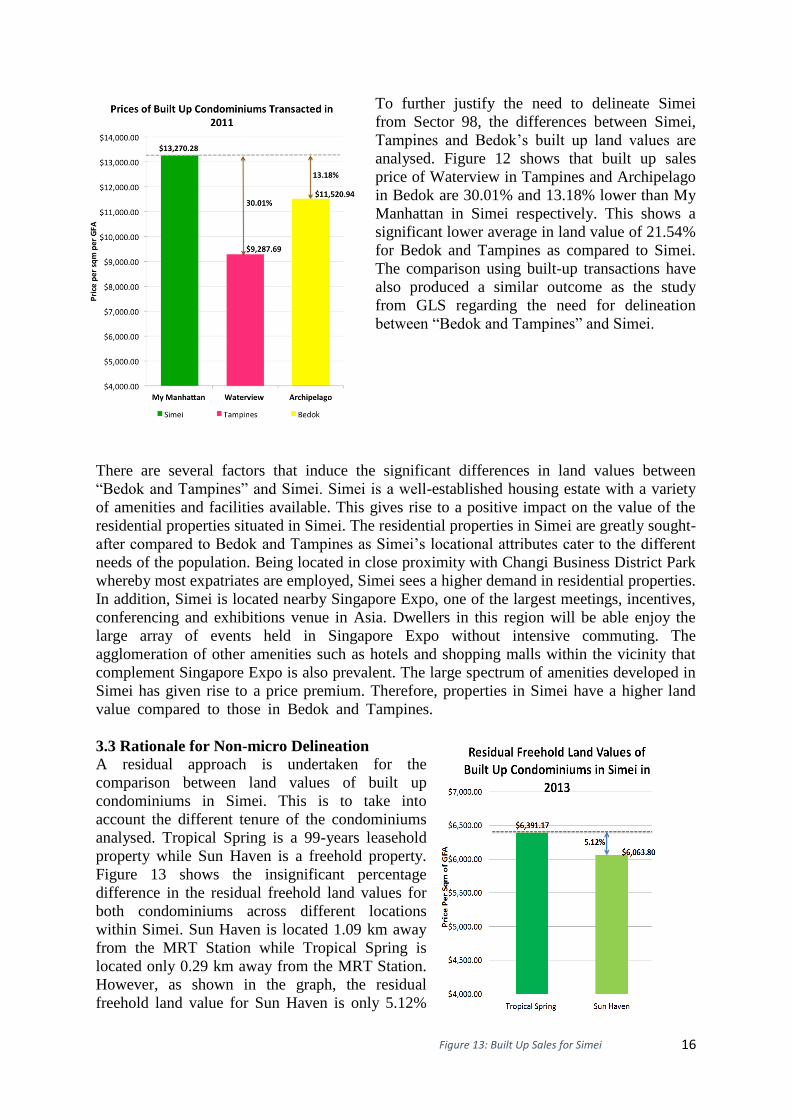
To further justify the need to delineate Simei
from Sector 98, the differences between Simei,
Tampines and Bedok’s built up land values are
analysed. Figure 12 shows that built up sales
price of Waterview in Tampines and Archipelago
in Bedok are 30.01% and 13.18% lower than My
Manhattan in Simei respectively. This shows a
significant lower average in land value of 21.54%
for Bedok and Tampines as compared to Simei.
The comparison using built-up transactions have
also produced a similar outcome as the study
from GLS regarding the need for delineation
between “Bedok and Tampines” and Simei.
There are several factors that induce the significant differences in land values between
“Bedok and Tampines” and Simei. Simei is a well-established housing estate with a variety
of amenities and facilities available. This gives rise to a positive impact on the value of the
residential properties situated in Simei. The residential properties in Simei are greatly sought-
after compared to Bedok and Tampines as Simei’s locational attributes cater to the different
needs of the population. Being located in close proximity with Changi Business District Park
whereby most expatriates are employed, Simei sees a higher demand in residential properties.
In addition, Simei is located nearby Singapore Expo, one of the largest meetings, incentives,
conferencing and exhibitions venue in Asia. Dwellers in this region will be able enjoy the
large array of events held in Singapore Expo without intensive commuting. The
agglomeration of other amenities such as hotels and shopping malls within the vicinity that
complement Singapore Expo is also prevalent. The large spectrum of amenities developed in
Simei has given rise to a price premium. Therefore, properties in Simei have a higher land
valueacomparedatoathoseainaBedokaandaTampines.
3.3 Rationale for Non-micro Delineation
A residual approach is undertaken for the
comparison between land values of built up
condominiums in Simei. This is to take into
account the different tenure of the condominiums
analysed. Tropical Spring is a 99-years leasehold
property while Sun Haven is a freehold property.
Figure 13 shows the insignificant percentage
difference in the residual freehold land values for
both condominiums across different locations
within Simei. Sun Haven is located 1.09 km away
from the MRT Station while Tropical Spring is
located only 0.29 km away from the MRT Station.
However, as shown in the graph, the residual
freehold land value for Sun Haven is only 5.12%
Figure 13: Built Up Sales for Simei
Figure 12: Built Up Sales for BTS
17
lower than Tropical Spring. This percentage is below the threshold of 12% and hence,
suggesting that further delineation within Simei is unnecessary. One reason that may justify
this suggestion include the relatively small size of Simei as an estate. This allows all non-
landed residential properties situated within this area to enjoy similar locational benefits from
the amenities provided.
In the case of Tanah Merah, there is lack of
empirical evidence on built up residential
properties to analyse the difference in land
values across varying locations. This is
because all the non-landed residential
properties in Tanah Merah were found in
clusters. However, this observation could also
suggest further delineation unnecessary as the
cluster of residential properties would have
similar external forces acting on them. Bedok
and Tampines are also faced with a similar
challenge as in Tanah Merah. The lack of
empirical evidence due to either clustering of
condominiums or aging non-landed residential
properties could deem further delineation
unjustifiable.
4. Analysis of Sector 100 Sector 100 is located in the North-East Region of Singapore and it comprises of geographical
areas such as Punggol, Sengkang, Buangkok and Hougang. Punggol and Sengkang region are
relatively new and there are numerous future plans presented in the Master Plan to provide
more amenities, commercial hubs and to metamorphose the lifestyle of the sector.Thus, the
process of delineating this sector should not only consider the trends of historical transaction,
but also be forward-looking
In order to determine whether further delineation is required, a minimal percentage difference
of 12% in land values was used. This percentage is derived from the difference in
development charge rate of a neighbouring sector, sector 99. Sector 99 was chosen instead of
sector 106 due to the lack of residential transactions in the latter sector.
Figure 14: Clustering of Condominiums in Tanah Merah
18
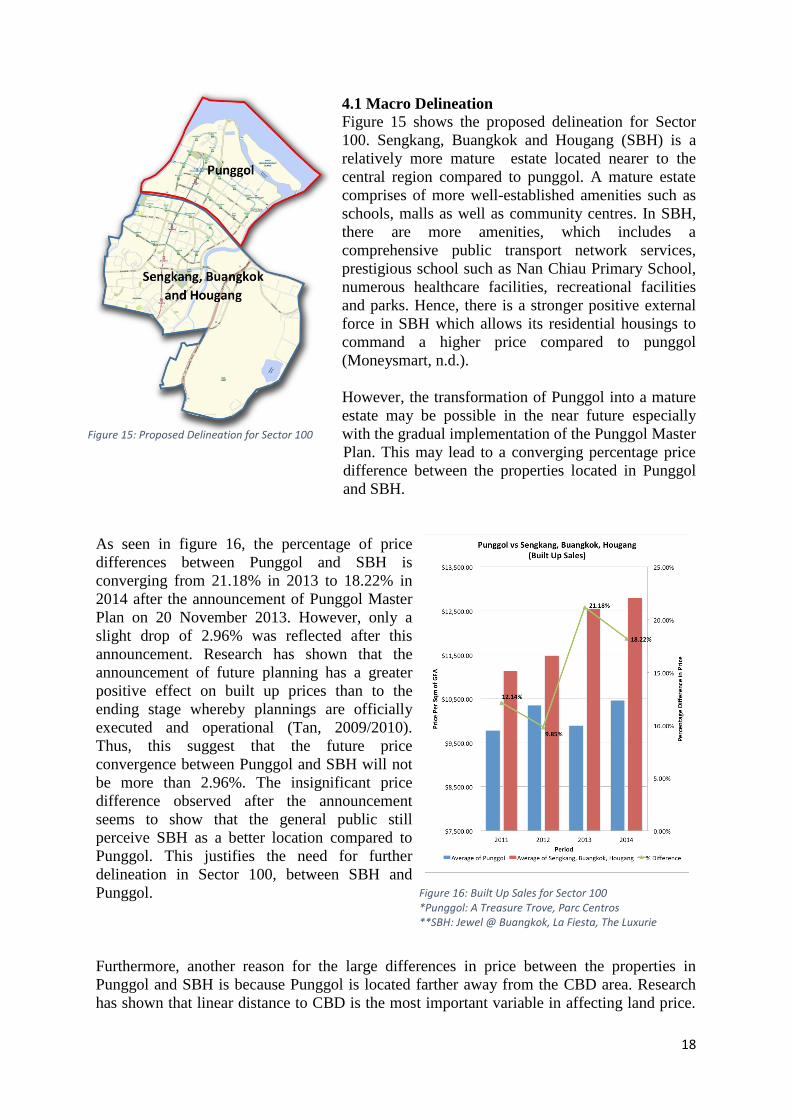
4.1 Macro Delineation
Figure 15 shows the proposed delineation for Sector
100. Sengkang, Buangkok and Hougang (SBH) is a
relatively more mature estate located nearer to the
central region compared to punggol. A mature estate
comprises of more well-established amenities such as
schools, malls as well as community centres. In SBH,
there are more amenities, which includes a
comprehensive public transport network services,
prestigious school such as Nan Chiau Primary School,
numerous healthcare facilities, recreational facilities
and parks. Hence, there is a stronger positive external
force in SBH which allows its residential housings to
command a higher price compared to punggol
(Moneysmart, n.d.).
However, the transformation of Punggol into a mature
estate may be possible in the near future especially
with the gradual implementation of the Punggol Master
Plan. This may lead to a converging percentage price
difference between the properties located in Punggol
and SBH.
As seen in figure 16, the percentage of price
differences between Punggol and SBH is
converging from 21.18% in 2013 to 18.22% in
2014 after the announcement of Punggol Master
Plan on 20 November 2013. However, only a
slight drop of 2.96% was reflected after this
announcement. Research has shown that the
announcement of future planning has a greater
positive effect on built up prices than to the
ending stage whereby plannings are officially
executed and operational (Tan, 2009/2010).
Thus, this suggest that the future price
convergence between Punggol and SBH will not
be more than 2.96%. The insignificant price
difference observed after the announcement
seems to show that the general public still
perceive SBH as a better location compared to
Punggol. This justifies the need for further
delineation in Sector 100, between SBH and
Punggol.
Furthermore, another reason for the large differences in price between the properties in
Punggol and SBH is because Punggol is located farther away from the CBD area. Research
has shown that linear distance to CBD is the most important variable in affecting land price.
Figure 15: Proposed Delineation for Sector 100
Figure 16: Built Up Sales for Sector 100 *Punggol: A Treasure Trove, Parc Centros **SBH: Jewel @ Buangkok, La Fiesta, The Luxurie
19
According to Lee (2002), Relationship between land prices per square meter is negatively
related to the linear distance to CBD. In this case, SBH is located 11.8km away from CBD
while Punggol is located 14.5km away from CBD area. Therefore, properties in SBH area are
likely to command a higher price premium compared to the properties in Punggol area.
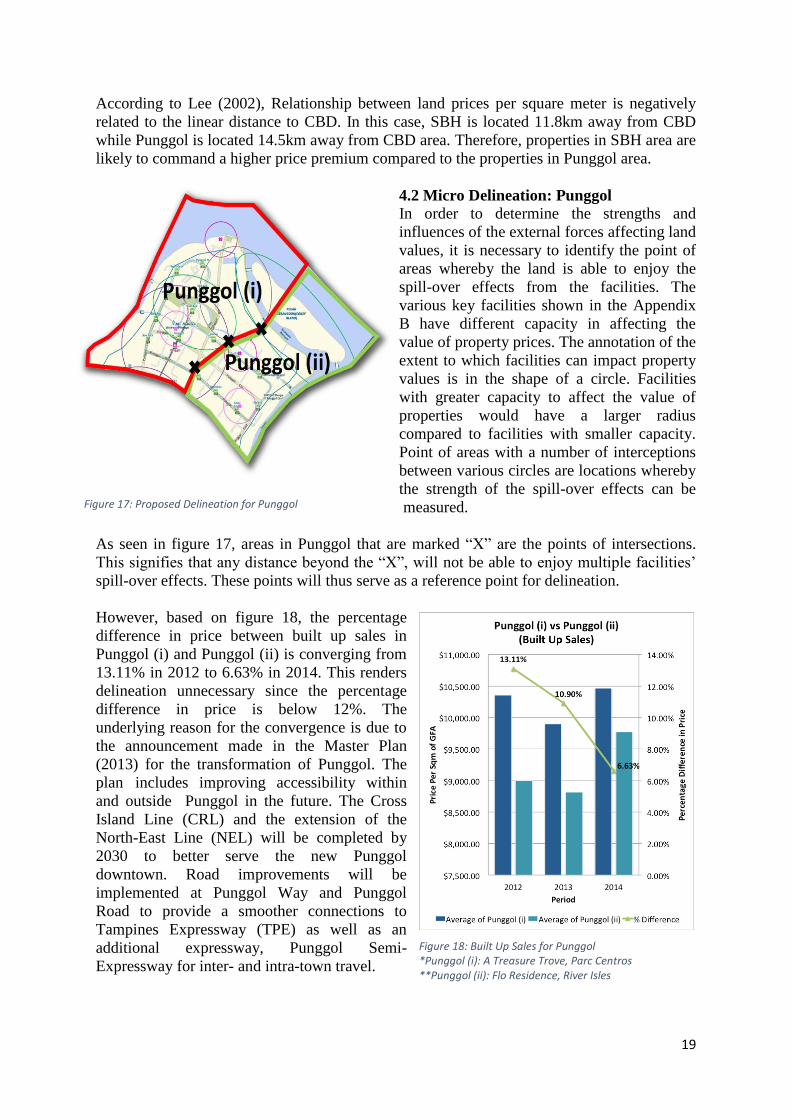
4.2 Micro Delineation: Punggol
In order to determine the strengths and
influences of the external forces affecting land
values, it is necessary to identify the point of
areas whereby the land is able to enjoy the
spill-over effects from the facilities. The
various key facilities shown in the Appendix
B have different capacity in affecting the
value of property prices. The annotation of the
extent to which facilities can impact property
values is in the shape of a circle. Facilities
with greater capacity to affect the value of
properties would have a larger radius
compared to facilities with smaller capacity.
Point of areas with a number of interceptions
between various circles are locations whereby
the strength of the spill-over effects can be
measured.
As seen in figure 17, areas in Punggol that are marked “X” are the points of intersections.
This signifies that any distance beyond the “X”, will not be able to enjoy multiple facilities’
spill-over effects. These points will thus serve as a reference point for delineation.
However, based on figure 18, the percentage
difference in price between built up sales in
Punggol (i) and Punggol (ii) is converging from
13.11% in 2012 to 6.63% in 2014. This renders
delineation unnecessary since the percentage
difference in price is below 12%. The
underlying reason for the convergence is due to
the announcement made in the Master Plan
(2013) for the transformation of Punggol. The
plan includes improving accessibility within
and outside Punggol in the future. The Cross
Island Line (CRL) and the extension of the
North-East Line (NEL) will be completed by
2030 to better serve the new Punggol
downtown. Road improvements will be
implemented at Punggol Way and Punggol
Road to provide a smoother connections to
Tampines Expressway (TPE) as well as an
additional expressway, Punggol Semi-
Expressway for inter- and intra-town travel.
Figure 17: Proposed Delineation for Punggol
Figure 18: Built Up Sales for Punggol *Punggol (i): A Treasure Trove, Parc Centros **Punggol (ii): Flo Residence, River Isles
20
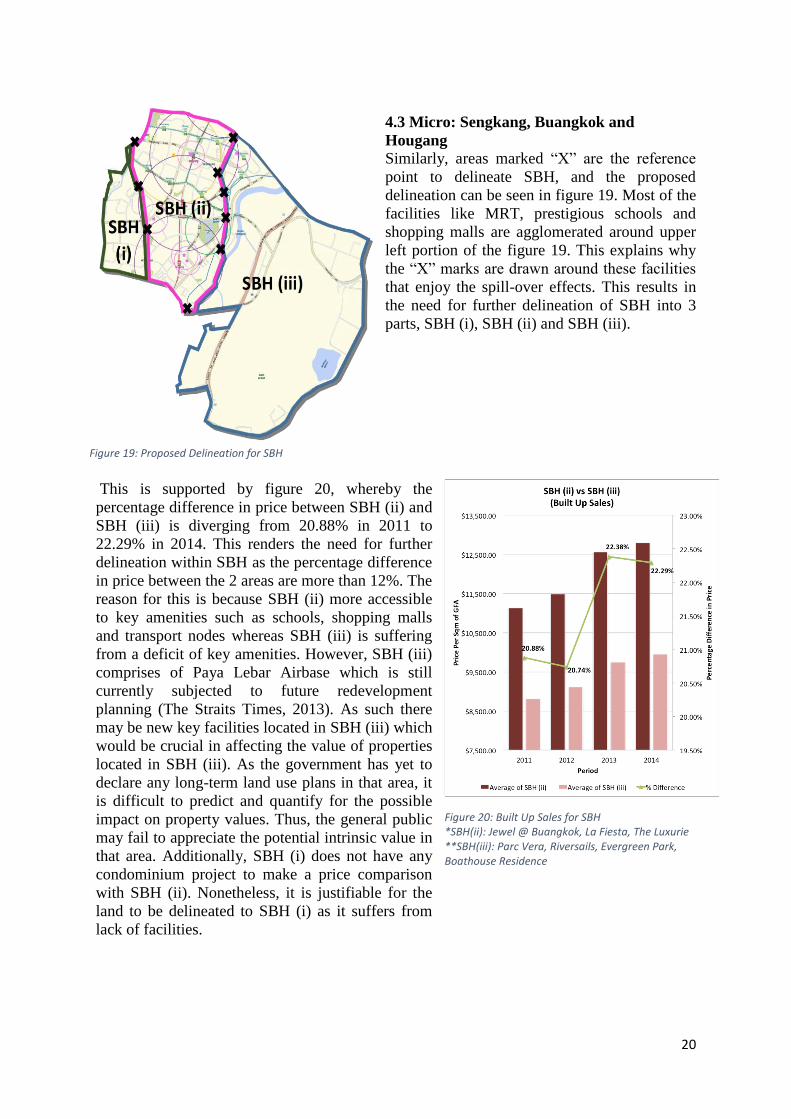
Figure 19: Proposed Delineation for SBH
4.3 Micro: Sengkang, Buangkok and
Hougang Similarly, areas marked “X” are the reference
point to delineate SBH, and the proposed
delineation can be seen in figure 19. Most of the
facilities like MRT, prestigious schools and
shopping malls are agglomerated around upper
left portion of the figure 19. This explains why
the “X” marks are drawn around these facilities
that enjoy the spill-over effects. This results in
the need for further delineation of SBH into 3
parts, SBH (i), SBH (ii) and SBH (iii).
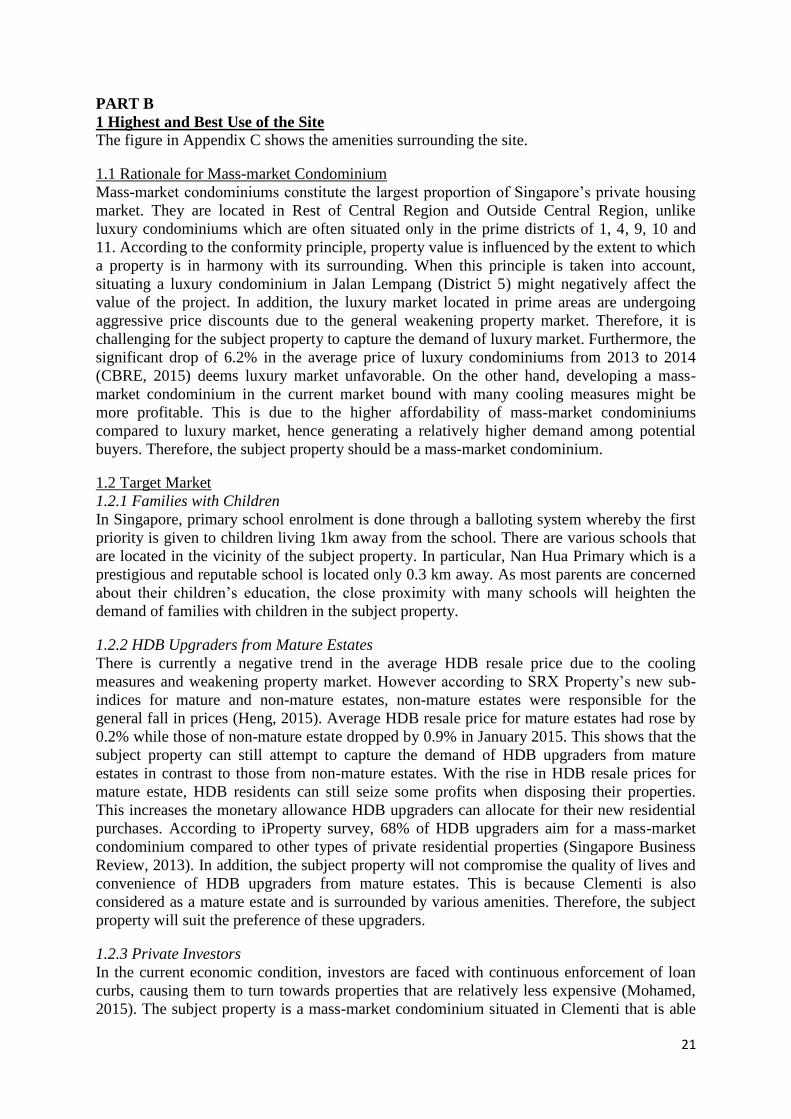
This is supported by figure 20, whereby the
percentage difference in price between SBH (ii) and
SBH (iii) is diverging from 20.88% in 2011 to
22.29% in 2014. This renders the need for further
delineation within SBH as the percentage difference
in price between the 2 areas are more than 12%. The
reason for this is because SBH (ii) more accessible
to key amenities such as schools, shopping malls
and transport nodes whereas SBH (iii) is suffering
from a deficit of key amenities. However, SBH (iii)
comprises of Paya Lebar Airbase which is still
currently subjected to future redevelopment
planning (The Straits Times, 2013). As such there
may be new key facilities located in SBH (iii) which
would be crucial in affecting the value of properties
located in SBH (iii). As the government has yet to
declare any long-term land use plans in that area, it
is difficult to predict and quantify for the possible
impact on property values. Thus, the general public
may fail to appreciate the potential intrinsic value in
that area. Additionally, SBH (i) does not have any
condominium project to make a price comparison
with SBH (ii). Nonetheless, it is justifiable for the
land to be delineated to SBH (i) as it suffers from
lack of facilities.
Figure 20: Built Up Sales for SBH *SBH(ii): Jewel @ Buangkok, La Fiesta, The Luxurie **SBH(iii): Parc Vera, Riversails, Evergreen Park, Boathouse Residence
21
PART B
1 Highest and Best Use of the Site
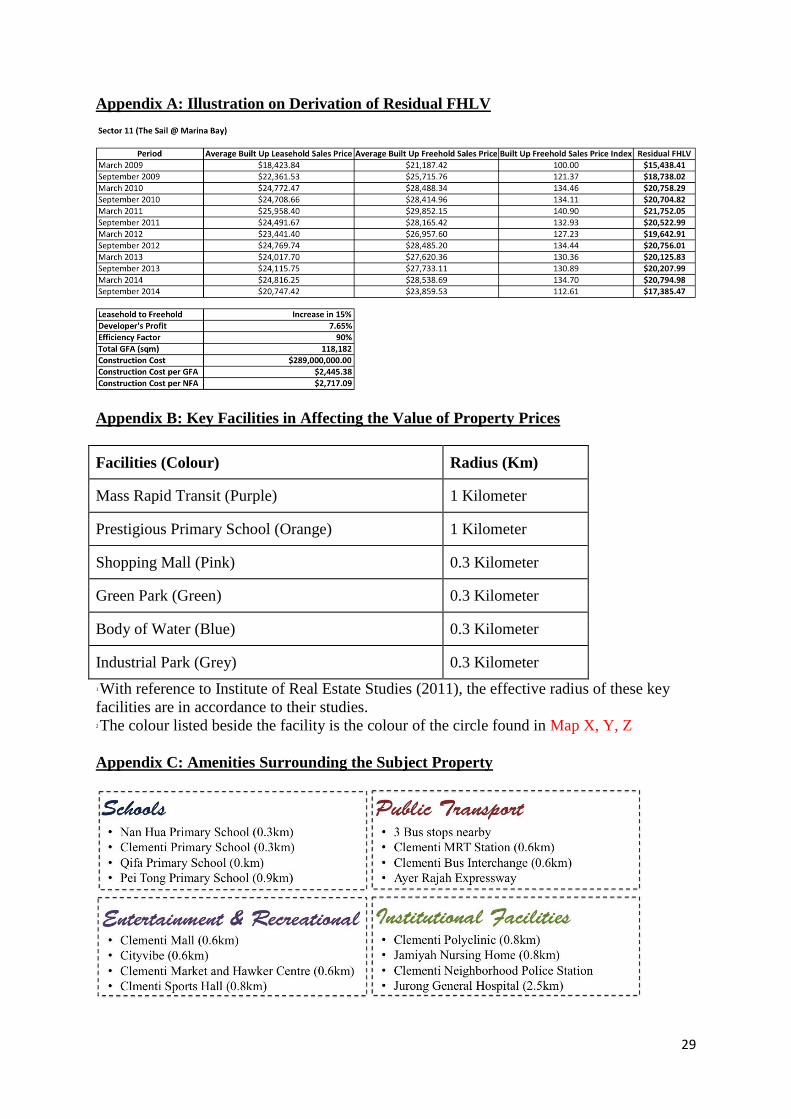
The figure in Appendix C shows the amenities surrounding the site.
1.1 Rationale for Mass-market Condominium
Mass-market condominiums constitute the largest proportion of Singapore’s private housing
market. They are located in Rest of Central Region and Outside Central Region, unlike
luxury condominiums which are often situated only in the prime districts of 1, 4, 9, 10 and
11. According to the conformity principle, property value is influenced by the extent to which
a property is in harmony with its surrounding. When this principle is taken into account,
situating a luxury condominium in Jalan Lempang (District 5) might negatively affect the
value of the project. In addition, the luxury market located in prime areas are undergoing
aggressive price discounts due to the general weakening property market. Therefore, it is
challenging for the subject property to capture the demand of luxury market. Furthermore, the
significant drop of 6.2% in the average price of luxury condominiums from 2013 to 2014
(CBRE, 2015) deems luxury market unfavorable. On the other hand, developing a mass-
market condominium in the current market bound with many cooling measures might be
more profitable. This is due to the higher affordability of mass-market condominiums
compared to luxury market, hence generating a relatively higher demand among potential
buyers. Therefore, the subject property should be a mass-market condominium.
1.2 Target Market
1.2.1 Families with Children
In Singapore, primary school enrolment is done through a balloting system whereby the first
priority is given to children living 1km away from the school. There are various schools that
are located in the vicinity of the subject property. In particular, Nan Hua Primary which is a
prestigious and reputable school is located only 0.3 km away. As most parents are concerned
about their children’s education, the close proximity with many schools will heighten the
demand of families with children in the subject property.
1.2.2 HDB Upgraders from Mature Estates
There is currently a negative trend in the average HDB resale price due to the cooling
measures and weakening property market. However according to SRX Property’s new sub-
indices for mature and non-mature estates, non-mature estates were responsible for the
general fall in prices (Heng, 2015). Average HDB resale price for mature estates had rose by
0.2% while those of non-mature estate dropped by 0.9% in January 2015. This shows that the
subject property can still attempt to capture the demand of HDB upgraders from mature
estates in contrast to those from non-mature estates. With the rise in HDB resale prices for
mature estate, HDB residents can still seize some profits when disposing their properties.
This increases the monetary allowance HDB upgraders can allocate for their new residential
purchases. According to iProperty survey, 68% of HDB upgraders aim for a mass-market
condominium compared to other types of private residential properties (Singapore Business
Review, 2013). In addition, the subject property will not compromise the quality of lives and
convenience of HDB upgraders from mature estates. This is because Clementi is also
considered as a mature estate and is surrounded by various amenities. Therefore, the subject
property will suit the preference of these upgraders.
1.2.3 Private Investors
In the current economic condition, investors are faced with continuous enforcement of loan
curbs, causing them to turn towards properties that are relatively less expensive (Mohamed,
2015). The subject property is a mass-market condominium situated in Clementi that is able
22
to attract many investors because it is relatively easy to afford and finance. Due to the
proximity with many schools and employment centres, potential tenants can be easily
secured. This will ensure steady rental incomes for investors. Moreover, the subject property
is considered to have high growth potential due to the government’s decentralisation strategy
on making Jurong as a regional centre. There is also a lower risk involved with mass-market
condominiums in Outside Central Region that will further appeal investors. This is illustrated
in the island-wide drop of non-landed private residential prices in 2014 where the average
price of those located Outside Central Region is least affected (Savills Research, 2015).
1.3 Number of Units
From a developer’s point of view, developers aim to optimise their profits by building as
many units as possible. According to Urban Redevelopment Authority (URA), the maximum
number of dwelling units allowed in this development is 900. In view of this constraint, the
number of proposed units is 870.
1.4 Rationale for Unit Types and Distribution
In light of cooling measures, affordability of houses will decline significantly (ST Property,
2013). Therefore, more smaller units should be assigned in this development because they
have a lower overall quantum price. A significant proportion of units are also assigned to
have 2 and 3 bedrooms to cater towards one of our target market - families with children.
There are only a limited number of 4-bedroom units allocated because it is less affordable for
potential buyers who are targeting mass-market condominium.
2 Forecasted Selling Prices and Estimation of Gross Development Value (GDV)
2.1 Comparable
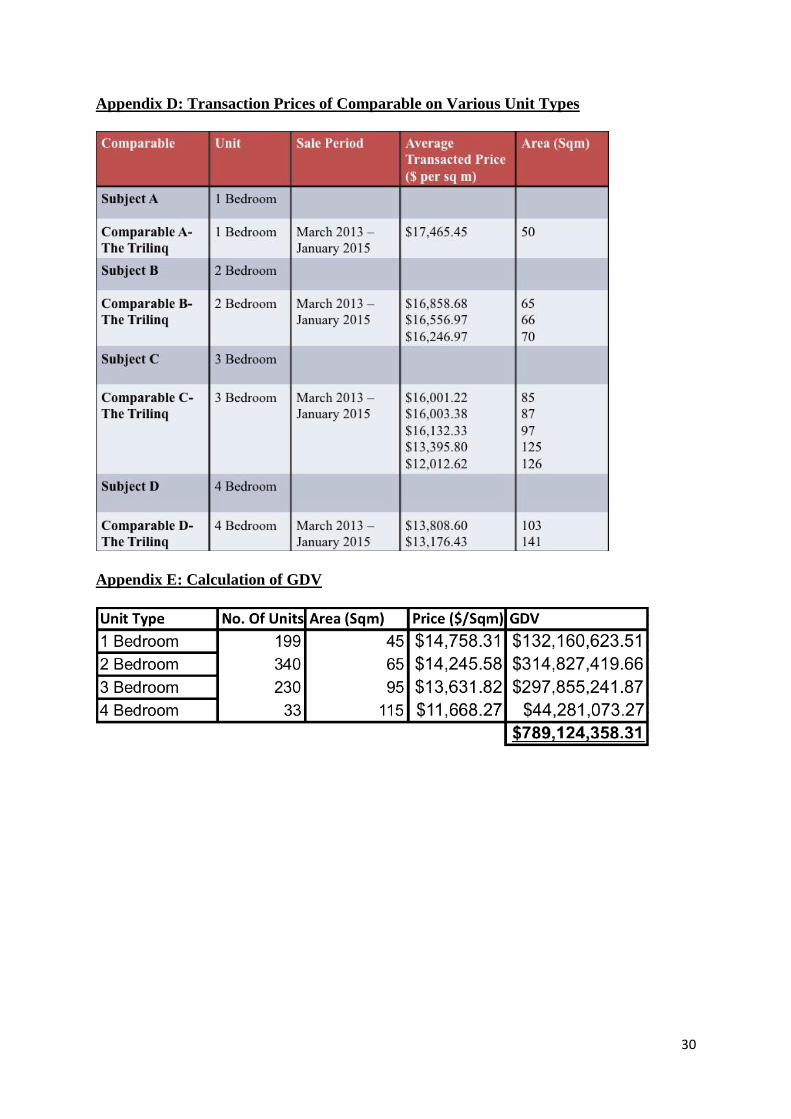
Refer to Appendix D for the average transaction price of various units types in the Trilinq.
2.2 Adjustments
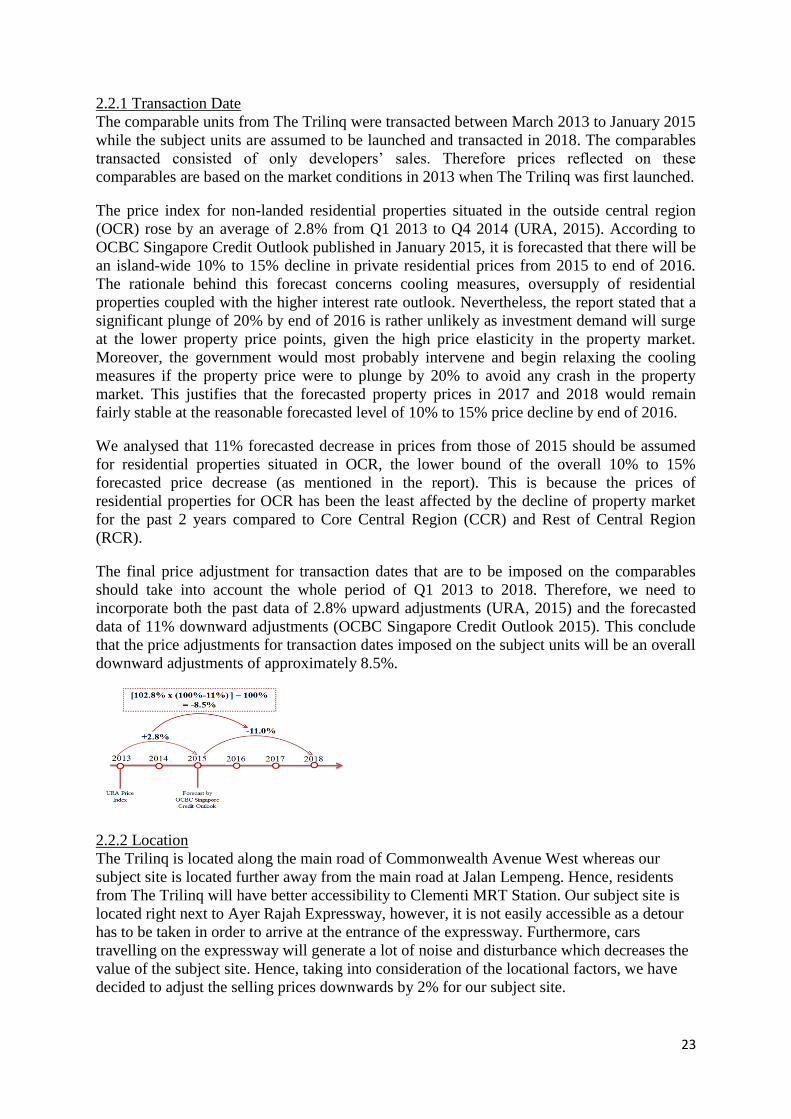
23
2.2.1 Transaction Date
The comparable units from The Trilinq were transacted between March 2013 to January 2015
while the subject units are assumed to be launched and transacted in 2018. The comparables
transacted consisted of only developers’ sales. Therefore prices reflected on these
comparables are based on the market conditions in 2013 when The Trilinq was first launched.
The price index for non-landed residential properties situated in the outside central region
(OCR) rose by an average of 2.8% from Q1 2013 to Q4 2014 (URA, 2015). According to
OCBC Singapore Credit Outlook published in January 2015, it is forecasted that there will be
an island-wide 10% to 15% decline in private residential prices from 2015 to end of 2016.
The rationale behind this forecast concerns cooling measures, oversupply of residential
properties coupled with the higher interest rate outlook. Nevertheless, the report stated that a
significant plunge of 20% by end of 2016 is rather unlikely as investment demand will surge
at the lower property price points, given the high price elasticity in the property market.
Moreover, the government would most probably intervene and begin relaxing the cooling
measures if the property price were to plunge by 20% to avoid any crash in the property
market. This justifies that the forecasted property prices in 2017 and 2018 would remain
fairly stable at the reasonable forecasted level of 10% to 15% price decline by end of 2016.
We analysed that 11% forecasted decrease in prices from those of 2015 should be assumed
for residential properties situated in OCR, the lower bound of the overall 10% to 15%
forecasted price decrease (as mentioned in the report). This is because the prices of
residential properties for OCR has been the least affected by the decline of property market
for the past 2 years compared to Core Central Region (CCR) and Rest of Central Region
(RCR).
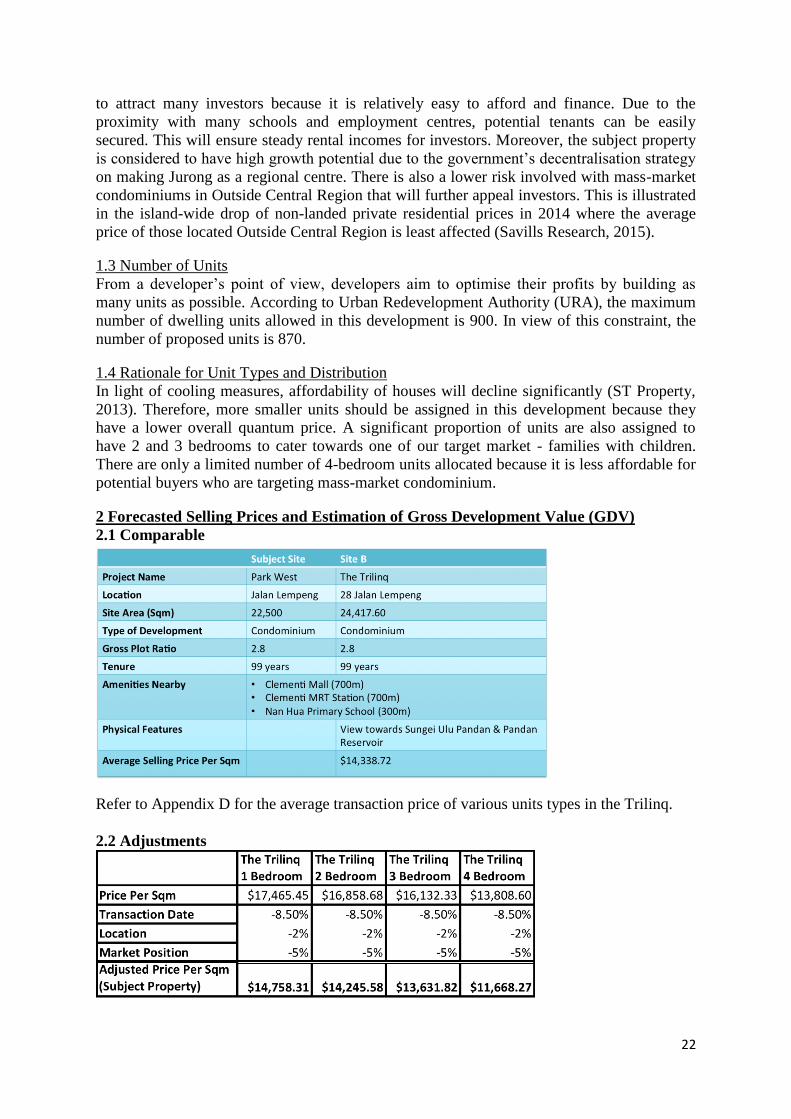
The final price adjustment for transaction dates that are to be imposed on the comparables
should take into account the whole period of Q1 2013 to 2018. Therefore, we need to
incorporate both the past data of 2.8% upward adjustments (URA, 2015) and the forecasted
data of 11% downward adjustments (OCBC Singapore Credit Outlook 2015). This conclude
that the price adjustments for transaction dates imposed on the subject units will be an overall
downward adjustments of approximately 8.5%.
2.2.2 Location
The Trilinq is located along the main road of Commonwealth Avenue West whereas our
subject site is located further away from the main road at Jalan Lempeng. Hence, residents
from The Trilinq will have better accessibility to Clementi MRT Station. Our subject site is
located right next to Ayer Rajah Expressway, however, it is not easily accessible as a detour
has to be taken in order to arrive at the entrance of the expressway. Furthermore, cars
travelling on the expressway will generate a lot of noise and disturbance which decreases the
value of the subject site. Hence, taking into consideration of the locational factors, we have
decided to adjust the selling prices downwards by 2% for our subject site.
24
2.2.3 Market Positioning
The Trilinq is positioned as a high end mass-market condominium with units enjoying
unblocked views, high loft ceilings and numerous facilities. However, our subject site is
positioned to cater to the mid end mass-market. Furthermore, The Trilinq adopted an
aggressive pricing strategy that was not in line with market sentiments. Thus, the projected
prices for our subject site should be reduced by 5% to reflect the difference in our target
market and market positioning.
3 Construction Cost
Construction cost is largely dependent on the quality and positioning of the development. As
the development is determined to be a mass-market condominium, the estimated cost of
construction will be of an average quality condominium. According to Rider Levett
Bucknall’s publication, we have decided to adopt $2,700 per sqm of GFA as the construction
cost for this development.
4 Marketing and Legal Cost
4.1 Marketing
Sales commissions are paid to the real estate agents when they successfully secure a sale
from a buyer. The commission rate depends on the market condition during the time of sale.
During rising market condition, developers quote a sales commission of 0.6%. However due
to the cooling measures imposed on the market, mass residential sales volume have been
reduced (KnightFrank, 2015). This has prompted developers to increase their sales
commission to 1.5%, incentivising agents to adopt more aggressive sales approach. The
promotional expenses for real estate projects usually include advertising fees, banners,
brochures and architectural models. Based on commercial practices, developers incur
approximately $1,500,000 for advertisements and promotions. Moreover, show flats are built
to provide buyers with a clearer representation of the units. This would cost approximately
0.15% of estimated GDV to construct and maintain.
4.2 Legal Cost
In a real estate development project, solicitors are needed in 3 different segments of the
project which includes the purchase of land, mortgage and sale of units when the property is
launched. The legal cost and stamp duties payable for the acquisition of land by en bloc is
estimated to be 1.5% and 3% of the land purchase price respectively. On the other hand, legal
cost associated with the sale of units and securing a mortgage for the project by simple loan
structure is estimated to be 1.5% of the Gross Development Value (GDV).
5 Financing cost
In determining the financing cost for land and construction, the financial statements of
CapitaLand and Keppel Land were analysed. Even though the specific interest rate on land
loans and construction loans are not published, the average interest rate on borrowings at a
corporate level is provided. CapitaLand and Keppel Land have an average interest rate of
3.4% (CapitaLand Limited Financial Year 2014 Results, 2015) and 2.5% (Keppel Land
Financial Year 2014 Results, 2015) respectively. This low levels of interest rate are largely
due to their strong credit ratings and reputations in the industry. However, a higher interest
rate will be assumed for both the construction loan and the land loan of this project. We have
estimated that for a typical developer, the interest rate on construction loans will be 6% and
the interest rate on land loans will be 4%. Land loans have a lower interest rate compared to
construction loans because land can be used as a collateral in the mortgage, reducing risk.
25
6 Residual Land Valuation Refer to Appendix E for the calculation of GDV.
7 Differential and Upgrading Premium
26
References
Anndrejs, S. and Ray, T. (2000) The Effect of Property Taxes and Development Cost
Charges on Urban Development: Perspectives of Planners, Developers and Finance
Officers in Toronto and Ottawa, XXIIE2, 303 - 304
CapitaLand Limited Financial Year 2014 Results. (2015) (1st ed.). Retrieved 24 March 2015,
from http://media.corporate-
ir.net/media_files/IROL/13/130462/FY2014ResultsPresentationFINALMainDecknSu
pplementaryslides.pdf
Chew, K.T (2011). Forward-Looking Behaviour in Singapore’s Private Housing Market: The
Impact of the North-East Transit Line on the Housing Price Gradient (Published
Master Dissertation). Retrieved April 3, 2015, from
http://scholarbank.nus.edu.sg/bitstream/handle/10635/30739/Forward-
Looking%20Behaviour%20in%20Singapores%20Private%20Housing%20Market.pdf
?sequence=1
Choo, T. (2012, April 22). Contesting Public Space: Singapore's Little India. The Straits
Times [Singapore]. Retrieved from http://www.asianurbanepicenters.com/?p=885
Deng, Y, McMillen, D.P, & Tien, F.S. (2011). Private Residential Price Indices in
Singapore: A Matching Approach. Retrieved from Institute of Real Estate Studies
website: http://www.ires.nus.edu.sg/workingpapers/IRES2010-012.pdf
Heng, J. (2015, January 8). HDB resale prices fall for 11th straight month in November,
volume also down. The Straits Times. Retrieved March 25, 2015, from
http://www.straitstimes.com/news/singapore/housing/story/hdb-resale-prices-fall-
11th-straight-month-november-volume-also-down-20
Keppel Land Financial Year 2014 Results. (2015) (1st ed.). Retrieved 24 March 2015, from
http://www.keppelland.com.sg/pdf/inv/KLL_FY2014_slides.pdf
KnightFrank (2015, March 26). Hong Kong: Further cooling measures to reduce mass
residential sales volume. Retrieved from http://www.knightfrankblog.com/global-
briefing/in-focus/hong-kong-further-cooling-measures-to-reduce-mass-residential-
sales-volume/
Kim, S. (2011, October 28). Tong Eng Group Press Release. Business Times. Retrieved from
http://tongeng.com.sg/sites/default/files/press-releases/Press%20Release%202011-11-
03-01.pdf
Langdon & Seah,. (2015). Quarterly Cost Publication Issue 25 March 2015. Retrieved 24
March 2015, from http://www.langdonseah.com/en/ga/files/download/3621
Learning, A. (2014, December 29). Mr. Propwise's 2015 Singapore Property Market Outlook.
Yahoo News [Singapore]. Retrieved from https://sg.news.yahoo.com/mr-propwise-
2015-singapore-property-market-outlook-155916650.html
Lee, C. W. (2015). Singapore Credit Outlook 2015. Retrieved from OCBC Bank website:
https://www.ocbc.com/assets/pdf/Credit2015.pdf
27
Lee, Y. J. (2009/2010) A Comparison of the Impacts of MRT Attributes on Property Values.
(Unpublished undergraduate dissertation) Department of Real Estate, National
University of Singapore, Singapore
Lee, Y.P. (2002) Determinants of Singapore Residential Land Value. (Published Master
Dissertation) Department of Estate Managment, National University of Singapore,
Singapore dspace.mit.edu/bitstream/handle/1721.1/32226/51888819.pdf
Ministry of Finance, Ministry of National Development, Monetary Authority of Singapore, &
Ministry to Trade & Industry. (2013). Additional Measures to Ensure a Stable and
Sustainable Property Market. Retrieved from Inland Revenue Authority of Singapore
website: https://www.ura.gov.sg/skyline/skyline07/skyline07-06/text/05.htm
Moneysmart. (n.d.). How Much Will Your First Home Cost? | Budgeting and Affordability |
MoneySmart.sg. Retrieved April 3, 2015, from
http://learn.moneysmart.sg/property/how-much-will-your-first-home-cost/
Ngiam, T.D. (2006). Looking Back, Navigating Forward. In Tay, S.C (Ed.), A Mandarin and
the Making of Public Policy (1st ed., p. 153). Retrieved from
https://books.google.com.sg/books?id=d2D6JlD-
vioC&pg=PA153&lpg=PA153&dq=development+charge+raw+land+value+raffles&s
ource=bl&ots=oIuY6xjnuD&sig=-
8rHen6JWkasUMfWXdKegqtnThs&hl=en&sa=X&ei=zHEuVZ-
LGYOpuQS2xIHIDQ&ved=0CBwQ6AEwAA#v=onepage&q=development%20char
ge%20raw%20land%20value%20raffles&f=false
Ong, C. (2013). Developers offer higher commissions to spur property sales. The Straits
Times. Retrieved 24 March 2015, from http://www.straitstimes.com/breaking-
news/money/story/developers-offer-higher-commissions-spur-property-sales-
20131022
Propertylogy. (2013, February 8). 10 Timeless Factor That Affect Property Price.
Propertylogy Magazine. Retrieved from http://www.propertylogy.com/knowledge/10-
timeless-factors-that-affect-property-price/
Rahman, A. (2015, February 27). Private property market 2015: The squeeze tightens further.
Property Guru. Retrieved from http://www.propertyguru.com.sg/property-
management-news/2015/2/85688/private-property-market-2015-the-squeeze-tightens-
Rashiwala, K. (2000, September 1). Sharp hikes in development charge rates a surprise.
Retrieved from http://www.stproperty.sg/articles-property/singapore-property-
news/sharp-hikes-in-development-charge-rates-a-surprise/a/61214
Rashiwala, K. (2015, March 1). Development Charge Rates Up from Today (Modest Rise in
Residential DC rates 'in Line with Softening Home Price'. The Business Times.
Retrieved from http://www.businesstimes.com.sg/top-stories/development-charge-
rates-up-from-today
28
RLB Construction Market Quarterly Update. (2015) (1st ed.). Retrieved 24 March 2015,
from http://rlb.com/wp-content/uploads/2015/01/rlb-singapore-report-december-
2014.pdf
Savills World Research Singapore. (2014). Briefing Residential Sales. Retrieved from
http://pdf.savills.asia/asia-pacific-research/singapore-research/singapore-
residential/singapore-residential-sales-briefing-q4-2014.pdf
Skaburskis, A, & Tomalty, R. (n.d.). The Effects of Property Taxes and Development Cost
Charges on Urban Development: Perspectives of Planners, Developers and Finance
Officers in Toronto and Ottawa*. Retrieved from School of Urban and Regional
Planning Queen’s University website: http://cjrs-rcsr.org/archives/23-
2/Skaburskis.pdf
Slowdown in luxury housing market for H2 2014: CBRE. (2015, March 4). Retrieved March
24 2015, from http://www.channelnewsasia.com/news/business/singapore/slowdown-
in-luxury/1694244.html
Tan, P. J. (2009/2010) The Influence of an MRT Station on Residential Property Value: A
“Timeline” Perspective. (Unpublished undergraduate dissertation) Department of Real
Estate, National University of Singapore, Singapore
Teo, E. (2013, April 13). Condo Units Shrink with Buyer's Budget. The Straits Times.
Retrieved from http://www.propertyguru.com.sg/property-management-
news/2015/2/85688/private-property-market-2015-the-squeeze-tightens-
The Straits Times. (2013, August 21). Prospects for Paya Lebar airbase land
excitedevelopers - Singapore Singapore News & Top Stories - The Straits Times.
Retrieved April 3, 2015, from http://www.straitstimes.com/breaking-
news/singapore/story/prospects-paya-lebar-airbase-land-excite-developers-20130821
Urban Redevelopment Authority. (2013). Draft Master Plan 2013 (Novena). Retrieved from
Urban Redevelopment Authority website: http://www.ura.gov.sg/uol/master-
plan/View-Master-Plan/master-plan-2014/master
plan/~/media/dmp2013/Planning%20Area%20Brochures/Brochure_Novena.ashx
Urban Redevelopment Authority. (2014). Price Indices of Non-Landed Properties by Locality
and Completion Status (Annex A-2). Retrieved from Urban Redevelopment Authority
website: http://www.ura.gov.sg/uol/media-
room/news/2015/jan/~/media/User%20Defined/URA%20Online/media-
room/2015/jan/pr15-03a2.ashx
Wong, K.W. (1996). Planning Proposals And Land Value Change -- A Case Study Of
Singapore Using GIS. Retrieved from:
http://dspace.mit.edu/bitstream/handle/1721.1/70699/35845152.pdf?sequence=1
Xuan, Z. (2006). Accessibility Analysis for Housing Development in Singapore with GIS and
Multi-Criteria Analysis Methods (2). Retrieved from Monash University Australia
website: http://www.epress.monash.edu.au/ag/ag060013.pdf
29
Appendix A: Illustration on Derivation of Residual FHLV
Appendix B: Key Facilities in Affecting the Value of Property Prices
Facilities (Colour) Radius (Km)
Mass Rapid Transit (Purple) 1 Kilometer
Prestigious Primary School (Orange) 1 Kilometer
Shopping Mall (Pink) 0.3 Kilometer
Green Park (Green) 0.3 Kilometer
Body of Water (Blue) 0.3 Kilometer
Industrial Park (Grey) 0.3 Kilometer
1 With reference to Institute of Real Estate Studies (2011), the effective radius of these key
facilities are in accordance to their studies. 2 The colour listed beside the facility is the colour of the circle found in Map X, Y, Z
Appendix C: Amenities Surrounding the Subject Property
30
Appendix D: Transaction Prices of Comparable on Various Unit Types
Appendix E: Calculation of GDV