Embed Size (px)
Citation preview
4
1
2
LEE OVERVIEW
NATIONAL OVERVIEW
SIGNIFICANT TRANSACTIONS
5 NATIONWIDE LEE OFFICES
3 KEY MARKET SNAPSHOTS
Click below. Interactive tabs
Q32015
The Lee Industrial Brief
Lee & Associates Overview1
agentsand growingnationwide
800transaction volume
2014
$10 billionincreasein transaction
volume over 5 years
104%
LOCAL EXPERTISE. NATIONAL REACH. WORLD CLASS.
At Lee & Associates® our reach is national but our expertise is local market implementation. This translates into seamless, consistent execution and value driven market-to-market services.
Our agents understand real estate and accountability. They provide an integrated approach to leasing, operational efficiencies, capital markets, property management, valuation, disposition, development, research and consulting.
We are creative strategists who provide value and custom solutions, enabling our clients to make profitable decisions.
INDUSTRIALOFFICE
RETAILINVESTMENT
MULTI-FAMILYLANDPROPERTY MANAGEMENT
APPRAISAL
FACILITY SERVICESVALUATION & CONSULTING
Eastern Pennsylvania, PA · Columbus, OH · Houston, TX · Denver, CO · Cleveland, OH · Long Island-Queens, NY · Chesapeake Region , MD · Charleston, SC · Edison, NJ · Orlando, FL · Fort Myers, FL · Kansas City, KS · Manhattan, NY · Greenville, SC · Atlanta, GA · Greenwood, IN ·
Indianapolis, IN · Long Beach, CA · Elmwood, NJ · Boise, ID · Palm Desert, CA · Santa Barbara, CA · Antelope Valley, CA · Dallas, TX · Madison, WI · Oakland, CA · Reno, NV · San Diego, CA · Ventura, CA · San Luis Obispo, CA · Southfield, MI · Santa Maria, CA · Calabasas, CA · St. Louis, MO ·
Chicago, IL · Victorville, CA · Temecula Valley, CA · Central LA, CA · Sherman Oaks, CA · West LA, CA · Pleasanton, CA · Stockton, CA · Phoenix, AZ · Carlsbad, CA · Industry, CA · Los Angeles, CA · Riverside, CA · Ontario, CA · Newport Beach, CA · Orange, CA · Irvine, CA
NATIONWIDE LOCATIONS
lee-associates.com 31 LEE OVERVIEW KEY MARKET SNAPSHOTS 5 NATIONWIDE LEE OFFICESNATIONAL OVERVIEW2 4 SIGNIFICANT TRANSACTIONS
lee-associates.com 31 LEE OVERVIEW KEY MARKET SNAPSHOTS 5 NATIONWIDE LEE OFFICESNATIONAL OVERVIEW2 4 SIGNIFICANT TRANSACTIONS
National Economic Overview2
Vaca
ncy
Rate
0%
2%
4%
6%
8%
10%
12%
14%
16%Flex Warehouse Total Market
2000Q4
2001Q4
2002Q4
2003Q4
2004Q4
2005Q4
2006Q4
2007Q4
2008Q4
2009Q4
2010Q4
2011Q4
2012Q4
2013Q4
2014Q4
VACANCY RATES BY BUILDING TYPE 2000-2015
LeasedUn-Leased
Mill
ions
SF
2011 2012 2013 2014 2015
20
40
60
80
100
120
140
160
180
0
RECENT DELIVERIESLEASED & UN-LEASED SF IN DELIVERIES LAST 5 YEARS
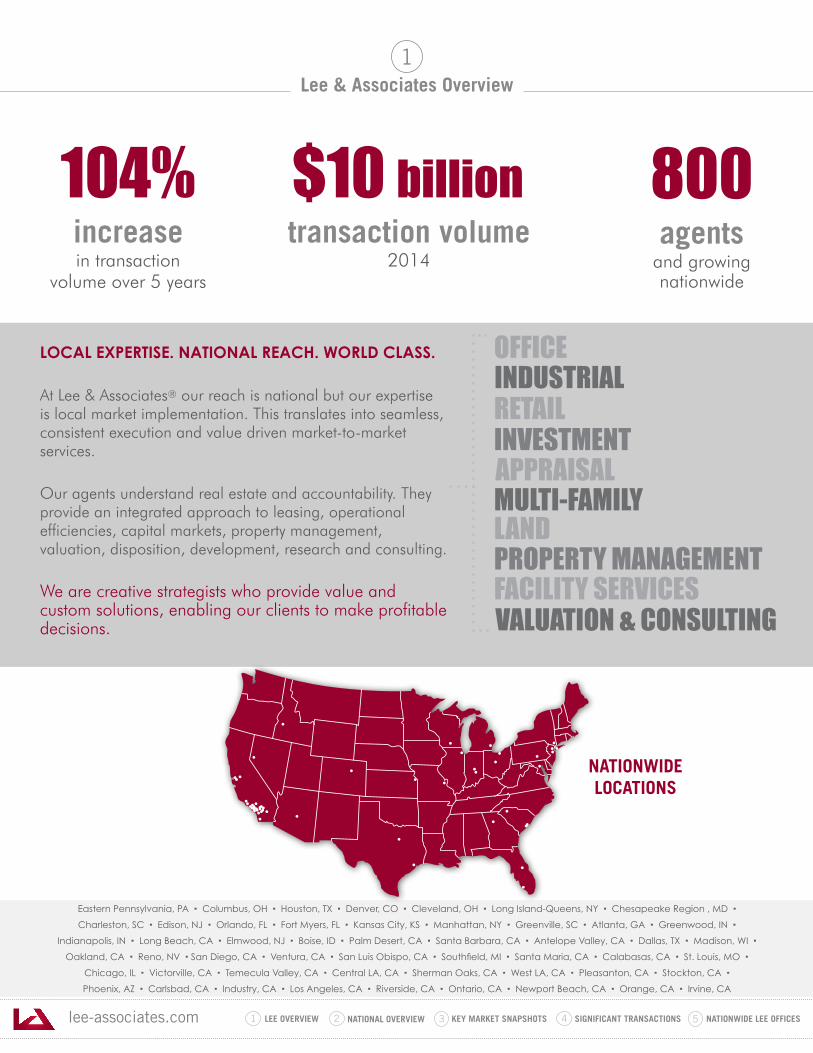
Through the first three quarter of 2015, the US industrial property market continues to perform with amazing consistency. Net absorption, vacancy, average asking rental rates and construction activity all kept moving in the same direction. Large bulk distribution deals continue to dominate market activity across the country and both speculative and build-to-suit development continues. However, that activity is concentrated in markets with greater land availability like Dallas, Chicago, Philadelphia, Phoenix, Atlanta and Southern California’s Inland Empire. Other large markets are running out of land to accommodate inventory growth. In markets like Los Angeles and New York, the danger is in losing base inventory
to the repurposing of older properties. As a result, construction of traditional industrial product in those markets is nominal.
ECONOMICDRIVERS
EMPLOYMENT
GDP GROWTH
WEST MIDWEST
SOUTH
SOUTHWEST
EAST
MONETARY POLICY
SKIP AHEAD TO
MARKET SNAPSHOTS
Click below for info on...
E-COMMERCE AND 3PL DRIVE STRONG DEMAND IN Q3
The national vacancy rate for warehouse and flex space combined fell another 10 basis points in Q3, 6.7%. Since the end of last year, the vacancy rate has fallen by 40 basis points, but several major market areas, including Los Angeles and Orange Counties in Southern California have vacancy rates below 3%.
As a result of vacancy declines across the country, average asking lease rates for Q3 moved up $.06 to $5.63 per square foot. Rents are up across the country, in both primary and secondary
m a r k e t s , but rents in areas with higher levels of construction are seeing the strongest rent gain. Tenants remain willing to pay a premium for first generation space that offers greater efficiency.
New deliveries for both speculative and build-to-suit projects for Q3 hit 59.3 million square feet in 391 buildings. That followed a nearly 51-million-square foot gain in inventory in Q2. The US now touts an industrial property base of 21.44 billion square feet. Another 186.7 million square feet is still under construction, nearly all of that in the bulk distribution category.
10
20
30
40
50
60
70
80
0
PreleasedUn-Leased
Mill
ions
SF
2015Q3
2015Q4
2016Q1
2016Q2
FUTURE DELIVERIESPRELEASED & UN-LEASED SF IN PROPERTIES SCHEDULED TO DELIVER
lee-associates.com 31 LEE OVERVIEW KEY MARKET SNAPSHOTS 5 NATIONWIDE LEE OFFICESNATIONAL OVERVIEW2 4 SIGNIFICANT TRANSACTIONS
National Economic Overview2
40
60
50
30
20
0
10
Mill
ions
SF
70
2014Q4
2014Q3
2014Q2
51.1
68.569.4
2015Q1
40.7
2015Q2
56.2
2015Q3
57.8
80
NET ABSORPTION
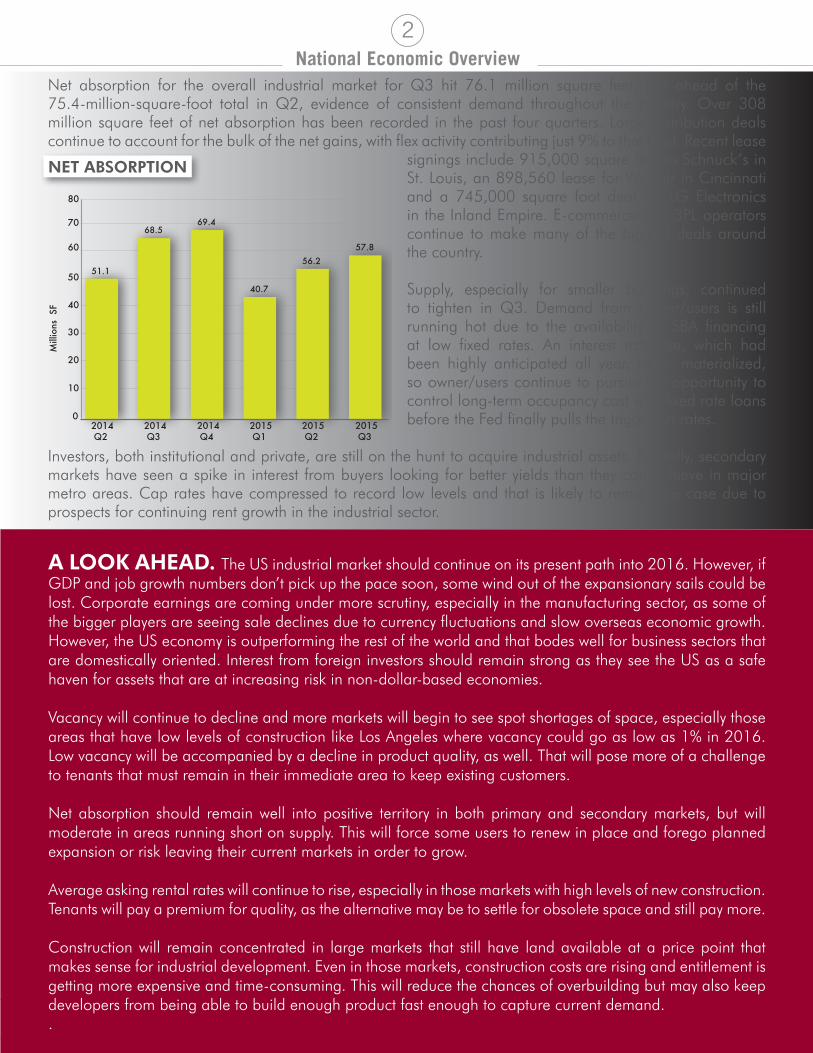
A LOOK AHEAD. The US industrial market should continue on its present path into 2016. However, if GDP and job growth numbers don’t pick up the pace soon, some wind out of the expansionary sails could be lost. Corporate earnings are coming under more scrutiny, especially in the manufacturing sector, as some of the bigger players are seeing sale declines due to currency fluctuations and slow overseas economic growth. However, the US economy is outperforming the rest of the world and that bodes well for business sectors that are domestically oriented. Interest from foreign investors should remain strong as they see the US as a safe haven for assets that are at increasing risk in non-dollar-based economies.
Vacancy will continue to decline and more markets will begin to see spot shortages of space, especially those areas that have low levels of construction like Los Angeles where vacancy could go as low as 1% in 2016. Low vacancy will be accompanied by a decline in product quality, as well. That will pose more of a challenge to tenants that must remain in their immediate area to keep existing customers.
Net absorption should remain well into positive territory in both primary and secondary markets, but will moderate in areas running short on supply. This will force some users to renew in place and forego planned expansion or risk leaving their current markets in order to grow.
Average asking rental rates will continue to rise, especially in those markets with high levels of new construction. Tenants will pay a premium for quality, as the alternative may be to settle for obsolete space and still pay more.
Construction will remain concentrated in large markets that still have land available at a price point that makes sense for industrial development. Even in those markets, construction costs are rising and entitlement is getting more expensive and time-consuming. This will reduce the chances of overbuilding but may also keep developers from being able to build enough product fast enough to capture current demand. .
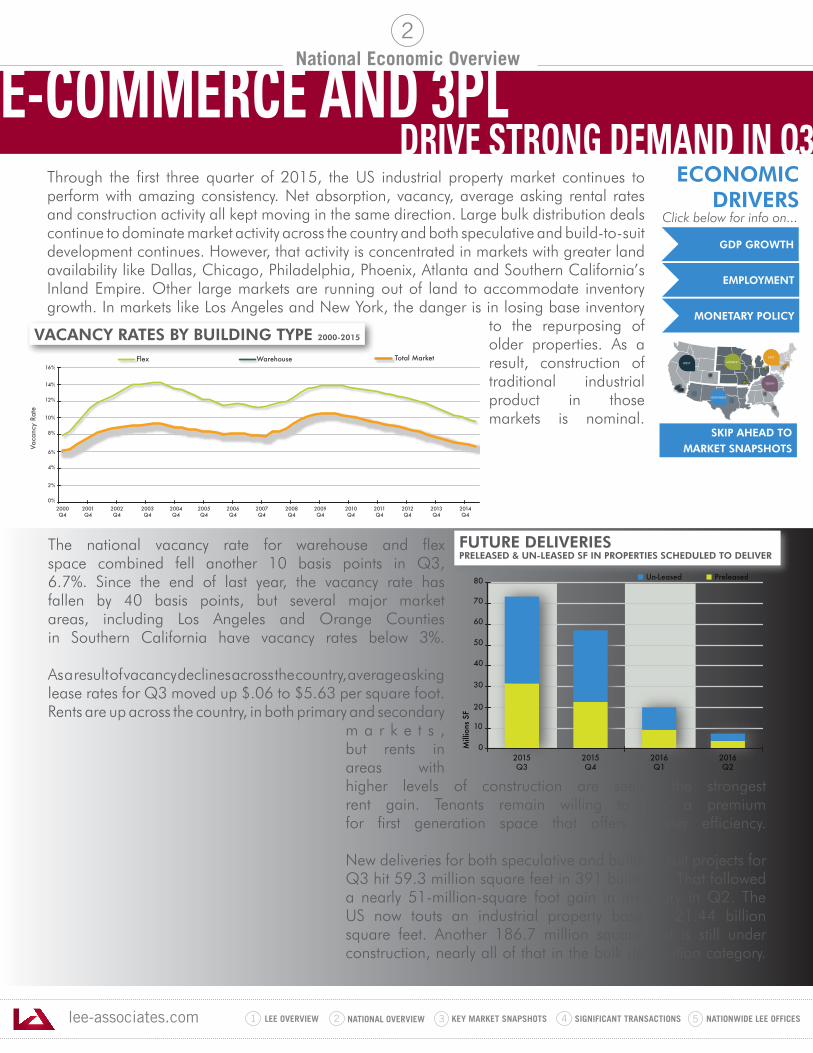
Net absorption for the overall industrial market for Q3 hit 76.1 million square feet, just ahead of the 75.4-million-square-foot total in Q2, evidence of consistent demand throughout the country. Over 308 million square feet of net absorption has been recorded in the past four quarters. Large distribution deals continue to account for the bulk of the net gains, with flex activity contributing just 9% to that total. Recent lease
signings include 915,000 square feet to Schnuck’s in St. Louis, an 898,560 lease for Wayfair in Cincinnati and a 745,000 square foot deal for LG Electronics in the Inland Empire. E-commerce and 3PL operators continue to make many of the biggest deals around the country.
Supply, especially for smaller buildings, continued to tighten in Q3. Demand from owner/users is still running hot due to the availability of SBA financing at low fixed rates. An interest rate rise, which had been highly anticipated all year, never materialized, so owner/users continue to pursue the opportunity to control long-term occupancy cost with fixed rate loans before the Fed finally pulls the trigger on rates.
Investors, both institutional and private, are still on the hunt to acquire industrial assets. Recently, secondary markets have seen a spike in interest from buyers looking for better yields than they can achieve in major metro areas. Cap rates have compressed to record low levels and that is likely to remain the case due to prospects for continuing rent growth in the industrial sector.
lee-associates.com 31 LEE OVERVIEW KEY MARKET SNAPSHOTS 5 NATIONWIDE LEE OFFICESNATIONAL OVERVIEW2 4 SIGNIFICANT TRANSACTIONS
National Economic Overview2
2.70%
1.80%
4.50%
3.50%
-2.10%
4.60%5.00%
2.20%
-0.20%
3.70%
1.50%
-4.00%
-2.00%
0.00%
2.00%
4.00%
6.00%
2013Q1
2013Q2
2013Q3
2013Q4
2014Q1
2014Q2
2014Q3
2014Q4
2015Q1
2015Q2
2015Q3
QUARTER-TO-QUARTER GROWTH IN REAL GDP
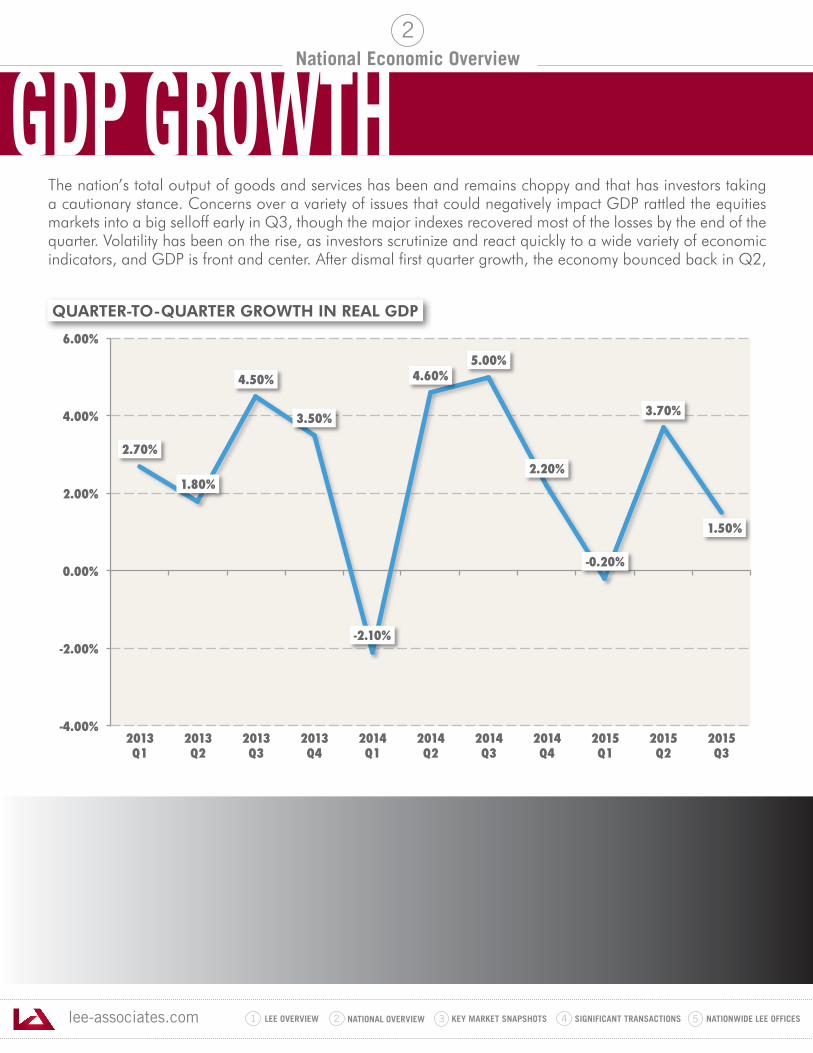
The nation’s total output of goods and services has been and remains choppy and that has investors taking a cautionary stance. Concerns over a variety of issues that could negatively impact GDP rattled the equities markets into a big selloff early in Q3, though the major indexes recovered most of the losses by the end of the quarter. Volatility has been on the rise, as investors scrutinize and react quickly to a wide variety of economic indicators, and GDP is front and center. After dismal first quarter growth, the economy bounced back in Q2,
much as it did for the same period in 2014. But that bounce was not as big as it was last year, and the first estimate for Q3 of 2015, released on October 29th, came in at just 1.5%, well below the 5.0% rise in US output we saw in Q3 of 2014. There is just no denying that the economy is still struggling to keep momentum. Consumer spending, which accounts for roughly 70% of GDP, did improve in Q3, but not enough to offset a drastic drop in inventories, which were less than half of the total reported last quarter. Exports fell in Q3, which is no surprise given the strength of the US Dollar against the world’s other currencies. US goods are services are more expensive abroad and conversely, goods imported to the US are getting cheaper. The most recent report on import prices showed a 1.3% decline. Yet, despite lower prices, imports also fell in Q3, neutralizing the effect of lower exports on GDP performance.
GDP GROWTH
lee-associates.com 31 LEE OVERVIEW KEY MARKET SNAPSHOTS 5 NATIONWIDE LEE OFFICESNATIONAL OVERVIEW2 4 SIGNIFICANT TRANSACTIONS
National Economic Overview2
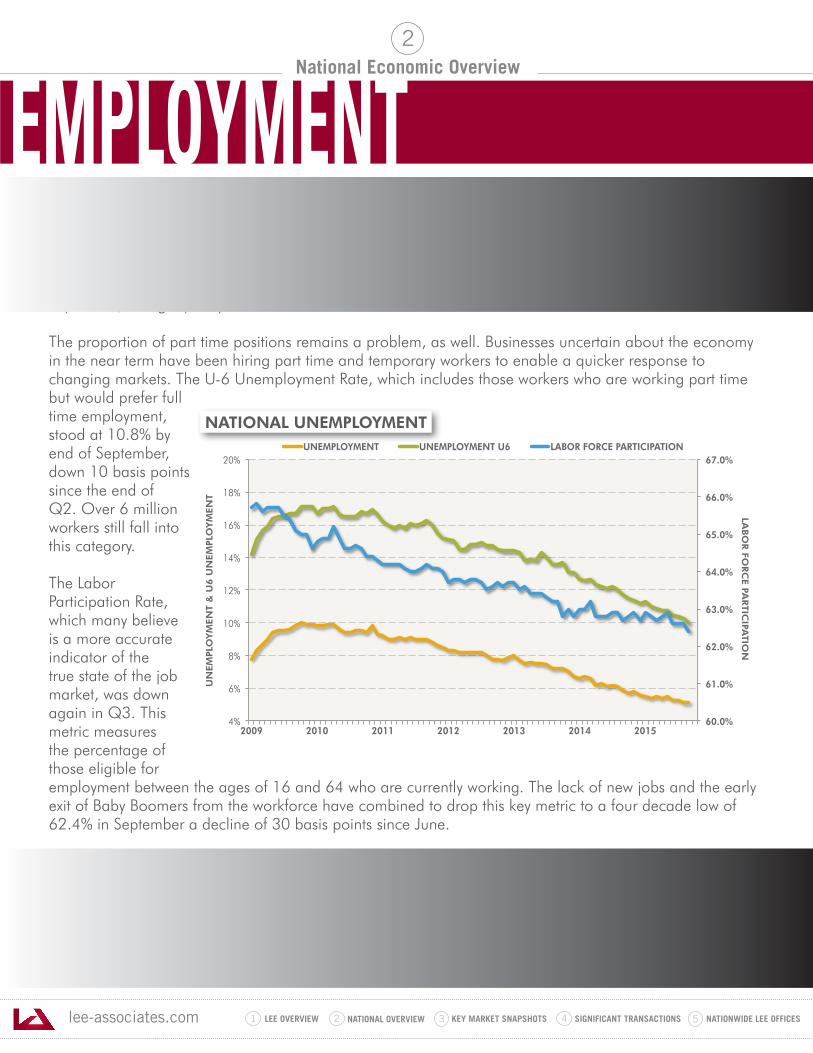
Through the first half of the year, the news regarding job creation was looking good, with the US adding an average of well over 200,000 jobs per month. Unfortunately, August’s total dipped to 136,000 and September came in at just 142,000. The dip was largely unexpected and it has wary investors wondering whether or not the recovery will stall out. The unemployment rate held steady at 5.1% in September and the number of unemployed persons was little changed at 7.9 million. The biggest job gains were seen in the healthcare, information and business services sectors. However, changes wages remained stagnant in September, losing a penny to $25.09.
The proportion of part time positions remains a problem, as well. Businesses uncertain about the economy in the near term have been hiring part time and temporary workers to enable a quicker response to changing markets. The U-6 Unemployment Rate, which includes those workers who are working part time but would prefer full time employment, stood at 10.8% by end of September, down 10 basis points since the end of Q2. Over 6 million workers still fall into this category.
The Labor Participation Rate, which many believe is a more accurate indicator of the true state of the job market, was down again in Q3. This metric measures the percentage of those eligible for employment between the ages of 16 and 64 who are currently working. The lack of new jobs and the early exit of Baby Boomers from the workforce have combined to drop this key metric to a four decade low of 62.4% in September a decline of 30 basis points since June.
Wage growth has become a growing concern over the past year. Even though, net job gains have lowered the unemployment rate to a post-recession low of 5.1%, wage growth has been stagnant, barely keeping pace with the rise in the consumer price index. This is largely due to the mix of jobs being created and too many of them have been in lower-paying categories. Sluggish wage growth is directly related to lackluster consumer spending, the main driver of GDP. Many of the jobs are in hospitality, retail and restaurant service, which can disappear just as quickly as they appear. Also, there have been substantial layoffs in the energy sector, which, until early this year, had been a main source of full-time, higher-paying positions.
60.0%
61.0%
62.0%
63.0%
64.0%
65.0%
66.0%
67.0%
4%
6%
8%
10%
12%
14%
16%
18%
20%
2009 2010 2011 2012 2013 2014 2015
LABO
R FO
RC
E PA
RTIC
IPATIO
N
UN
EM
PLO
YM
EN
T &
U6 U
NEM
PLO
YM
EN
T
UNEMPLOYMENT UNEMPLOYMENT U6 LABOR FORCE PARTICIPATION
NATIONAL UNEMPLOYMENT
EMPLOYMENT

lee-associates.com 31 LEE OVERVIEW KEY MARKET SNAPSHOTS 5 NATIONWIDE LEE OFFICESNATIONAL OVERVIEW2 4 SIGNIFICANT TRANSACTIONS
National Economic Overview2
Fed Chairperson, Janet Yellen and her Board of Governors, have been repeatedly threatening to raise interests rates to signal a reversal of the Fed’s aggressive efforts to stimulate economic growth. Yet, they have failed to do so, citing one economic indicator or another for sticking with the status quo and frustrating investors who are looking for guidance on how to move forward. While most experts were sure that the first rate hike would come in September, the Fed, citing concerns over China and other emerging market economies, held off yet again. Now many of those same experts are not forecasting a move on rates until next year.
Until recently, the Fed was focused mainly on unemployment rate and inflation targets to trigger action. But now, global economic issues and wage growth concerns are entering into the mix. With so many variables figuring into the equation, predicting Fed actions are becoming even more difficult. So, savers continue to be pounded and yields in other asset classes remain at record low levels.
Real estate borrowers continue to be major beneficiaries of the current Fed stance. Long term financing is still cheap and that has fueled intense demand to acquire commercial real estate. Low rates have also contributed to cap rate compression in primary and secondary markets from coast to coast. That has raised concerns with some investors that cap rates will decompress when rates finally do move up. Even a nominal increase in cap rates could lead to a significant reduction in property values.
The yield on 10-Year Treasuries has also remained low due to the current interest rate environment’s impact on yields across all asset classes. In Q3, the yield on the 10-Year moved back down into the low 2% range after moving higher earlier in the year. Many attribute that change, in large part, to an increase in foreign investor demand precipitated by shaky economic conditions around the globe.
MONETARY POLICY
2.42% 2.42%
2.36%
2.22%
2.12%
1.68%
2.08%
1.87%
2.12%
2.19%
2.43%
2.16% 2.17%
2.05%
1.50%
1.70%
1.90%
2.10%
2.30%
2.50%
2.70%
Augus
t-14
Sept
embe
r-14
Octo
ber-1
4
Novem
ber-1
4
Decem
ber-1
4
Janu
ary-
15
Febr
uary
-15
Mar
ch-1
5
April-
15
May
-15
June
-15
July-
15
Augus
t-15
Sept
embe
r-15
TEN YEAR US TREASURY YIELDIN PERCENTAGE
lee-associates.com 31 LEE OVERVIEW KEY MARKET SNAPSHOTS 5 NATIONWIDE LEE OFFICESNATIONAL OVERVIEW2 4 SIGNIFICANT TRANSACTIONS
Key Market Snapshots3
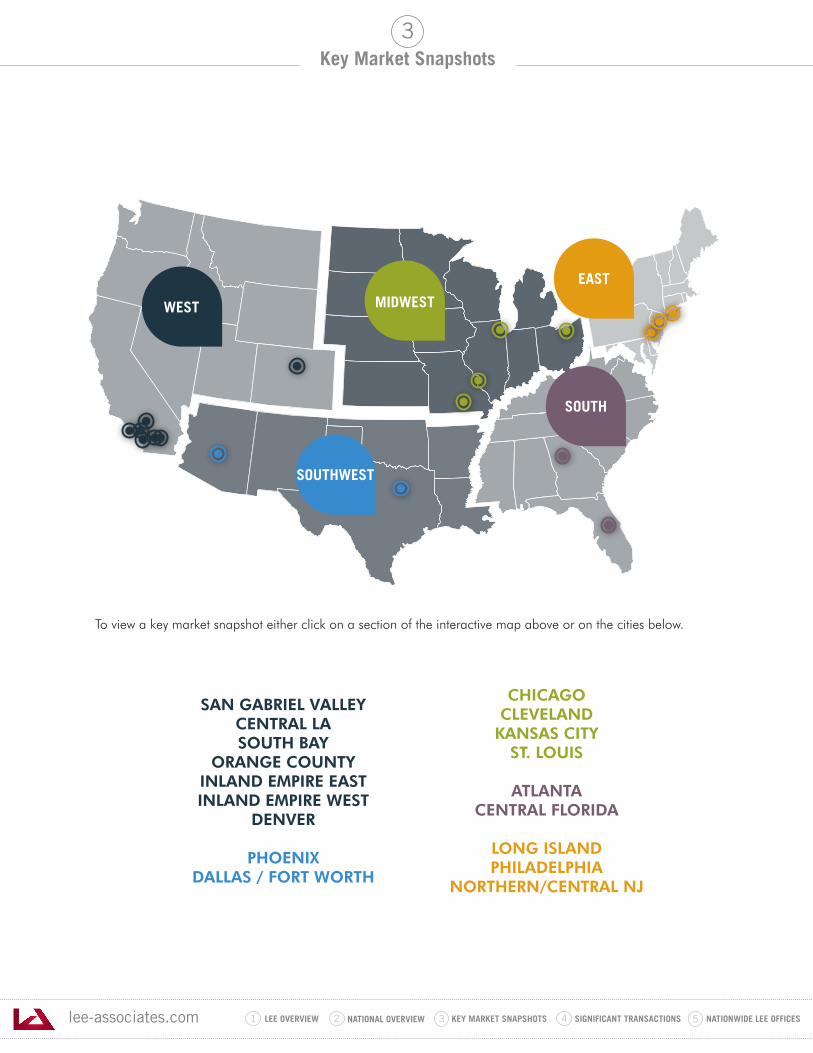
To view a key market snapshot either click on a section of the interactive map above or on the cities below.
SAN GABRIEL VALLEYCENTRAL LASOUTH BAY
ORANGE COUNTYINLAND EMPIRE EASTINLAND EMPIRE WEST
DENVER
PHOENIXDALLAS / FORT WORTH
CHICAGOCLEVELAND
KANSAS CITYST. LOUIS
ATLANTACENTRAL FLORIDA
LONG ISLANDPHILADELPHIA
NORTHERN/CENTRAL NJ
WEST MIDWEST
SOUTH
SOUTHWEST
EAST
lee-associates.com 31 LEE OVERVIEW KEY MARKET SNAPSHOTS 5 NATIONWIDE LEE OFFICESNATIONAL OVERVIEW2 4 SIGNIFICANT TRANSACTIONS
Key Market Snapshots
TRENDING NOW
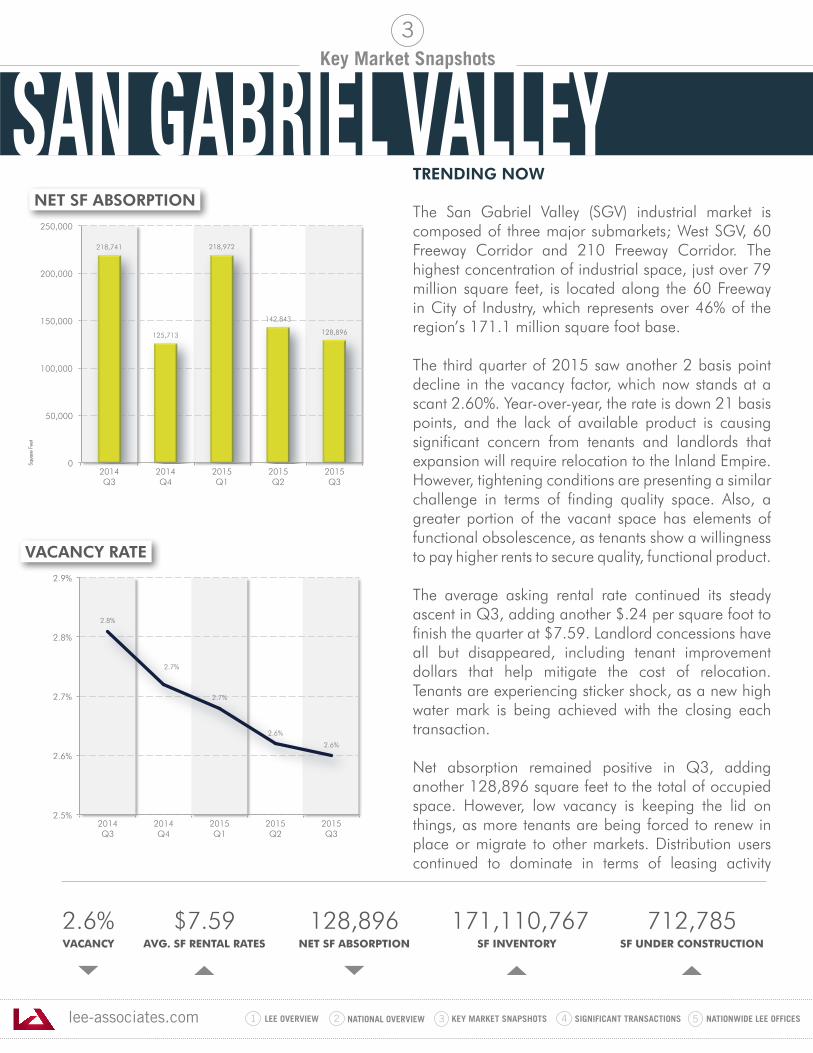
The San Gabriel Valley (SGV) industrial market is composed of three major submarkets; West SGV, 60 Freeway Corridor and 210 Freeway Corridor. The highest concentration of industrial space, just over 79 million square feet, is located along the 60 Freeway in City of Industry, which represents over 46% of the region’s 171.1 million square foot base.
The third quarter of 2015 saw another 2 basis point decline in the vacancy factor, which now stands at a scant 2.60%. Year-over-year, the rate is down 21 basis points, and the lack of available product is causing significant concern from tenants and landlords that expansion will require relocation to the Inland Empire. However, tightening conditions are presenting a similar challenge in terms of finding quality space. Also, a greater portion of the vacant space has elements of functional obsolescence, as tenants show a willingness to pay higher rents to secure quality, functional product.
The average asking rental rate continued its steady ascent in Q3, adding another $.24 per square foot to finish the quarter at $7.59. Landlord concessions have all but disappeared, including tenant improvement dollars that help mitigate the cost of relocation. Tenants are experiencing sticker shock, as a new high water mark is being achieved with the closing each transaction.
Net absorption remained positive in Q3, adding another 128,896 square feet to the total of occupied space. However, low vacancy is keeping the lid on things, as more tenants are being forced to renew in place or migrate to other markets. Distribution users continued to dominate in terms of leasing activity
2.6%VACANCY
$7.59AVG. SF RENTAL RATES
128,896NET SF ABSORPTION
171,110,767 SF INVENTORY
712,785SF UNDER CONSTRUCTION
3
218,741
125,713
218,972
142,843
128,896
0
50,000
100,000
150,000
200,000
250,000
2014 Q3
2014 Q4
2015 Q1
2015 Q2
2015 Q3
Squa
re F
eet
2.8%
2.7%
2.7%
2.6%
2.6%
2.5%
2.6%
2.7%
2.8%
2.9%
2014 Q3
2014 Q4
2015 Q1
2015 Q2
2015 Q3
NET SF ABSORPTION
VACANCY RATE
SAN GABRIEL VALLEY
lee-associates.com 31 LEE OVERVIEW KEY MARKET SNAPSHOTS 5 NATIONWIDE LEE OFFICESNATIONAL OVERVIEW2 4 SIGNIFICANT TRANSACTIONS
Key Market Snapshots
SAN GABRIEL VALLEY - TRENDING NOW(continued)
3
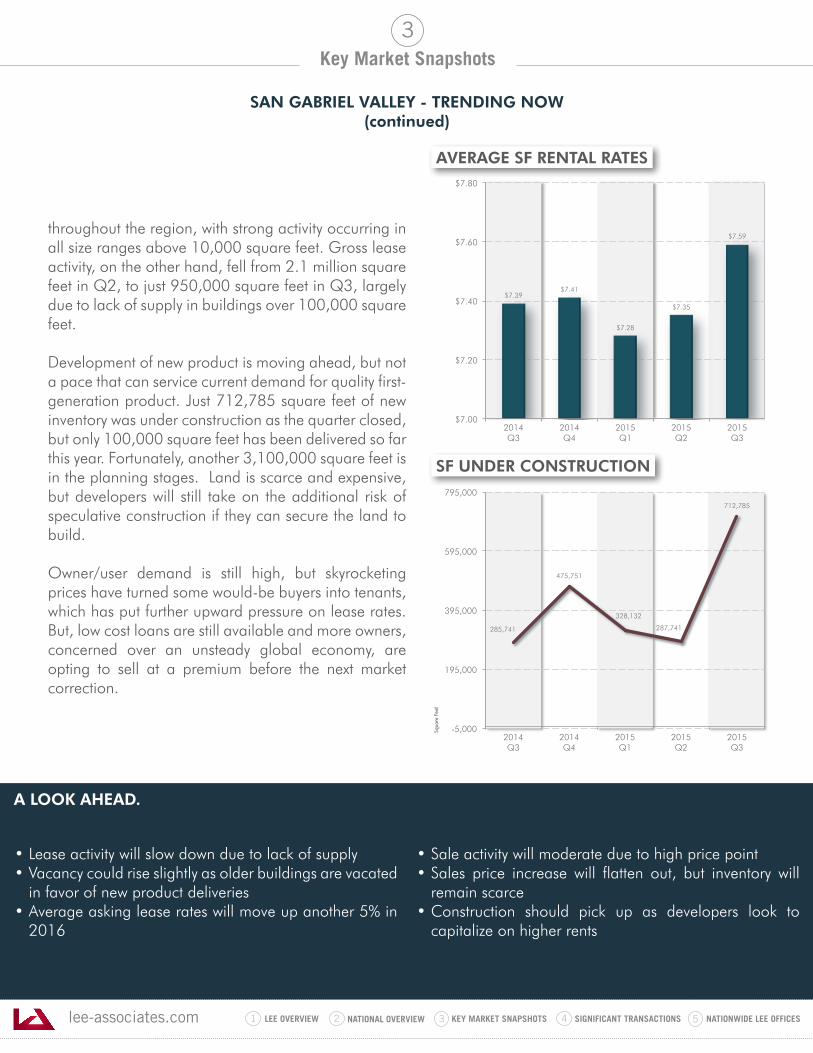
throughout the region, with strong activity occurring in all size ranges above 10,000 square feet. Gross lease activity, on the other hand, fell from 2.1 million square feet in Q2, to just 950,000 square feet in Q3, largely due to lack of supply in buildings over 100,000 square feet.
Development of new product is moving ahead, but not a pace that can service current demand for quality first-generation product. Just 712,785 square feet of new inventory was under construction as the quarter closed, but only 100,000 square feet has been delivered so far this year. Fortunately, another 3,100,000 square feet is in the planning stages. Land is scarce and expensive, but developers will still take on the additional risk of speculative construction if they can secure the land to build.
Owner/user demand is still high, but skyrocketing prices have turned some would-be buyers into tenants, which has put further upward pressure on lease rates. But, low cost loans are still available and more owners, concerned over an unsteady global economy, are opting to sell at a premium before the next market correction.
• Lease activity will slow down due to lack of supply • Vacancy could rise slightly as older buildings are vacated
in favor of new product deliveries• Average asking lease rates will move up another 5% in
2016
• Sale activity will moderate due to high price point• Sales price increase will flatten out, but inventory will
remain scarce• Construction should pick up as developers look to
capitalize on higher rents
$7.39 $7.41
$7.28
$7.35
$7.59
$7.00
$7.20
$7.40
$7.60
$7.80
2014 Q3
2014 Q4
2015 Q1
2015 Q2
2015 Q3
285,741
475,751
328,132
287,741
712,785
-5,000
195,000
395,000
595,000
795,000
2014 Q3
2014 Q4
2015 Q1
2015 Q2
2015 Q3
Squa
re F
eet
SF UNDER CONSTRUCTION
AVERAGE SF RENTAL RATES
A LOOK AHEAD.
lee-associates.com 31 LEE OVERVIEW KEY MARKET SNAPSHOTS 5 NATIONWIDE LEE OFFICESNATIONAL OVERVIEW2 4 SIGNIFICANT TRANSACTIONS
Key Market Snapshots
TRENDING NOW
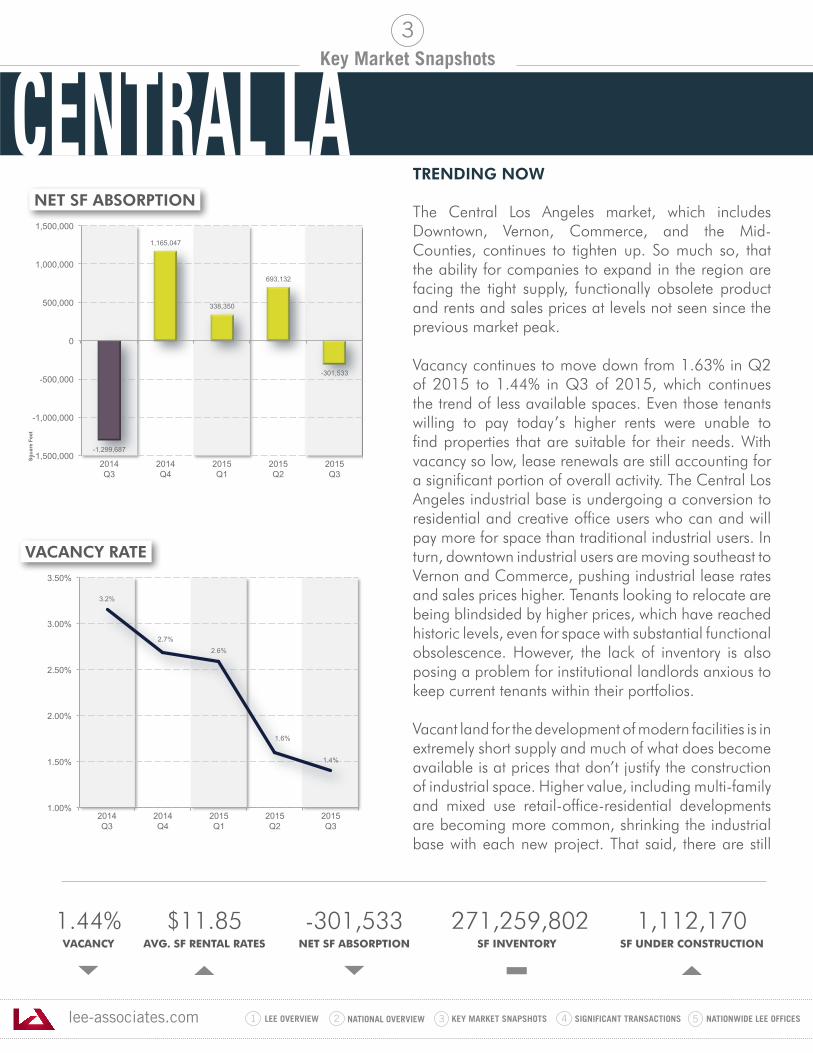
The Central Los Angeles market, which includes Downtown, Vernon, Commerce, and the Mid-Counties, continues to tighten up. So much so, that the ability for companies to expand in the region are facing the tight supply, functionally obsolete product and rents and sales prices at levels not seen since the previous market peak.
Vacancy continues to move down from 1.63% in Q2 of 2015 to 1.44% in Q3 of 2015, which continues the trend of less available spaces. Even those tenants willing to pay today’s higher rents were unable to find properties that are suitable for their needs. With vacancy so low, lease renewals are still accounting for a significant portion of overall activity. The Central Los Angeles industrial base is undergoing a conversion to residential and creative office users who can and will pay more for space than traditional industrial users. In turn, downtown industrial users are moving southeast to Vernon and Commerce, pushing industrial lease rates and sales prices higher. Tenants looking to relocate are being blindsided by higher prices, which have reached historic levels, even for space with substantial functional obsolescence. However, the lack of inventory is also posing a problem for institutional landlords anxious to keep current tenants within their portfolios.
Vacant land for the development of modern facilities is in extremely short supply and much of what does become available is at prices that don’t justify the construction of industrial space. Higher value, including multi-family and mixed use retail-office-residential developments are becoming more common, shrinking the industrial base with each new project. That said, there are still
1.44%VACANCY
$11.85AVG. SF RENTAL RATES
-301,533NET SF ABSORPTION
271,259,802 SF INVENTORY
1,112,170SF UNDER CONSTRUCTION
3
-1,299,687
1,165,047
338,350
693,132
-301,533
-1,500,000
-1,000,000
-500,000
0
500,000
1,000,000
1,500,000
2014 Q3
2014 Q4
2015 Q1
2015 Q2
2015 Q3
Squa
re F
eet
3.2%
2.7% 2.6%
1.6%
1.4%
1.00%
1.50%
2.00%
2.50%
3.00%
3.50%
2014 Q3
2014 Q4
2015 Q1
2015 Q2
2015 Q3
NET SF ABSORPTION
VACANCY RATE
CENTRAL LA
lee-associates.com 31 LEE OVERVIEW KEY MARKET SNAPSHOTS 5 NATIONWIDE LEE OFFICESNATIONAL OVERVIEW2 4 SIGNIFICANT TRANSACTIONS
Key Market Snapshots
CENTRAL LA - TRENDING NOW(continued)
3
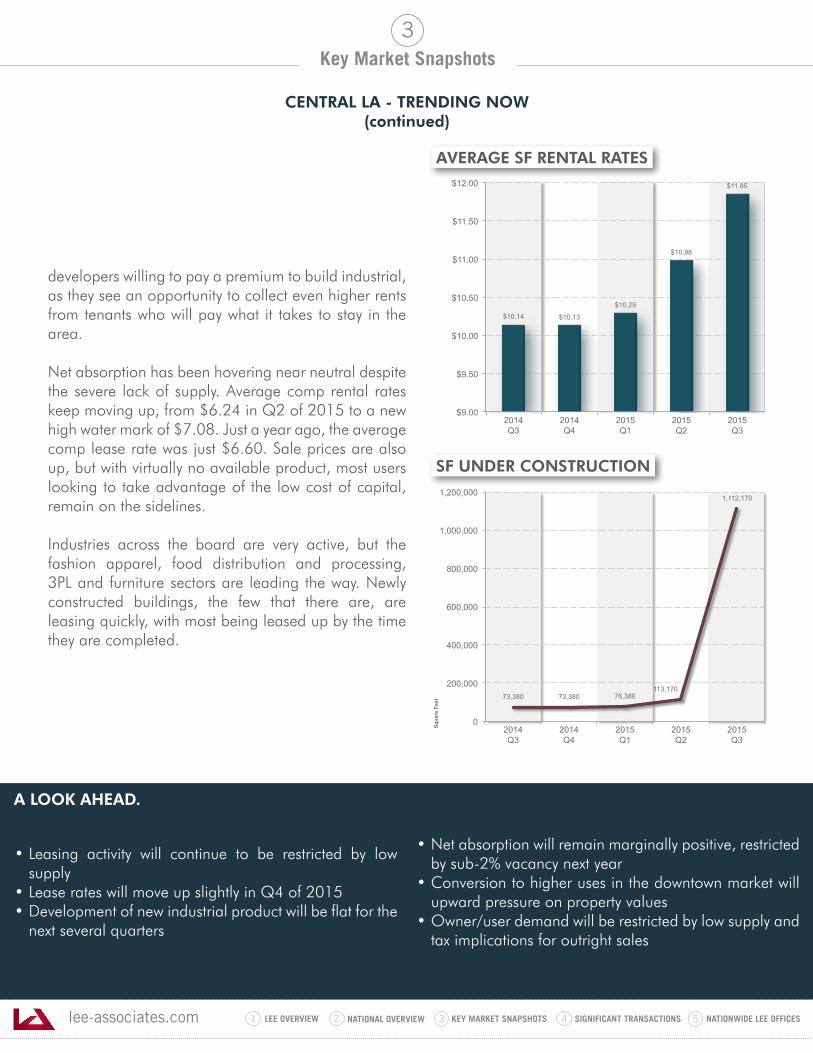
developers willing to pay a premium to build industrial, as they see an opportunity to collect even higher rents from tenants who will pay what it takes to stay in the area.
Net absorption has been hovering near neutral despite the severe lack of supply. Average comp rental rates keep moving up, from $6.24 in Q2 of 2015 to a new high water mark of $7.08. Just a year ago, the average comp lease rate was just $6.60. Sale prices are also up, but with virtually no available product, most users looking to take advantage of the low cost of capital, remain on the sidelines.
Industries across the board are very active, but the fashion apparel, food distribution and processing, 3PL and furniture sectors are leading the way. Newly constructed buildings, the few that there are, are leasing quickly, with most being leased up by the time they are completed.
• Leasing activity will continue to be restricted by low supply
• Lease rates will move up slightly in Q4 of 2015• Development of new industrial product will be flat for the
next several quarters
• Net absorption will remain marginally positive, restricted by sub-2% vacancy next year
• Conversion to higher uses in the downtown market will upward pressure on property values
• Owner/user demand will be restricted by low supply and tax implications for outright sales
$10.14 $10.13
$10.29
$10.98
$11.85
$9.00
$9.50
$10.00
$10.50
$11.00
$11.50
$12.00
2014 Q3
2014 Q4
2015 Q1
2015 Q2
2015 Q3
73,380 73,380 76,380 113,170
1,112,170
0
200,000
400,000
600,000
800,000
1,000,000
1,200,000
2014 Q3
2014 Q4
2015 Q1
2015 Q2
2015 Q3
Squa
re F
eet
SF UNDER CONSTRUCTION
AVERAGE SF RENTAL RATES
A LOOK AHEAD.
lee-associates.com 31 LEE OVERVIEW KEY MARKET SNAPSHOTS 5 NATIONWIDE LEE OFFICESNATIONAL OVERVIEW2 4 SIGNIFICANT TRANSACTIONS
Key Market Snapshots
TRENDING NOW
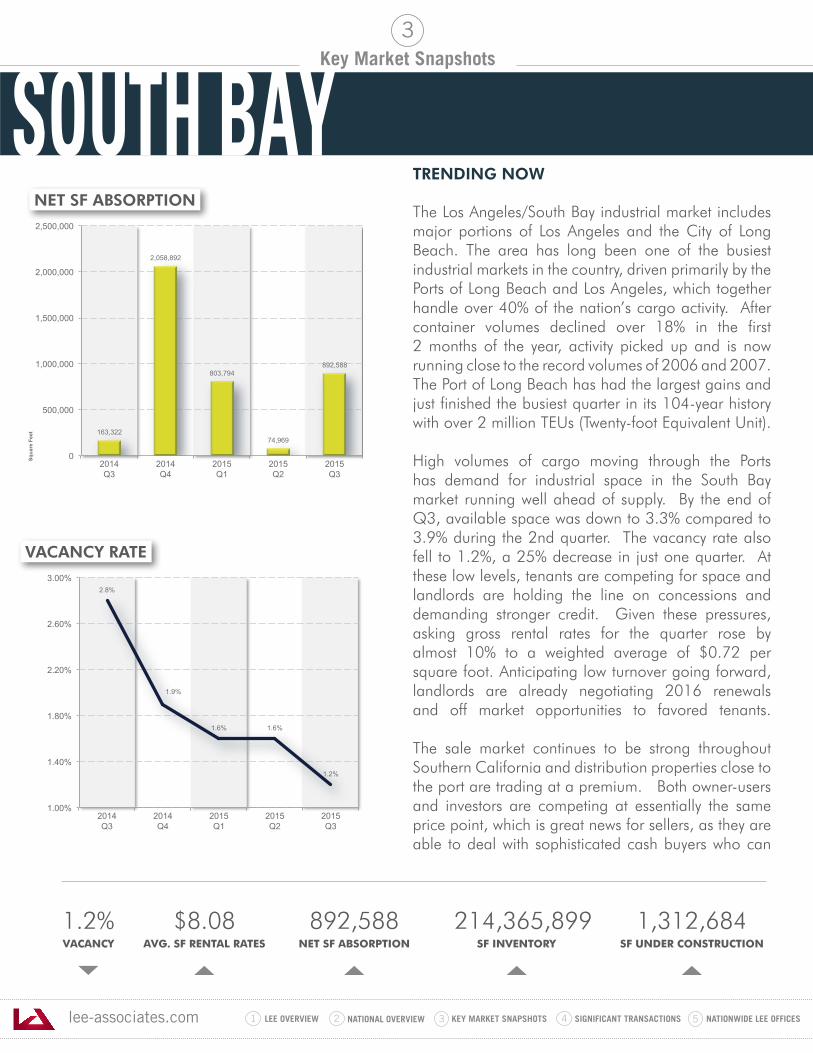
The Los Angeles/South Bay industrial market includes major portions of Los Angeles and the City of Long Beach. The area has long been one of the busiest industrial markets in the country, driven primarily by the Ports of Long Beach and Los Angeles, which together handle over 40% of the nation’s cargo activity. After container volumes declined over 18% in the first 2 months of the year, activity picked up and is now running close to the record volumes of 2006 and 2007. The Port of Long Beach has had the largest gains and just finished the busiest quarter in its 104-year history with over 2 million TEUs (Twenty-foot Equivalent Unit).
High volumes of cargo moving through the Ports has demand for industrial space in the South Bay market running well ahead of supply. By the end of Q3, available space was down to 3.3% compared to 3.9% during the 2nd quarter. The vacancy rate also fell to 1.2%, a 25% decrease in just one quarter. At these low levels, tenants are competing for space and landlords are holding the line on concessions and demanding stronger credit. Given these pressures, asking gross rental rates for the quarter rose by almost 10% to a weighted average of $0.72 per square foot. Anticipating low turnover going forward, landlords are already negotiating 2016 renewals and off market opportunities to favored tenants.
The sale market continues to be strong throughout Southern California and distribution properties close to the port are trading at a premium. Both owner-users and investors are competing at essentially the same price point, which is great news for sellers, as they are able to deal with sophisticated cash buyers who can
1.2%VACANCY
$8.08AVG. SF RENTAL RATES
892,588NET SF ABSORPTION
214,365,899SF INVENTORY
1,312,684SF UNDER CONSTRUCTION
3
163,322
2,058,892
803,794
74,969
892,588
0
500,000
1,000,000
1,500,000
2,000,000
2,500,000
2014 Q3
2014 Q4
2015 Q1
2015 Q2
2015 Q3
Squa
re F
eet
2.8%
1.9%
1.6% 1.6%
1.2%
1.00%
1.40%
1.80%
2.20%
2.60%
3.00%
2014 Q3
2014 Q4
2015 Q1
2015 Q2
2015 Q3
NET SF ABSORPTION
VACANCY RATE
SOUTH BAY

lee-associates.com 31 LEE OVERVIEW KEY MARKET SNAPSHOTS 5 NATIONWIDE LEE OFFICESNATIONAL OVERVIEW2 4 SIGNIFICANT TRANSACTIONS
Key Market Snapshots
SOUTH BAY - TRENDING NOW(continued)
3
close faster than user/buyers who require financing. The average sales price for a facility over 25,000 square feet is 125.77 while the cap rate for an investor are trending in the mid to low 4% range depending on the asset type and credit of the tenant. These Institutional buyers are making things even more competitive by lowering their minimum transaction threshold to well under $10 Million to acquire industrial buildings in infill markets.
Developers are actively pursuing the few remaining land sites in the region as well as locations that can be redeveloped for warehouse use or less capital intensive uses like truck and container parking. Unfortunately, many of the remaining undeveloped sites in the South Bay are contaminated, which poses a significant barrier to new construction. Also, the entitlement process is complicated by the fact that some cities prefer uses that are not transportation related. Even with those challenges, there is approximately 3,000,000 square feet of new Industrial space in the planning stages or under construction that should be ready by 2017. While this may be well short of the scope of development compared to the Inland Empire and other high growth markets, it represents the South Bay’s largest amount of new industrial inventory in over 15 years.
• Property demand is expected to continue into 2016.• Availability and vacancy will remain low and lease rates
will continue to rise• Owners are approaching tenants earlier on renewals• Property prices for owner/user and investors will continue
to increase, especially for Class A product• With the lack of available product in the South Bay, some
companies will be forced to move further east
• Older product is being redeveloped into more functional product
• Cities have become a bigger obstacle as they move to down-zone industrial properties, issue overlays or require conditional use permits
• The possibility of two NFL teams coming to the South Bay could add new users to the market.
• The inevitability of the Trans Pacific Partnership (TPP) will likely increase port activity
$7.45
$7.82
$8.08
$8.03
$8.08
$7.40
$7.60
$7.80
$8.00
$8.20
2014 Q3
2014 Q4
2015 Q1
2015 Q2
2015 Q3
629,509
266,016 266,016
1,272,947 1,312,684
0
400,000
800,000
1,200,000
1,600,000
2014 Q3
2014 Q4
2015 Q1
2015 Q2
2015 Q3
Squa
re F
eet
SF UNDER CONSTRUCTION
AVERAGE SF RENTAL RATES
A LOOK AHEAD.
lee-associates.com 31 LEE OVERVIEW KEY MARKET SNAPSHOTS 5 NATIONWIDE LEE OFFICESNATIONAL OVERVIEW2 4 SIGNIFICANT TRANSACTIONS
Key Market Snapshots
TRENDING NOW
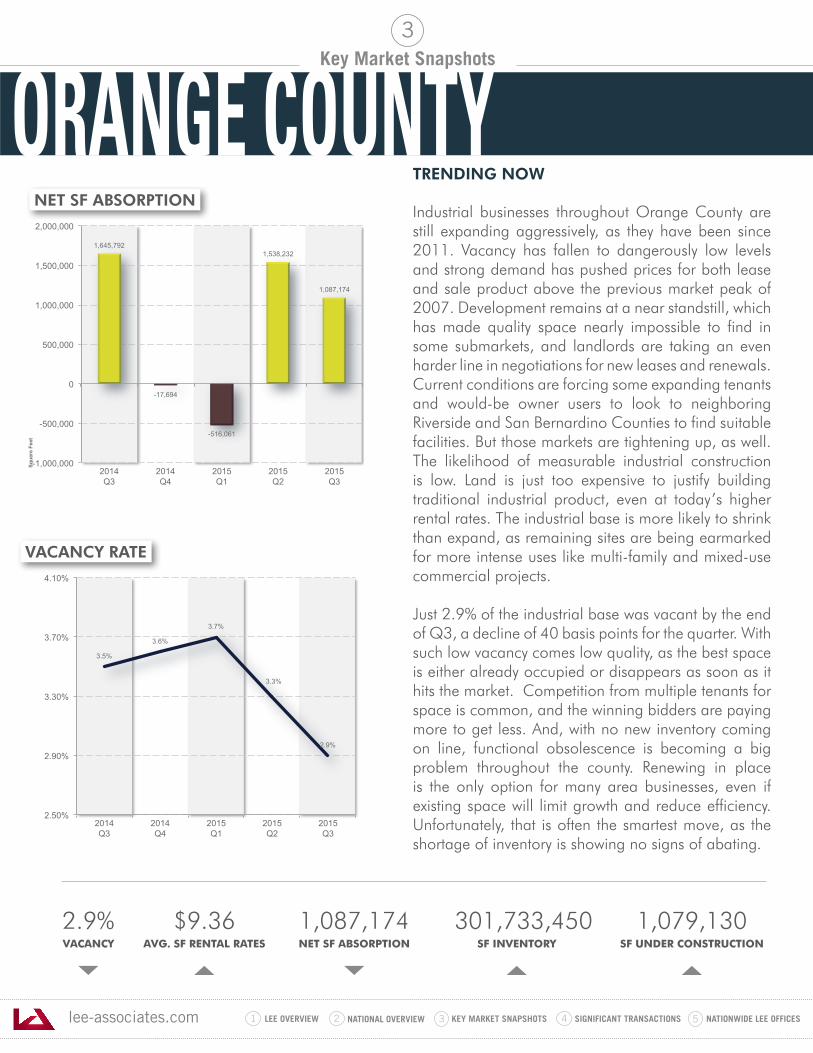
Industrial businesses throughout Orange County are still expanding aggressively, as they have been since 2011. Vacancy has fallen to dangerously low levels and strong demand has pushed prices for both lease and sale product above the previous market peak of 2007. Development remains at a near standstill, which has made quality space nearly impossible to find in some submarkets, and landlords are taking an even harder line in negotiations for new leases and renewals. Current conditions are forcing some expanding tenants and would-be owner users to look to neighboring Riverside and San Bernardino Counties to find suitable facilities. But those markets are tightening up, as well. The likelihood of measurable industrial construction is low. Land is just too expensive to justify building traditional industrial product, even at today’s higher rental rates. The industrial base is more likely to shrink than expand, as remaining sites are being earmarked for more intense uses like multi-family and mixed-use commercial projects.
Just 2.9% of the industrial base was vacant by the end of Q3, a decline of 40 basis points for the quarter. With such low vacancy comes low quality, as the best space is either already occupied or disappears as soon as it hits the market. Competition from multiple tenants for space is common, and the winning bidders are paying more to get less. And, with no new inventory coming on line, functional obsolescence is becoming a big problem throughout the county. Renewing in place is the only option for many area businesses, even if existing space will limit growth and reduce efficiency. Unfortunately, that is often the smartest move, as the shortage of inventory is showing no signs of abating.
2.9%VACANCY
$9.36AVG. SF RENTAL RATES
1,087,174NET SF ABSORPTION
301,733,450 SF INVENTORY
1,079,130SF UNDER CONSTRUCTION
3
1,645,792
-17,694
-516,061
1,538,232
1,087,174
-1,000,000
-500,000
0
500,000
1,000,000
1,500,000
2,000,000
2014 Q3
2014 Q4
2015 Q1
2015 Q2
2015 Q3
Squa
re F
eet
3.5%
3.6%
3.7%
3.3%
2.9%
2.50%
2.90%
3.30%
3.70%
4.10%
2014 Q3
2014 Q4
2015 Q1
2015 Q2
2015 Q3
NET SF ABSORPTION
VACANCY RATE
ORANGE COUNTY
lee-associates.com 31 LEE OVERVIEW KEY MARKET SNAPSHOTS 5 NATIONWIDE LEE OFFICESNATIONAL OVERVIEW2 4 SIGNIFICANT TRANSACTIONS
Key Market Snapshots
ORANGE COUNTY - TRENDING NOW(continued)
3
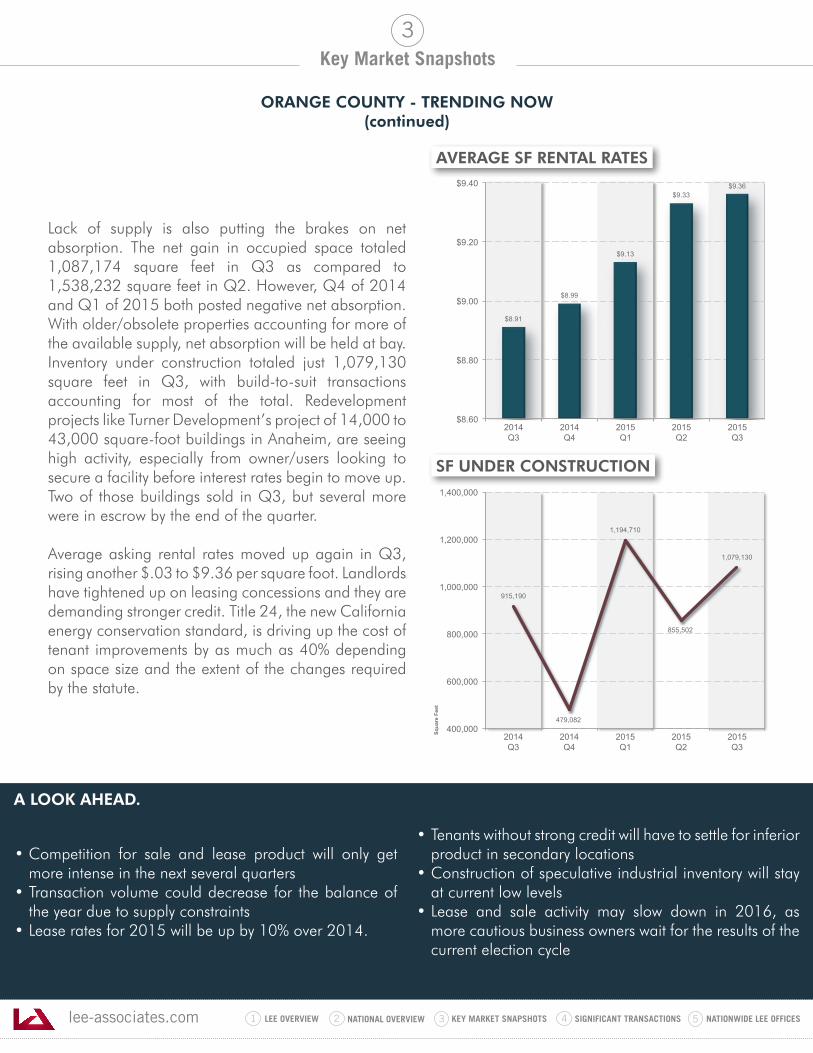
Lack of supply is also putting the brakes on net absorption. The net gain in occupied space totaled 1,087,174 square feet in Q3 as compared to 1,538,232 square feet in Q2. However, Q4 of 2014 and Q1 of 2015 both posted negative net absorption. With older/obsolete properties accounting for more of the available supply, net absorption will be held at bay. Inventory under construction totaled just 1,079,130 square feet in Q3, with build-to-suit transactions accounting for most of the total. Redevelopment projects like Turner Development’s project of 14,000 to 43,000 square-foot buildings in Anaheim, are seeing high activity, especially from owner/users looking to secure a facility before interest rates begin to move up. Two of those buildings sold in Q3, but several more were in escrow by the end of the quarter.
Average asking rental rates moved up again in Q3, rising another $.03 to $9.36 per square foot. Landlords have tightened up on leasing concessions and they are demanding stronger credit. Title 24, the new California energy conservation standard, is driving up the cost of tenant improvements by as much as 40% depending on space size and the extent of the changes required by the statute.
• Competition for sale and lease product will only get more intense in the next several quarters
• Transaction volume could decrease for the balance of the year due to supply constraints
• Lease rates for 2015 will be up by 10% over 2014.
• Tenants without strong credit will have to settle for inferior product in secondary locations
• Construction of speculative industrial inventory will stay at current low levels
• Lease and sale activity may slow down in 2016, as more cautious business owners wait for the results of the current election cycle
$8.91
$8.99
$9.13
$9.33 $9.36
$8.60
$8.80
$9.00
$9.20
$9.40
2014 Q3
2014 Q4
2015 Q1
2015 Q2
2015 Q3
915,190
479,082
1,194,710
855,502
1,079,130
400,000
600,000
800,000
1,000,000
1,200,000
1,400,000
2014 Q3
2014 Q4
2015 Q1
2015 Q2
2015 Q3
Squa
re F
eet
SF UNDER CONSTRUCTION
AVERAGE SF RENTAL RATES
A LOOK AHEAD.
lee-associates.com 31 LEE OVERVIEW KEY MARKET SNAPSHOTS 5 NATIONWIDE LEE OFFICESNATIONAL OVERVIEW2 4 SIGNIFICANT TRANSACTIONS
Key Market Snapshots
TRENDING NOW
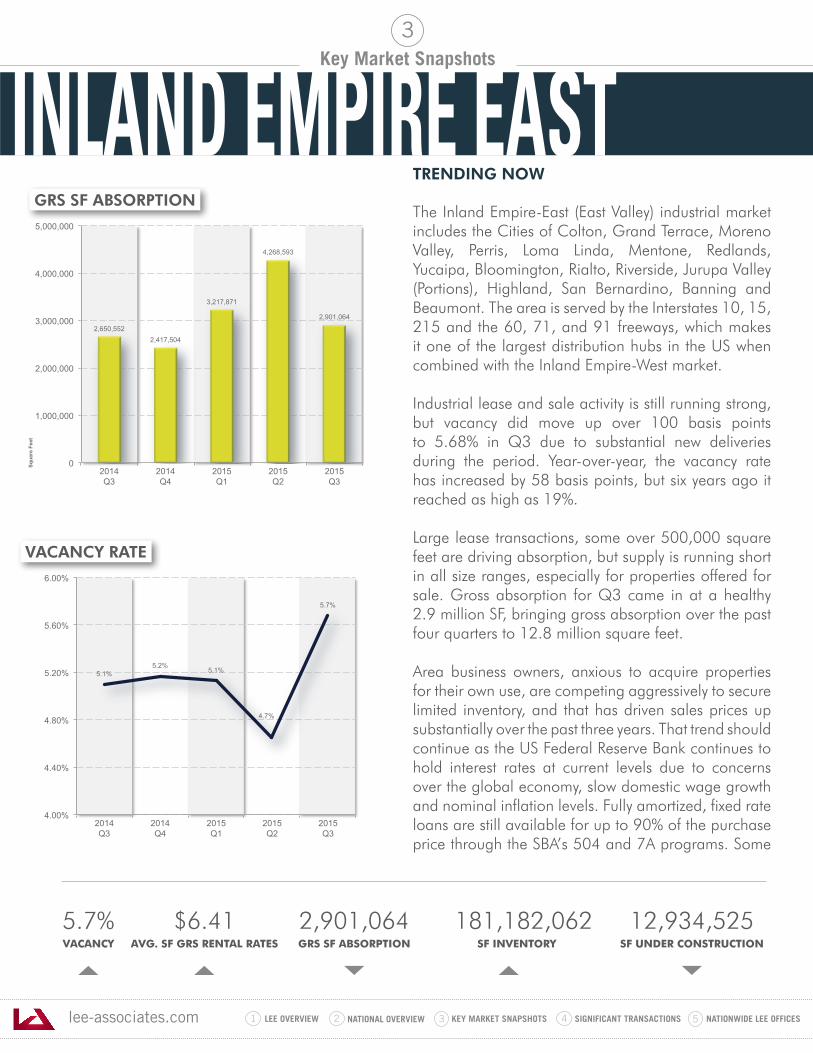
The Inland Empire-East (East Valley) industrial market includes the Cities of Colton, Grand Terrace, Moreno Valley, Perris, Loma Linda, Mentone, Redlands, Yucaipa, Bloomington, Rialto, Riverside, Jurupa Valley (Portions), Highland, San Bernardino, Banning and Beaumont. The area is served by the Interstates 10, 15, 215 and the 60, 71, and 91 freeways, which makes it one of the largest distribution hubs in the US when combined with the Inland Empire-West market. Industrial lease and sale activity is still running strong, but vacancy did move up over 100 basis points to 5.68% in Q3 due to substantial new deliveries during the period. Year-over-year, the vacancy rate has increased by 58 basis points, but six years ago it reached as high as 19%.
Large lease transactions, some over 500,000 square feet are driving absorption, but supply is running short in all size ranges, especially for properties offered for sale. Gross absorption for Q3 came in at a healthy 2.9 million SF, bringing gross absorption over the past four quarters to 12.8 million square feet.
Area business owners, anxious to acquire properties for their own use, are competing aggressively to secure limited inventory, and that has driven sales prices up substantially over the past three years. That trend should continue as the US Federal Reserve Bank continues to hold interest rates at current levels due to concerns over the global economy, slow domestic wage growth and nominal inflation levels. Fully amortized, fixed rate loans are still available for up to 90% of the purchase price through the SBA’s 504 and 7A programs. Some
5.7%VACANCY
$6.41AVG. SF GRS RENTAL RATES
2,901,064GRS SF ABSORPTION
181,182,062 SF INVENTORY
12,934,525SF UNDER CONSTRUCTION
3
2,650,552 2,417,504
3,217,871
4,268,593
2,901,064
0
1,000,000
2,000,000
3,000,000
4,000,000
5,000,000
2014 Q3
2014 Q4
2015 Q1
2015 Q2
2015 Q3
Squa
re F
eet
5.1% 5.2%
5.1%
4.7%
5.7%
4.00%
4.40%
4.80%
5.20%
5.60%
6.00%
2014 Q3
2014 Q4
2015 Q1
2015 Q2
2015 Q3
GRS SF ABSORPTION
VACANCY RATE
INLAND EMPIRE EAST
lee-associates.com 31 LEE OVERVIEW KEY MARKET SNAPSHOTS 5 NATIONWIDE LEE OFFICESNATIONAL OVERVIEW2 4 SIGNIFICANT TRANSACTIONS
Key Market Snapshots
INLAND EMPIRE EAST - TRENDING NOW(continued)
3
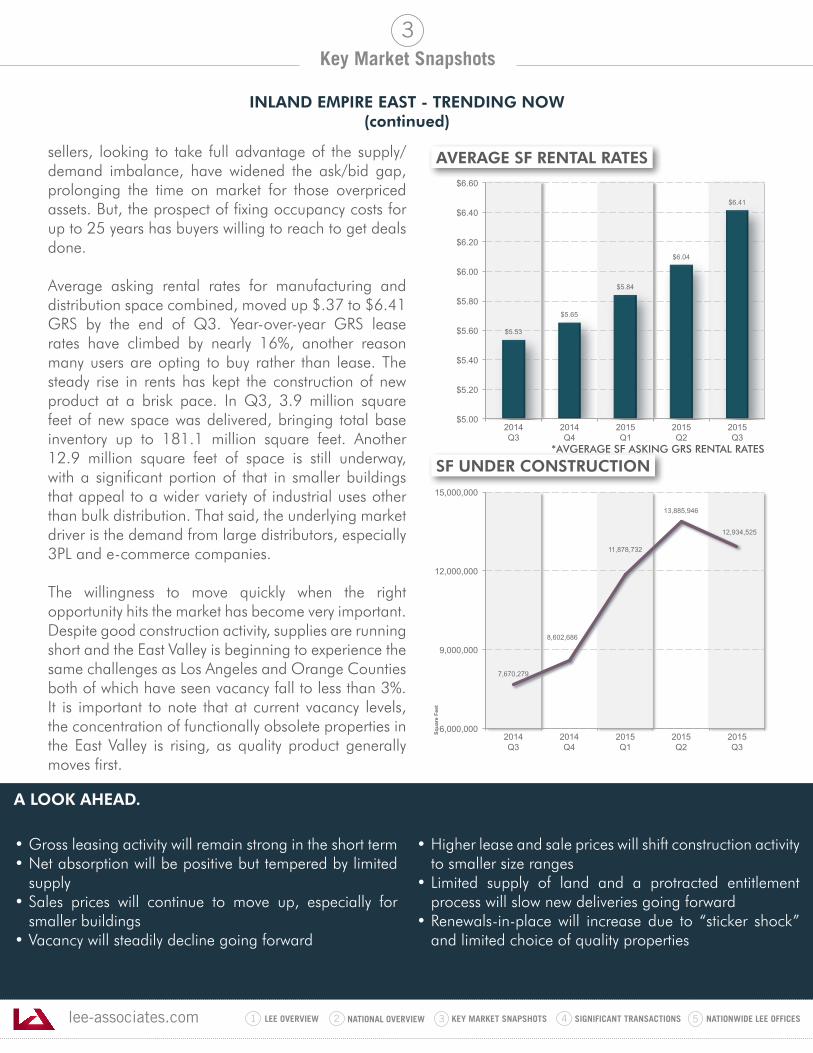
sellers, looking to take full advantage of the supply/demand imbalance, have widened the ask/bid gap, prolonging the time on market for those overpriced assets. But, the prospect of fixing occupancy costs for up to 25 years has buyers willing to reach to get deals done. Average asking rental rates for manufacturing and distribution space combined, moved up $.37 to $6.41 GRS by the end of Q3. Year-over-year GRS lease rates have climbed by nearly 16%, another reason many users are opting to buy rather than lease. The steady rise in rents has kept the construction of new product at a brisk pace. In Q3, 3.9 million square feet of new space was delivered, bringing total base inventory up to 181.1 million square feet. Another 12.9 million square feet of space is still underway, with a significant portion of that in smaller buildings that appeal to a wider variety of industrial uses other than bulk distribution. That said, the underlying market driver is the demand from large distributors, especially 3PL and e-commerce companies. The willingness to move quickly when the right opportunity hits the market has become very important. Despite good construction activity, supplies are running short and the East Valley is beginning to experience the same challenges as Los Angeles and Orange Counties both of which have seen vacancy fall to less than 3%. It is important to note that at current vacancy levels, the concentration of functionally obsolete properties in the East Valley is rising, as quality product generally moves first.
• Gross leasing activity will remain strong in the short term• Net absorption will be positive but tempered by limited
supply• Sales prices will continue to move up, especially for
smaller buildings• Vacancy will steadily decline going forward
• Higher lease and sale prices will shift construction activity to smaller size ranges
• Limited supply of land and a protracted entitlement process will slow new deliveries going forward
• Renewals-in-place will increase due to “sticker shock” and limited choice of quality properties
$5.53
$5.65
$5.84
$6.04
$6.41
$5.00
$5.20
$5.40
$5.60
$5.80
$6.00
$6.20
$6.40
$6.60
2014 Q3
2014 Q4
2015 Q1
2015 Q2
2015 Q3
7,670,279
8,602,686
11,878,732
13,885,946
12,934,525
6,000,000
9,000,000
12,000,000
15,000,000
2014 Q3
2014 Q4
2015 Q1
2015 Q2
2015 Q3
Squa
re F
eet
SF UNDER CONSTRUCTION
AVERAGE SF RENTAL RATES
*AVGERAGE SF ASKING GRS RENTAL RATES
A LOOK AHEAD.
lee-associates.com 31 LEE OVERVIEW KEY MARKET SNAPSHOTS 5 NATIONWIDE LEE OFFICESNATIONAL OVERVIEW2 4 SIGNIFICANT TRANSACTIONS
Key Market Snapshots
TRENDING NOW
The Inland Empire West (IE West) industrial market includes the cities of Chino, Ontario, Rancho Cucamonga, Fontana and Mira Loma. Together, these cities contain 288 million of the over 500 million square feet of existing industrial space in the Inland Empire market. IE West is one of the largest industrial markets in the United States, and serves as a key distribution hub for the Western States. Located within an hour’s drive of the ports of Long Beach and Los Angeles where up to 40% of the goods entering the US arrive each year, IE West is served by several major highways including Interstates 10, 15 and 215, with easy access to the 57, 60, 91, 210 and 605 Freeways. Bulk distribution product makes up the vast majority of the industrial space, with a high concentration of buildings in excess of 500,000 square feet each.
Quality is also a differentiating factor for IE West, as the region is the most active in the US in terms of construction of state-of-the-art distribution facilities with high ceiling clearance and the latest in fire and life safety systems that allow large distributors to operate with greater efficiency. By the end of the third quarter, over 10.6 million square feet of Class A distribution space was under construction and over 7.5 million square feet has already been delivered since the beginning of the year. A good portion of that space has been pre-leased, but there is still a high level of speculative development underway, which gives expanding major retailers, e-commerce companies and 3PL operators the opportunity to quickly expand their capacity within the region.
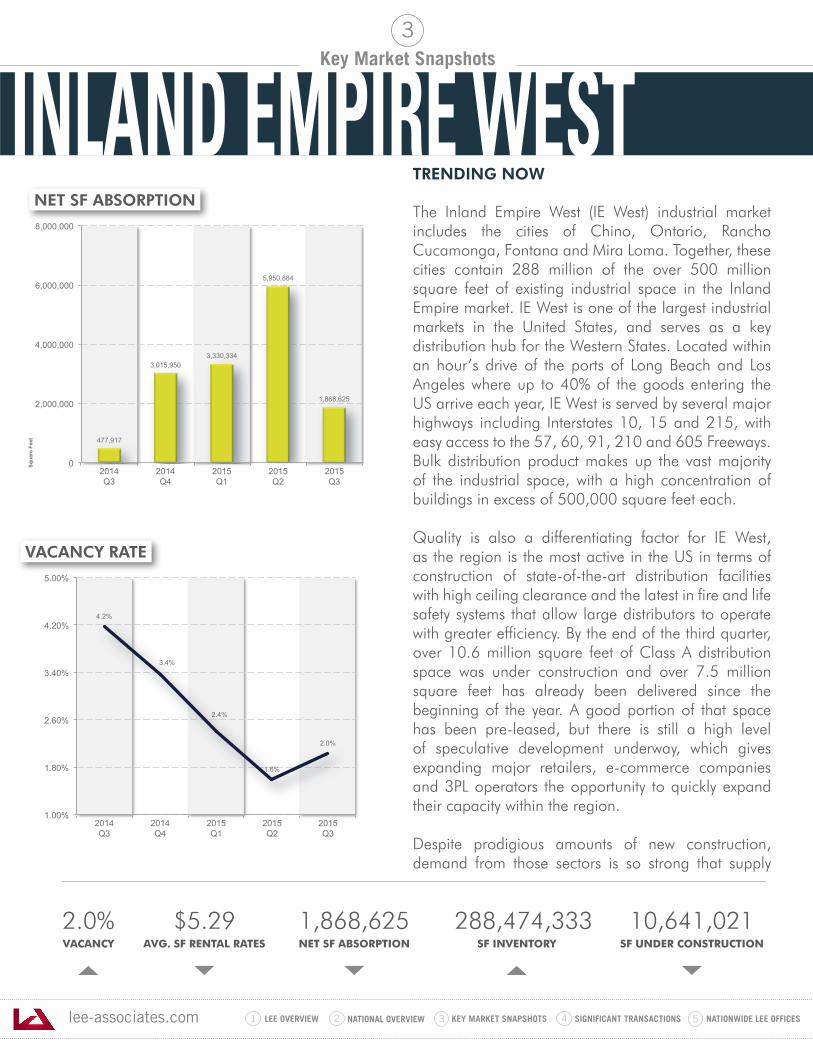
Despite prodigious amounts of new construction, demand from those sectors is so strong that supply
2.0%VACANCY
$5.29AVG. SF RENTAL RATES
1,868,625NET SF ABSORPTION
288,474,333 SF INVENTORY
10,641,021SF UNDER CONSTRUCTION
3
477,917
3,015,950 3,330,334
5,950,884
1,868,625
0
2,000,000
4,000,000
6,000,000
8,000,000
2014 Q3
2014 Q4
2015 Q1
2015 Q2
2015 Q3
Squa
re F
eet
4.2%
3.4%
2.4%
1.6%
2.0%
1.00%
1.80%
2.60%
3.40%
4.20%
5.00%
2014 Q3
2014 Q4
2015 Q1
2015 Q2
2015 Q3
NET SF ABSORPTION
VACANCY RATE
INLAND EMPIRE WEST
lee-associates.com 31 LEE OVERVIEW KEY MARKET SNAPSHOTS 5 NATIONWIDE LEE OFFICESNATIONAL OVERVIEW2 4 SIGNIFICANT TRANSACTIONS
Key Market Snapshots
INLAND EMPIRE WEST - TRENDING NOW(continued)
3
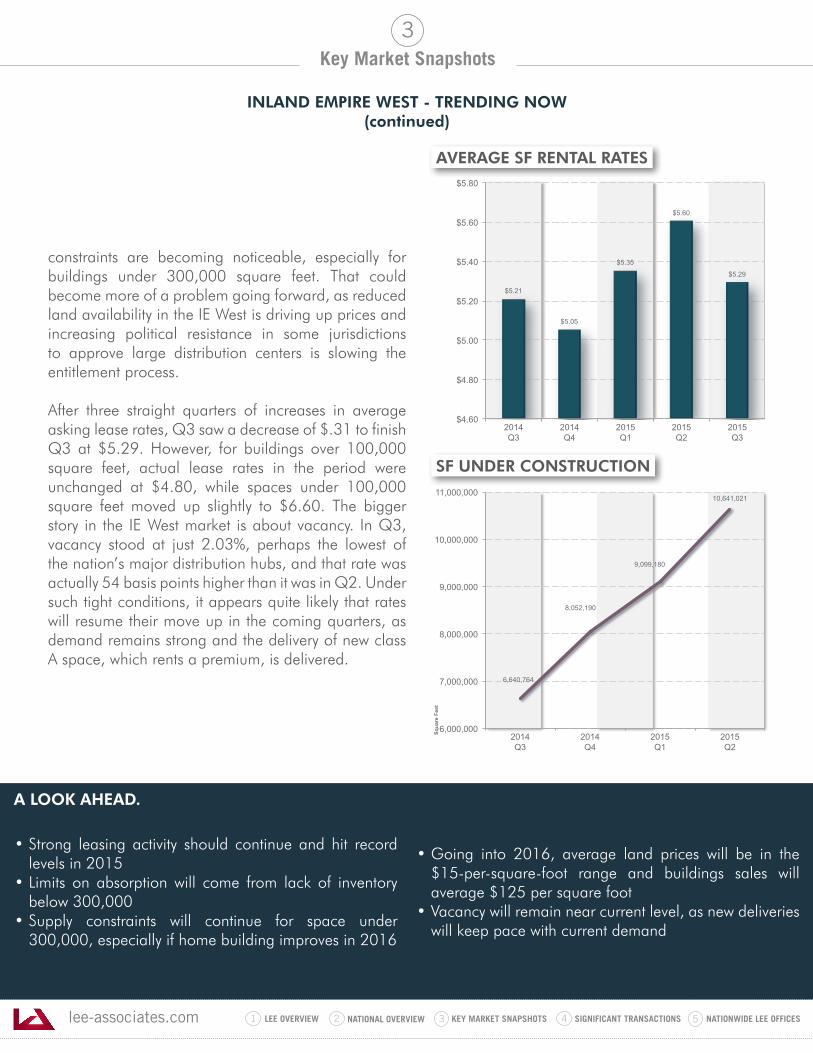
constraints are becoming noticeable, especially for buildings under 300,000 square feet. That could become more of a problem going forward, as reduced land availability in the IE West is driving up prices and increasing political resistance in some jurisdictions to approve large distribution centers is slowing the entitlement process.
After three straight quarters of increases in average asking lease rates, Q3 saw a decrease of $.31 to finish Q3 at $5.29. However, for buildings over 100,000 square feet, actual lease rates in the period were unchanged at $4.80, while spaces under 100,000 square feet moved up slightly to $6.60. The bigger story in the IE West market is about vacancy. In Q3, vacancy stood at just 2.03%, perhaps the lowest of the nation’s major distribution hubs, and that rate was actually 54 basis points higher than it was in Q2. Under such tight conditions, it appears quite likely that rates will resume their move up in the coming quarters, as demand remains strong and the delivery of new class A space, which rents a premium, is delivered.
• Strong leasing activity should continue and hit record levels in 2015
• Limits on absorption will come from lack of inventory below 300,000
• Supply constraints will continue for space under 300,000, especially if home building improves in 2016
• Going into 2016, average land prices will be in the $15-per-square-foot range and buildings sales will average $125 per square foot
• Vacancy will remain near current level, as new deliveries will keep pace with current demand
$5.21
$5.05
$5.35
$5.60
$5.29
$4.60
$4.80
$5.00
$5.20
$5.40
$5.60
$5.80
2014 Q3
2014 Q4
2015 Q1
2015 Q2
2015 Q3
6,640,764
8,052,190
9,099,180
10,641,021
6,000,000
7,000,000
8,000,000
9,000,000
10,000,000
11,000,000
2014 Q3
2014 Q4
2015 Q1
2015 Q2
Squa
re F
eet
SF UNDER CONSTRUCTION
AVERAGE SF RENTAL RATES
A LOOK AHEAD.
lee-associates.com 31 LEE OVERVIEW KEY MARKET SNAPSHOTS 5 NATIONWIDE LEE OFFICESNATIONAL OVERVIEW2 4 SIGNIFICANT TRANSACTIONS
Key Market Snapshots
TRENDING NOW
The Denver industrial property market remains in relatively good health, despite the recent slowdown in the energy sector. Layoffs in that sector are now a reality, with roughly 70,000 jobs lost nationwide in the industry. Also, the number of active wells has fallen dramatically since the beginning of the year.However, job losses to date have been concentrated in the office sector, which has helped Denver’s industrial market keep its forward momentum.
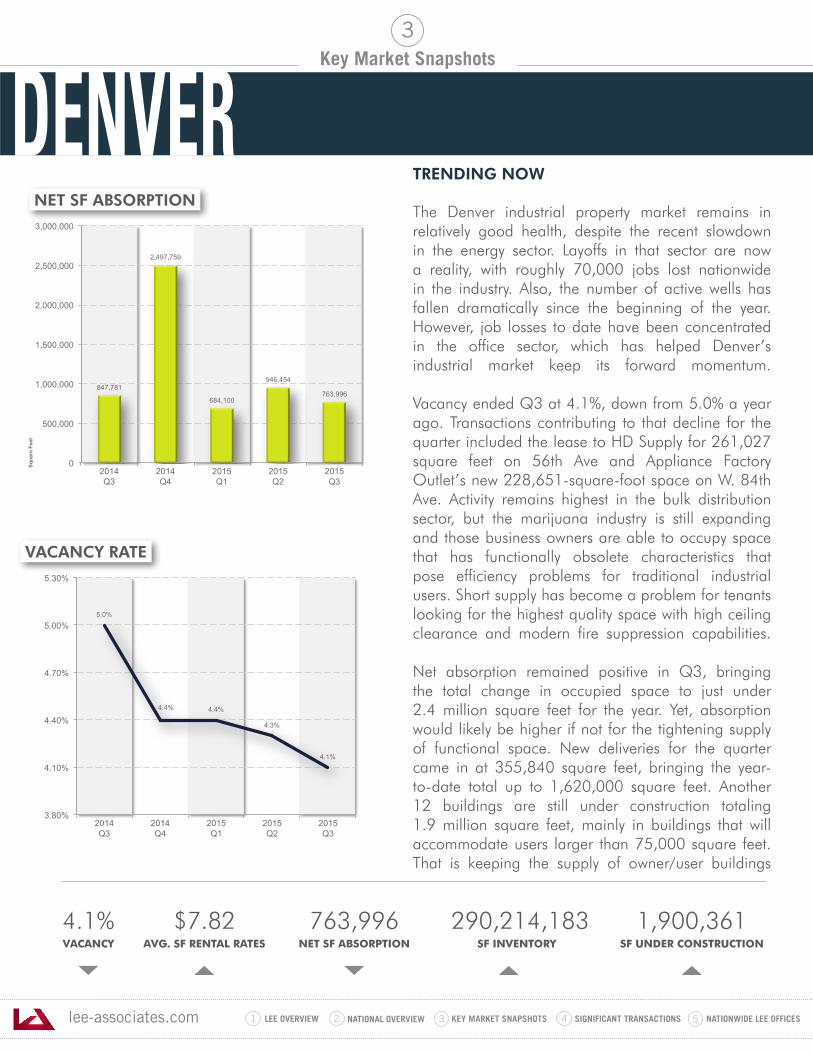
Vacancy ended Q3 at 4.1%, down from 5.0% a year ago. Transactions contributing to that decline for the quarter included the lease to HD Supply for 261,027 square feet on 56th Ave and Appliance Factory Outlet’s new 228,651-square-foot space on W. 84th Ave. Activity remains highest in the bulk distribution sector, but the marijuana industry is still expanding and those business owners are able to occupy space that has functionally obsolete characteristics that pose efficiency problems for traditional industrial users. Short supply has become a problem for tenants looking for the highest quality space with high ceiling clearance and modern fire suppression capabilities.
Net absorption remained positive in Q3, bringing the total change in occupied space to just under 2.4 million square feet for the year. Yet, absorption would likely be higher if not for the tightening supply of functional space. New deliveries for the quarter came in at 355,840 square feet, bringing the year-to-date total up to 1,620,000 square feet. Another 12 buildings are still under construction totaling 1.9 million square feet, mainly in buildings that will accommodate users larger than 75,000 square feet. That is keeping the supply of owner/user buildings
4.1%VACANCY
$7.82AVG. SF RENTAL RATES
763,996NET SF ABSORPTION
290,214,183 SF INVENTORY
1,900,361SF UNDER CONSTRUCTION
3
847,781
2,497,759
684,100
946,454
763,996
0
500,000
1,000,000
1,500,000
2,000,000
2,500,000
3,000,000
2014 Q3
2014 Q4
2015 Q1
2015 Q2
2015 Q3
Squa
re F
eet
5.0%
4.4% 4.4%
4.3%
4.1%
3.80%
4.10%
4.40%
4.70%
5.00%
5.30%
2014 Q3
2014 Q4
2015 Q1
2015 Q2
2015 Q3
NET SF ABSORPTION
VACANCY RATE
DENVER
lee-associates.com 31 LEE OVERVIEW KEY MARKET SNAPSHOTS 5 NATIONWIDE LEE OFFICESNATIONAL OVERVIEW2 4 SIGNIFICANT TRANSACTIONS
Key Market Snapshots
DENVER - TRENDING NOW(continued)
3
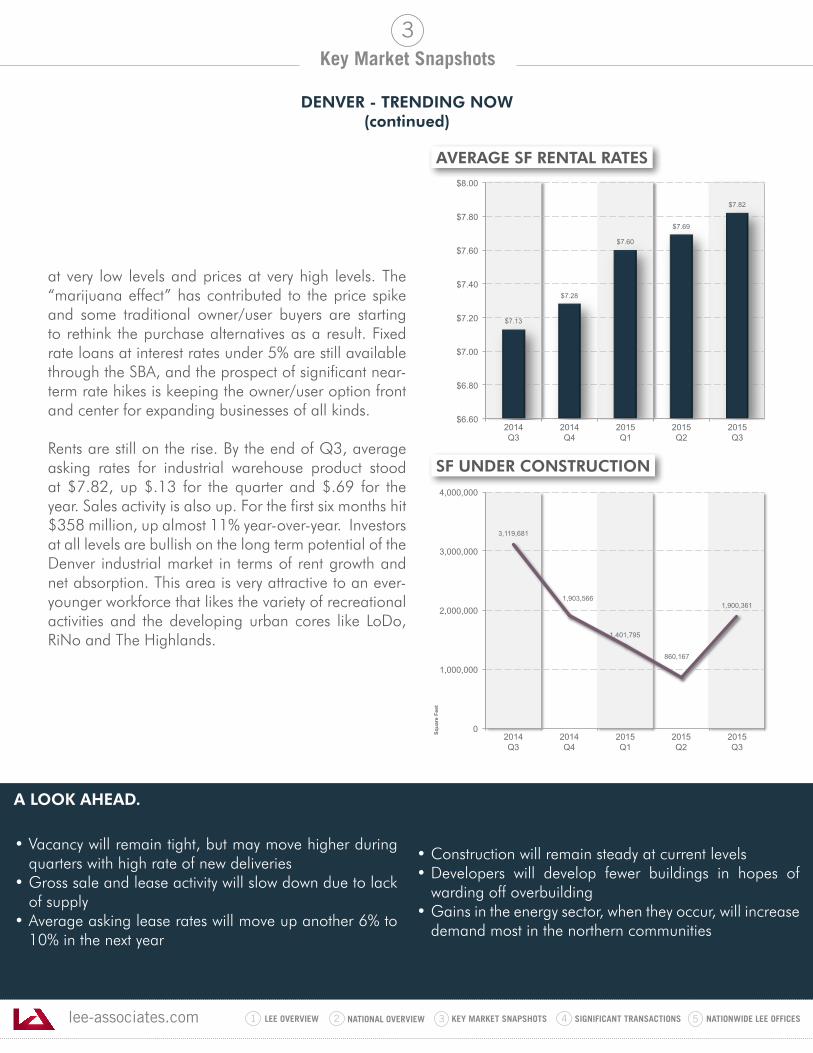
at very low levels and prices at very high levels. The “marijuana effect” has contributed to the price spike and some traditional owner/user buyers are starting to rethink the purchase alternatives as a result. Fixed rate loans at interest rates under 5% are still available through the SBA, and the prospect of significant near-term rate hikes is keeping the owner/user option front and center for expanding businesses of all kinds.
Rents are still on the rise. By the end of Q3, average asking rates for industrial warehouse product stood at $7.82, up $.13 for the quarter and $.69 for the year. Sales activity is also up. For the first six months hit $358 million, up almost 11% year-over-year. Investors at all levels are bullish on the long term potential of the Denver industrial market in terms of rent growth and net absorption. This area is very attractive to an ever-younger workforce that likes the variety of recreational activities and the developing urban cores like LoDo, RiNo and The Highlands.
• Vacancy will remain tight, but may move higher during quarters with high rate of new deliveries
• Gross sale and lease activity will slow down due to lack of supply
• Average asking lease rates will move up another 6% to 10% in the next year
• Construction will remain steady at current levels• Developers will develop fewer buildings in hopes of
warding off overbuilding• Gains in the energy sector, when they occur, will increase
demand most in the northern communities
$7.13
$7.28
$7.60
$7.69
$7.82
$6.60
$6.80
$7.00
$7.20
$7.40
$7.60
$7.80
$8.00
2014 Q3
2014 Q4
2015 Q1
2015 Q2
2015 Q3
3,119,681
1,903,566
1,401,795
860,167
1,900,361
0
1,000,000
2,000,000
3,000,000
4,000,000
2014 Q3
2014 Q4
2015 Q1
2015 Q2
2015 Q3
Squa
re F
eet
SF UNDER CONSTRUCTION
AVERAGE SF RENTAL RATES
A LOOK AHEAD.
lee-associates.com 31 LEE OVERVIEW KEY MARKET SNAPSHOTS 5 NATIONWIDE LEE OFFICESNATIONAL OVERVIEW2 4 SIGNIFICANT TRANSACTIONS
Key Market Snapshots
TRENDING NOW
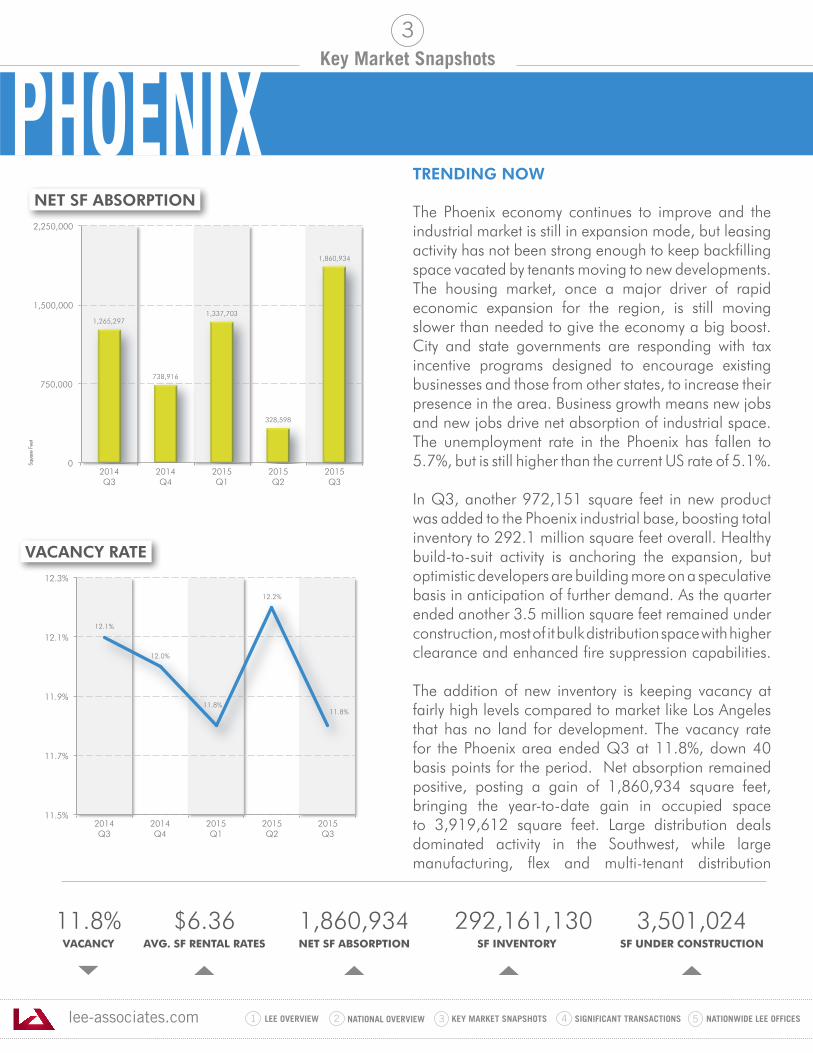
The Phoenix economy continues to improve and the industrial market is still in expansion mode, but leasing activity has not been strong enough to keep backfilling space vacated by tenants moving to new developments. The housing market, once a major driver of rapid economic expansion for the region, is still moving slower than needed to give the economy a big boost. City and state governments are responding with tax incentive programs designed to encourage existing businesses and those from other states, to increase their presence in the area. Business growth means new jobs and new jobs drive net absorption of industrial space. The unemployment rate in the Phoenix has fallen to 5.7%, but is still higher than the current US rate of 5.1%.
In Q3, another 972,151 square feet in new product was added to the Phoenix industrial base, boosting total inventory to 292.1 million square feet overall. Healthy build-to-suit activity is anchoring the expansion, but optimistic developers are building more on a speculative basis in anticipation of further demand. As the quarter ended another 3.5 million square feet remained under construction, most of it bulk distribution space with higher clearance and enhanced fire suppression capabilities.
The addition of new inventory is keeping vacancy at fairly high levels compared to market like Los Angeles that has no land for development. The vacancy rate for the Phoenix area ended Q3 at 11.8%, down 40 basis points for the period. Net absorption remained positive, posting a gain of 1,860,934 square feet, bringing the year-to-date gain in occupied space to 3,919,612 square feet. Large distribution deals dominated activity in the Southwest, while large manufacturing, flex and multi-tenant distribution
11.8%VACANCY
$6.36AVG. SF RENTAL RATES
1,860,934NET SF ABSORPTION
292,161,130 SF INVENTORY
3,501,024SF UNDER CONSTRUCTION
3
1,265,297
738,916
1,337,703
328,598
1,860,934
0
750,000
1,500,000
2,250,000
2014 Q3
2014 Q4
2015 Q1
2015 Q2
2015 Q3
Squa
re F
eet
12.1%
12.0%
11.8%
12.2%
11.8%
11.5%
11.7%
11.9%
12.1%
12.3%
2014 Q3
2014 Q4
2015 Q1
2015 Q2
2015 Q3
NET SF ABSORPTION
VACANCY RATE
PHOENIX
lee-associates.com 31 LEE OVERVIEW KEY MARKET SNAPSHOTS 5 NATIONWIDE LEE OFFICESNATIONAL OVERVIEW2 4 SIGNIFICANT TRANSACTIONS
Key Market Snapshots
PHOENIX - TRENDING NOW(continued)
3
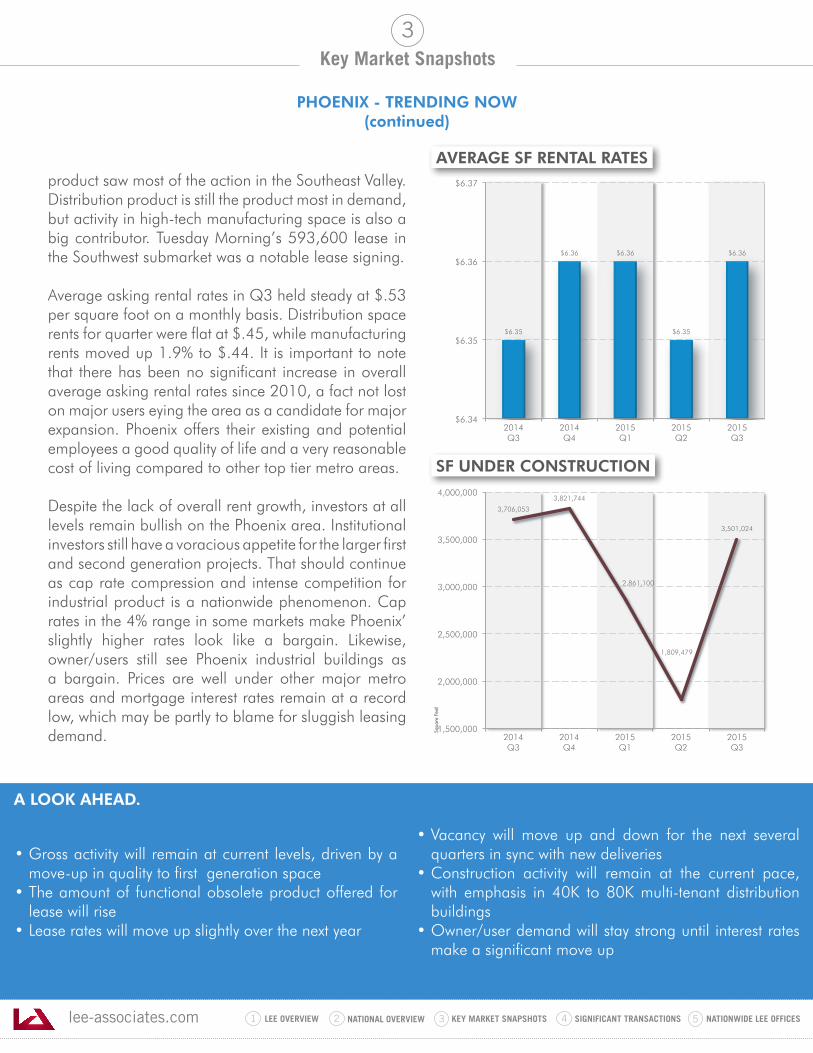
product saw most of the action in the Southeast Valley. Distribution product is still the product most in demand, but activity in high-tech manufacturing space is also a big contributor. Tuesday Morning’s 593,600 lease in the Southwest submarket was a notable lease signing.
Average asking rental rates in Q3 held steady at $.53 per square foot on a monthly basis. Distribution space rents for quarter were flat at $.45, while manufacturing rents moved up 1.9% to $.44. It is important to note that there has been no significant increase in overall average asking rental rates since 2010, a fact not lost on major users eying the area as a candidate for major expansion. Phoenix offers their existing and potential employees a good quality of life and a very reasonable cost of living compared to other top tier metro areas.
Despite the lack of overall rent growth, investors at all levels remain bullish on the Phoenix area. Institutional investors still have a voracious appetite for the larger first and second generation projects. That should continue as cap rate compression and intense competition for industrial product is a nationwide phenomenon. Cap rates in the 4% range in some markets make Phoenix’ slightly higher rates look like a bargain. Likewise, owner/users still see Phoenix industrial buildings as a bargain. Prices are well under other major metro areas and mortgage interest rates remain at a record low, which may be partly to blame for sluggish leasing demand.
• Gross activity will remain at current levels, driven by a move-up in quality to first generation space
• The amount of functional obsolete product offered for lease will rise
• Lease rates will move up slightly over the next year
• Vacancy will move up and down for the next several quarters in sync with new deliveries
• Construction activity will remain at the current pace, with emphasis in 40K to 80K multi-tenant distribution buildings
• Owner/user demand will stay strong until interest rates make a significant move up
$6.35
$6.36 $6.36
$6.35
$6.36
$6.34
$6.35
$6.36
$6.37
2014 Q3
2014 Q4
2015 Q1
2015 Q2
2015 Q3
3,706,053
3,821,744
2,861,100
1,809,479
3,501,024
1,500,000
2,000,000
2,500,000
3,000,000
3,500,000
4,000,000
2014 Q3
2014 Q4
2015 Q1
2015 Q2
2015 Q3
Squa
re F
eet
SF UNDER CONSTRUCTION
AVERAGE SF RENTAL RATES
A LOOK AHEAD.
lee-associates.com 31 LEE OVERVIEW KEY MARKET SNAPSHOTS 5 NATIONWIDE LEE OFFICESNATIONAL OVERVIEW2 4 SIGNIFICANT TRANSACTIONS
Key Market Snapshots
TRENDING NOW
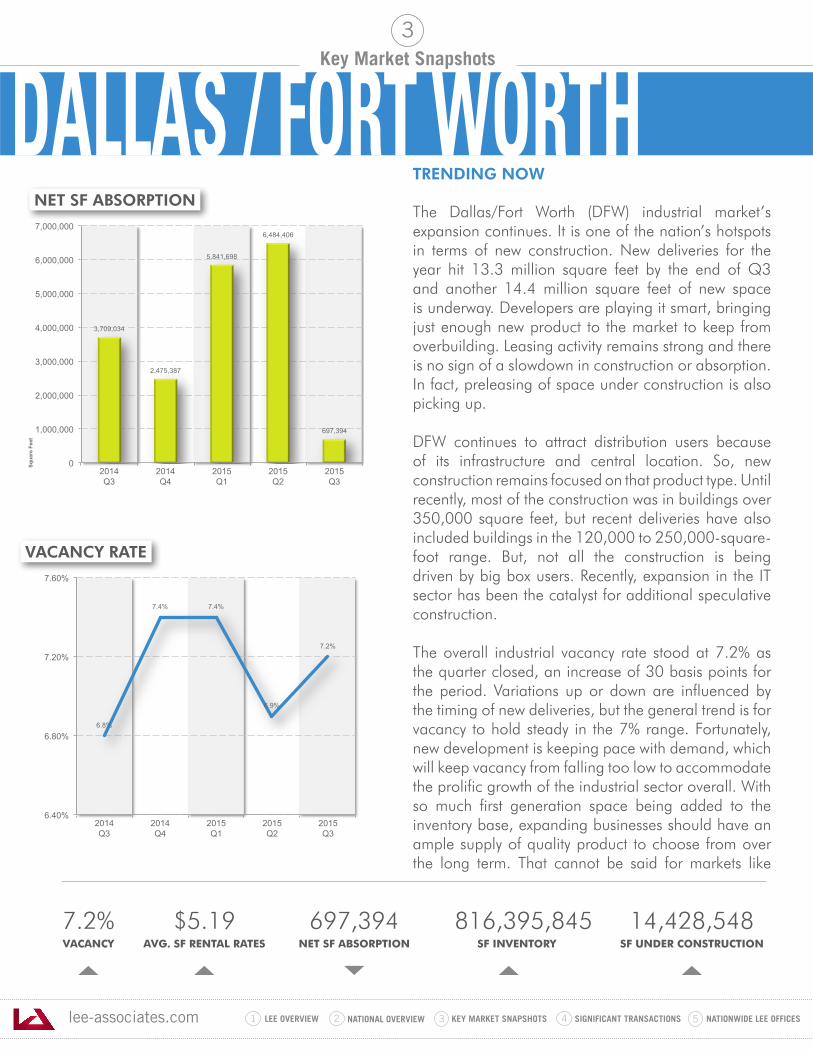
The Dallas/Fort Worth (DFW) industrial market’s expansion continues. It is one of the nation’s hotspots in terms of new construction. New deliveries for the year hit 13.3 million square feet by the end of Q3 and another 14.4 million square feet of new space is underway. Developers are playing it smart, bringing just enough new product to the market to keep from overbuilding. Leasing activity remains strong and there is no sign of a slowdown in construction or absorption. In fact, preleasing of space under construction is also picking up.
DFW continues to attract distribution users because of its infrastructure and central location. So, new construction remains focused on that product type. Until recently, most of the construction was in buildings over 350,000 square feet, but recent deliveries have also included buildings in the 120,000 to 250,000-square-foot range. But, not all the construction is being driven by big box users. Recently, expansion in the IT sector has been the catalyst for additional speculative construction.
The overall industrial vacancy rate stood at 7.2% as the quarter closed, an increase of 30 basis points for the period. Variations up or down are influenced by the timing of new deliveries, but the general trend is for vacancy to hold steady in the 7% range. Fortunately, new development is keeping pace with demand, which will keep vacancy from falling too low to accommodate the prolific growth of the industrial sector overall. With so much first generation space being added to the inventory base, expanding businesses should have an ample supply of quality product to choose from over the long term. That cannot be said for markets like
7.2%VACANCY
$5.19AVG. SF RENTAL RATES
697,394NET SF ABSORPTION
816,395,845 SF INVENTORY
14,428,548SF UNDER CONSTRUCTION
3
3,709,034
2,475,387
5,841,698
6,484,406
697,394
0
1,000,000
2,000,000
3,000,000
4,000,000
5,000,000
6,000,000
7,000,000
2014 Q3
2014 Q4
2015 Q1
2015 Q2
2015 Q3
Squa
re F
eet
6.8%
7.4% 7.4%
6.9%
7.2%
6.40%
6.80%
7.20%
7.60%
2014 Q3
2014 Q4
2015 Q1
2015 Q2
2015 Q3
NET SF ABSORPTION
VACANCY RATE
DALLAS / FORT WORTH
lee-associates.com 31 LEE OVERVIEW KEY MARKET SNAPSHOTS 5 NATIONWIDE LEE OFFICESNATIONAL OVERVIEW2 4 SIGNIFICANT TRANSACTIONS
Key Market Snapshots
DALLAS / FORT WORTH - TRENDING NOW(continued)
3
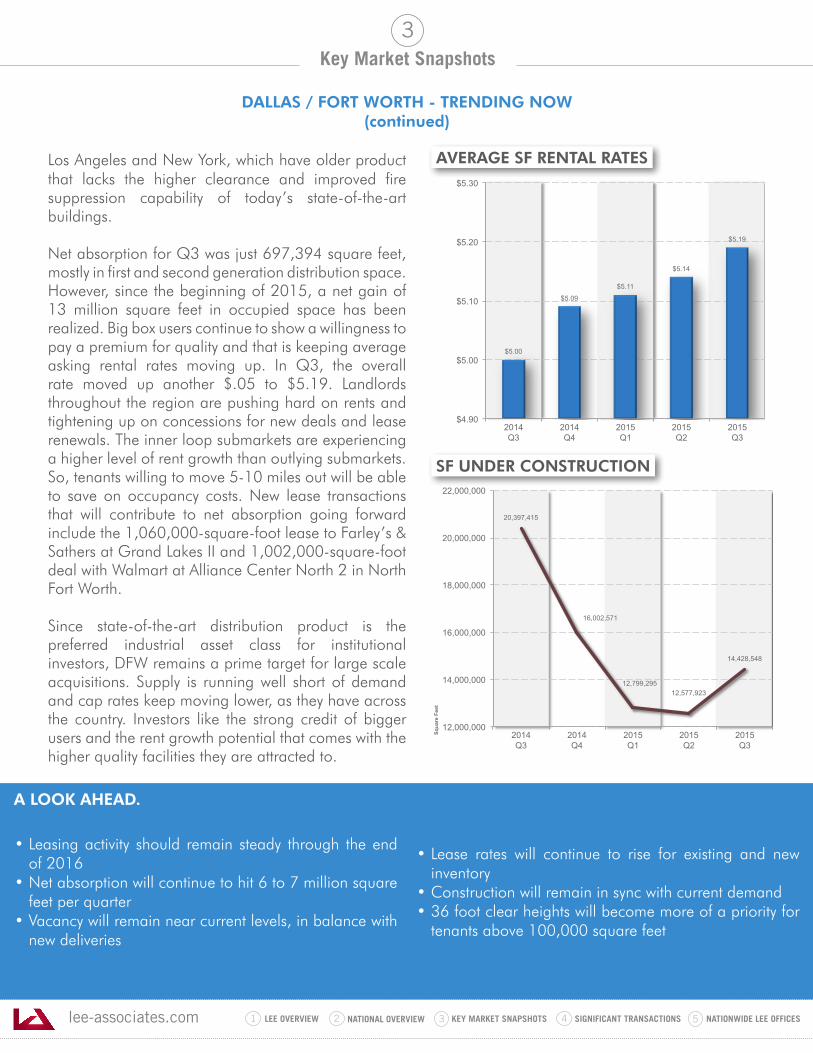
Los Angeles and New York, which have older product that lacks the higher clearance and improved fire suppression capability of today’s state-of-the-art buildings.
Net absorption for Q3 was just 697,394 square feet, mostly in first and second generation distribution space. However, since the beginning of 2015, a net gain of 13 million square feet in occupied space has been realized. Big box users continue to show a willingness to pay a premium for quality and that is keeping average asking rental rates moving up. In Q3, the overall rate moved up another $.05 to $5.19. Landlords throughout the region are pushing hard on rents and tightening up on concessions for new deals and lease renewals. The inner loop submarkets are experiencing a higher level of rent growth than outlying submarkets. So, tenants willing to move 5-10 miles out will be able to save on occupancy costs. New lease transactions that will contribute to net absorption going forward include the 1,060,000-square-foot lease to Farley’s & Sathers at Grand Lakes II and 1,002,000-square-foot deal with Walmart at Alliance Center North 2 in North Fort Worth.
Since state-of-the-art distribution product is the preferred industrial asset class for institutional investors, DFW remains a prime target for large scale acquisitions. Supply is running well short of demand and cap rates keep moving lower, as they have across the country. Investors like the strong credit of bigger users and the rent growth potential that comes with the higher quality facilities they are attracted to.
• Leasing activity should remain steady through the end of 2016
• Net absorption will continue to hit 6 to 7 million square feet per quarter
• Vacancy will remain near current levels, in balance with new deliveries
• Lease rates will continue to rise for existing and new inventory
• Construction will remain in sync with current demand • 36 foot clear heights will become more of a priority for
tenants above 100,000 square feet
$5.00
$5.09
$5.11
$5.14
$5.19
$4.90
$5.00
$5.10
$5.20
$5.30
2014 Q3
2014 Q4
2015 Q1
2015 Q2
2015 Q3
20,397,415
16,002,571
12,799,295 12,577,923
14,428,548
12,000,000
14,000,000
16,000,000
18,000,000
20,000,000
22,000,000
2014 Q3
2014 Q4
2015 Q1
2015 Q2
2015 Q3
Squa
re F
eet
SF UNDER CONSTRUCTION
AVERAGE SF RENTAL RATES
A LOOK AHEAD.
lee-associates.com 31 LEE OVERVIEW KEY MARKET SNAPSHOTS 5 NATIONWIDE LEE OFFICESNATIONAL OVERVIEW2 4 SIGNIFICANT TRANSACTIONS
Key Market Snapshots
TRENDING NOW
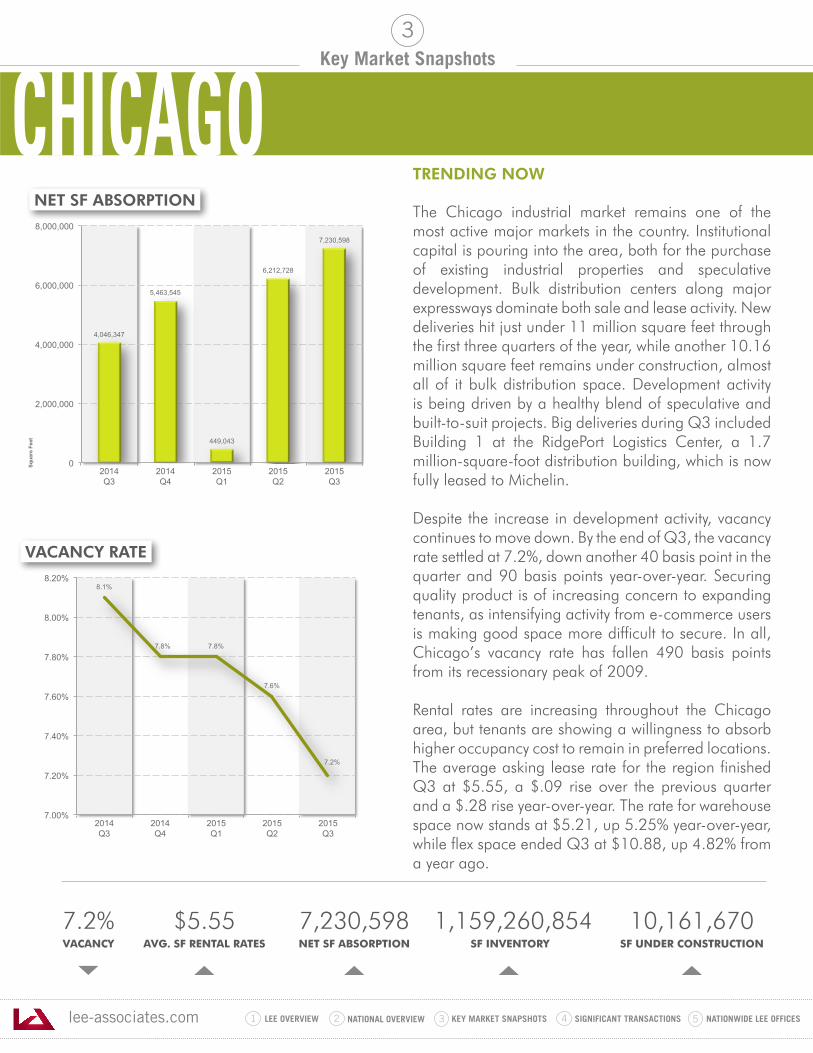
The Chicago industrial market remains one of the most active major markets in the country. Institutional capital is pouring into the area, both for the purchase of existing industrial properties and speculative development. Bulk distribution centers along major expressways dominate both sale and lease activity. New deliveries hit just under 11 million square feet through the first three quarters of the year, while another 10.16 million square feet remains under construction, almost all of it bulk distribution space. Development activity is being driven by a healthy blend of speculative and built-to-suit projects. Big deliveries during Q3 included Building 1 at the RidgePort Logistics Center, a 1.7 million-square-foot distribution building, which is now fully leased to Michelin. Despite the increase in development activity, vacancy continues to move down. By the end of Q3, the vacancy rate settled at 7.2%, down another 40 basis point in the quarter and 90 basis points year-over-year. Securing quality product is of increasing concern to expanding tenants, as intensifying activity from e-commerce users is making good space more difficult to secure. In all, Chicago’s vacancy rate has fallen 490 basis points from its recessionary peak of 2009.
Rental rates are increasing throughout the Chicago area, but tenants are showing a willingness to absorb higher occupancy cost to remain in preferred locations. The average asking lease rate for the region finished Q3 at $5.55, a $.09 rise over the previous quarter and a $.28 rise year-over-year. The rate for warehouse space now stands at $5.21, up 5.25% year-over-year, while flex space ended Q3 at $10.88, up 4.82% from a year ago.
7.2%VACANCY
$5.55AVG. SF RENTAL RATES
7,230,598NET SF ABSORPTION
1,159,260,854 SF INVENTORY
10,161,670SF UNDER CONSTRUCTION
3
4,046,347
5,463,545
449,043
6,212,728
7,230,598
0
2,000,000
4,000,000
6,000,000
8,000,000
2014 Q3
2014 Q4
2015 Q1
2015 Q2
2015 Q3
Squa
re F
eet
8.1%
7.8% 7.8%
7.6%
7.2%
7.00%
7.20%
7.40%
7.60%
7.80%
8.00%
8.20%
2014 Q3
2014 Q4
2015 Q1
2015 Q2
2015 Q3
NET SF ABSORPTION
VACANCY RATE
CHICAGO
lee-associates.com 31 LEE OVERVIEW KEY MARKET SNAPSHOTS 5 NATIONWIDE LEE OFFICESNATIONAL OVERVIEW2 4 SIGNIFICANT TRANSACTIONS
Key Market Snapshots
CHICAGO - TRENDING NOW(continued)
3
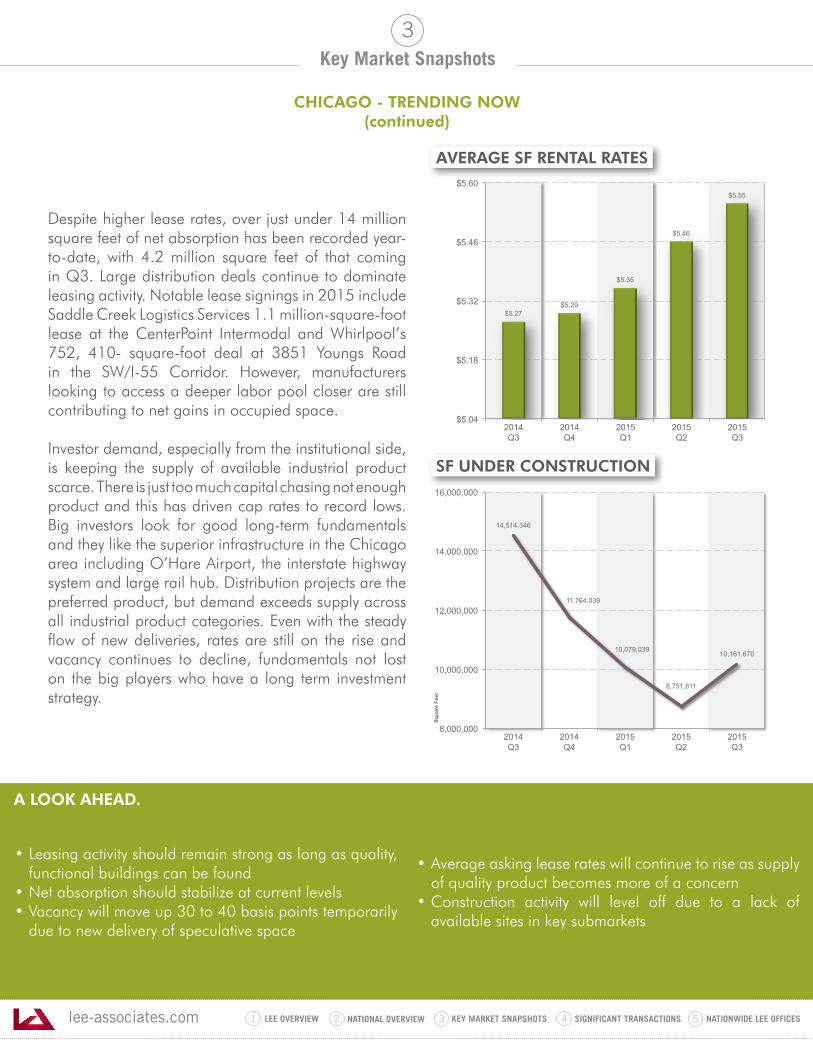
Despite higher lease rates, over just under 14 million square feet of net absorption has been recorded year-to-date, with 4.2 million square feet of that coming in Q3. Large distribution deals continue to dominate leasing activity. Notable lease signings in 2015 include Saddle Creek Logistics Services 1.1 million-square-foot lease at the CenterPoint Intermodal and Whirlpool’s 752, 410- square-foot deal at 3851 Youngs Road in the SW/I-55 Corridor. However, manufacturers looking to access a deeper labor pool closer are still contributing to net gains in occupied space.
Investor demand, especially from the institutional side, is keeping the supply of available industrial product scarce. There is just too much capital chasing not enough product and this has driven cap rates to record lows. Big investors look for good long-term fundamentals and they like the superior infrastructure in the Chicago area including O’Hare Airport, the interstate highway system and large rail hub. Distribution projects are the preferred product, but demand exceeds supply across all industrial product categories. Even with the steady flow of new deliveries, rates are still on the rise and vacancy continues to decline, fundamentals not lost on the big players who have a long term investment strategy.
• Leasing activity should remain strong as long as quality, functional buildings can be found
• Net absorption should stabilize at current levels• Vacancy will move up 30 to 40 basis points temporarily
due to new delivery of speculative space
• Average asking lease rates will continue to rise as supply of quality product becomes more of a concern
• Construction activity will level off due to a lack of available sites in key submarkets
$5.27 $5.29
$5.35
$5.46
$5.55
$5.04
$5.18
$5.32
$5.46
$5.60
2014 Q3
2014 Q4
2015 Q1
2015 Q2
2015 Q3
14,514,346
11,764,039
10,079,039
8,751,811
10,161,670
8,000,000
10,000,000
12,000,000
14,000,000
16,000,000
2014 Q3
2014 Q4
2015 Q1
2015 Q2
2015 Q3
Squa
re F
eet
SF UNDER CONSTRUCTION
AVERAGE SF RENTAL RATES
A LOOK AHEAD.
lee-associates.com 31 LEE OVERVIEW KEY MARKET SNAPSHOTS 5 NATIONWIDE LEE OFFICESNATIONAL OVERVIEW2 4 SIGNIFICANT TRANSACTIONS
Key Market Snapshots
TRENDING NOW
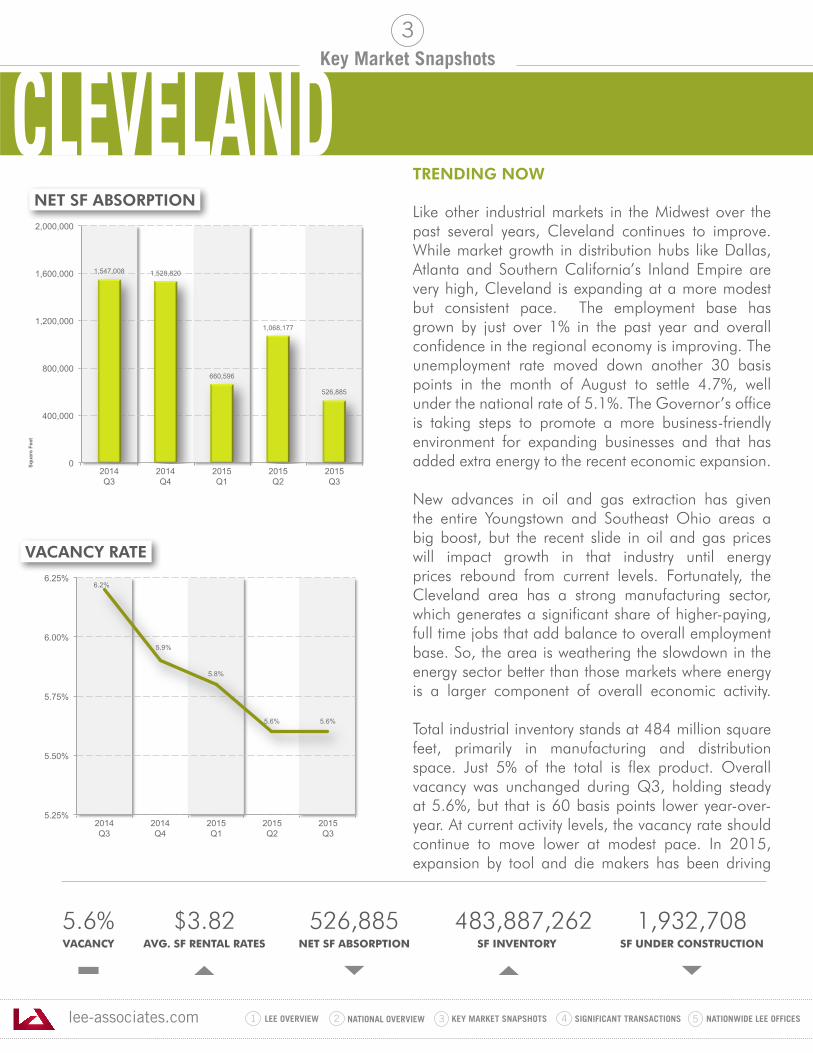
Like other industrial markets in the Midwest over the past several years, Cleveland continues to improve. While market growth in distribution hubs like Dallas, Atlanta and Southern California’s Inland Empire are very high, Cleveland is expanding at a more modest but consistent pace. The employment base has grown by just over 1% in the past year and overall confidence in the regional economy is improving. The unemployment rate moved down another 30 basis points in the month of August to settle 4.7%, well under the national rate of 5.1%. The Governor’s office is taking steps to promote a more business-friendly environment for expanding businesses and that has added extra energy to the recent economic expansion.
New advances in oil and gas extraction has given the entire Youngstown and Southeast Ohio areas a big boost, but the recent slide in oil and gas prices will impact growth in that industry until energy prices rebound from current levels. Fortunately, the Cleveland area has a strong manufacturing sector, which generates a significant share of higher-paying, full time jobs that add balance to overall employment base. So, the area is weathering the slowdown in the energy sector better than those markets where energy is a larger component of overall economic activity.
Total industrial inventory stands at 484 million square feet, primarily in manufacturing and distribution space. Just 5% of the total is flex product. Overall vacancy was unchanged during Q3, holding steady at 5.6%, but that is 60 basis points lower year-over-year. At current activity levels, the vacancy rate should continue to move lower at modest pace. In 2015, expansion by tool and die makers has been driving
5.6%VACANCY
$3.82AVG. SF RENTAL RATES
526,885NET SF ABSORPTION
483,887,262 SF INVENTORY
1,932,708SF UNDER CONSTRUCTION
3
1,547,008 1,528,820
660,596
1,068,177
526,885
0
400,000
800,000
1,200,000
1,600,000
2,000,000
2014 Q3
2014 Q4
2015 Q1
2015 Q2
2015 Q3
Squa
re F
eet
6.2%
5.9%
5.8%
5.6% 5.6%
5.25%
5.50%
5.75%
6.00%
6.25%
2014 Q3
2014 Q4
2015 Q1
2015 Q2
2015 Q3
NET SF ABSORPTION
VACANCY RATE
CLEVELAND
lee-associates.com 31 LEE OVERVIEW KEY MARKET SNAPSHOTS 5 NATIONWIDE LEE OFFICESNATIONAL OVERVIEW2 4 SIGNIFICANT TRANSACTIONS
Key Market Snapshots
CLEVELAND - TRENDING NOW(continued)
3
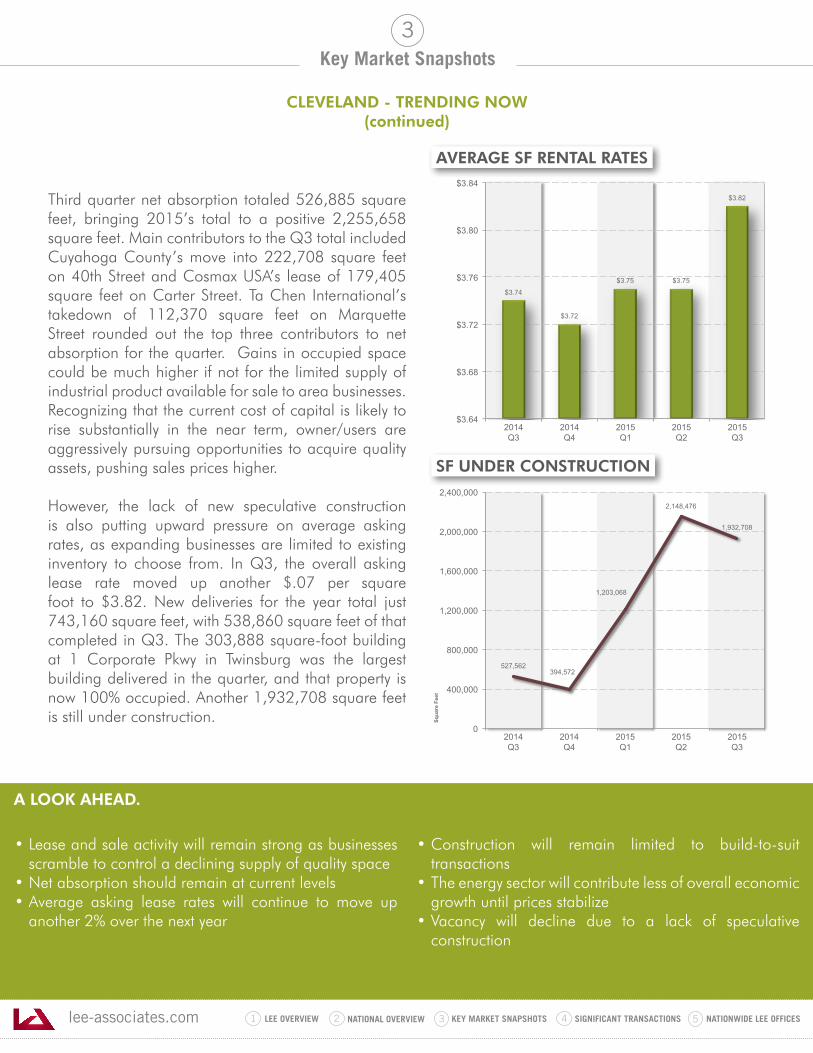
Third quarter net absorption totaled 526,885 square feet, bringing 2015’s total to a positive 2,255,658 square feet. Main contributors to the Q3 total included Cuyahoga County’s move into 222,708 square feet on 40th Street and Cosmax USA’s lease of 179,405 square feet on Carter Street. Ta Chen International’s takedown of 112,370 square feet on Marquette Street rounded out the top three contributors to net absorption for the quarter. Gains in occupied space could be much higher if not for the limited supply of industrial product available for sale to area businesses. Recognizing that the current cost of capital is likely to rise substantially in the near term, owner/users are aggressively pursuing opportunities to acquire quality assets, pushing sales prices higher.
However, the lack of new speculative construction is also putting upward pressure on average asking rates, as expanding businesses are limited to existing inventory to choose from. In Q3, the overall asking lease rate moved up another $.07 per square foot to $3.82. New deliveries for the year total just 743,160 square feet, with 538,860 square feet of that completed in Q3. The 303,888 square-foot building at 1 Corporate Pkwy in Twinsburg was the largest building delivered in the quarter, and that property is now 100% occupied. Another 1,932,708 square feet is still under construction.
• Lease and sale activity will remain strong as businesses scramble to control a declining supply of quality space
• Net absorption should remain at current levels• Average asking lease rates will continue to move up
another 2% over the next year
• Construction will remain limited to build-to-suit transactions
• The energy sector will contribute less of overall economic growth until prices stabilize
• Vacancy will decline due to a lack of speculative construction
$3.74
$3.72
$3.75 $3.75
$3.82
$3.64
$3.68
$3.72
$3.76
$3.80
$3.84
2014 Q3
2014 Q4
2015 Q1
2015 Q2
2015 Q3
527,562 394,572
1,203,068
2,148,476
1,932,708
0
400,000
800,000
1,200,000
1,600,000
2,000,000
2,400,000
2014 Q3
2014 Q4
2015 Q1
2015 Q2
2015 Q3
Squa
re F
eet
SF UNDER CONSTRUCTION
AVERAGE SF RENTAL RATES
A LOOK AHEAD.
lee-associates.com 31 LEE OVERVIEW KEY MARKET SNAPSHOTS 5 NATIONWIDE LEE OFFICESNATIONAL OVERVIEW2 4 SIGNIFICANT TRANSACTIONS
Key Market Snapshots
TRENDING NOW
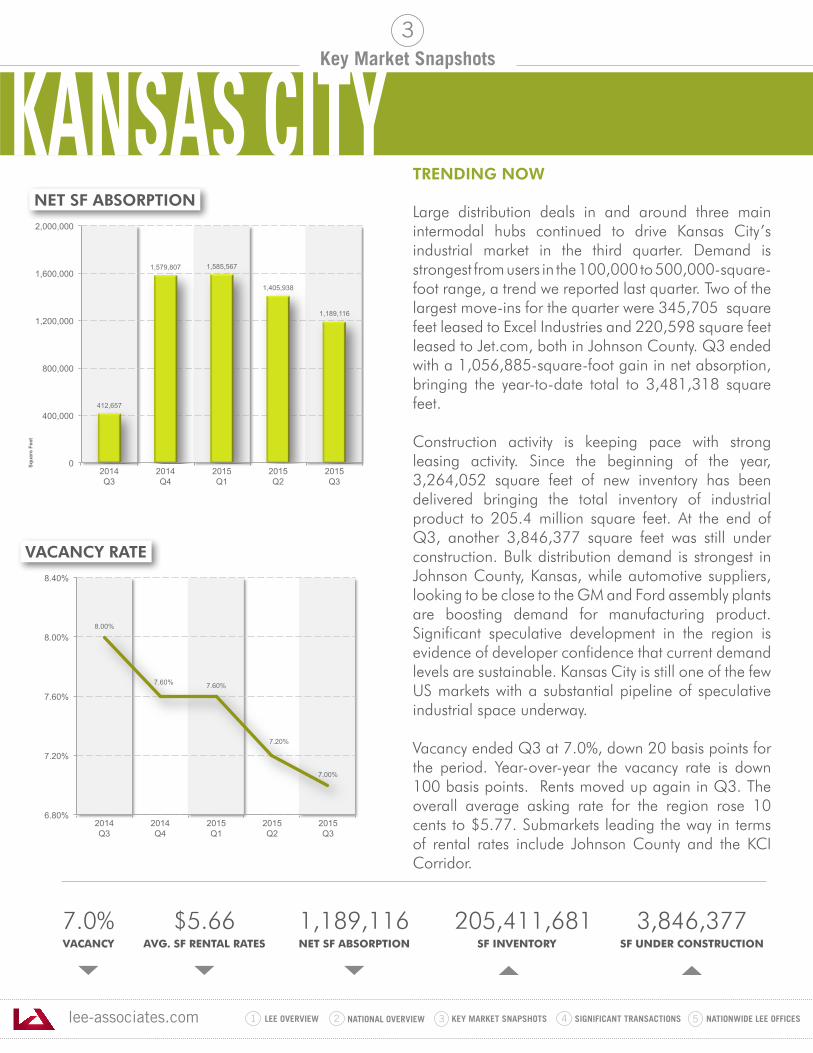
Large distribution deals in and around three main intermodal hubs continued to drive Kansas City’s industrial market in the third quarter. Demand is strongest from users in the 100,000 to 500,000-square-foot range, a trend we reported last quarter. Two of the largest move-ins for the quarter were 345,705 square feet leased to Excel Industries and 220,598 square feet leased to Jet.com, both in Johnson County. Q3 ended with a 1,056,885-square-foot gain in net absorption, bringing the year-to-date total to 3,481,318 square feet.
Construction activity is keeping pace with strong leasing activity. Since the beginning of the year, 3,264,052 square feet of new inventory has been delivered bringing the total inventory of industrial product to 205.4 million square feet. At the end of Q3, another 3,846,377 square feet was still under construction. Bulk distribution demand is strongest in Johnson County, Kansas, while automotive suppliers, looking to be close to the GM and Ford assembly plants are boosting demand for manufacturing product. Significant speculative development in the region is evidence of developer confidence that current demand levels are sustainable. Kansas City is still one of the few US markets with a substantial pipeline of speculative industrial space underway.
Vacancy ended Q3 at 7.0%, down 20 basis points for the period. Year-over-year the vacancy rate is down 100 basis points. Rents moved up again in Q3. The overall average asking rate for the region rose 10 cents to $5.77. Submarkets leading the way in terms of rental rates include Johnson County and the KCI Corridor.
7.0%VACANCY
$5.66AVG. SF RENTAL RATES
1,189,116NET SF ABSORPTION
205,411,681 SF INVENTORY
3,846,377SF UNDER CONSTRUCTION
3
412,657
1,579,807 1,585,567
1,405,938
1,189,116
0
400,000
800,000
1,200,000
1,600,000
2,000,000
2014 Q3
2014 Q4
2015 Q1
2015 Q2
2015 Q3
Squa
re F
eet
8.00%
7.60% 7.60%
7.20%
7.00%
6.80%
7.20%
7.60%
8.00%
8.40%
2014 Q3
2014 Q4
2015 Q1
2015 Q2
2015 Q3
NET SF ABSORPTION
VACANCY RATE
KANSAS CITY
lee-associates.com 31 LEE OVERVIEW KEY MARKET SNAPSHOTS 5 NATIONWIDE LEE OFFICESNATIONAL OVERVIEW2 4 SIGNIFICANT TRANSACTIONS
Key Market Snapshots
KANSAS CITY - TRENDING NOW(continued)
3
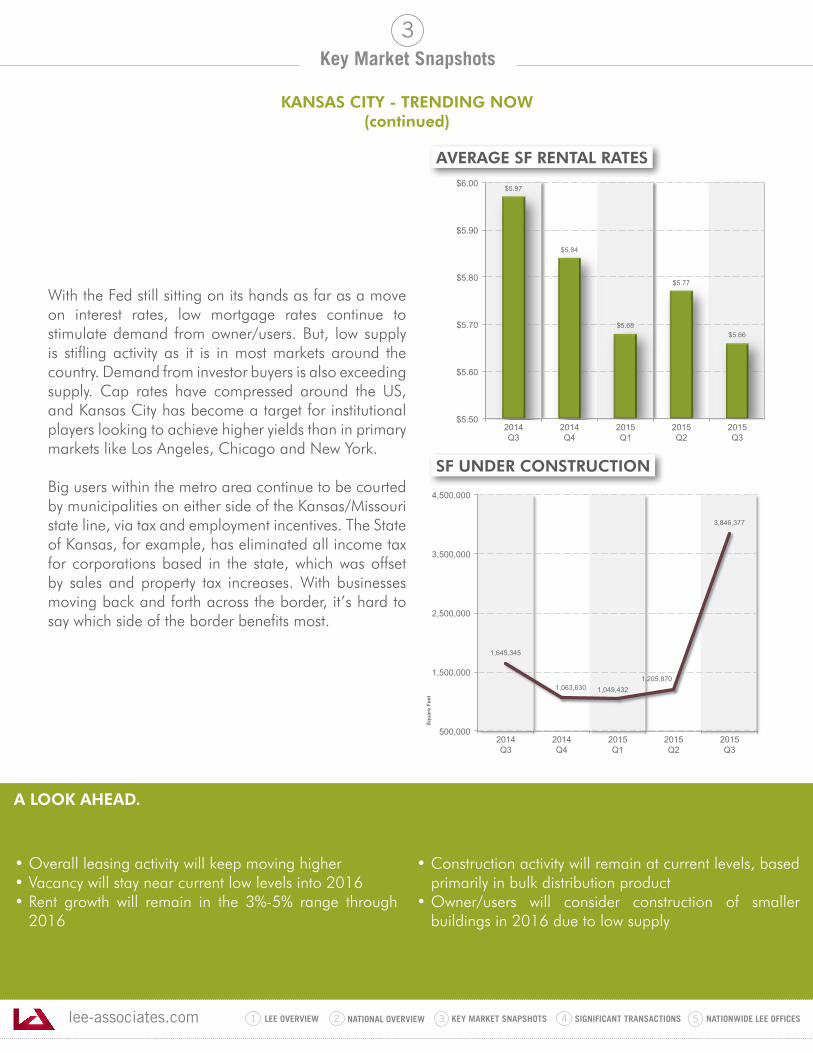
With the Fed still sitting on its hands as far as a move on interest rates, low mortgage rates continue to stimulate demand from owner/users. But, low supply is stifling activity as it is in most markets around the country. Demand from investor buyers is also exceeding supply. Cap rates have compressed around the US, and Kansas City has become a target for institutional players looking to achieve higher yields than in primary markets like Los Angeles, Chicago and New York.
Big users within the metro area continue to be courted by municipalities on either side of the Kansas/Missouri state line, via tax and employment incentives. The State of Kansas, for example, has eliminated all income tax for corporations based in the state, which was offset by sales and property tax increases. With businesses moving back and forth across the border, it’s hard to say which side of the border benefits most.
• Overall leasing activity will keep moving higher• Vacancy will stay near current low levels into 2016 • Rent growth will remain in the 3%-5% range through
2016
• Construction activity will remain at current levels, based primarily in bulk distribution product
• Owner/users will consider construction of smaller buildings in 2016 due to low supply
$5.97
$5.84
$5.68
$5.77
$5.66
$5.50
$5.60
$5.70
$5.80
$5.90
$6.00
2014 Q3
2014 Q4
2015 Q1
2015 Q2
2015 Q3
SF UNDER CONSTRUCTION
AVERAGE SF RENTAL RATES
1,645,345
1,063,630 1,049,432 1,205,870
3,846,377
500,000
1,500,000
2,500,000
3,500,000
4,500,000
2014 Q3
2014 Q4
2015 Q1
2015 Q2
2015 Q3
Squa
re F
eet
A LOOK AHEAD.
lee-associates.com 31 LEE OVERVIEW KEY MARKET SNAPSHOTS 5 NATIONWIDE LEE OFFICESNATIONAL OVERVIEW2 4 SIGNIFICANT TRANSACTIONS
Key Market Snapshots
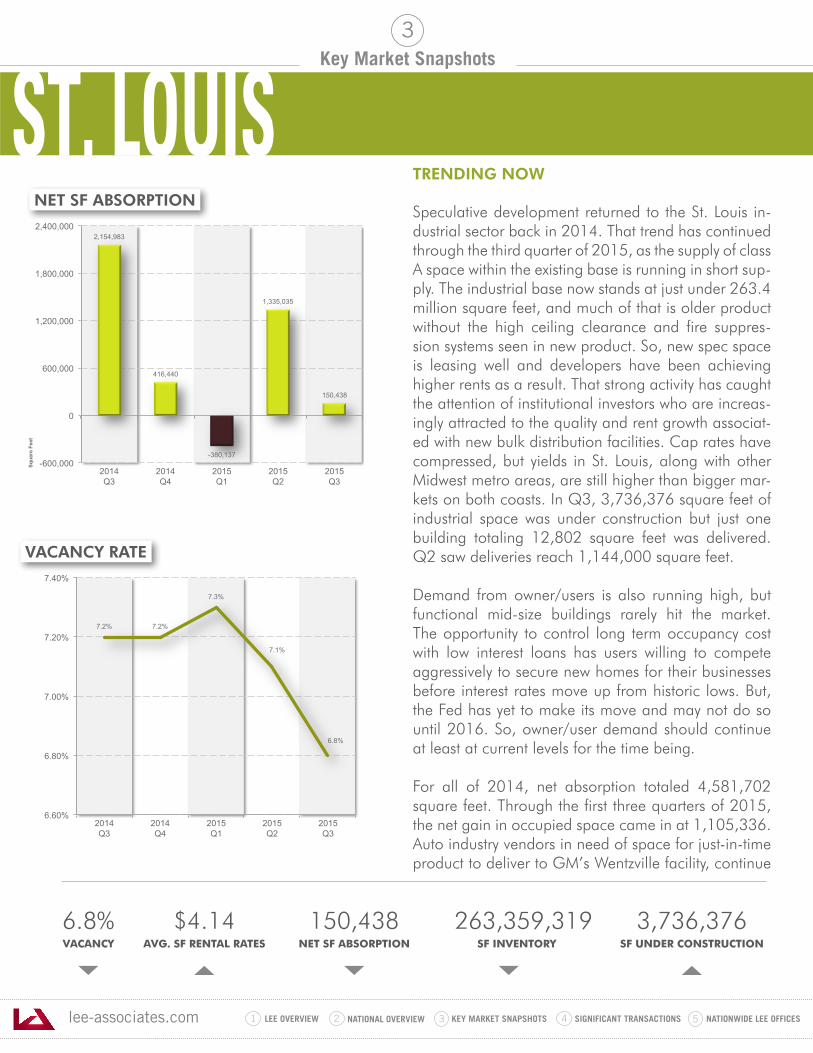
TRENDING NOW
Speculative development returned to the St. Louis in-dustrial sector back in 2014. That trend has continued through the third quarter of 2015, as the supply of class A space within the existing base is running in short sup-ply. The industrial base now stands at just under 263.4 million square feet, and much of that is older product without the high ceiling clearance and fire suppres-sion systems seen in new product. So, new spec space is leasing well and developers have been achieving higher rents as a result. That strong activity has caught the attention of institutional investors who are increas-ingly attracted to the quality and rent growth associat-ed with new bulk distribution facilities. Cap rates have compressed, but yields in St. Louis, along with other Midwest metro areas, are still higher than bigger mar-kets on both coasts. In Q3, 3,736,376 square feet of industrial space was under construction but just one building totaling 12,802 square feet was delivered. Q2 saw deliveries reach 1,144,000 square feet.
Demand from owner/users is also running high, but functional mid-size buildings rarely hit the market. The opportunity to control long term occupancy cost with low interest loans has users willing to compete aggressively to secure new homes for their businesses before interest rates move up from historic lows. But, the Fed has yet to make its move and may not do so until 2016. So, owner/user demand should continue at least at current levels for the time being.
For all of 2014, net absorption totaled 4,581,702 square feet. Through the first three quarters of 2015, the net gain in occupied space came in at 1,105,336. Auto industry vendors in need of space for just-in-time product to deliver to GM’s Wentzville facility, continue
6.8%VACANCY
$4.14AVG. SF RENTAL RATES
150,438NET SF ABSORPTION
263,359,319 SF INVENTORY
3,736,376SF UNDER CONSTRUCTION
3
2,154,983
416,440
-380,137
1,335,035
150,438
-600,000
0
600,000
1,200,000
1,800,000
2,400,000
2014 Q3
2014 Q4
2015 Q1
2015 Q2
2015 Q3
Squa
re F
eet
7.2% 7.2%
7.3%
7.1%
6.8%
6.60%
6.80%
7.00%
7.20%
7.40%
2014 Q3
2014 Q4
2015 Q1
2015 Q2
2015 Q3
NET SF ABSORPTION
VACANCY RATE
ST. LOUIS
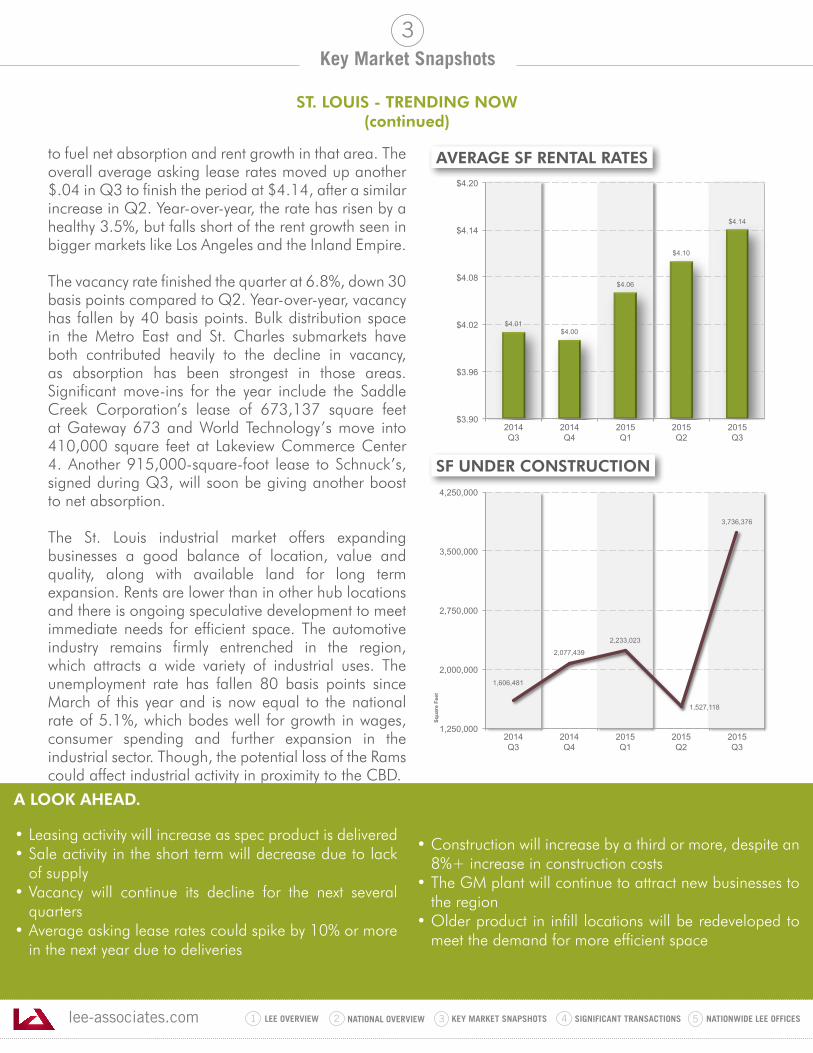
lee-associates.com 31 LEE OVERVIEW KEY MARKET SNAPSHOTS 5 NATIONWIDE LEE OFFICESNATIONAL OVERVIEW2 4 SIGNIFICANT TRANSACTIONS
Key Market Snapshots
ST. LOUIS - TRENDING NOW(continued)
3
to fuel net absorption and rent growth in that area. The overall average asking lease rates moved up another $.04 in Q3 to finish the period at $4.14, after a similar increase in Q2. Year-over-year, the rate has risen by a healthy 3.5%, but falls short of the rent growth seen in bigger markets like Los Angeles and the Inland Empire.
The vacancy rate finished the quarter at 6.8%, down 30 basis points compared to Q2. Year-over-year, vacancy has fallen by 40 basis points. Bulk distribution space in the Metro East and St. Charles submarkets have both contributed heavily to the decline in vacancy, as absorption has been strongest in those areas. Significant move-ins for the year include the Saddle Creek Corporation’s lease of 673,137 square feet at Gateway 673 and World Technology’s move into 410,000 square feet at Lakeview Commerce Center 4. Another 915,000-square-foot lease to Schnuck’s, signed during Q3, will soon be giving another boost to net absorption.
The St. Louis industrial market offers expanding businesses a good balance of location, value and quality, along with available land for long term expansion. Rents are lower than in other hub locations and there is ongoing speculative development to meet immediate needs for efficient space. The automotive industry remains firmly entrenched in the region, which attracts a wide variety of industrial uses. The unemployment rate has fallen 80 basis points since March of this year and is now equal to the national rate of 5.1%, which bodes well for growth in wages, consumer spending and further expansion in the industrial sector. Though, the potential loss of the Rams could affect industrial activity in proximity to the CBD.
• Leasing activity will increase as spec product is delivered• Sale activity in the short term will decrease due to lack
of supply • Vacancy will continue its decline for the next several
quarters• Average asking lease rates could spike by 10% or more
in the next year due to deliveries
• Construction will increase by a third or more, despite an 8%+ increase in construction costs
• The GM plant will continue to attract new businesses to the region
• Older product in infill locations will be redeveloped to meet the demand for more efficient space
$4.01 $4.00
$4.06
$4.10
$4.14
$3.90
$3.96
$4.02
$4.08
$4.14
$4.20
2014 Q3
2014 Q4
2015 Q1
2015 Q2
2015 Q3
1,606,481
2,077,439
2,233,023
1,527,118
3,736,376
1,250,000
2,000,000
2,750,000
3,500,000
4,250,000
2014 Q3
2014 Q4
2015 Q1
2015 Q2
2015 Q3
Squa
re F
eet
SF UNDER CONSTRUCTION
AVERAGE SF RENTAL RATES
A LOOK AHEAD.
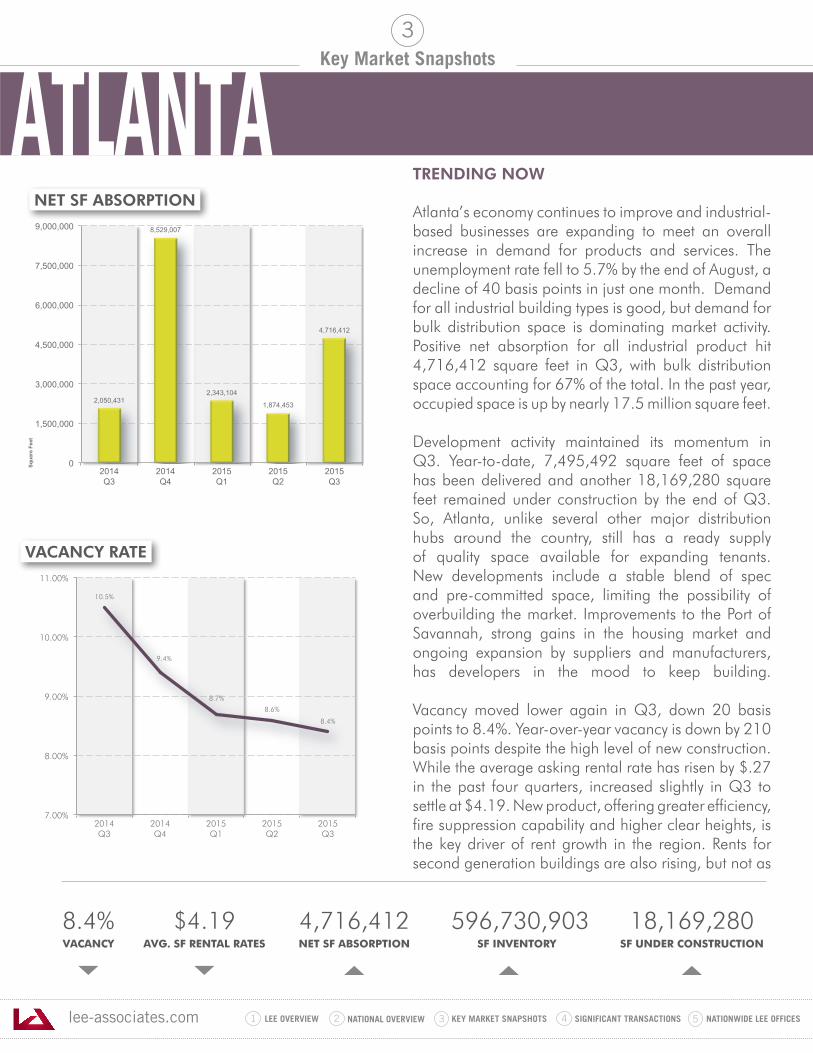
lee-associates.com 31 LEE OVERVIEW KEY MARKET SNAPSHOTS 5 NATIONWIDE LEE OFFICESNATIONAL OVERVIEW2 4 SIGNIFICANT TRANSACTIONS
Key Market Snapshots
TRENDING NOW
Atlanta’s economy continues to improve and industrial-based businesses are expanding to meet an overall increase in demand for products and services. The unemployment rate fell to 5.7% by the end of August, a decline of 40 basis points in just one month. Demand for all industrial building types is good, but demand for bulk distribution space is dominating market activity. Positive net absorption for all industrial product hit 4,716,412 square feet in Q3, with bulk distribution space accounting for 67% of the total. In the past year, occupied space is up by nearly 17.5 million square feet.
Development activity maintained its momentum in Q3. Year-to-date, 7,495,492 square feet of space has been delivered and another 18,169,280 square feet remained under construction by the end of Q3. So, Atlanta, unlike several other major distribution hubs around the country, still has a ready supply of quality space available for expanding tenants. New developments include a stable blend of spec and pre-committed space, limiting the possibility of overbuilding the market. Improvements to the Port of Savannah, strong gains in the housing market and ongoing expansion by suppliers and manufacturers, has developers in the mood to keep building.
Vacancy moved lower again in Q3, down 20 basis points to 8.4%. Year-over-year vacancy is down by 210 basis points despite the high level of new construction. While the average asking rental rate has risen by $.27 in the past four quarters, increased slightly in Q3 to settle at $4.19. New product, offering greater efficiency, fire suppression capability and higher clear heights, is the key driver of rent growth in the region. Rents for second generation buildings are also rising, but not as
8.4%VACANCY
$4.19AVG. SF RENTAL RATES
4,716,412 NET SF ABSORPTION
596,730,903 SF INVENTORY
18,169,280SF UNDER CONSTRUCTION
3
2,050,431
8,529,007
2,343,104
1,874,453
4,716,412
0
1,500,000
3,000,000
4,500,000
6,000,000
7,500,000
9,000,000
2014 Q3
2014 Q4
2015 Q1
2015 Q2
2015 Q3
Squa
re F
eet
10.5%
9.4%
8.7%
8.6%
8.4%
7.00%
8.00%
9.00%
10.00%
11.00%
2014 Q3
2014 Q4
2015 Q1
2015 Q2
2015 Q3
NET SF ABSORPTION
VACANCY RATE
ATLANTA
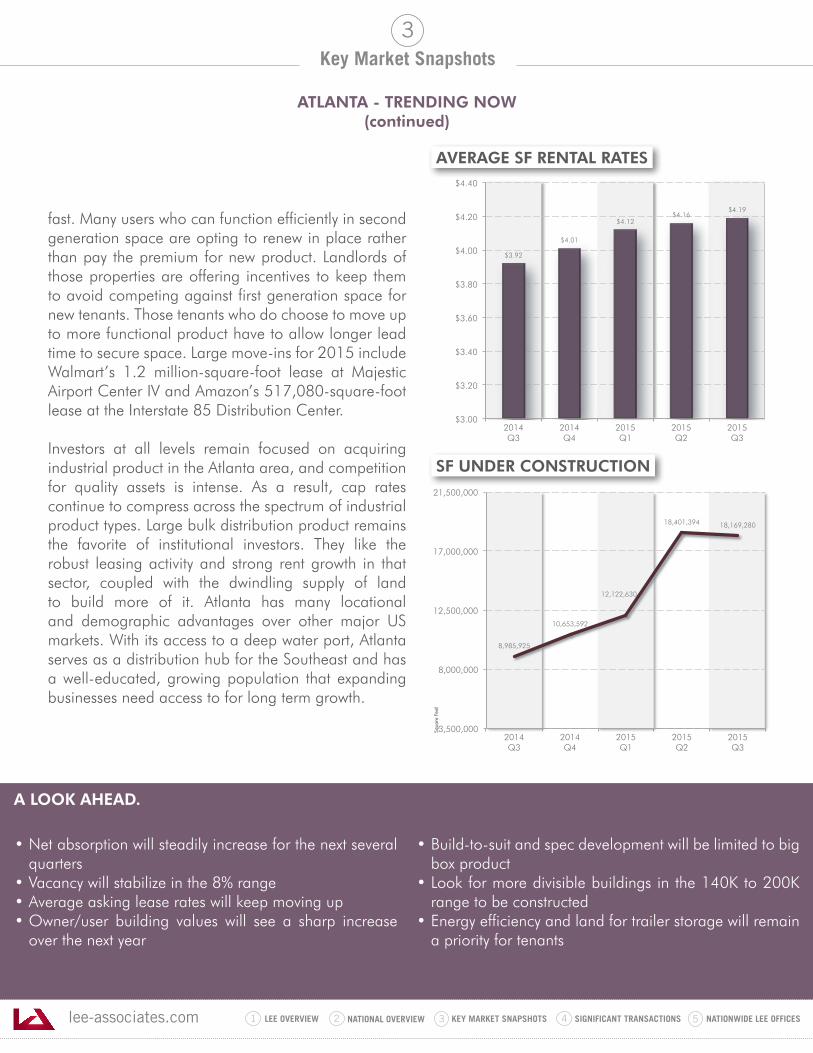
lee-associates.com 31 LEE OVERVIEW KEY MARKET SNAPSHOTS 5 NATIONWIDE LEE OFFICESNATIONAL OVERVIEW2 4 SIGNIFICANT TRANSACTIONS
Key Market Snapshots
ATLANTA - TRENDING NOW(continued)
3
fast. Many users who can function efficiently in second generation space are opting to renew in place rather than pay the premium for new product. Landlords of those properties are offering incentives to keep them to avoid competing against first generation space for new tenants. Those tenants who do choose to move up to more functional product have to allow longer lead time to secure space. Large move-ins for 2015 include Walmart’s 1.2 million-square-foot lease at Majestic Airport Center IV and Amazon’s 517,080-square-foot lease at the Interstate 85 Distribution Center.
Investors at all levels remain focused on acquiring industrial product in the Atlanta area, and competition for quality assets is intense. As a result, cap rates continue to compress across the spectrum of industrial product types. Large bulk distribution product remains the favorite of institutional investors. They like the robust leasing activity and strong rent growth in that sector, coupled with the dwindling supply of land to build more of it. Atlanta has many locational and demographic advantages over other major US markets. With its access to a deep water port, Atlanta serves as a distribution hub for the Southeast and has a well-educated, growing population that expanding businesses need access to for long term growth.
• Net absorption will steadily increase for the next several quarters
• Vacancy will stabilize in the 8% range • Average asking lease rates will keep moving up• Owner/user building values will see a sharp increase
over the next year
• Build-to-suit and spec development will be limited to big box product
• Look for more divisible buildings in the 140K to 200K range to be constructed
• Energy efficiency and land for trailer storage will remain a priority for tenants
$3.92
$4.01
$4.12 $4.16
$4.19
$3.00
$3.20
$3.40
$3.60
$3.80
$4.00
$4.20
$4.40
2014 Q3
2014 Q4
2015 Q1
2015 Q2
2015 Q3
8,985,925
10,653,592
12,122,630
18,401,394 18,169,280
3,500,000
8,000,000
12,500,000
17,000,000
21,500,000
2014 Q3
2014 Q4
2015 Q1
2015 Q2
2015 Q3
Squa
re F
eet
SF UNDER CONSTRUCTION
AVERAGE SF RENTAL RATES
A LOOK AHEAD.
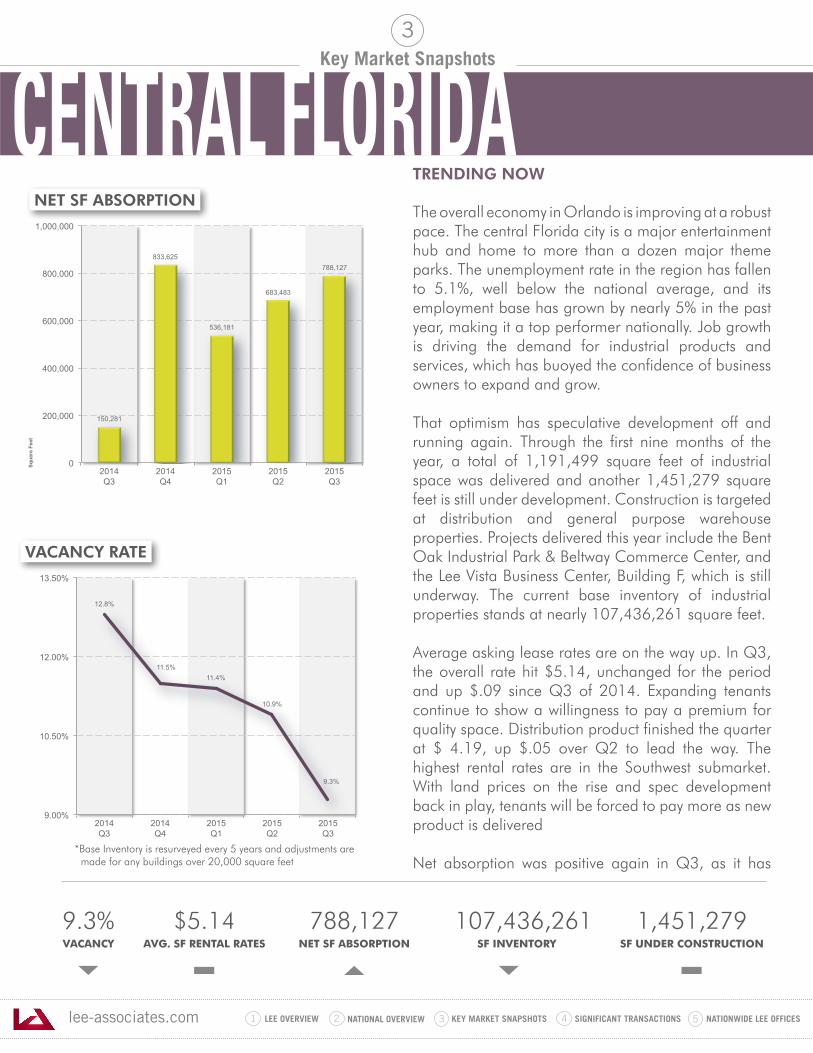
lee-associates.com 31 LEE OVERVIEW KEY MARKET SNAPSHOTS 5 NATIONWIDE LEE OFFICESNATIONAL OVERVIEW2 4 SIGNIFICANT TRANSACTIONS
Key Market Snapshots
TRENDING NOW
The overall economy in Orlando is improving at a robust pace. The central Florida city is a major entertainment hub and home to more than a dozen major theme parks. The unemployment rate in the region has fallen to 5.1%, well below the national average, and its employment base has grown by nearly 5% in the past year, making it a top performer nationally. Job growth is driving the demand for industrial products and services, which has buoyed the confidence of business owners to expand and grow.
That optimism has speculative development off and running again. Through the first nine months of the year, a total of 1,191,499 square feet of industrial space was delivered and another 1,451,279 square feet is still under development. Construction is targeted at distribution and general purpose warehouse properties. Projects delivered this year include the Bent Oak Industrial Park & Beltway Commerce Center, and the Lee Vista Business Center, Building F, which is still underway. The current base inventory of industrial properties stands at nearly 107,436,261 square feet.
Average asking lease rates are on the way up. In Q3, the overall rate hit $5.14, unchanged for the period and up $.09 since Q3 of 2014. Expanding tenants continue to show a willingness to pay a premium for quality space. Distribution product finished the quarter at $ 4.19, up $.05 over Q2 to lead the way. The highest rental rates are in the Southwest submarket. With land prices on the rise and spec development back in play, tenants will be forced to pay more as new product is delivered
Net absorption was positive again in Q3, as it has
9.3%VACANCY
$5.14AVG. SF RENTAL RATES
788,127NET SF ABSORPTION
107,436,261 SF INVENTORY
1,451,279SF UNDER CONSTRUCTION
3
150,281
833,625
536,181
683,483
788,127
0
200,000
400,000
600,000
800,000
1,000,000
2014 Q3
2014 Q4
2015 Q1
2015 Q2
2015 Q3
Squa
re F
eet
12.8%
11.5% 11.4%
10.9%
9.3%
9.00%
10.50%
12.00%
13.50%
2014 Q3
2014 Q4
2015 Q1
2015 Q2
2015 Q3
NET SF ABSORPTION
VACANCY RATE
*Base Inventory is resurveyed every 5 years and adjustments are made for any buildings over 20,000 square feet
CENTRAL FLORIDA
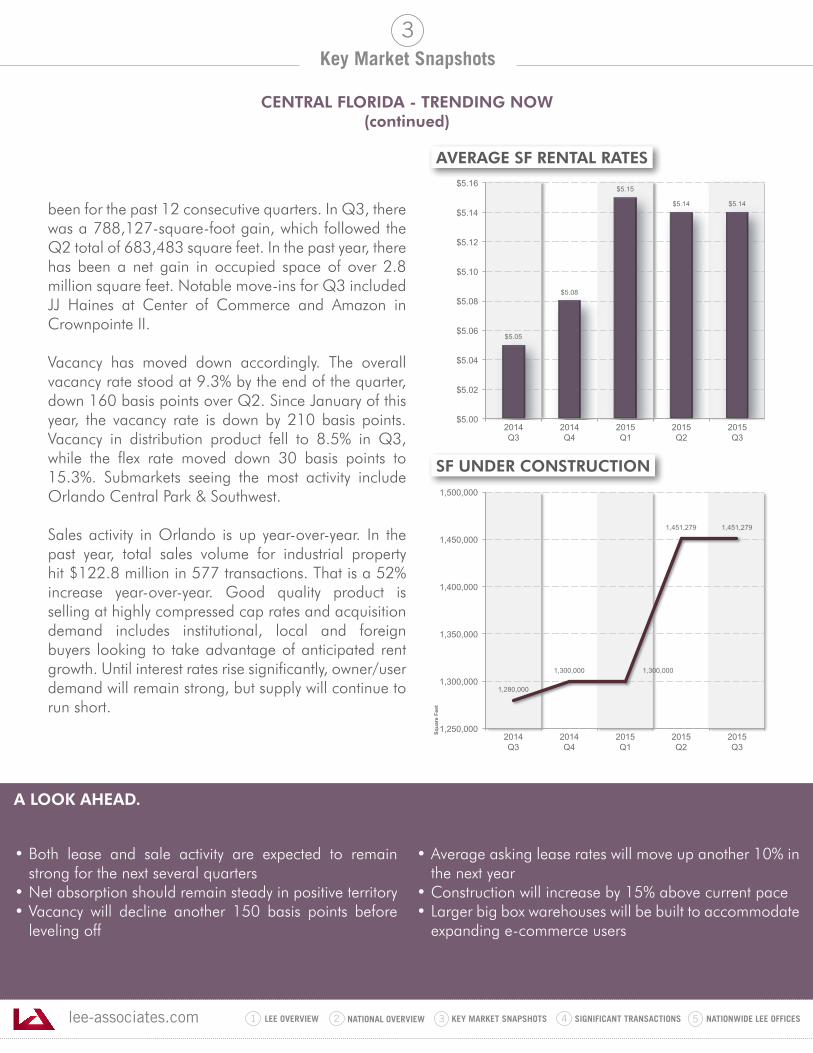
lee-associates.com 31 LEE OVERVIEW KEY MARKET SNAPSHOTS 5 NATIONWIDE LEE OFFICESNATIONAL OVERVIEW2 4 SIGNIFICANT TRANSACTIONS
Key Market Snapshots
CENTRAL FLORIDA - TRENDING NOW(continued)
3
been for the past 12 consecutive quarters. In Q3, there was a 788,127-square-foot gain, which followed the Q2 total of 683,483 square feet. In the past year, there has been a net gain in occupied space of over 2.8 million square feet. Notable move-ins for Q3 included JJ Haines at Center of Commerce and Amazon in Crownpointe II.
Vacancy has moved down accordingly. The overall vacancy rate stood at 9.3% by the end of the quarter, down 160 basis points over Q2. Since January of this year, the vacancy rate is down by 210 basis points. Vacancy in distribution product fell to 8.5% in Q3, while the flex rate moved down 30 basis points to 15.3%. Submarkets seeing the most activity include Orlando Central Park & Southwest.
Sales activity in Orlando is up year-over-year. In the past year, total sales volume for industrial property hit $122.8 million in 577 transactions. That is a 52% increase year-over-year. Good quality product is selling at highly compressed cap rates and acquisition demand includes institutional, local and foreign buyers looking to take advantage of anticipated rent growth. Until interest rates rise significantly, owner/user demand will remain strong, but supply will continue to run short.
• Both lease and sale activity are expected to remain strong for the next several quarters
• Net absorption should remain steady in positive territory• Vacancy will decline another 150 basis points before
leveling off
• Average asking lease rates will move up another 10% in the next year
• Construction will increase by 15% above current pace• Larger big box warehouses will be built to accommodate
expanding e-commerce users
$5.05
$5.08
$5.15
$5.14 $5.14
$5.00
$5.02
$5.04
$5.06
$5.08
$5.10
$5.12
$5.14
$5.16
2014 Q3
2014 Q4
2015 Q1
2015 Q2
2015 Q3
1,280,000
1,300,000 1,300,000
1,451,279 1,451,279
1,250,000
1,300,000
1,350,000
1,400,000
1,450,000
1,500,000
2014 Q3
2014 Q4
2015 Q1
2015 Q2
2015 Q3
Squa
re F
eet
SF UNDER CONSTRUCTION
AVERAGE SF RENTAL RATES
A LOOK AHEAD.
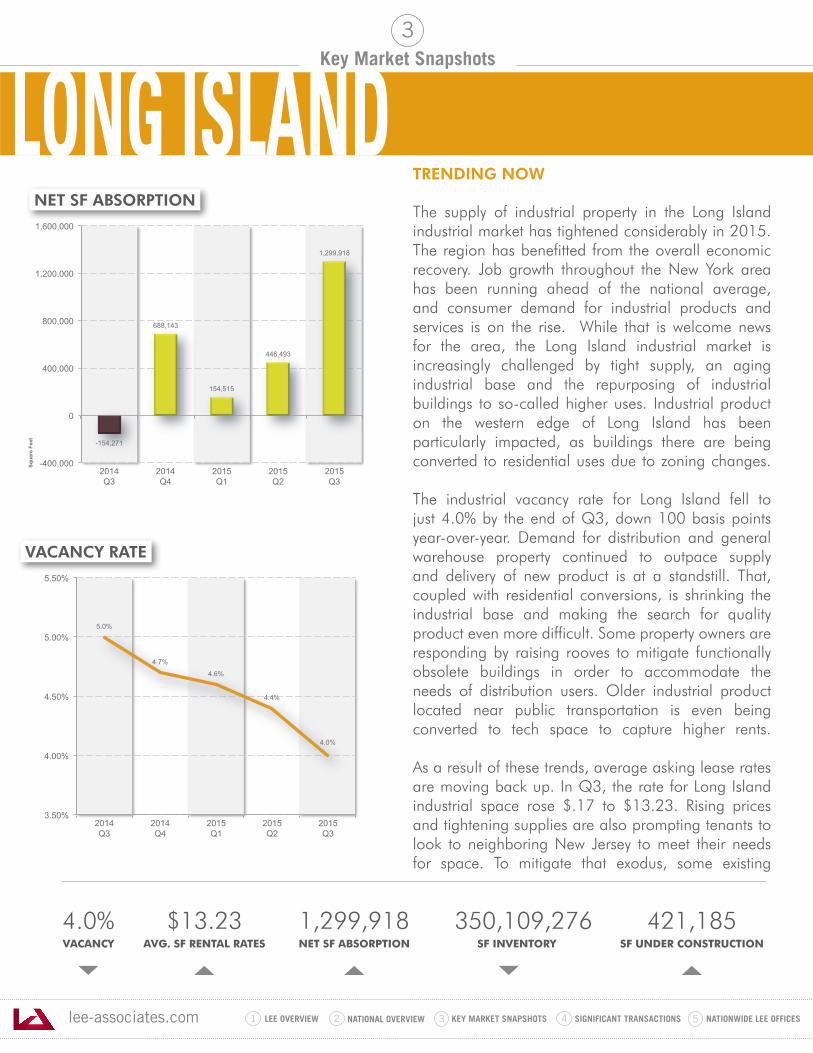
lee-associates.com 31 LEE OVERVIEW KEY MARKET SNAPSHOTS 5 NATIONWIDE LEE OFFICESNATIONAL OVERVIEW2 4 SIGNIFICANT TRANSACTIONS
Key Market Snapshots
TRENDING NOW
The supply of industrial property in the Long Island industrial market has tightened considerably in 2015. The region has benefitted from the overall economic recovery. Job growth throughout the New York area has been running ahead of the national average, and consumer demand for industrial products and services is on the rise. While that is welcome news for the area, the Long Island industrial market is increasingly challenged by tight supply, an aging industrial base and the repurposing of industrial buildings to so-called higher uses. Industrial product on the western edge of Long Island has been particularly impacted, as buildings there are being converted to residential uses due to zoning changes.
The industrial vacancy rate for Long Island fell to just 4.0% by the end of Q3, down 100 basis points year-over-year. Demand for distribution and general warehouse property continued to outpace supply and delivery of new product is at a standstill. That, coupled with residential conversions, is shrinking the industrial base and making the search for quality product even more difficult. Some property owners are responding by raising rooves to mitigate functionally obsolete buildings in order to accommodate the needs of distribution users. Older industrial product located near public transportation is even being converted to tech space to capture higher rents.
As a result of these trends, average asking lease rates are moving back up. In Q3, the rate for Long Island industrial space rose $.17 to $13.23. Rising prices and tightening supplies are also prompting tenants to look to neighboring New Jersey to meet their needs for space. To mitigate that exodus, some existing
4.0%VACANCY
$13.23AVG. SF RENTAL RATES
1,299,918NET SF ABSORPTION
350,109,276 SF INVENTORY
421,185SF UNDER CONSTRUCTION
3
-154,271
688,143
154,515
446,493
1,299,918
-400,000
0
400,000
800,000
1,200,000
1,600,000
2014 Q3
2014 Q4
2015 Q1
2015 Q2
2015 Q3
Squa
re F
eet
5.0%
4.7%
4.6%
4.4%
4.0%
3.50%
4.00%
4.50%
5.00%
5.50%
2014 Q3
2014 Q4
2015 Q1
2015 Q2
2015 Q3
NET SF ABSORPTION
VACANCY RATE
LONG ISLAND
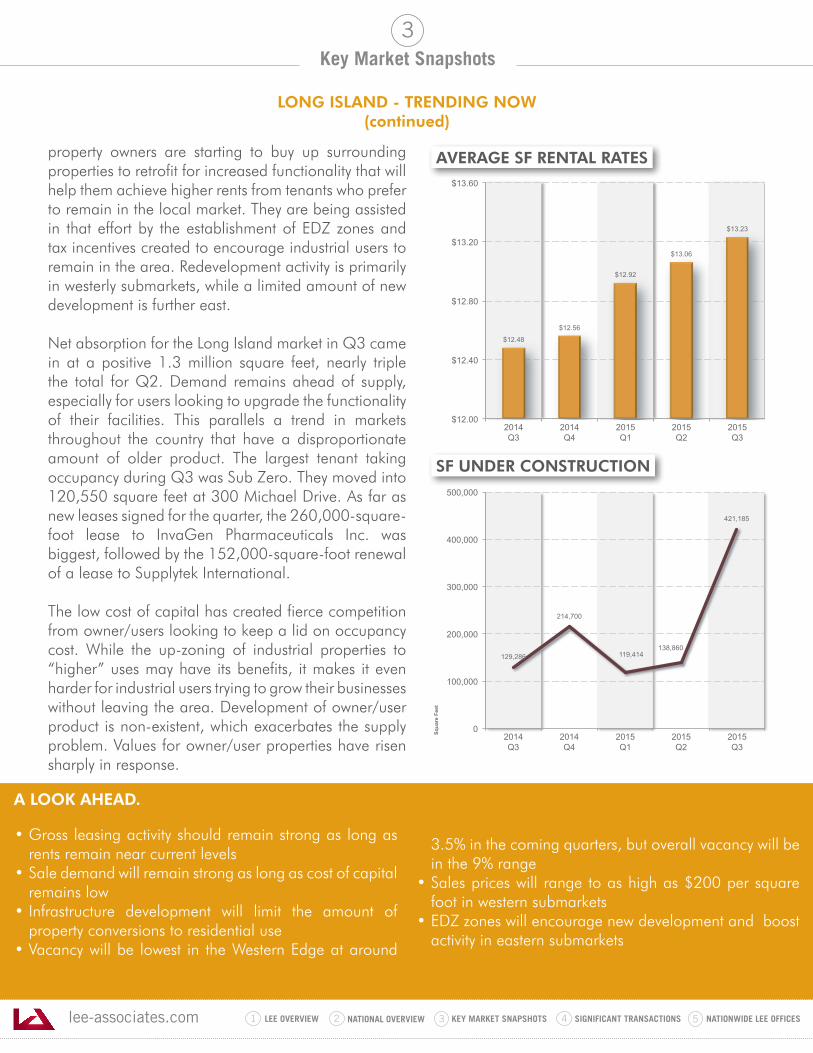
lee-associates.com 31 LEE OVERVIEW KEY MARKET SNAPSHOTS 5 NATIONWIDE LEE OFFICESNATIONAL OVERVIEW2 4 SIGNIFICANT TRANSACTIONS
Key Market Snapshots
LONG ISLAND - TRENDING NOW(continued)
3
property owners are starting to buy up surrounding properties to retrofit for increased functionality that will help them achieve higher rents from tenants who prefer to remain in the local market. They are being assisted in that effort by the establishment of EDZ zones and tax incentives created to encourage industrial users to remain in the area. Redevelopment activity is primarily in westerly submarkets, while a limited amount of new development is further east.
Net absorption for the Long Island market in Q3 came in at a positive 1.3 million square feet, nearly triple the total for Q2. Demand remains ahead of supply, especially for users looking to upgrade the functionality of their facilities. This parallels a trend in markets throughout the country that have a disproportionate amount of older product. The largest tenant taking occupancy during Q3 was Sub Zero. They moved into 120,550 square feet at 300 Michael Drive. As far as new leases signed for the quarter, the 260,000-square-foot lease to InvaGen Pharmaceuticals Inc. was biggest, followed by the 152,000-square-foot renewal of a lease to Supplytek International.
The low cost of capital has created fierce competition from owner/users looking to keep a lid on occupancy cost. While the up-zoning of industrial properties to “higher” uses may have its benefits, it makes it even harder for industrial users trying to grow their businesses without leaving the area. Development of owner/user product is non-existent, which exacerbates the supply problem. Values for owner/user properties have risen sharply in response.
• Gross leasing activity should remain strong as long as rents remain near current levels
• Sale demand will remain strong as long as cost of capital remains low
• Infrastructure development will limit the amount of property conversions to residential use
• Vacancy will be lowest in the Western Edge at around
3.5% in the coming quarters, but overall vacancy will be in the 9% range
• Sales prices will range to as high as $200 per square foot in western submarkets
• EDZ zones will encourage new development and boost activity in eastern submarkets
$12.48
$12.56
$12.92
$13.06
$13.23
$12.00
$12.40
$12.80
$13.20
$13.60
2014 Q3
2014 Q4
2015 Q1
2015 Q2
2015 Q3
129,286
214,700
119,414 138,860
421,185
0
100,000
200,000
300,000
400,000
500,000
2014 Q3
2014 Q4
2015 Q1
2015 Q2
2015 Q3
Squa
re F
eet
SF UNDER CONSTRUCTION
AVERAGE SF RENTAL RATES
A LOOK AHEAD.
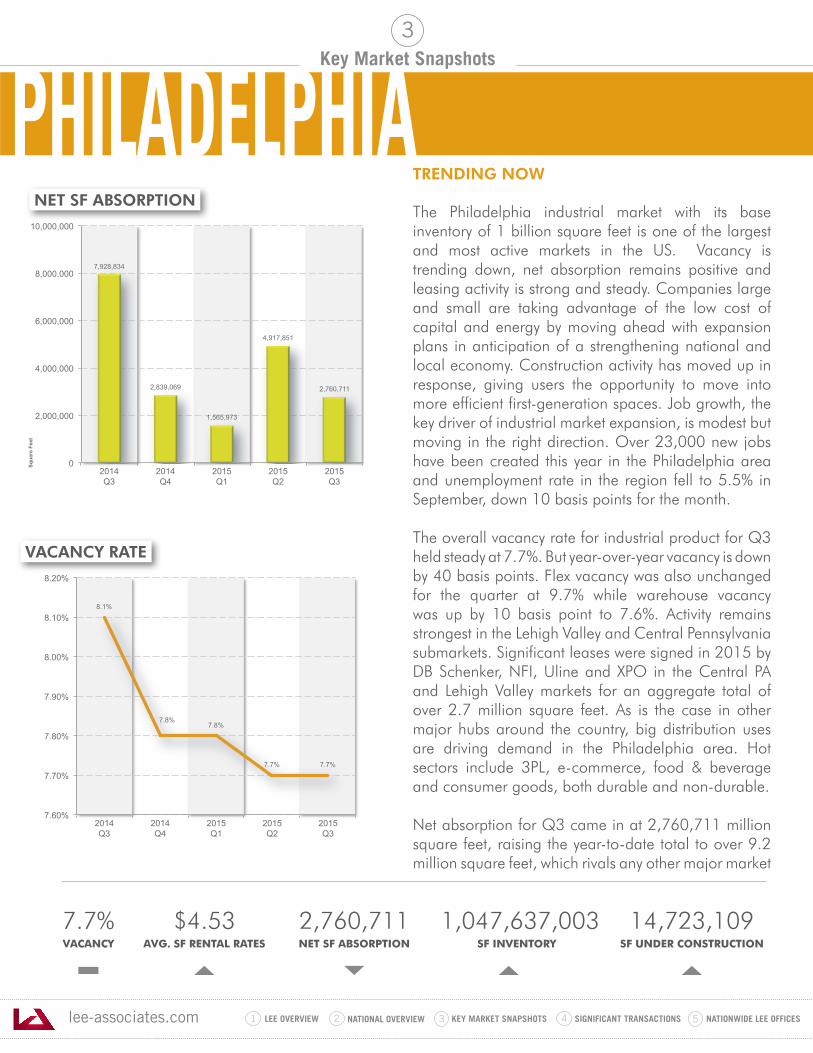
lee-associates.com 31 LEE OVERVIEW KEY MARKET SNAPSHOTS 5 NATIONWIDE LEE OFFICESNATIONAL OVERVIEW2 4 SIGNIFICANT TRANSACTIONS
Key Market Snapshots
TRENDING NOW
The Philadelphia industrial market with its base inventory of 1 billion square feet is one of the largest and most active markets in the US. Vacancy is trending down, net absorption remains positive and leasing activity is strong and steady. Companies large and small are taking advantage of the low cost of capital and energy by moving ahead with expansion plans in anticipation of a strengthening national and local economy. Construction activity has moved up in response, giving users the opportunity to move into more efficient first-generation spaces. Job growth, the key driver of industrial market expansion, is modest but moving in the right direction. Over 23,000 new jobs have been created this year in the Philadelphia area and unemployment rate in the region fell to 5.5% in September, down 10 basis points for the month.
The overall vacancy rate for industrial product for Q3 held steady at 7.7%. But year-over-year vacancy is down by 40 basis points. Flex vacancy was also unchanged for the quarter at 9.7% while warehouse vacancy was up by 10 basis point to 7.6%. Activity remains strongest in the Lehigh Valley and Central Pennsylvania submarkets. Significant leases were signed in 2015 by DB Schenker, NFI, Uline and XPO in the Central PA and Lehigh Valley markets for an aggregate total of over 2.7 million square feet. As is the case in other major hubs around the country, big distribution uses are driving demand in the Philadelphia area. Hot sectors include 3PL, e-commerce, food & beverage and consumer goods, both durable and non-durable.
Net absorption for Q3 came in at 2,760,711 million square feet, raising the year-to-date total to over 9.2 million square feet, which rivals any other major market
7.7%VACANCY
$4.53AVG. SF RENTAL RATES
2,760,711NET SF ABSORPTION
1,047,637,003 SF INVENTORY
14,723,109SF UNDER CONSTRUCTION
3
7,928,834
2,839,069
1,565,973
4,917,851
2,760,711
0
2,000,000
4,000,000
6,000,000
8,000,000
10,000,000
2014 Q3
2014 Q4
2015 Q1
2015 Q2
2015 Q3
Squa
re F
eet
8.1%
7.8% 7.8%
7.7% 7.7%
7.60%
7.70%
7.80%
7.90%
8.00%
8.10%
8.20%
2014 Q3
2014 Q4
2015 Q1
2015 Q2
2015 Q3
NET SF ABSORPTION
VACANCY RATE
PHILADELPHIA
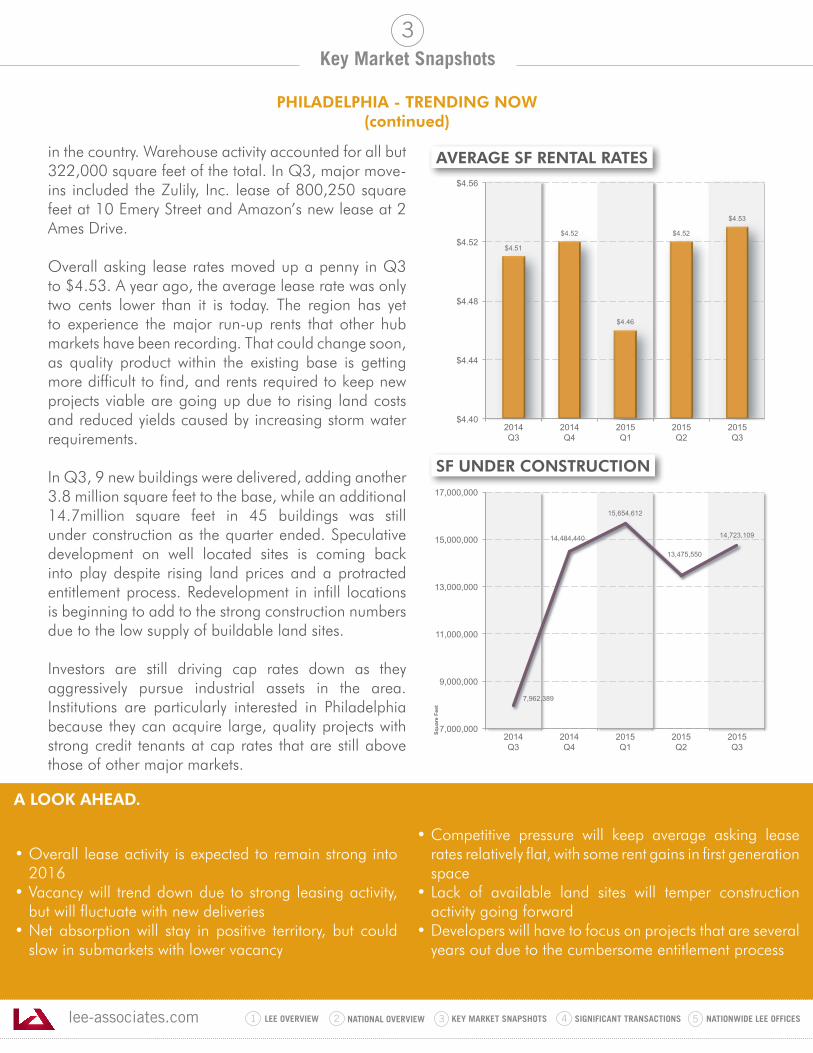
lee-associates.com 31 LEE OVERVIEW KEY MARKET SNAPSHOTS 5 NATIONWIDE LEE OFFICESNATIONAL OVERVIEW2 4 SIGNIFICANT TRANSACTIONS
Key Market Snapshots
PHILADELPHIA - TRENDING NOW(continued)
3
in the country. Warehouse activity accounted for all but 322,000 square feet of the total. In Q3, major move-ins included the Zulily, Inc. lease of 800,250 square feet at 10 Emery Street and Amazon’s new lease at 2 Ames Drive.
Overall asking lease rates moved up a penny in Q3 to $4.53. A year ago, the average lease rate was only two cents lower than it is today. The region has yet to experience the major run-up rents that other hub markets have been recording. That could change soon, as quality product within the existing base is getting more difficult to find, and rents required to keep new projects viable are going up due to rising land costs and reduced yields caused by increasing storm water requirements.
In Q3, 9 new buildings were delivered, adding another 3.8 million square feet to the base, while an additional 14.7million square feet in 45 buildings was still under construction as the quarter ended. Speculative development on well located sites is coming back into play despite rising land prices and a protracted entitlement process. Redevelopment in infill locations is beginning to add to the strong construction numbers due to the low supply of buildable land sites.
Investors are still driving cap rates down as they aggressively pursue industrial assets in the area. Institutions are particularly interested in Philadelphia because they can acquire large, quality projects with strong credit tenants at cap rates that are still above those of other major markets.
• Overall lease activity is expected to remain strong into 2016
• Vacancy will trend down due to strong leasing activity, but will fluctuate with new deliveries
• Net absorption will stay in positive territory, but could slow in submarkets with lower vacancy
• Competitive pressure will keep average asking lease rates relatively flat, with some rent gains in first generation space
• Lack of available land sites will temper construction activity going forward
• Developers will have to focus on projects that are several years out due to the cumbersome entitlement process
$4.51
$4.52
$4.46
$4.52
$4.53
$4.40
$4.44
$4.48
$4.52
$4.56
2014 Q3
2014 Q4
2015 Q1
2015 Q2
2015 Q3
7,962,389
14,484,440
15,654,612
13,475,550
14,723,109
7,000,000
9,000,000
11,000,000
13,000,000
15,000,000
17,000,000
2014 Q3
2014 Q4
2015 Q1
2015 Q2
2015 Q3
Squa
re F
eet
SF UNDER CONSTRUCTION
AVERAGE SF RENTAL RATES
A LOOK AHEAD.
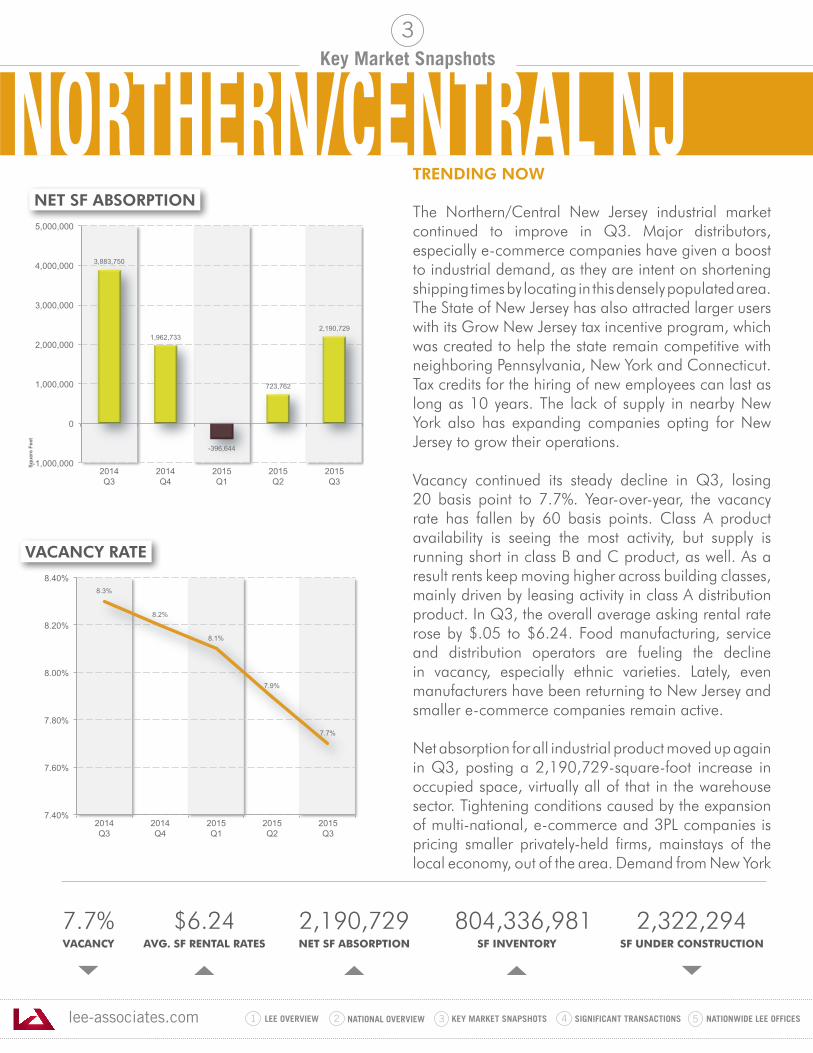
lee-associates.com 31 LEE OVERVIEW KEY MARKET SNAPSHOTS 5 NATIONWIDE LEE OFFICESNATIONAL OVERVIEW2 4 SIGNIFICANT TRANSACTIONS
Key Market Snapshots
TRENDING NOW
The Northern/Central New Jersey industrial market continued to improve in Q3. Major distributors, especially e-commerce companies have given a boost to industrial demand, as they are intent on shortening shipping times by locating in this densely populated area. The State of New Jersey has also attracted larger users with its Grow New Jersey tax incentive program, which was created to help the state remain competitive with neighboring Pennsylvania, New York and Connecticut. Tax credits for the hiring of new employees can last as long as 10 years. The lack of supply in nearby New York also has expanding companies opting for New Jersey to grow their operations.
Vacancy continued its steady decline in Q3, losing 20 basis point to 7.7%. Year-over-year, the vacancy rate has fallen by 60 basis points. Class A product availability is seeing the most activity, but supply is running short in class B and C product, as well. As a result rents keep moving higher across building classes, mainly driven by leasing activity in class A distribution product. In Q3, the overall average asking rental rate rose by $.05 to $6.24. Food manufacturing, service and distribution operators are fueling the decline in vacancy, especially ethnic varieties. Lately, even manufacturers have been returning to New Jersey and smaller e-commerce companies remain active.
Net absorption for all industrial product moved up again in Q3, posting a 2,190,729-square-foot increase in occupied space, virtually all of that in the warehouse sector. Tightening conditions caused by the expansion of multi-national, e-commerce and 3PL companies is pricing smaller privately-held firms, mainstays of the local economy, out of the area. Demand from New York
7.7%VACANCY
$6.24AVG. SF RENTAL RATES
2,190,729NET SF ABSORPTION
804,336,981 SF INVENTORY
2,322,294SF UNDER CONSTRUCTION
3
3,883,750
1,962,733
-396,644
723,762
2,190,729
-1,000,000
0
1,000,000
2,000,000
3,000,000
4,000,000
5,000,000
2014 Q3
2014 Q4
2015 Q1
2015 Q2
2015 Q3
Squa
re F
eet
8.3%
8.2%
8.1%
7.9%
7.7%
7.40%
7.60%
7.80%
8.00%
8.20%
8.40%
2014 Q3
2014 Q4
2015 Q1
2015 Q2
2015 Q3
NET SF ABSORPTION
VACANCY RATE
NORTHERN/CENTRAL NJ
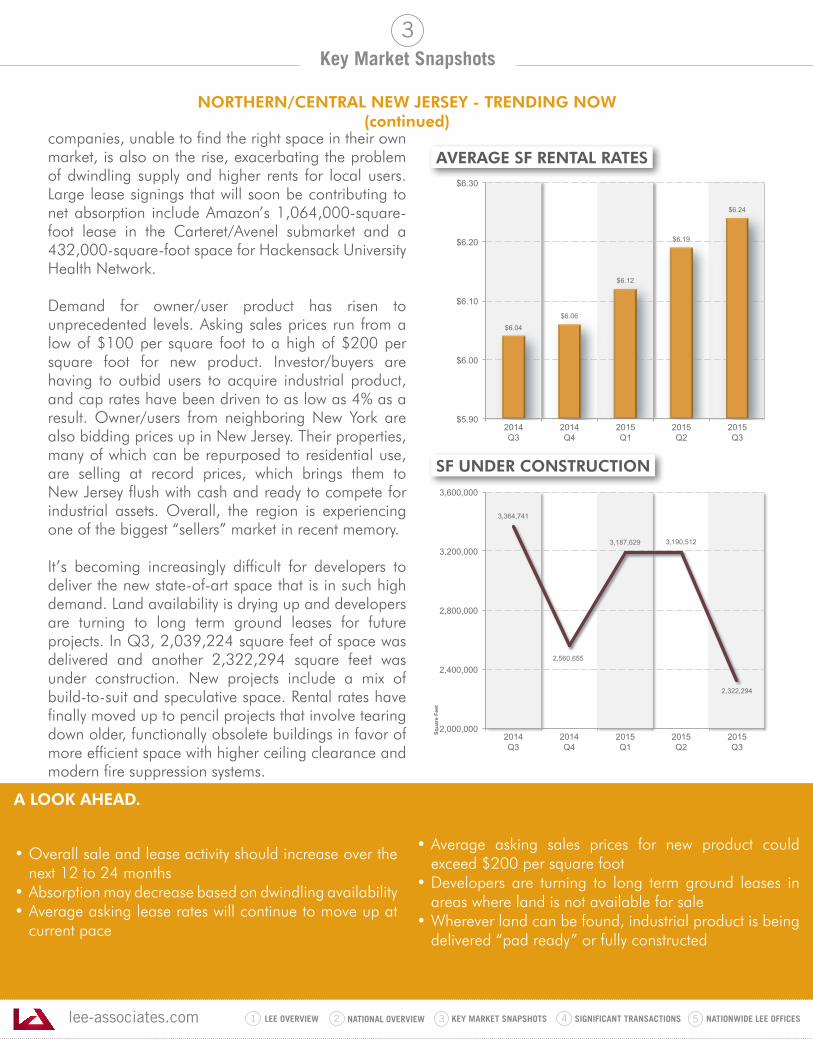
lee-associates.com 31 LEE OVERVIEW KEY MARKET SNAPSHOTS 5 NATIONWIDE LEE OFFICESNATIONAL OVERVIEW2 4 SIGNIFICANT TRANSACTIONS
Key Market Snapshots
NORTHERN/CENTRAL NEW JERSEY - TRENDING NOW(continued)
3
companies, unable to find the right space in their own market, is also on the rise, exacerbating the problem of dwindling supply and higher rents for local users. Large lease signings that will soon be contributing to net absorption include Amazon’s 1,064,000-square-foot lease in the Carteret/Avenel submarket and a 432,000-square-foot space for Hackensack University Health Network.
Demand for owner/user product has risen to unprecedented levels. Asking sales prices run from a low of $100 per square foot to a high of $200 per square foot for new product. Investor/buyers are having to outbid users to acquire industrial product, and cap rates have been driven to as low as 4% as a result. Owner/users from neighboring New York are also bidding prices up in New Jersey. Their properties, many of which can be repurposed to residential use, are selling at record prices, which brings them to New Jersey flush with cash and ready to compete for industrial assets. Overall, the region is experiencing one of the biggest “sellers” market in recent memory.
It’s becoming increasingly difficult for developers to deliver the new state-of-art space that is in such high demand. Land availability is drying up and developers are turning to long term ground leases for future projects. In Q3, 2,039,224 square feet of space was delivered and another 2,322,294 square feet was under construction. New projects include a mix of build-to-suit and speculative space. Rental rates have finally moved up to pencil projects that involve tearing down older, functionally obsolete buildings in favor of more efficient space with higher ceiling clearance and modern fire suppression systems.
• Overall sale and lease activity should increase over the next 12 to 24 months
• Absorption may decrease based on dwindling availability• Average asking lease rates will continue to move up at
current pace
• Average asking sales prices for new product could exceed $200 per square foot
• Developers are turning to long term ground leases in areas where land is not available for sale
• Wherever land can be found, industrial product is being delivered “pad ready” or fully constructed
$6.04
$6.06
$6.12
$6.19
$6.24
$5.90
$6.00
$6.10
$6.20
$6.30
2014 Q3
2014 Q4
2015 Q1
2015 Q2
2015 Q3
3,364,741
2,560,655
3,187,629 3,190,512
2,322,294
2,000,000
2,400,000
2,800,000
3,200,000
3,600,000
2014 Q3
2014 Q4
2015 Q1
2015 Q2
2015 Q3
Squa
re F
eet
SF UNDER CONSTRUCTION
AVERAGE SF RENTAL RATES
A LOOK AHEAD.
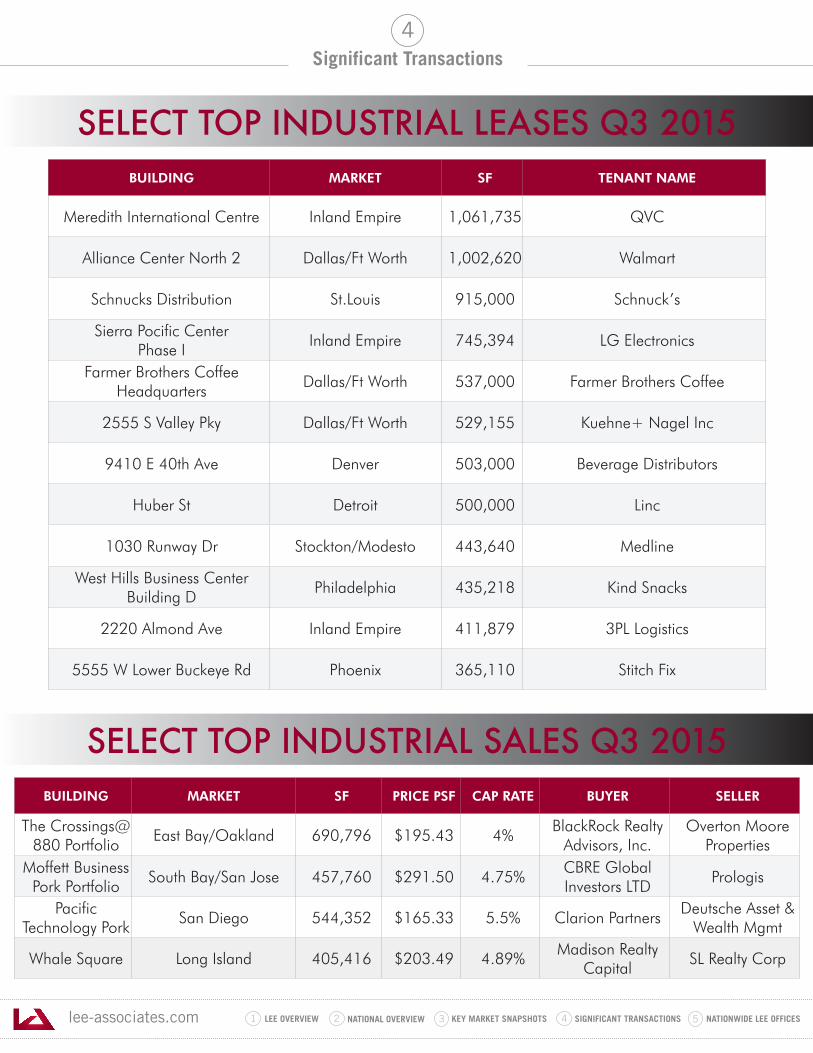
lee-associates.com 31 LEE OVERVIEW KEY MARKET SNAPSHOTS 5 NATIONWIDE LEE OFFICESNATIONAL OVERVIEW2 4 SIGNIFICANT TRANSACTIONS
4Significant Transactions
BUILDING MARKET SF TENANT NAME
Meredith International Centre Inland Empire 1,061,735 QVC
Alliance Center North 2 Dallas/Ft Worth 1,002,620 Walmart
Schnucks Distribution St.Louis 915,000 Schnuck’s
Sierra Pocific CenterPhase I
Inland Empire 745,394 LG Electronics
Farmer Brothers Coffee Headquarters
Dallas/Ft Worth 537,000 Farmer Brothers Coffee
2555 S Valley Pky Dallas/Ft Worth 529,155 Kuehne+ Nagel Inc
9410 E 40th Ave Denver 503,000 Beverage Distributors
Huber St Detroit 500,000 Linc
1030 Runway Dr Stockton/Modesto 443,640 Medline
West Hills Business Center Building D
Philadelphia 435,218 Kind Snacks
2220 Almond Ave Inland Empire 411,879 3PL Logistics
5555 W Lower Buckeye Rd Phoenix 365,110 Stitch Fix
SELECT TOP INDUSTRIAL LEASES Q3 2015
SELECT TOP INDUSTRIAL SALES Q3 2015BUILDING MARKET SF PRICE PSF CAP RATE BUYER SELLER
The Crossings@ 880 Portfolio
East Bay/Oakland 690,796 $195.43 4%BlackRock Realty
Advisors, Inc.Overton Moore
PropertiesMoffett Business
Pork PortfolioSouth Bay/San Jose 457,760 $291.50 4.75%
CBRE Global Investors LTD
Prologis
Pacific Technology Pork
San Diego 544,352 $165.33 5.5% Clarion PartnersDeutsche Asset &
Wealth Mgmt
Whale Square Long Island 405,416 $203.49 4.89%Madison Realty
CapitalSL Realty Corp
lee-associates.com 31 LEE OVERVIEW KEY MARKET SNAPSHOTS 5 NATIONWIDE LEE OFFICESNATIONAL OVERVIEW2 4 SIGNIFICANT TRANSACTIONS
5Nationwide Lee Offices
MIDWESTWEST
EAST
SOUTHWEST
SOUTH
*Please contact individual managers forinformation in specific markets
MissouriThomas Homco314.400.4003St. Louis, MO 63114
NevadaLyle Chamberlain775.851.5300Reno, NV 89501
New JerseyRick Marchiso973.475.7055Elmwood Park, NJ 07407
New YorkJim Wacht212.776.1202New York, NY 10022
OhioBrad Coven216.282.0101Pepper Pike, OH 44124(Cleveland)
Tim Kelton614.923.3300Dublin, OH 43017(Columbus)
PennsylvaniaJohn Van Buskirk 717.695.3840 x 1004Camp Hill, PA 17011(Eastern Pennsylvania)
South CarolinaBob Nuttall843.747.1200Charleston, SC 29492
Randall Bentley864.704.1040Greenville, SC 29601
TexasTrey Fricke972.934.4000Addison, TX 75001(Dallas/Fort Worth)
Chris Lewis713.660.1160Houston, TX 77027
WisconsinTodd Waller608.327.4000Madison, WI 53713
ArizonaFred Darche602.956.7777Phoenix, AZ 85018
CaliforniaClarice Clarke805.898.4362Santa Barbara, CA 93101(Central Coast)
Brian Ward760.346.2521Palm Desert, CA 92260(Greater Palm Springs)
John Hall949.727.1200Irvine, CA 92618
Mike Tingus818.223.4380LA North/Ventura, CA
Craig Phillips323.720.8484Commerce, CA 90040(LA Central)
Robert Leveen213.623.1305Los Angeles, CA 90071(LA ISG)
Greg Gill562.354.2500Los Angeles - Long Beach, CA
Aleks Trifunovic310.899.2700Santa Monica, CA 90404(LA West)
Steve Jehorek949.724.1000Newport Beach, CA 92660
Craig Phillips562.699.7500City Of Industry, CA 91746
Craig Hagglund510.903.7611Oakland, CA 94607
Florida (continued)
Tom McFadden321.281.8501Orlando, FL 32839
GeorgiaDick Bryant404.442.2810Atlanta, GA 30326
Victor Segrest404.781.2140 Atlanta, GA 30328(Appraisal)
IdahoMatt Mahoney208.343.2300Boise, ID 83703
IllinoisBrian Tader773.355.3050Rosemont, IL 60018(Chicago)
IndianaScot Courtney317.218.1038Indianapolis, IN 46240
KansasNathan Anderson913.890.2000Overland Park, KS 66211(Kansas City)
MarylandJ. Allan Riorda443.741.4040Columbia, MD 21046
MichiganJon Savoy248.351.3500Southfield, MI 48034
California (contd)
Don Kazanjian909.989.7771Ontario, CA 91764
Bob Sattler714.564.7166Orange, CA 92865
Mike Furay925.737.4140Pleasanton, CA 94588
Dave Illsley951.276.3626Riverside, CA 92507
Dave Howard760.929.9700Carlsbad, CA 92008(San Diego North)
Steve Malley858.642.2354San Diego, CA 92121(San Diego UTC)
Tom Davis209.983.1111Stockton, CA 95206
Dave Illsley951.276.3626Murrieta, CA 92562(Temecula Valley)
Don Brown760.241.5211Victorville, CA 92392
DenverJohn Bitzer303.296.8770Denver, CO 80202
Florida Jerry Messonnier239.210.7610Ft. Myers, FL 33966(Naples)
Q32015
lee-associates.com
The information and details contained herein have beenobtained from third-party sources believed to be reliable;however, Lee & Associates has not independently verified itsaccuracy.
Lee & Associates makes no representations, guarantees,or express or implied warranties of any kind regarding theaccuracy or completeness of the information and detailsprovided herein, including but not limited to the impliedwarranty of suitability and fitness for a particular purpose.Interested parties should perform their own due diligenceregarding the accuracy of the information.
The information provided herein, including any sale or lease terms, is being provided subject to errors, omissions, changes of price or conditions, prior sale or lease, and withdrawal without notice.
Third-party data sources: CoStar Group, Inc., The Economist,U.S. Bureau of Economic Analysis, U.S. Bureau of LaborStatistics, Congressional Budget Office, European Central Bank, GlobeSt.com, CoStar Property and Lee Propriety Data. © Copyright 2015 Lee & Associates All rights reserved.
The Lee Industrial Brief