Embed Size (px)
Citation preview
Research & Forecast Report
WATERLOO REGIONOFFICE Third Quarter 2017
2 Research & Forecast Report | Third Quarter 2017 | Waterloo Region / Office | Colliers International
Market Summaries
City of Cambridge ..........................................................................................................4 City of Kitchener ..................................................................................................... 5 City of Waterloo ...................................................................................................... 6
Glossary ............................................................................................................................... 7
Table of Contents
3 Research & Forecast Report | Third Quarter 2017 | Waterloo Region / Office | Colliers International
Waterloo Region Market Overview
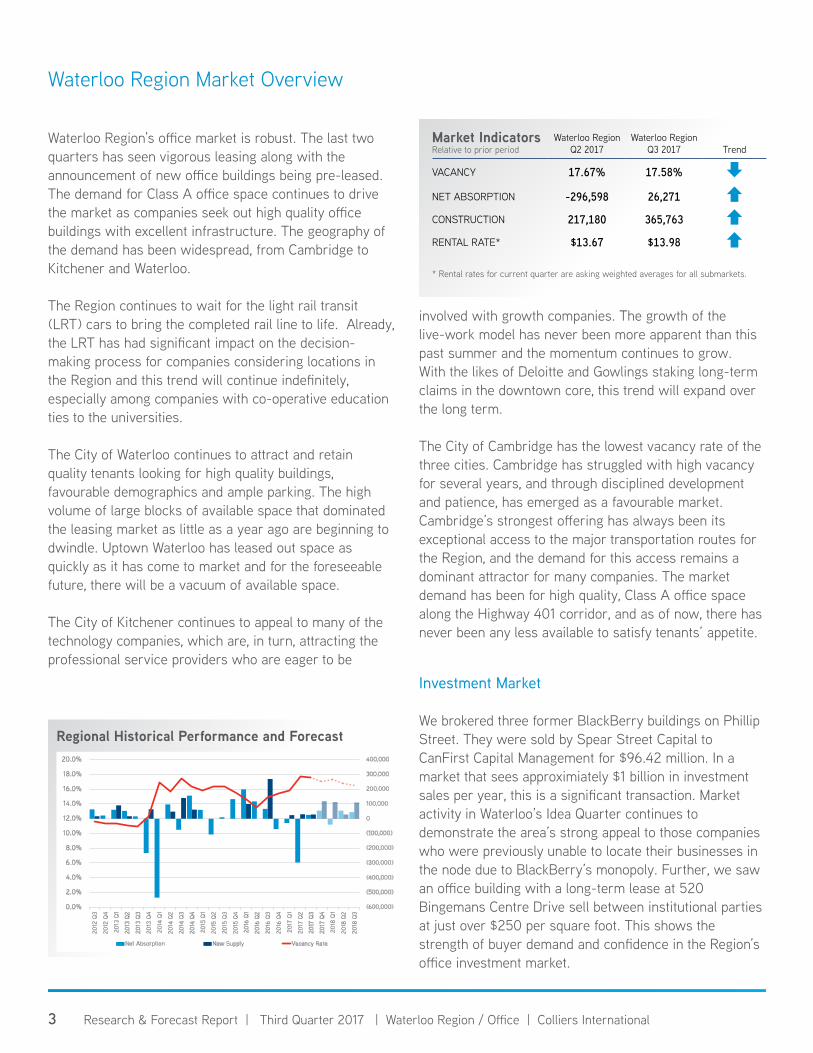
Waterloo Region’s office market is robust. The last two quarters has seen vigorous leasing along with the announcement of new office buildings being pre-leased. The demand for Class A office space continues to drive the market as companies seek out high quality office buildings with excellent infrastructure. The geography of the demand has been widespread, from Cambridge to Kitchener and Waterloo.
The Region continues to wait for the light rail transit (LRT) cars to bring the completed rail line to life. Already, the LRT has had significant impact on the decision-making process for companies considering locations in the Region and this trend will continue indefinitely, especially among companies with co-operative education ties to the universities.
The City of Waterloo continues to attract and retain quality tenants looking for high quality buildings, favourable demographics and ample parking. The high volume of large blocks of available space that dominated the leasing market as little as a year ago are beginning to dwindle. Uptown Waterloo has leased out space as quickly as it has come to market and for the foreseeable future, there will be a vacuum of available space.
The City of Kitchener continues to appeal to many of the technology companies, which are, in turn, attracting the professional service providers who are eager to be
Market IndicatorsRelative to prior period
Waterloo RegionQ2 2017
Waterloo RegionQ3 2017 Trend
VACANCY 17.67% 17.58%
NET ABSORPTION -296,598 26,271
CONSTRUCTION 217,180 365,763
RENTAL RATE* $13.67 $13.98
* Rental rates for current quarter are asking weighted averages for all submarkets.
involved with growth companies. The growth of the live-work model has never been more apparent than this past summer and the momentum continues to grow. With the likes of Deloitte and Gowlings staking long-term claims in the downtown core, this trend will expand over the long term.
The City of Cambridge has the lowest vacancy rate of the three cities. Cambridge has struggled with high vacancy for several years, and through disciplined development and patience, has emerged as a favourable market. Cambridge’s strongest offering has always been its exceptional access to the major transportation routes for the Region, and the demand for this access remains a dominant attractor for many companies. The market demand has been for high quality, Class A office space along the Highway 401 corridor, and as of now, there has never been any less available to satisfy tenants’ appetite.
Investment Market
We brokered three former BlackBerry buildings on Phillip Street. They were sold by Spear Street Capital to CanFirst Capital Management for $96.42 million. In a market that sees approximiately $1 billion in investment sales per year, this is a significant transaction. Market activity in Waterloo’s Idea Quarter continues to demonstrate the area’s strong appeal to those companies who were previously unable to locate their businesses in the node due to BlackBerry’s monopoly. Further, we saw an office building with a long-term lease at 520 Bingemans Centre Drive sell between institutional parties at just over $250 per square foot. This shows the strength of buyer demand and confidence in the Region’s office investment market.
Regional Historical Performance and Forecast
(600,000)
(500,000)
(400,000)
(300,000)
(200,000)
(100,000)
0
100,000
200,000
300,000
400,000
0.0%
2.0%
4.0%
6.0%
8.0%
10.0%
12.0%
14.0%
16.0%
18.0%
20.0%
2012
Q3
2012
Q4
2013
Q1
2013
Q2
2013
Q3
2013
Q4
2014
Q1
2014
Q2
2014
Q3
2014
Q4
2015
Q1
2015
Q2
2015
Q3
2015
Q4
2016
Q1
2016
Q2
2016
Q3
2016
Q4
2017
Q1
2017
Q2
2017
Q3
2017
Q4
2018
Q1
2018
Q2
2018
Q3
Net Absorption New Supply Vacancy Rate
4 Research & Forecast Report | Third Quarter 2017 | Waterloo Region / Office | Colliers International
Notable Lease TransactionsTENANT NAME & ADDRESS TYPE APPROXIMATE
SIZE (SF)
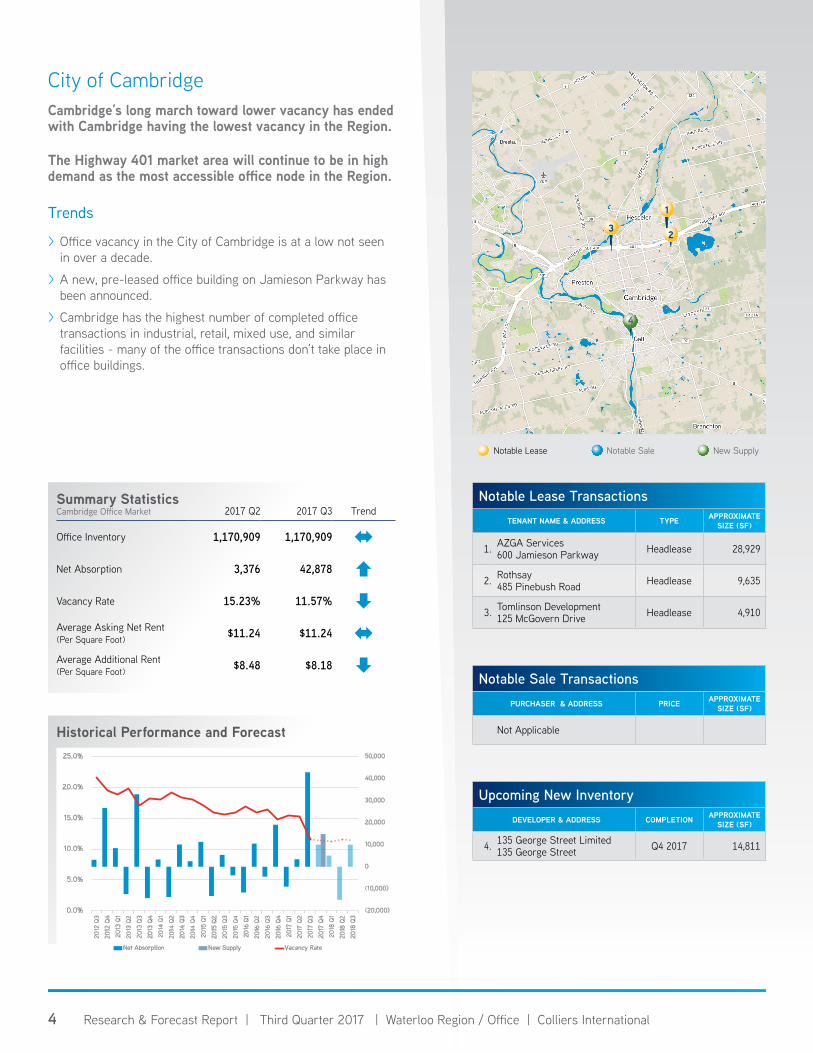
1. AZGA Services600 Jamieson Parkway Headlease 28,929
2. Rothsay485 Pinebush Road Headlease 9,635
3. Tomlinson Development125 McGovern Drive Headlease 4,910
1
Notable Lease Notable Sale New Supply
City of CambridgeCambridge’s long march toward lower vacancy has ended with Cambridge having the lowest vacancy in the Region.
The Highway 401 market area will continue to be in high demand as the most accessible office node in the Region.
Trends
> Office vacancy in the City of Cambridge is at a low not seen in over a decade.
> A new, pre-leased office building on Jamieson Parkway has been announced.
> Cambridge has the highest number of completed office transactions in industrial, retail, mixed use, and similar facilities - many of the office transactions don’t take place in office buildings.
Notable Sale TransactionsPURCHASER & ADDRESS PRICE APPROXIMATE
SIZE (SF)
Not Applicable
Upcoming New InventoryDEVELOPER & ADDRESS COMPLETION APPROXIMATE
SIZE (SF)
4. 135 George Street Limited135 George Street Q4 2017 14,811
Summary Statistics Cambridge Office Market 2017 Q2 2017 Q3 Trend
Office Inventory 1,170,909 1,170,909
Net Absorption 3,376 42,878
Vacancy Rate 15.23% 11.57%
Average Asking Net Rent(Per Square Foot) $11.24 $11.24
Average Additional Rent(Per Square Foot) $8.48 $8.18
Historical Performance and Forecast
(20,000)
(10,000)
0
10,000
20,000
30,000
40,000
50,000
0.0%
5.0%
10.0%
15.0%
20.0%
25.0%
2012
Q3
2012
Q4
2013
Q1
2013
Q2
2013
Q3
2013
Q4
2014
Q1
2014
Q2
2014
Q3
2014
Q4
2015
Q1
2015
Q2
2015
Q3
2015
Q4
2016
Q1
2016
Q2
2016
Q3
2016
Q4
2017
Q1
2017
Q2
2017
Q3
2017
Q4
2018
Q1
2018
Q2
2018
Q3
Net Absorption New Supply Vacancy Rate
2
31
23
4
5 Research & Forecast Report | Third Quarter 2017 | Waterloo Region / Office | Colliers International
Notable Lease TransactionsTENANT NAME & ADDRESS TYPE APPROXIMATE
SIZE (SF)
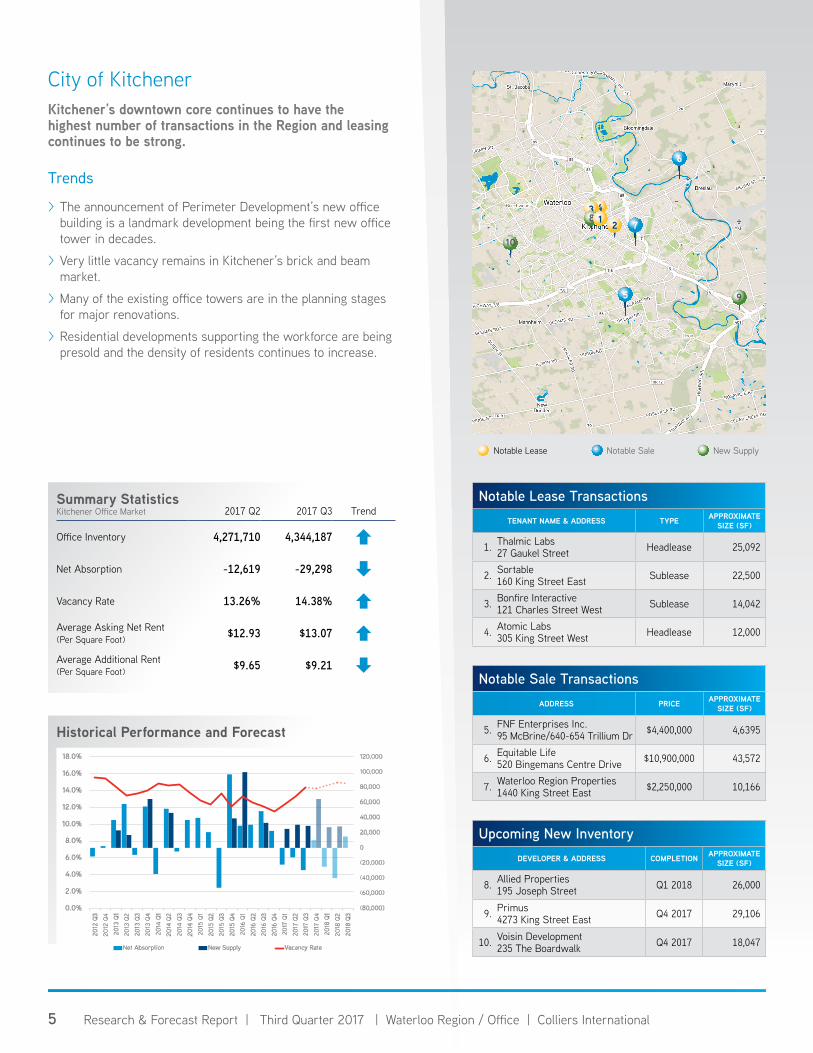
1. Thalmic Labs27 Gaukel Street Headlease 25,092
2. Sortable160 King Street East Sublease 22,500
3. Bonfire Interactive121 Charles Street West Sublease 14,042
4. Atomic Labs305 King Street West Headlease 12,000
Notable Lease Notable Sale New Supply
City of KitchenerKitchener’s downtown core continues to have the highest number of transactions in the Region and leasing continues to be strong.
Trends
> The announcement of Perimeter Development’s new office building is a landmark development being the first new office tower in decades.
> Very little vacancy remains in Kitchener’s brick and beam market.
> Many of the existing office towers are in the planning stages for major renovations.
> Residential developments supporting the workforce are being presold and the density of residents continues to increase.
Summary Statistics Kitchener Office Market 2017 Q2 2017 Q3 Trend
Office Inventory 4,271,710 4,344,187
Net Absorption -12,619 -29,298
Vacancy Rate 13.26% 14.38%
Average Asking Net Rent(Per Square Foot) $12.93 $13.07
Average Additional Rent(Per Square Foot) $9.65 $9.21
Notable Sale TransactionsADDRESS PRICE APPROXIMATE
SIZE (SF)
5. FNF Enterprises Inc.95 McBrine/640-654 Trillium Dr $4,400,000 4,6395
6. Equitable Life520 Bingemans Centre Drive $10,900,000 43,572
7. Waterloo Region Properties1440 King Street East $2,250,000 10,166
Historical Performance and Forecast
(80,000)
(60,000)
(40,000)
(20,000)
0
20,000
40,000
60,000
80,000
100,000
120,000
0.0%
2.0%
4.0%
6.0%
8.0%
10.0%
12.0%
14.0%
16.0%
18.0%
2012
Q3
2012
Q4
2013
Q1
2013
Q2
2013
Q3
2013
Q4
2014
Q1
2014
Q2
2014
Q3
2014
Q4
2015
Q1
2015
Q2
2015
Q3
2015
Q4
2016
Q1
2016
Q2
2016
Q3
2016
Q4
2017
Q1
2017
Q2
2017
Q3
2017
Q4
2018
Q1
2018
Q2
2018
Q3
Net Absorption New Supply Vacancy Rate
9
10
5
Upcoming New InventoryDEVELOPER & ADDRESS COMPLETION APPROXIMATE
SIZE (SF)
8. Allied Properties195 Joseph Street Q1 2018 26,000
9. Primus4273 King Street East Q4 2017 29,106
10. Voisin Development235 The Boardwalk Q4 2017 18,047
6
7
438 1 2
6 Research & Forecast Report | Third Quarter 2017 | Waterloo Region / Office | Colliers International
6
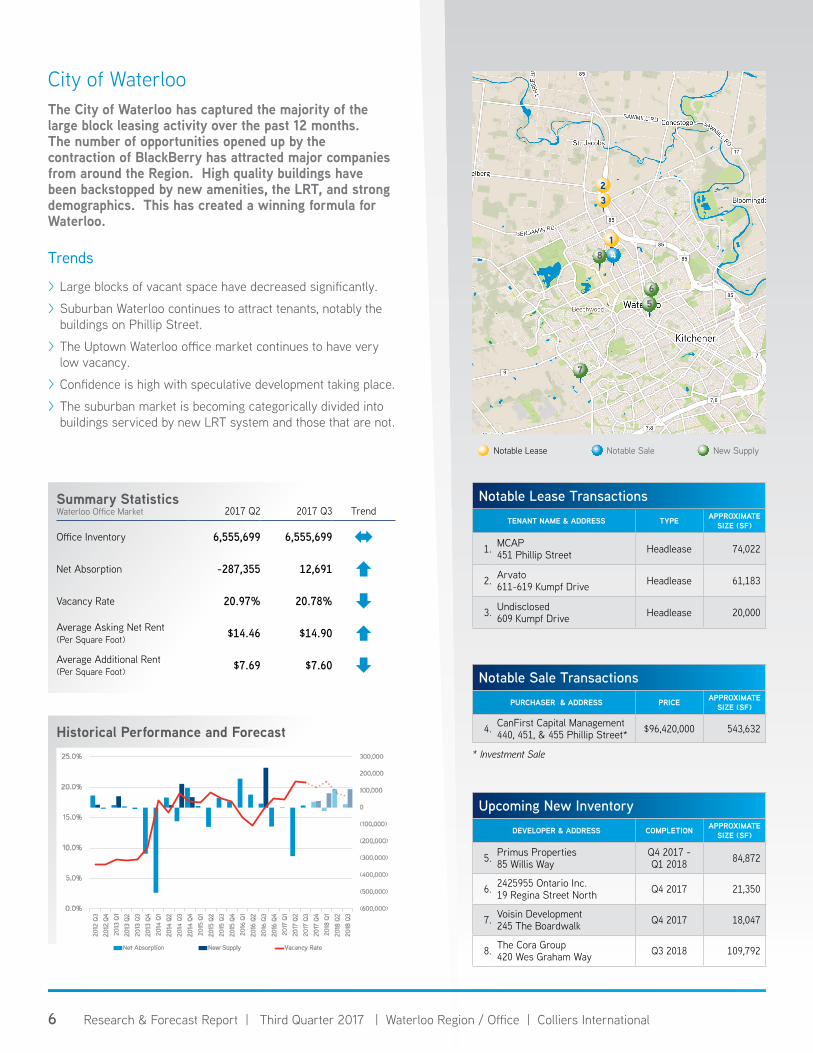
Notable Lease Notable Sale New Supply
City of WaterlooThe City of Waterloo has captured the majority of the large block leasing activity over the past 12 months. The number of opportunities opened up by the contraction of BlackBerry has attracted major companies from around the Region. High quality buildings have been backstopped by new amenities, the LRT, and strong demographics. This has created a winning formula for Waterloo.
Trends
> Large blocks of vacant space have decreased significantly.
> Suburban Waterloo continues to attract tenants, notably the buildings on Phillip Street.
> The Uptown Waterloo office market continues to have very low vacancy.
> Confidence is high with speculative development taking place.
> The suburban market is becoming categorically divided into buildings serviced by new LRT system and those that are not.
Summary Statistics Waterloo Office Market 2017 Q2 2017 Q3 Trend
Office Inventory 6,555,699 6,555,699
Net Absorption -287,355 12,691
Vacancy Rate 20.97% 20.78%
Average Asking Net Rent(Per Square Foot) $14.46 $14.90
Average Additional Rent(Per Square Foot) $7.69 $7.60
Historical Performance and Forecast
(600,000)
(500,000)
(400,000)
(300,000)
(200,000)
(100,000)
0
100,000
200,000
300,000
0.0%
5.0%
10.0%
15.0%
20.0%
25.0%
2012
Q3
2012
Q4
2013
Q1
2013
Q2
2013
Q3
2013
Q4
2014
Q1
2014
Q2
2014
Q3
2014
Q4
2015
Q1
2015
Q2
2015
Q3
2015
Q4
2016
Q1
2016
Q2
2016
Q3
2016
Q4
2017
Q1
2017
Q2
2017
Q3
2017
Q4
2018
Q1
2018
Q2
2018
Q3
Net Absorption New Supply Vacancy Rate
Notable Lease TransactionsTENANT NAME & ADDRESS TYPE APPROXIMATE
SIZE (SF)
1. MCAP451 Phillip Street Headlease 74,022
2. Arvato611-619 Kumpf Drive Headlease 61,183
3. Undisclosed609 Kumpf Drive Headlease 20,000
Notable Sale TransactionsPURCHASER & ADDRESS PRICE APPROXIMATE
SIZE (SF)
4. CanFirst Capital Management440, 451, & 455 Phillip Street* $96,420,000 543,632
Upcoming New InventoryDEVELOPER & ADDRESS COMPLETION APPROXIMATE
SIZE (SF)
5. Primus Properties85 Willis Way
Q4 2017 - Q1 2018 84,872
6. 2425955 Ontario Inc.19 Regina Street North Q4 2017 21,350
7. Voisin Development245 The Boardwalk Q4 2017 18,047
8. The Cora Group420 Wes Graham Way Q3 2018 109,792
1
5
7
4
23
* Investment Sale
8
7 Research & Forecast Report | Third Quarter 2017 | Waterloo Region / Office | Colliers International
Glossary
Weighted Average Asking Net Rent The dollar amount requested by landlords for direct available space, not including subleases, expressed in dollars per square foot per year.
Availability The amount of available space and available space to be delivered to the market within six months, divided by the market’s inventory base including those future deliveries. Available space is space that is available for lease, and may or may not be vacant.
Net Absorption The net change in physically occupied space between the current measurement period, and the last measurement period. It can be either positive or negative.
Vacancy The amount of vacant space divided by the building inventory base. Vacant space is physically unoccupied, and it may or may not be available for lease or sublease. This is physical vacancy. It is not determined whether a tenant is paying rent on the space.
Copyright © 2017 Colliers International.
The information contained herein has been obtained from sources deemed reliable. While every reasonable effort has been made to ensure its accuracy, we cannot guarantee it. No responsibility is assumed for any inaccuracies. Readers are encouraged to consult their professional advisors prior to acting on any of the material contained in this report.
About Colliers International Group Inc.
Colliers International Group Inc. is an industry leading global real estate services company with more than 15,000 skilled professionals operating in 68 countries. With an enterprising culture and significant employee ownership, Colliers professionals provide a full range of services to real estate occupiers, owners and investors worldwide. Services include strategic advice and execution for property sales, leasing and finance; global corporate solutions; property, facility and project management; workplace solutions; appraisal, valuation and tax consulting; customized research; and thought leadership consulting.
Colliers professionals think differently, share great ideas and offer thoughtful and innovative advice that help clients accelerate their success. Colliers has been ranked among the top 100 outsourcing firms by the International Association of Outsourcing Professionals’ Global Outsourcing for 11 consecutive years, more than any other real estate services firm.
colliers.com
396 offices in 68 countries on 6 continentsUnited States: 153 Canada: 29 Latin America: 24 Asia Pacific: 79 EMEA: 111
$2.6BUS* in annual revenue
2Bsquare feet under management
15,000professionals and staff
*Based on 2016 results
MARKET CONTACT:Serguei Kaminski Market Intelligence Coordinator | Waterloo Region+1 519 904 [email protected]
REGIONAL AUTHORS:John Lind | Senior Sales RepresentativeKarl Innanen, CCIM | Managing Director, BrokerSerguei Kaminski | Market Intelligence CoordinatorJennie Ross | Client Project Coordinator
Colliers International | Waterloo Region305 King Street West, Suite 606Kitchener, ON N2G 1B9 | Canada
+1 519 570 1330