Embed Size (px)
Citation preview
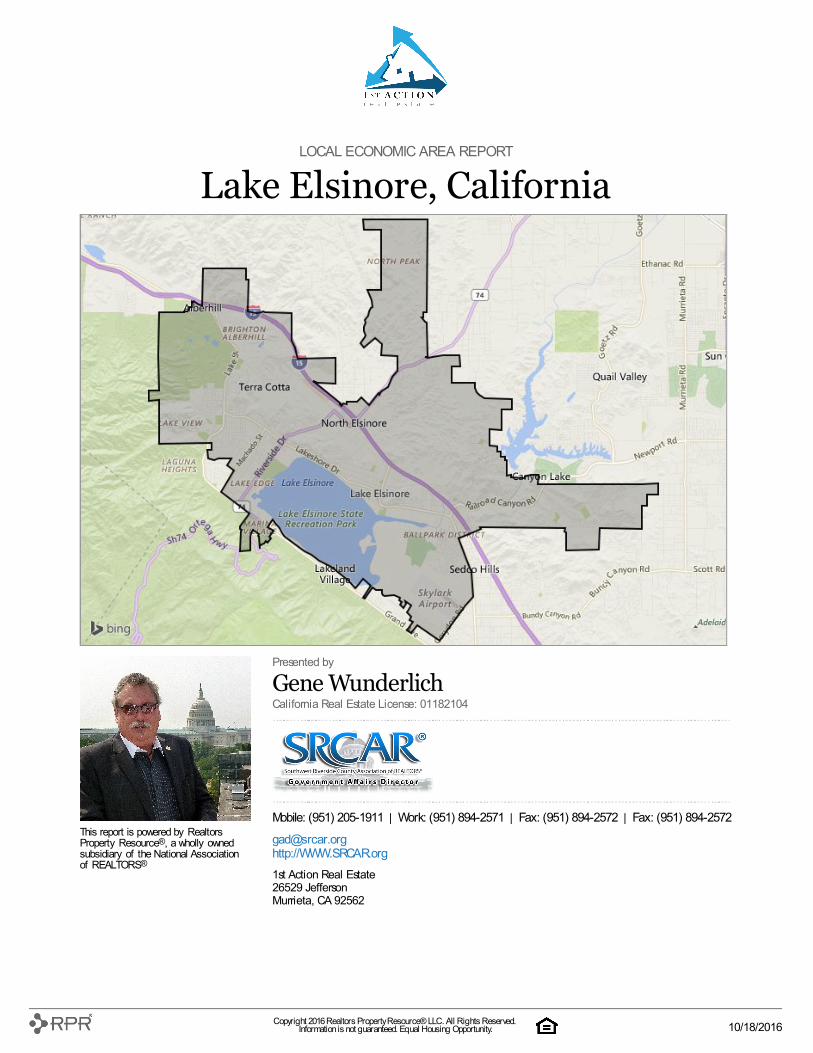
LOCAL ECONOMIC AREA REPORT
Lake Elsinore, California
This report is powered by RealtorsProperty Resource®, a wholly ownedsubsidiary of the National Associationof REALTORS®
Presented by
Gene WunderlichCalifornia Real Estate License: 01182104
Mobile: (951) 205-1911 | Work: (951) 894-2571 | Fax: (951) 894-2572 | Fax: (951) 894-2572
[email protected]://WWW.SRCAR.org1st Action Real Estate26529 JeffersonMurrieta, CA 92562
Copyright 2016 Realtors Property Resource® LLC. All Rights Reserved. Information is not guaranteed. Equal Housing Opportunity.
10/18/2016
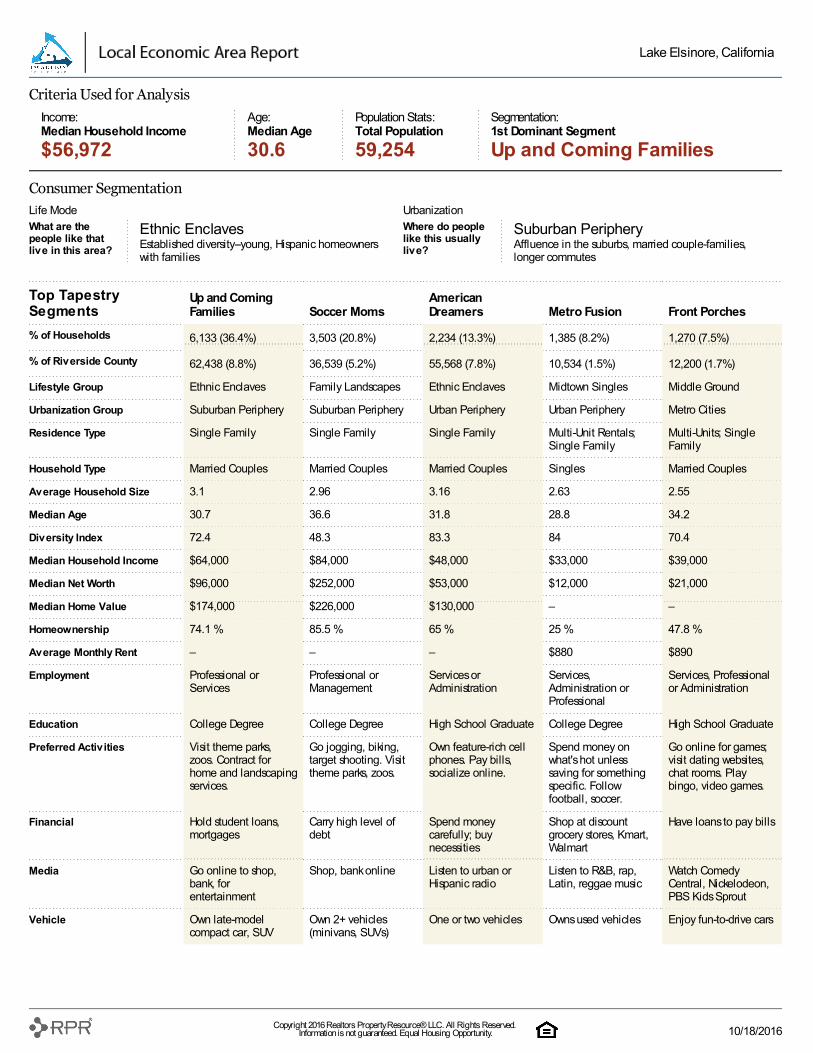
Criteria Used for AnalysisIncome:Median Household Income
Age:Median Age
Population Stats:Total Population
Segmentation:1st Dominant Segment
$56,972 30.6 59,254 Up and Coming Families
Consumer SegmentationLife Mode UrbanizationWhat are thepeople like thatlive in this area?
Ethnic EnclavesEstablished diversity--young, Hispanic homeownerswith families
Where do peoplelike this usuallylive?
Suburban PeripheryAffluence in the suburbs, married couple-families,longer commutes
Top TapestrySegments
Up and ComingFamilies Soccer Moms
AmericanDreamers Metro Fusion Front Porches
% of Households 6,133 (36.4%) 3,503 (20.8%) 2,234 (13.3%) 1,385 (8.2%) 1,270 (7.5%)
% of Riverside County 62,438 (8.8%) 36,539 (5.2%) 55,568 (7.8%) 10,534 (1.5%) 12,200 (1.7%)
Lifestyle Group Ethnic Enclaves Family Landscapes Ethnic Enclaves Midtown Singles Middle Ground
Urbanization Group Suburban Periphery Suburban Periphery Urban Periphery Urban Periphery Metro Cities
Residence Type Single Family Single Family Single Family Multi-Unit Rentals;Single Family
Multi-Units; SingleFamily
Household Type Married Couples Married Couples Married Couples Singles Married Couples
Average Household Size 3.1 2.96 3.16 2.63 2.55
Median Age 30.7 36.6 31.8 28.8 34.2
Diversity Index 72.4 48.3 83.3 84 70.4
Median Household Income $64,000 $84,000 $48,000 $33,000 $39,000
Median Net Worth $96,000 $252,000 $53,000 $12,000 $21,000
Median Home Value $174,000 $226,000 $130,000 – –
Homeownership 74.1 % 85.5 % 65 % 25 % 47.8 %
Average Monthly Rent – – – $880 $890
Employment Professional orServices
Professional orManagement
Services orAdministration
Services,Administration orProfessional
Services, Professionalor Administration
Education College Degree College Degree High School Graduate College Degree High School Graduate
Preferred Activities Visit theme parks,zoos. Contract forhome and landscapingservices.
Go jogging, biking,target shooting. Visittheme parks, zoos.
Own feature-rich cellphones. Pay bills,socialize online.
Spend money onwhat's hot unlesssaving for somethingspecific. Followfootball, soccer.
Go online for games;visit dating websites,chat rooms. Playbingo, video games.
Financial Hold student loans,mortgages
Carry high level ofdebt
Spend moneycarefully; buynecessities
Shop at discountgrocery stores, Kmart,Walmart
Have loans to pay bills
Media Go online to shop,bank, forentertainment
Shop, bank online Listen to urban orHispanic radio
Listen to R&B, rap,Latin, reggae music
Watch ComedyCentral, Nickelodeon,PBS Kids Sprout
Vehicle Own late-modelcompact car, SUV
Own 2+ vehicles(minivans, SUVs)
One or two vehicles Owns used vehicles Enjoy fun-to-drive cars
Lake Elsinore, California
Copyright 2016 Realtors Property Resource® LLC. All Rights Reserved. Information is not guaranteed. Equal Housing Opportunity. 10/18/2016
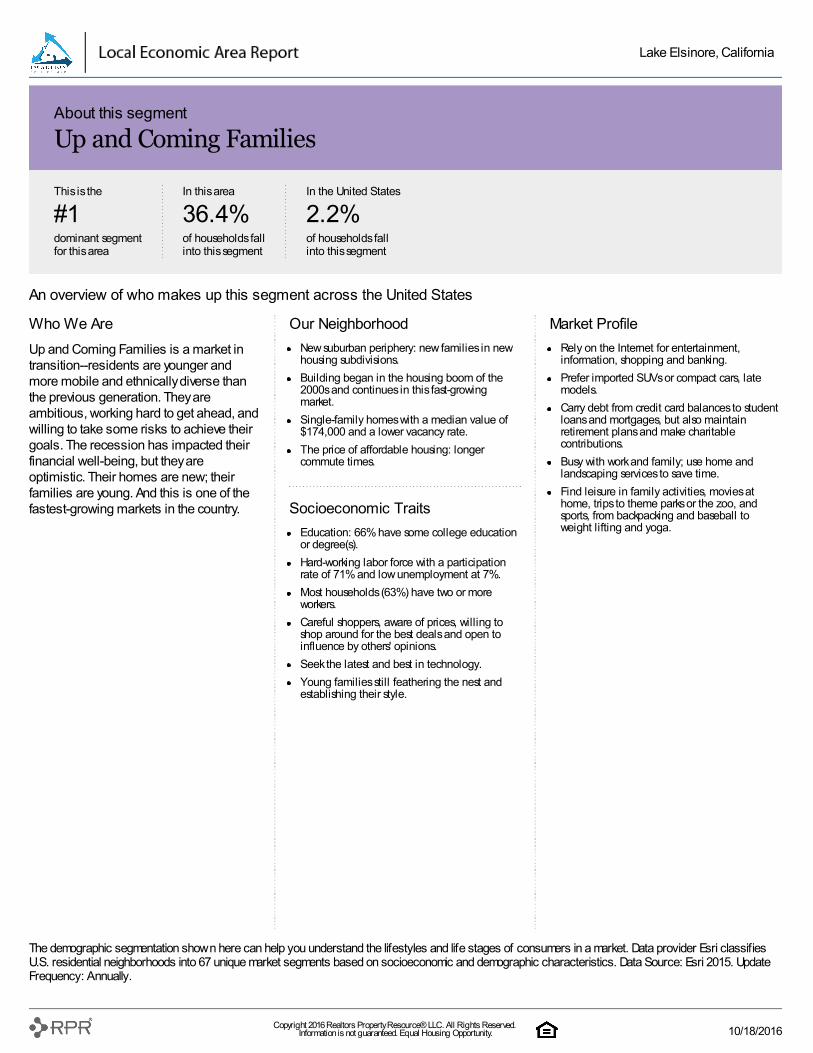
Who We AreUp and Coming Families is a market intransition--residents are younger andmore mobile and ethnically diverse thanthe previous generation. They areambitious, working hard to get ahead, andwilling to take some risks to achieve theirgoals. The recession has impacted theirfinancial well-being, but they areoptimistic. Their homes are new; theirfamilies are young. And this is one of thefastest-growing markets in the country.
Our NeighborhoodNew suburban periphery: new families in newhousing subdivisions.Building began in the housing boom of the2000s and continues in this fast-growingmarket.Single-family homes with a median value of$174,000 and a lower vacancy rate.The price of affordable housing: longercommute times.
Socioeconomic TraitsEducation: 66% have some college educationor degree(s).Hard-working labor force with a participationrate of 71% and low unemployment at 7%.Most households (63%) have two or moreworkers.Careful shoppers, aware of prices, willing toshop around for the best deals and open toinfluence by others' opinions.Seek the latest and best in technology.Young families still feathering the nest andestablishing their style.
Market ProfileRely on the Internet for entertainment,information, shopping and banking.Prefer imported SUVs or compact cars, latemodels.Carry debt from credit card balances to studentloans and mortgages, but also maintainretirement plans and make charitablecontributions.Busy with work and family; use home andlandscaping services to save time.Find leisure in family activities, movies athome, trips to theme parks or the zoo, andsports, from backpacking and baseball toweight lifting and yoga.
An overview of who makes up this segment across the United States
The demographic segmentation shown here can help you understand the lifestyles and life stages of consumers in a market. Data provider Esri classifiesU.S. residential neighborhoods into 67 unique market segments based on socioeconomic and demographic characteristics. Data Source: Esri 2015. UpdateFrequency: Annually.
This is the
#1dominant segmentfor this area
In this area
36.4%of households fallinto this segment
In the United States
2.2%of households fallinto this segment
About this segment
Up and Coming Families
Lake Elsinore, California
Copyright 2016 Realtors Property Resource® LLC. All Rights Reserved. Information is not guaranteed. Equal Housing Opportunity. 10/18/2016
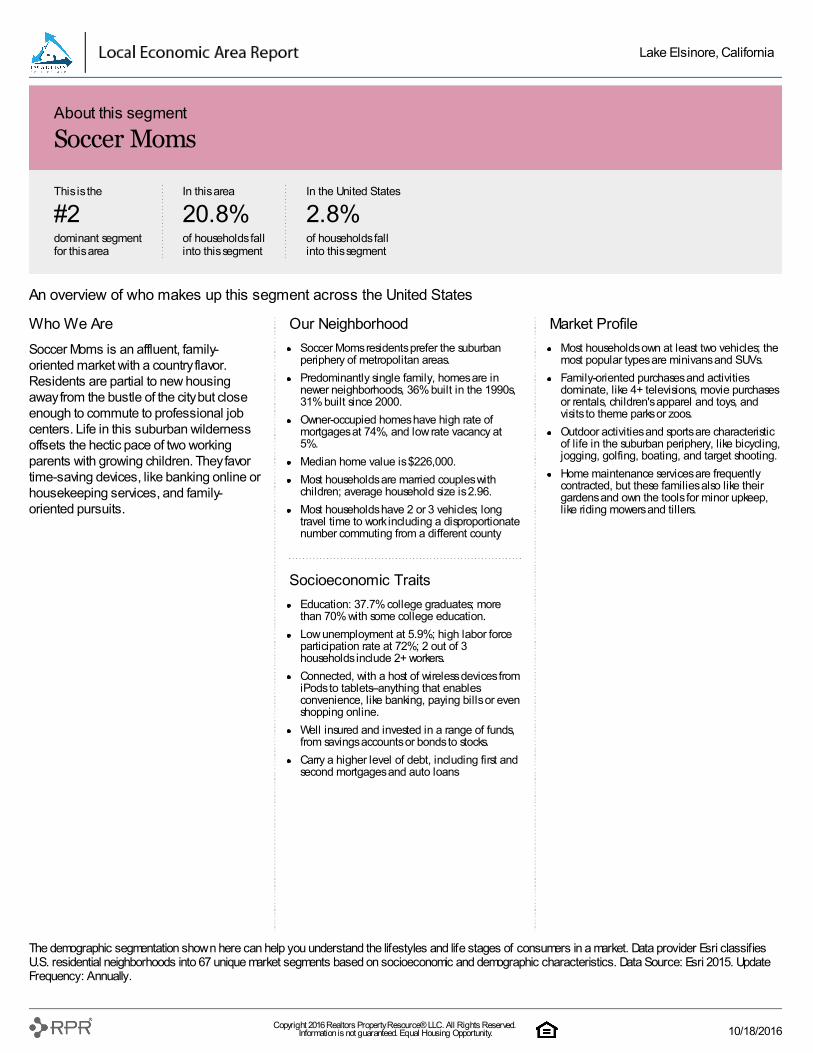
Who We AreSoccer Moms is an affluent, family-oriented market with a country flavor.Residents are partial to new housingaway from the bustle of the city but closeenough to commute to professional jobcenters. Life in this suburban wildernessoffsets the hectic pace of two workingparents with growing children. They favortime-saving devices, like banking online orhousekeeping services, and family-oriented pursuits.
Our NeighborhoodSoccer Moms residents prefer the suburbanperiphery of metropolitan areas.Predominantly single family, homes are innewer neighborhoods, 36% built in the 1990s,31% built since 2000.Owner-occupied homes have high rate ofmortgages at 74%, and low rate vacancy at5%.Median home value is $226,000.Most households are married couples withchildren; average household size is 2.96.Most households have 2 or 3 vehicles; longtravel time to work including a disproportionatenumber commuting from a different county
Socioeconomic TraitsEducation: 37.7% college graduates; morethan 70% with some college education.Low unemployment at 5.9%; high labor forceparticipation rate at 72%; 2 out of 3households include 2+ workers.Connected, with a host of wireless devices fromiPods to tablets--anything that enablesconvenience, like banking, paying bills or evenshopping online.Well insured and invested in a range of funds,from savings accounts or bonds to stocks.Carry a higher level of debt, including first andsecond mortgages and auto loans
Market ProfileMost households own at least two vehicles; themost popular types are minivans and SUVs.Family-oriented purchases and activitiesdominate, like 4+ televisions, movie purchasesor rentals, children's apparel and toys, andvisits to theme parks or zoos.Outdoor activities and sports are characteristicof life in the suburban periphery, like bicycling,jogging, golfing, boating, and target shooting.Home maintenance services are frequentlycontracted, but these families also like theirgardens and own the tools for minor upkeep,like riding mowers and tillers.
An overview of who makes up this segment across the United States
The demographic segmentation shown here can help you understand the lifestyles and life stages of consumers in a market. Data provider Esri classifiesU.S. residential neighborhoods into 67 unique market segments based on socioeconomic and demographic characteristics. Data Source: Esri 2015. UpdateFrequency: Annually.
This is the
#2dominant segmentfor this area
In this area
20.8%of households fallinto this segment
In the United States
2.8%of households fallinto this segment
About this segment
Soccer Moms
Lake Elsinore, California
Copyright 2016 Realtors Property Resource® LLC. All Rights Reserved. Information is not guaranteed. Equal Housing Opportunity. 10/18/2016
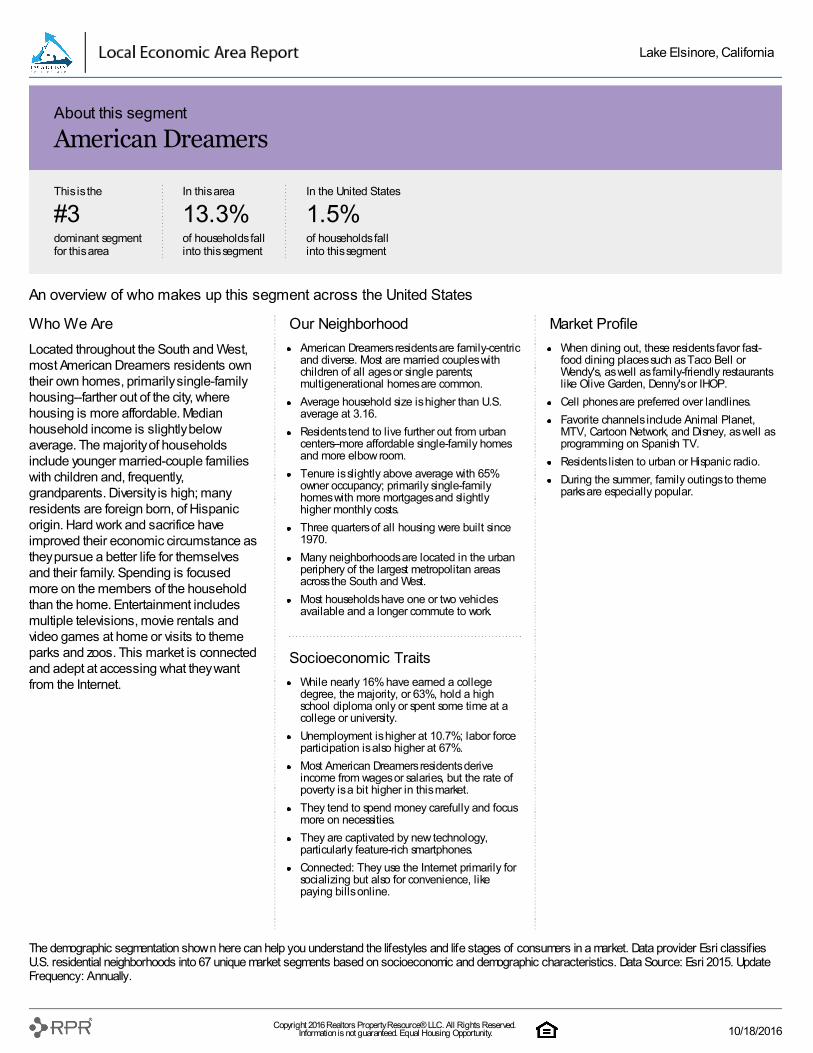
Who We AreLocated throughout the South and West,most American Dreamers residents owntheir own homes, primarily single-familyhousing--farther out of the city, wherehousing is more affordable. Medianhousehold income is slightly belowaverage. The majority of householdsinclude younger married-couple familieswith children and, frequently,grandparents. Diversity is high; manyresidents are foreign born, of Hispanicorigin. Hard work and sacrifice haveimproved their economic circumstance asthey pursue a better life for themselvesand their family. Spending is focusedmore on the members of the householdthan the home. Entertainment includesmultiple televisions, movie rentals andvideo games at home or visits to themeparks and zoos. This market is connectedand adept at accessing what they wantfrom the Internet.
Our NeighborhoodAmerican Dreamers residents are family-centricand diverse. Most are married couples withchildren of all ages or single parents;multigenerational homes are common.Average household size is higher than U.S.average at 3.16.Residents tend to live further out from urbancenters--more affordable single-family homesand more elbow room.Tenure is slightly above average with 65%owner occupancy; primarily single-familyhomes with more mortgages and slightlyhigher monthly costs.Three quarters of all housing were built since1970.Many neighborhoods are located in the urbanperiphery of the largest metropolitan areasacross the South and West.Most households have one or two vehiclesavailable and a longer commute to work.
Socioeconomic TraitsWhile nearly 16% have earned a collegedegree, the majority, or 63%, hold a highschool diploma only or spent some time at acollege or university.Unemployment is higher at 10.7%; labor forceparticipation is also higher at 67%.Most American Dreamers residents deriveincome from wages or salaries, but the rate ofpoverty is a bit higher in this market.They tend to spend money carefully and focusmore on necessities.They are captivated by new technology,particularly feature-rich smartphones.Connected: They use the Internet primarily forsocializing but also for convenience, likepaying bills online.
Market ProfileWhen dining out, these residents favor fast-food dining places such as Taco Bell orWendy's, as well as family-friendly restaurantslike Olive Garden, Denny's or IHOP.Cell phones are preferred over landlines.Favorite channels include Animal Planet,MTV, Cartoon Network, and Disney, as well asprogramming on Spanish TV.Residents listen to urban or Hispanic radio.During the summer, family outings to themeparks are especially popular.
An overview of who makes up this segment across the United States
The demographic segmentation shown here can help you understand the lifestyles and life stages of consumers in a market. Data provider Esri classifiesU.S. residential neighborhoods into 67 unique market segments based on socioeconomic and demographic characteristics. Data Source: Esri 2015. UpdateFrequency: Annually.
This is the
#3dominant segmentfor this area
In this area
13.3%of households fallinto this segment
In the United States
1.5%of households fallinto this segment
About this segment
American Dreamers
Lake Elsinore, California
Copyright 2016 Realtors Property Resource® LLC. All Rights Reserved. Information is not guaranteed. Equal Housing Opportunity. 10/18/2016
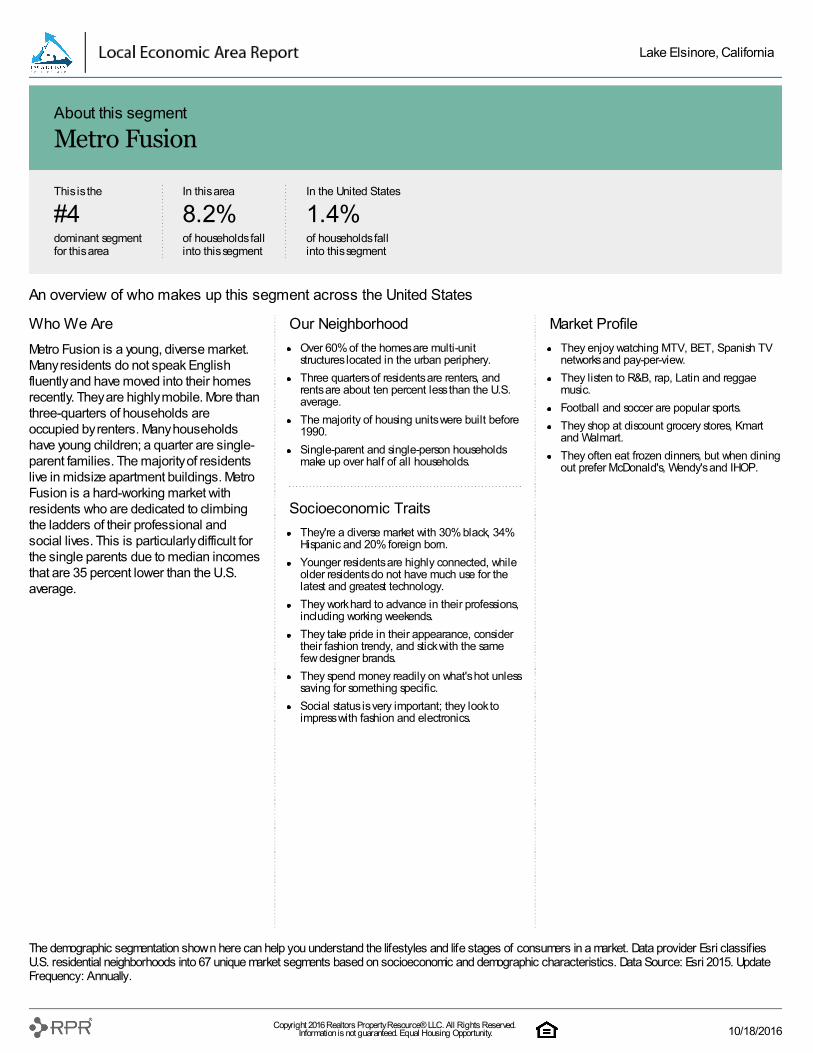
Who We AreMetro Fusion is a young, diverse market.Many residents do not speak Englishfluently and have moved into their homesrecently. They are highly mobile. More thanthree-quarters of households areoccupied by renters. Many householdshave young children; a quarter are single-parent families. The majority of residentslive in midsize apartment buildings. MetroFusion is a hard-working market withresidents who are dedicated to climbingthe ladders of their professional andsocial lives. This is particularly difficult forthe single parents due to median incomesthat are 35 percent lower than the U.S.average.
Our NeighborhoodOver 60% of the homes are multi-unitstructures located in the urban periphery.Three quarters of residents are renters, andrents are about ten percent less than the U.S.average.The majority of housing units were built before1990.Single-parent and single-person householdsmake up over half of all households.
Socioeconomic TraitsThey're a diverse market with 30% black, 34%Hispanic and 20% foreign born.Younger residents are highly connected, whileolder residents do not have much use for thelatest and greatest technology.They work hard to advance in their professions,including working weekends.They take pride in their appearance, considertheir fashion trendy, and stick with the samefew designer brands.They spend money readily on what's hot unlesssaving for something specific.Social status is very important; they look toimpress with fashion and electronics.
Market ProfileThey enjoy watching MTV, BET, Spanish TVnetworks and pay-per-view.They listen to R&B, rap, Latin and reggaemusic.Football and soccer are popular sports.They shop at discount grocery stores, Kmartand Walmart.They often eat frozen dinners, but when diningout prefer McDonald's, Wendy's and IHOP.
An overview of who makes up this segment across the United States
The demographic segmentation shown here can help you understand the lifestyles and life stages of consumers in a market. Data provider Esri classifiesU.S. residential neighborhoods into 67 unique market segments based on socioeconomic and demographic characteristics. Data Source: Esri 2015. UpdateFrequency: Annually.
This is the
#4dominant segmentfor this area
In this area
8.2%of households fallinto this segment
In the United States
1.4%of households fallinto this segment
About this segment
Metro Fusion
Lake Elsinore, California
Copyright 2016 Realtors Property Resource® LLC. All Rights Reserved. Information is not guaranteed. Equal Housing Opportunity. 10/18/2016
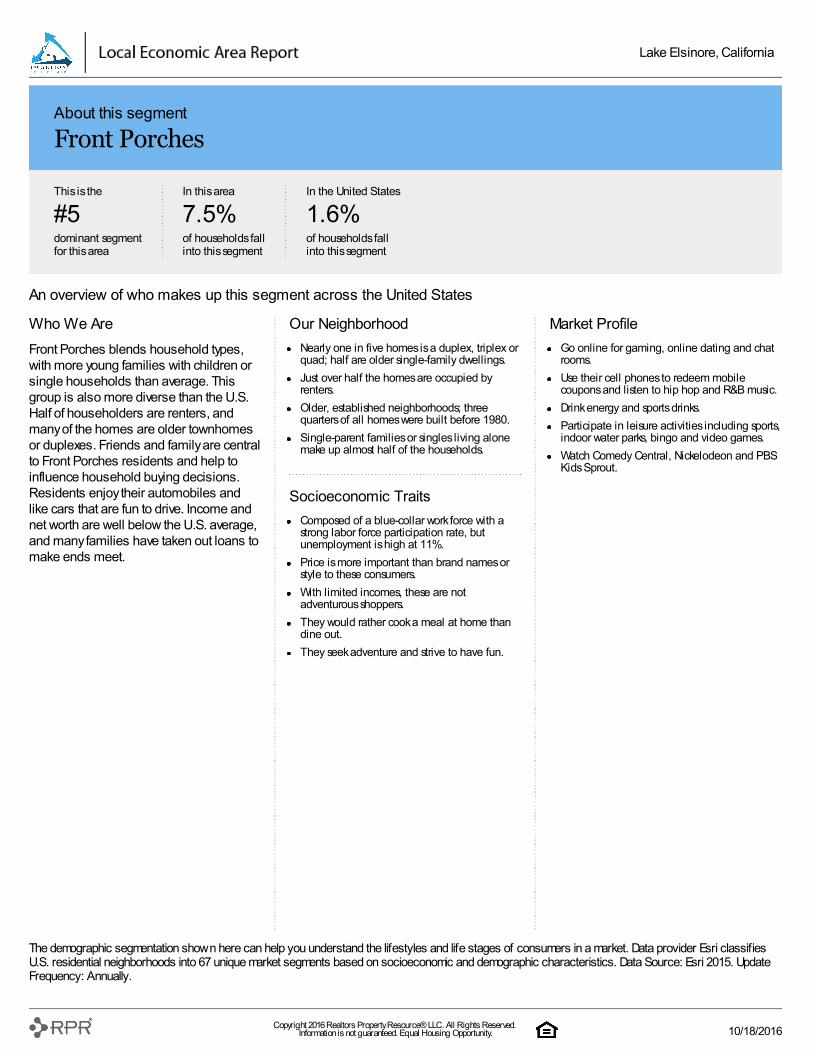
Who We AreFront Porches blends household types,with more young families with children orsingle households than average. Thisgroup is also more diverse than the U.S.Half of householders are renters, andmany of the homes are older townhomesor duplexes. Friends and family are centralto Front Porches residents and help toinfluence household buying decisions.Residents enjoy their automobiles andlike cars that are fun to drive. Income andnet worth are well below the U.S. average,and many families have taken out loans tomake ends meet.
Our NeighborhoodNearly one in five homes is a duplex, triplex orquad; half are older single-family dwellings.Just over half the homes are occupied byrenters.Older, established neighborhoods; threequarters of all homes were built before 1980.Single-parent families or singles living alonemake up almost half of the households.
Socioeconomic TraitsComposed of a blue-collar work force with astrong labor force participation rate, butunemployment is high at 11%.Price is more important than brand names orstyle to these consumers.With limited incomes, these are notadventurous shoppers.They would rather cook a meal at home thandine out.They seek adventure and strive to have fun.
Market ProfileGo online for gaming, online dating and chatrooms.Use their cell phones to redeem mobilecoupons and listen to hip hop and R&B music.Drink energy and sports drinks.Participate in leisure activities including sports,indoor water parks, bingo and video games.Watch Comedy Central, Nickelodeon and PBSKids Sprout.
An overview of who makes up this segment across the United States
The demographic segmentation shown here can help you understand the lifestyles and life stages of consumers in a market. Data provider Esri classifiesU.S. residential neighborhoods into 67 unique market segments based on socioeconomic and demographic characteristics. Data Source: Esri 2015. UpdateFrequency: Annually.
This is the
#5dominant segmentfor this area
In this area
7.5%of households fallinto this segment
In the United States
1.6%of households fallinto this segment
About this segment
Front Porches
Lake Elsinore, California
Copyright 2016 Realtors Property Resource® LLC. All Rights Reserved. Information is not guaranteed. Equal Housing Opportunity. 10/18/2016
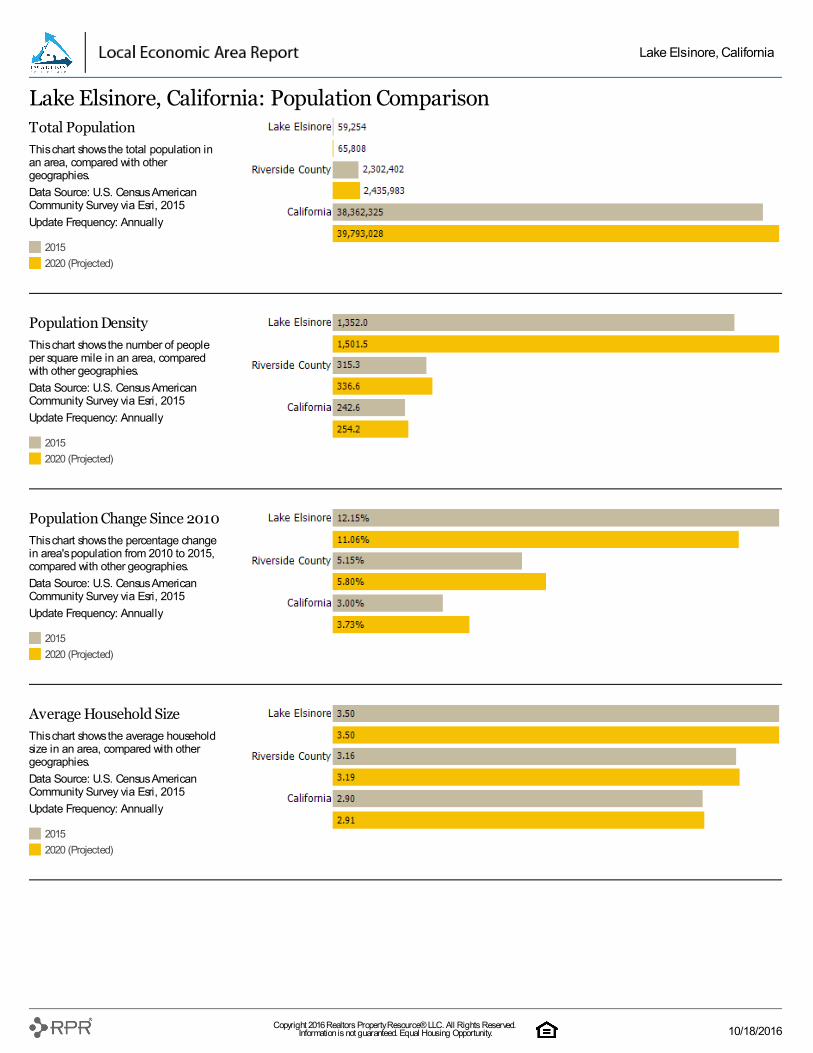
20152020 (Projected)
Total PopulationThis chart shows the total population inan area, compared with othergeographies.Data Source: U.S. Census AmericanCommunity Survey via Esri, 2015Update Frequency: Annually
20152020 (Projected)
Population DensityThis chart shows the number of peopleper square mile in an area, comparedwith other geographies.Data Source: U.S. Census AmericanCommunity Survey via Esri, 2015Update Frequency: Annually
20152020 (Projected)
Population Change Since 2010This chart shows the percentage changein area's population from 2010 to 2015,compared with other geographies.Data Source: U.S. Census AmericanCommunity Survey via Esri, 2015Update Frequency: Annually
20152020 (Projected)
Average Household SizeThis chart shows the average householdsize in an area, compared with othergeographies.Data Source: U.S. Census AmericanCommunity Survey via Esri, 2015Update Frequency: Annually
Lake Elsinore, California: Population Comparison
Lake Elsinore, California
Copyright 2016 Realtors Property Resource® LLC. All Rights Reserved. Information is not guaranteed. Equal Housing Opportunity. 10/18/2016
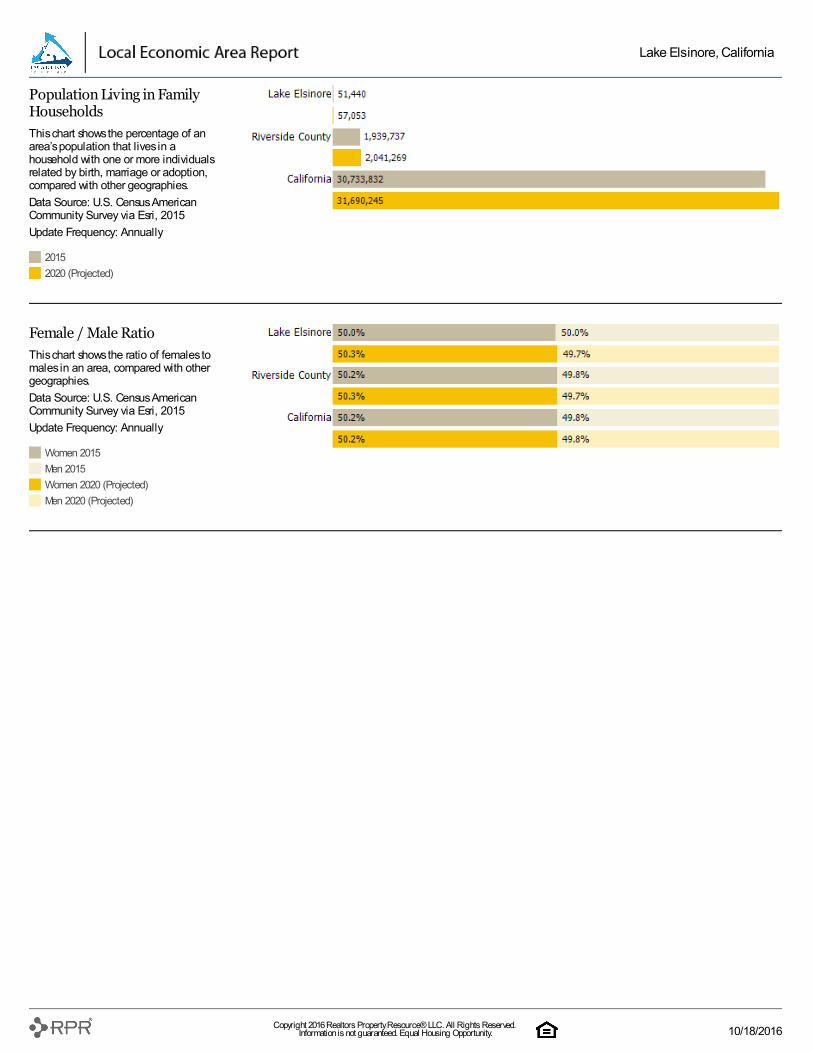
20152020 (Projected)
Population Living in FamilyHouseholdsThis chart shows the percentage of anarea’s population that lives in ahousehold with one or more individualsrelated by birth, marriage or adoption,compared with other geographies.Data Source: U.S. Census AmericanCommunity Survey via Esri, 2015Update Frequency: Annually
Women 2015Men 2015Women 2020 (Projected)Men 2020 (Projected)
Female / Male RatioThis chart shows the ratio of females tomales in an area, compared with othergeographies.Data Source: U.S. Census AmericanCommunity Survey via Esri, 2015Update Frequency: Annually
Lake Elsinore, California
Copyright 2016 Realtors Property Resource® LLC. All Rights Reserved. Information is not guaranteed. Equal Housing Opportunity. 10/18/2016
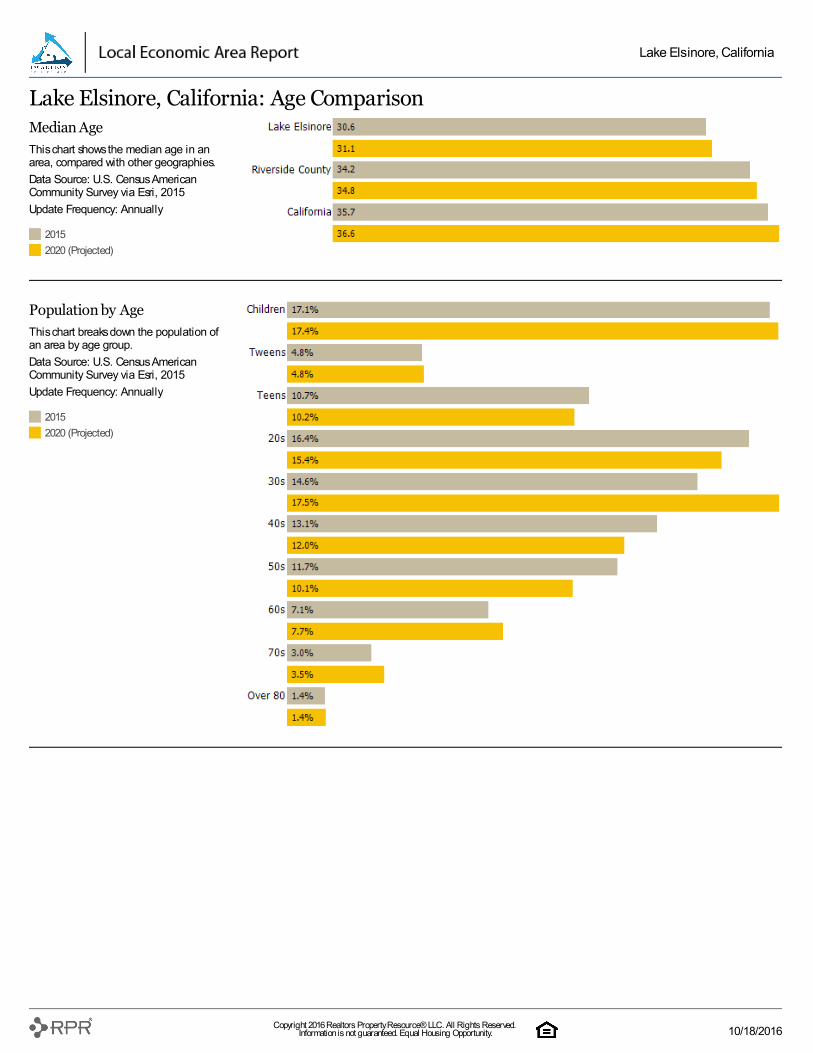
20152020 (Projected)
Median AgeThis chart shows the median age in anarea, compared with other geographies.Data Source: U.S. Census AmericanCommunity Survey via Esri, 2015Update Frequency: Annually
20152020 (Projected)
Population by AgeThis chart breaks down the population ofan area by age group.Data Source: U.S. Census AmericanCommunity Survey via Esri, 2015Update Frequency: Annually
Lake Elsinore, California: Age Comparison
Lake Elsinore, California
Copyright 2016 Realtors Property Resource® LLC. All Rights Reserved. Information is not guaranteed. Equal Housing Opportunity. 10/18/2016
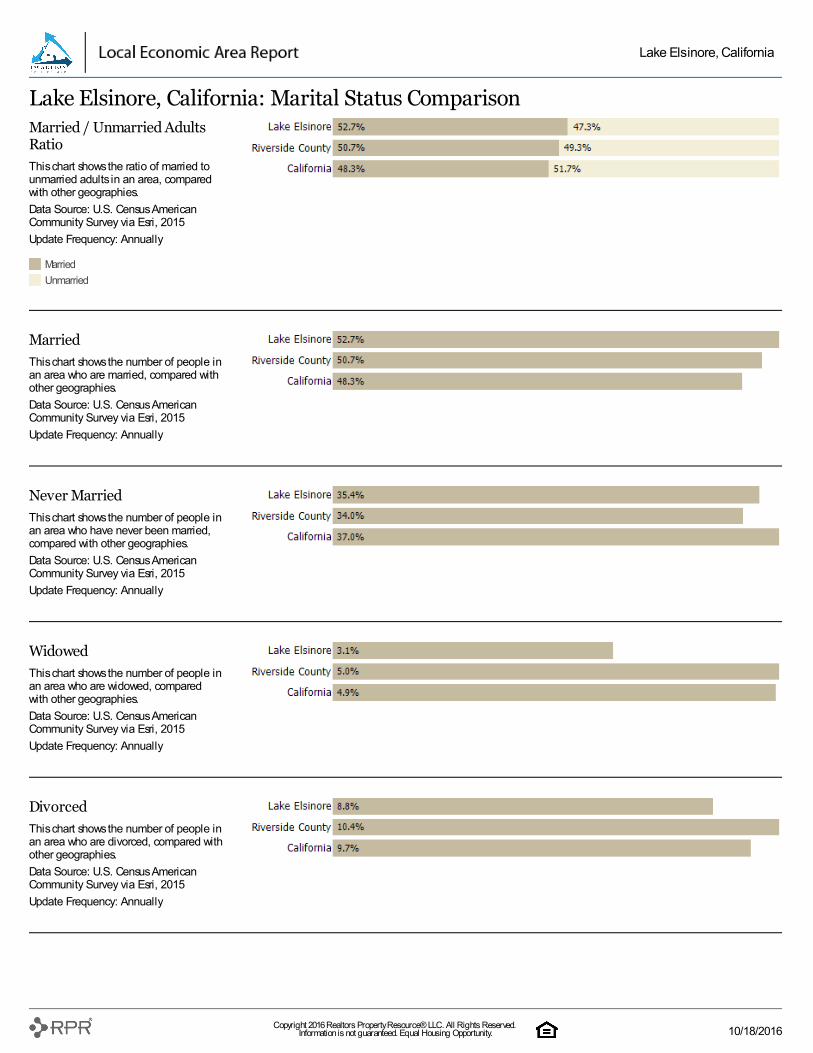
MarriedUnmarried
Married / Unmarried AdultsRatioThis chart shows the ratio of married tounmarried adults in an area, comparedwith other geographies.Data Source: U.S. Census AmericanCommunity Survey via Esri, 2015Update Frequency: Annually
MarriedThis chart shows the number of people inan area who are married, compared withother geographies.Data Source: U.S. Census AmericanCommunity Survey via Esri, 2015Update Frequency: Annually
Never MarriedThis chart shows the number of people inan area who have never been married,compared with other geographies.Data Source: U.S. Census AmericanCommunity Survey via Esri, 2015Update Frequency: Annually
WidowedThis chart shows the number of people inan area who are widowed, comparedwith other geographies.Data Source: U.S. Census AmericanCommunity Survey via Esri, 2015Update Frequency: Annually
DivorcedThis chart shows the number of people inan area who are divorced, compared withother geographies.Data Source: U.S. Census AmericanCommunity Survey via Esri, 2015Update Frequency: Annually
Lake Elsinore, California: Marital Status Comparison
Lake Elsinore, California
Copyright 2016 Realtors Property Resource® LLC. All Rights Reserved. Information is not guaranteed. Equal Housing Opportunity. 10/18/2016
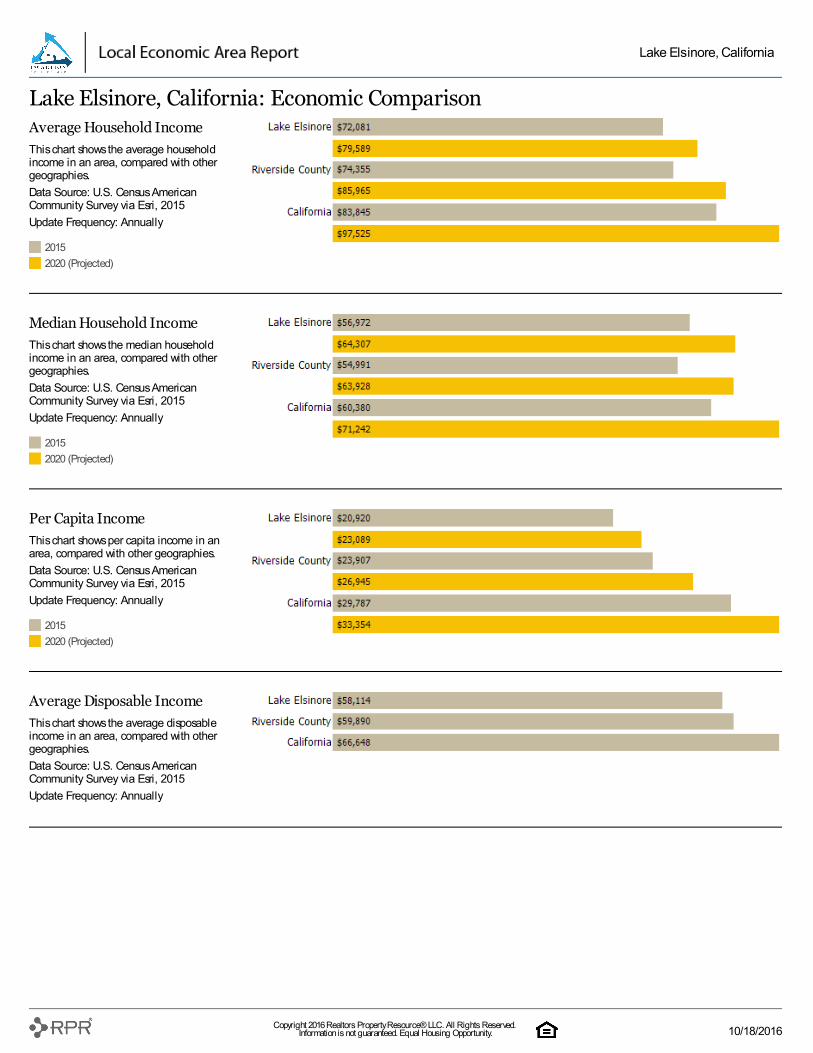
20152020 (Projected)
Average Household IncomeThis chart shows the average householdincome in an area, compared with othergeographies.Data Source: U.S. Census AmericanCommunity Survey via Esri, 2015Update Frequency: Annually
20152020 (Projected)
Median Household IncomeThis chart shows the median householdincome in an area, compared with othergeographies.Data Source: U.S. Census AmericanCommunity Survey via Esri, 2015Update Frequency: Annually
20152020 (Projected)
Per Capita IncomeThis chart shows per capita income in anarea, compared with other geographies.Data Source: U.S. Census AmericanCommunity Survey via Esri, 2015Update Frequency: Annually
Average Disposable IncomeThis chart shows the average disposableincome in an area, compared with othergeographies.Data Source: U.S. Census AmericanCommunity Survey via Esri, 2015Update Frequency: Annually
Lake Elsinore, California: Economic Comparison
Lake Elsinore, California
Copyright 2016 Realtors Property Resource® LLC. All Rights Reserved. Information is not guaranteed. Equal Housing Opportunity. 10/18/2016
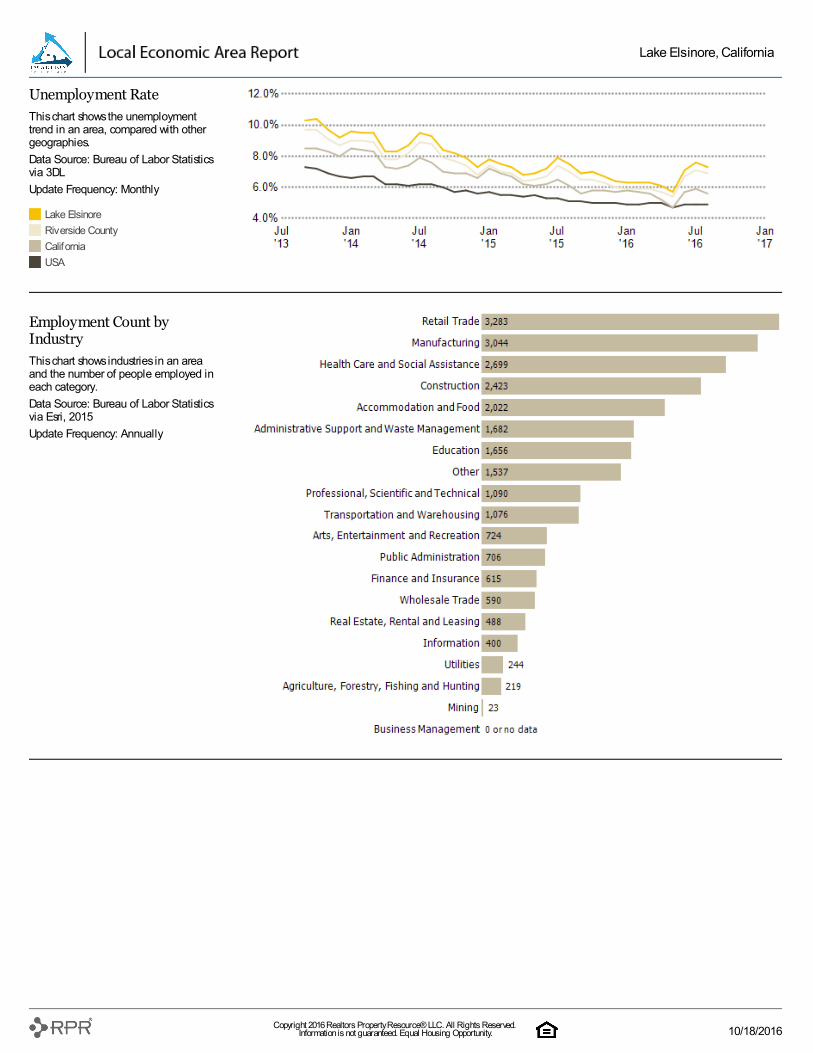
Lake ElsinoreRiverside CountyCaliforniaUSA
Unemployment RateThis chart shows the unemploymenttrend in an area, compared with othergeographies.Data Source: Bureau of Labor Statisticsvia 3DLUpdate Frequency: Monthly
Employment Count byIndustryThis chart shows industries in an areaand the number of people employed ineach category.Data Source: Bureau of Labor Statisticsvia Esri, 2015Update Frequency: Annually
Lake Elsinore, California
Copyright 2016 Realtors Property Resource® LLC. All Rights Reserved. Information is not guaranteed. Equal Housing Opportunity. 10/18/2016
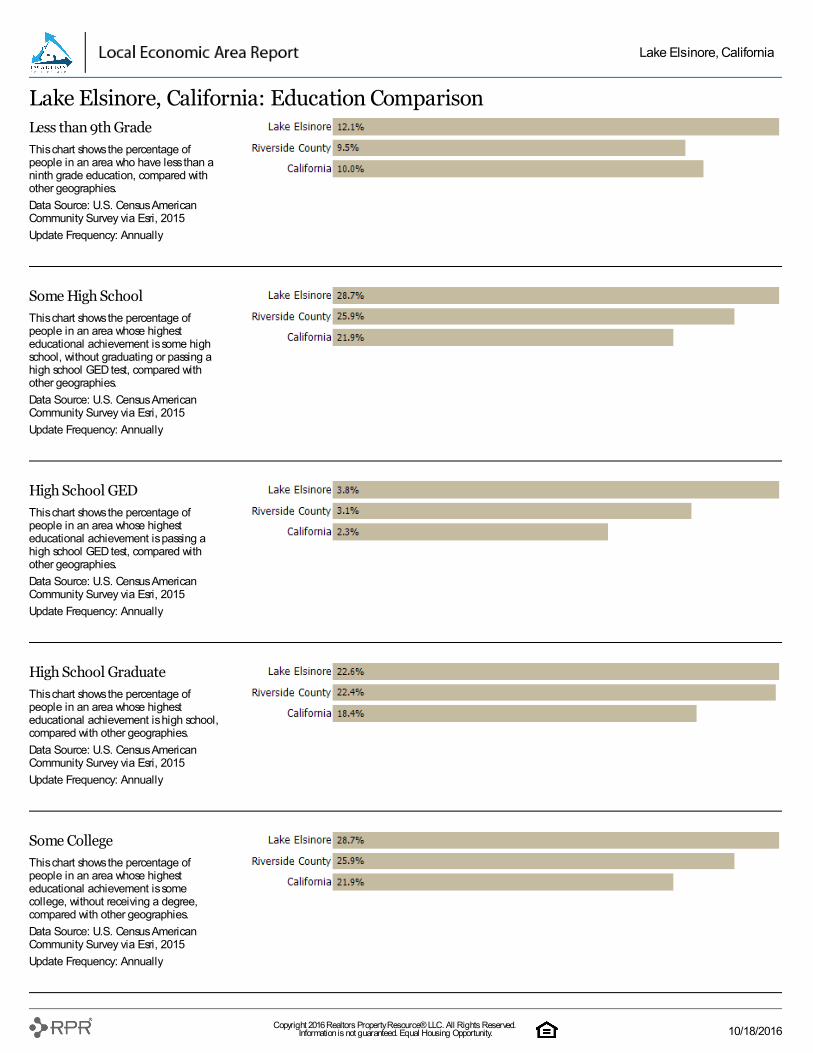
Less than 9th GradeThis chart shows the percentage ofpeople in an area who have less than aninth grade education, compared withother geographies.Data Source: U.S. Census AmericanCommunity Survey via Esri, 2015Update Frequency: Annually
Some High SchoolThis chart shows the percentage ofpeople in an area whose highesteducational achievement is some highschool, without graduating or passing ahigh school GED test, compared withother geographies.Data Source: U.S. Census AmericanCommunity Survey via Esri, 2015Update Frequency: Annually
High School GEDThis chart shows the percentage ofpeople in an area whose highesteducational achievement is passing ahigh school GED test, compared withother geographies.Data Source: U.S. Census AmericanCommunity Survey via Esri, 2015Update Frequency: Annually
High School GraduateThis chart shows the percentage ofpeople in an area whose highesteducational achievement is high school,compared with other geographies.Data Source: U.S. Census AmericanCommunity Survey via Esri, 2015Update Frequency: Annually
Some CollegeThis chart shows the percentage ofpeople in an area whose highesteducational achievement is somecollege, without receiving a degree,compared with other geographies.Data Source: U.S. Census AmericanCommunity Survey via Esri, 2015Update Frequency: Annually
Lake Elsinore, California: Education Comparison
Lake Elsinore, California
Copyright 2016 Realtors Property Resource® LLC. All Rights Reserved. Information is not guaranteed. Equal Housing Opportunity. 10/18/2016
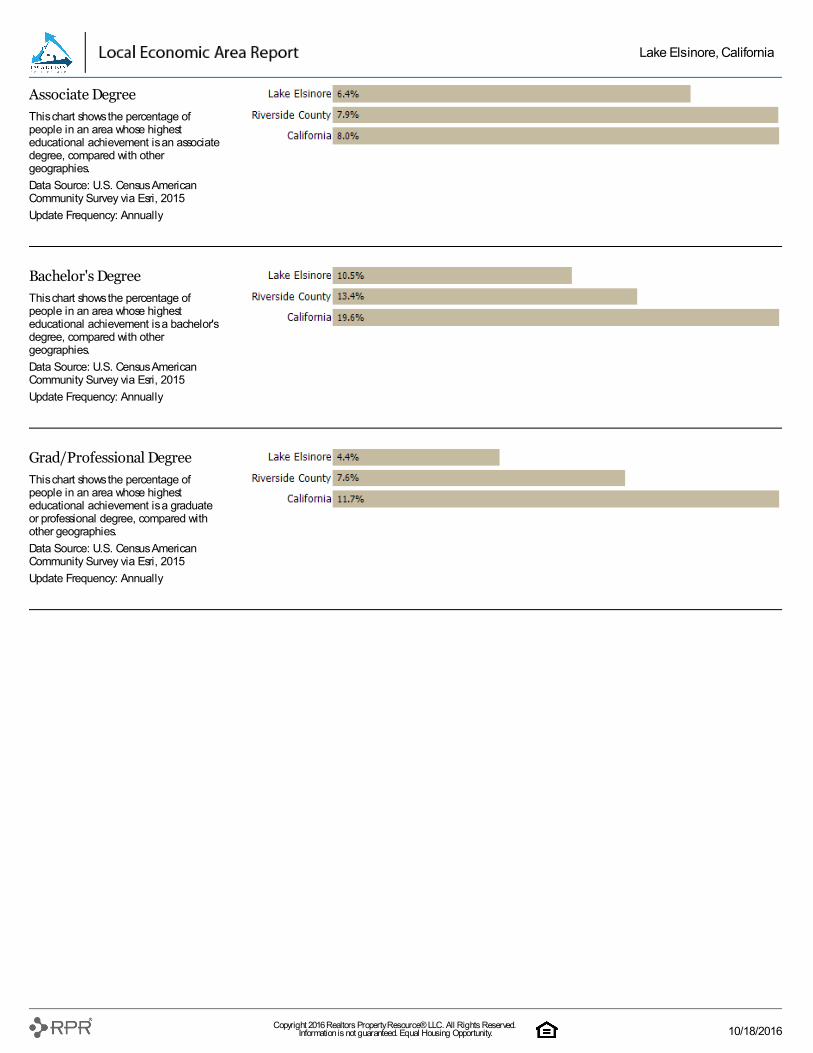
Associate DegreeThis chart shows the percentage ofpeople in an area whose highesteducational achievement is an associatedegree, compared with othergeographies.Data Source: U.S. Census AmericanCommunity Survey via Esri, 2015Update Frequency: Annually
Bachelor's DegreeThis chart shows the percentage ofpeople in an area whose highesteducational achievement is a bachelor'sdegree, compared with othergeographies.Data Source: U.S. Census AmericanCommunity Survey via Esri, 2015Update Frequency: Annually
Grad/Professional DegreeThis chart shows the percentage ofpeople in an area whose highesteducational achievement is a graduateor professional degree, compared withother geographies.Data Source: U.S. Census AmericanCommunity Survey via Esri, 2015Update Frequency: Annually
Lake Elsinore, California
Copyright 2016 Realtors Property Resource® LLC. All Rights Reserved. Information is not guaranteed. Equal Housing Opportunity. 10/18/2016
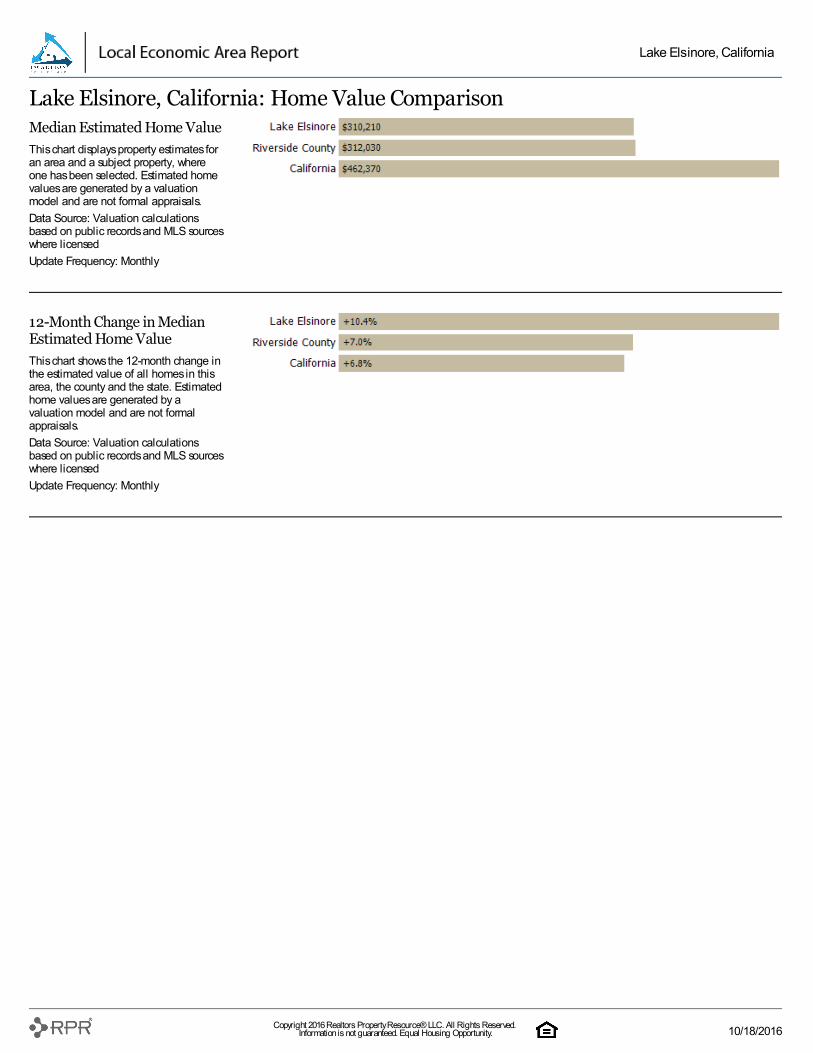
Median Estimated Home ValueThis chart displays property estimates foran area and a subject property, whereone has been selected. Estimated homevalues are generated by a valuationmodel and are not formal appraisals.Data Source: Valuation calculationsbased on public records and MLS sourceswhere licensedUpdate Frequency: Monthly
12-Month Change in MedianEstimated Home ValueThis chart shows the 12-month change inthe estimated value of all homes in thisarea, the county and the state. Estimatedhome values are generated by avaluation model and are not formalappraisals.Data Source: Valuation calculationsbased on public records and MLS sourceswhere licensedUpdate Frequency: Monthly
Lake Elsinore, California: Home Value Comparison
Lake Elsinore, California
Copyright 2016 Realtors Property Resource® LLC. All Rights Reserved. Information is not guaranteed. Equal Housing Opportunity. 10/18/2016
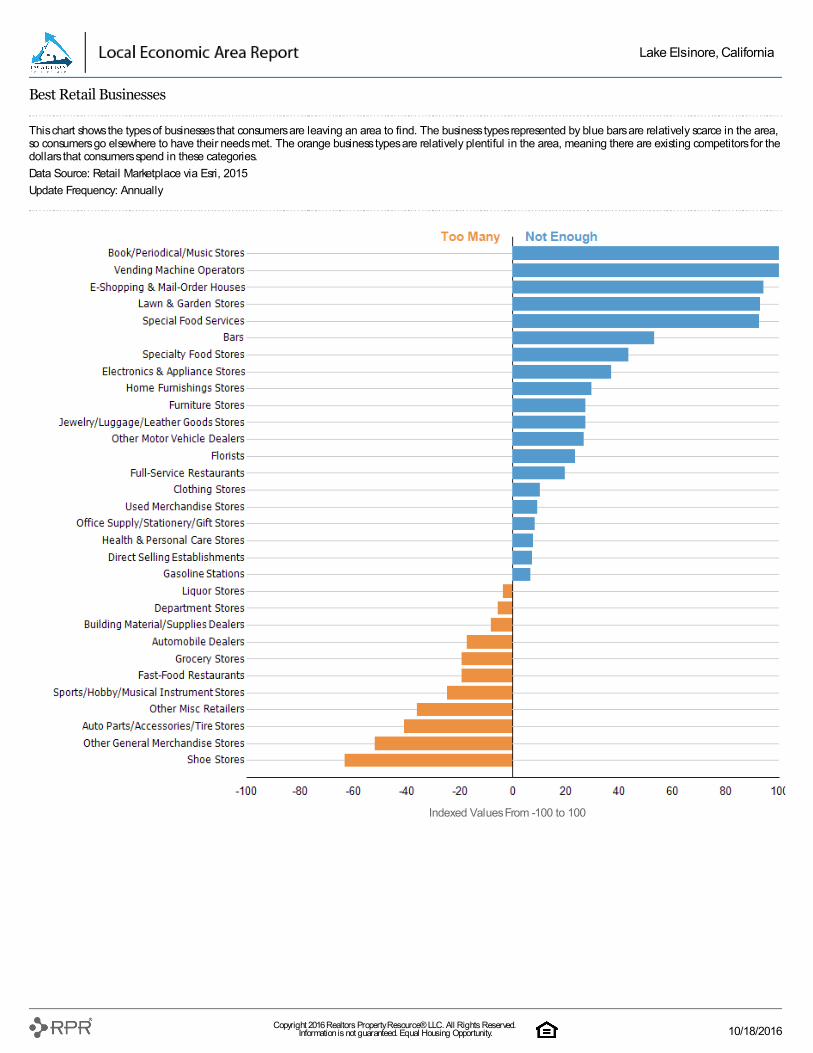
Best Retail Businesses
This chart shows the types of businesses that consumers are leaving an area to find. The business types represented by blue bars are relatively scarce in the area,so consumers go elsewhere to have their needs met. The orange business types are relatively plentiful in the area, meaning there are existing competitors for thedollars that consumers spend in these categories.Data Source: Retail Marketplace via Esri, 2015Update Frequency: Annually
Indexed Values From -100 to 100
Lake Elsinore, California
Copyright 2016 Realtors Property Resource® LLC. All Rights Reserved. Information is not guaranteed. Equal Housing Opportunity. 10/18/2016
RPR compiles the data in this report from a variety of sources:• Census data from the U.S. Census American Community Survey,provided by data partner 3DL• Demographic data known as Tapestry Segmentation, provided by datapartner Esri. Tapestry classifies U.S. residential neighborhoods into uniquemarket segments based on socioeconomic and demographiccharacteristics.• Valuation calculations are based on public records and MLS sourceswhere licensed
• Retail Marketplace data shown in the Best Businesses analysis isprovided by data partner Esri. This analysis compares supply and demandfor specific retail products. The results are presented as the gap betweenthe two in a location.
Most data types in this report are refreshed on an annual basis. The U.S.Census source dates are shown with each chart. The Esri Tapestry Segmentdata is 2015. The home valuation information is refreshed monthly.
About RPR
What is RPR?Comprehensive data, powerful analytics and dynamic reports for members of the National Association of REALTORS®
100% Owned by REALTORS®Created by NAR for the sole purpose of providing REALTORS® with the data they need to meet the demands of their clients.
Learn MoreFor more information about RPR and our programming, please visit our public website:http://blog.narrpr.com
About Our Data
Realtors Property Resource® is a wholly owned subsidiary of the NationalAssociation of REALTORS® provided exclusively to its members. This report hasbeen provided to you as a public service by a member of NAR.
Lake Elsinore, California
Copyright 2016 Realtors Property Resource® LLC. All Rights Reserved. Information is not guaranteed. Equal Housing Opportunity. 10/18/2016