Embed Size (px)
Citation preview
November 2014 Monthly Snapshot
One-Year Change in One-Year Change inMedian Sales Price
Single FamilyMedian Sales Price Condo/TIC/Coop
23456789
10111213141516
Current as of December 11, 2014. All data from the San Francisco MLS. Powered by 10K Research and Marketing.
Condo/TIC/Coop Activity Overview
Inventory of Active Listings% of Properties Sold Over List Price% of List Price ReceivedHousing Affordability Ratio
All Properties Activity Overview
New ListingsPending SalesSold ListingsMedian Sales PriceAverage Sales PriceDays on Market Until Sale
Activity by District
Monthly Indicators
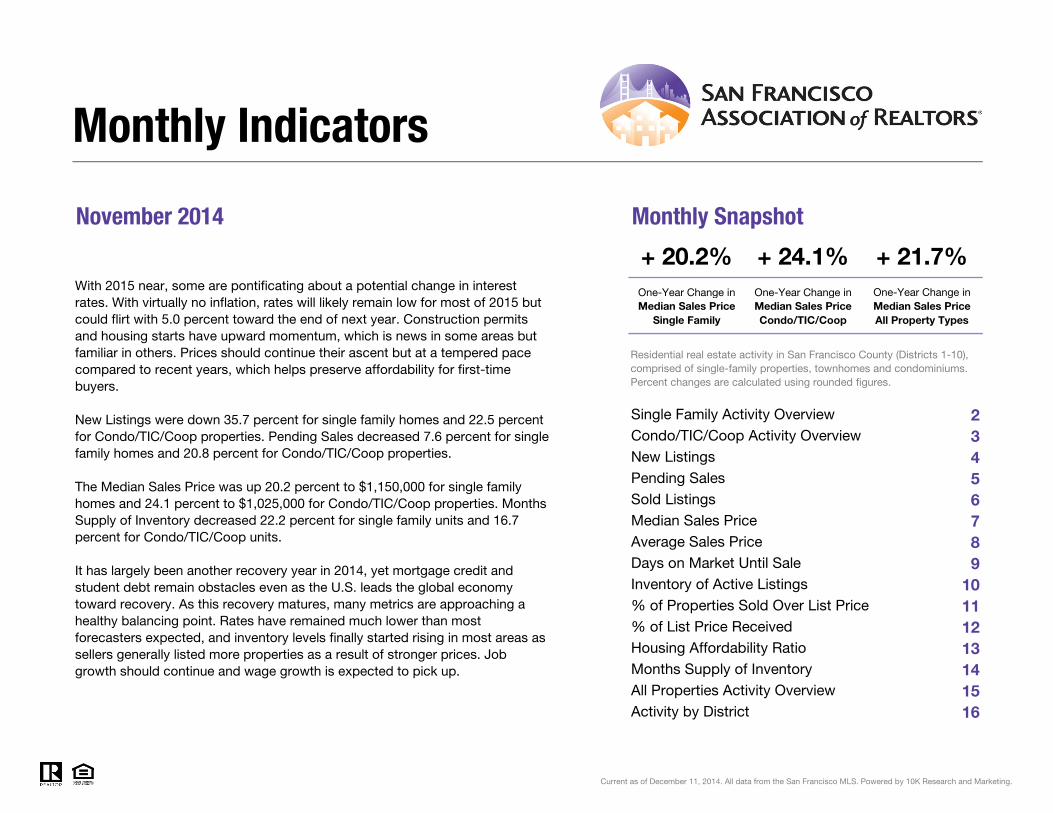
+ 20.2% + 24.1% + 21.7%One-Year Change inWith 2015 near, some are pontificating about a potential change in interest
rates. With virtually no inflation, rates will likely remain low for most of 2015 but could flirt with 5.0 percent toward the end of next year. Construction permits and housing starts have upward momentum, which is news in some areas but familiar in others. Prices should continue their ascent but at a tempered pace compared to recent years, which helps preserve affordability for first-time buyers.
New Listings were down 35.7 percent for single family homes and 22.5 percent for Condo/TIC/Coop properties. Pending Sales decreased 7.6 percent for single family homes and 20.8 percent for Condo/TIC/Coop properties.
The Median Sales Price was up 20.2 percent to $1,150,000 for single family homes and 24.1 percent to $1,025,000 for Condo/TIC/Coop properties. Months Supply of Inventory decreased 22.2 percent for single family units and 16.7 percent for Condo/TIC/Coop units.
It has largely been another recovery year in 2014, yet mortgage credit and student debt remain obstacles even as the U.S. leads the global economy toward recovery. As this recovery matures, many metrics are approaching a healthy balancing point. Rates have remained much lower than most forecasters expected, and inventory levels finally started rising in most areas as sellers generally listed more properties as a result of stronger prices. Job growth should continue and wage growth is expected to pick up.
Median Sales Price All Property Types
Residential real estate activity in San Francisco County (Districts 1-10), comprised of single-family properties, townhomes and condominiums. Percent changes are calculated using rounded figures.
Single Family Activity Overview
Months Supply of Inventory

Single Family Activity OverviewKey metrics by report month and for year-to-date (YTD) starting from the first of the year.
Key Metrics Historical Sparkbars 11-2013 11-2014 Percent Change YTD 2013 YTD 2014 Percent Change
- 8.6%2,629
2,200 - 10.1%
$1,075,000 + 18.1%
+ 13.8%
Pending Sales 224 207 - 7.6% - 7.9%2,457 2,262
New Listings 171 110 - 35.7% 2,877
Sold Listings 240 193 - 19.6% 2,446
Median Sales Price $957,000 $1,150,000 + 20.2% $910,000
31 - 13.9%
$1,463,696
-- --
Days on Market 34 32 - 5.9% 36
Avg. Sales Price $1,323,997 $1,522,050 + 15.0% $1,286,133
Active Listings 397 280 - 29.5% --
% of Properties Sold Over List Price 77.5% 79.7% + 2.8% 77.0%
53
80.6% + 4.7%
+ 2.3%
43 - 18.9%
112.6%% of List Price Received 108.7% 111.0% + 2.1% 110.1%
Current as of December 11, 2014. All data from the San Francisco MLS. Powered by 10K Research and Marketing. | Click for Cover Page | 2
Months Supply 1.8 1.4 - 22.2% -- -- --
Affordability Ratio 51 40 - 21.6%
11-2011 11-2012 11-2013 11-2014
11-2011 11-2012 11-2013 11-2014
11-2011 11-2012 11-2013 11-2014
11-2011 11-2012 11-2013 11-2014
11-2011 11-2012 11-2013 11-2014
11-2011 11-2012 11-2013 11-2014
11-2011 11-2012 11-2013 11-2014
11-2011 11-2012 11-2013 11-2014
11-2011 11-2012 11-2013 11-2014
11-2011 11-2012 11-2013 11-2014
11-2011 11-2012 11-2013 11-2014

Condo/TIC/Coop Activity OverviewKey metrics by report month and for year-to-date (YTD) starting from the first of the year.
Key Metrics Historical Sparkbars 11-2013 11-2014 Percent Change YTD 2013 YTD 2014 Percent Change
- 7.1%
Pending Sales 269 213 - 20.8% 3,149 2,950 - 6.3%
New Listings 191 148 - 22.5% 3,771 3,504
Sold Listings 284 208 - 26.8% 3,087 2,908 - 5.8%
Median Sales Price $826,000 $1,025,000 + 24.1% $825,000 $945,000 + 14.5%
+ 14.3%
36 - 12.2%
$1,095,156
-- --
Days on Market 41 39 - 4.9% 41
Avg. Sales Price $978,584 $1,127,697 + 15.2% $957,797
Active Listings 507 404 - 20.3% --
% of Properties Sold Over List Price 62.3% 67.8% + 8.8% 65.4%
68
68.7% + 5.0%
+ 1.7%
56 - 17.6%
107.2%% of List Price Received 105.0% 106.7% + 1.6% 105.4%
Current as of December 11, 2014. All data from the San Francisco MLS. Powered by 10K Research and Marketing. | Click for Cover Page | 3
Months Supply 1.8 1.5 - 16.7% -- -- --
Affordability Ratio 67 52 - 22.4%
11-2011 11-2012 11-2013 11-2014
11-2011 11-2012 11-2013 11-2014
11-2011 11-2012 11-2013 11-2014
11-2011 11-2012 11-2013 11-2014
11-2011 11-2012 11-2013 11-2014
11-2011 11-2012 11-2013 11-2014
11-2011 11-2012 11-2013 11-2014
11-2011 11-2012 11-2013 11-2014
11-2011 11-2012 11-2013 11-2014
11-2011 11-2012 11-2013 11-2014
11-2011 11-2012 11-2013 11-2014

New Listings
New ListingsSingleFamily
Year-Over-YearChange
Condo/TIC/Coop
Year-Over-YearChange
Dec-2013 112 +9.8% 116 +1.8%
Jan-2014 207 +1.5% 338 +8.7%
Feb-2014 196 -7.1% 304 -3.8%
Mar-2014 235 -7.5% 303 -18.1%
Apr-2014 243 -19.5% 368 -7.1%
May-2014 274 -19.2% 356 -7.3%
Jun-2014 280 -4.4% 357 -0.6%
Jul-2014 266 +2.7% 351 +5.7%
Aug-2014 223 -18.0% 269 -21.1%
Sep-2014 351 +19.0% 387 -14.0%
Oct-2014 244 -11.9% 323 +0.6%
Nov-2014 110 -35.7% 148 -22.5%
12-Month Avg 228 -8.0% 302 -6.8%
Historical New Listings by Month
Current as of December 11, 2014. All data from the San Francisco MLS. Powered by 10K Research and Marketing. | Click for Cover Page | 4
A count of the properties that have been newly listed on the market in a given month.
181
211
171
191
110
148
Single Family Condo/TIC/Coop
November
0
100
200
300
400
500
600
700
1-2005 1-2006 1-2007 1-2008 1-2009 1-2010 1-2011 1-2012 1-2013 1-2014
Single Family Condo/TIC/Coop
2,870
3,476
2,877
3,771
2,629
3,504
Single Family Condo/TIC/Coop
Year to Date
2012 2013 2014
- 22.5%- 9.5%- 35.7%- 5.5% + 8.5%- 8.6%+ 0.2% - 7.1%
2012 2013 2014 2012 2013 2014 2012 2013 2014
+ 22.3% - 11.5% - 6.3%+ 36.1%

Pending Sales
Pending SalesSingleFamily
Year-Over-YearChange
Condo/TIC/Coop
Year-Over-YearChange
Dec-2013 173 +1.8% 202 -0.5%
Jan-2014 131 -17.1% 185 +6.3%
Feb-2014 166 +11.4% 251 +15.7%
Mar-2014 217 +4.8% 295 -2.3%
Apr-2014 209 -13.6% 294 -4.9%
May-2014 216 -19.7% 297 -17.5%
Jun-2014 201 -27.4% 306 +5.5%
Jul-2014 227 -8.5% 277 -16.6%
Aug-2014 204 -10.9% 264 -12.6%
Sep-2014 214 +1.9% 268 +5.5%
Oct-2014 270 +10.7% 300 -11.8%
Nov-2014 207 -7.6% 213 -20.8%
12-Month Avg 203 -7.3% 263 -6.0%
Historical Pending Sales by Month
Current as of December 11, 2014. All data from the San Francisco MLS. Powered by 10K Research and Marketing. | Click for Cover Page | 5
A count of the properties on which offers have been accepted in a given month.
251271
224
269
207 213
Single Family Condo/TIC/Coop
November
0
100
200
300
400
1-2005 1-2006 1-2007 1-2008 1-2009 1-2010 1-2011 1-2012 1-2013 1-2014
Single Family Condo/TIC/Coop
2,477
2,951
2,457
3,149
2,262
2,950
Single Family Condo/TIC/Coop
Year to Date
2012 2013 2014
- 20.8%- 0.7%- 7.6%- 10.8% + 6.7%- 7.9%- 0.8% - 6.3%
2012 2013 2014 2012 2013 2014 2012 2013 2014
+ 15.1% + 7.2% + 22.3%+ 21.0%

Sold Listings
Sold ListingsSingleFamily
Year-Over-YearChange
Condo/TIC/Coop
Year-Over-YearChange
Dec-2013 216 +3.3% 246 -2.0%
Jan-2014 133 -17.4% 180 +15.4%
Feb-2014 157 +21.7% 222 +13.8%
Mar-2014 177 -14.5% 267 -5.3%
Apr-2014 207 -6.8% 327 +7.6%
May-2014 230 -8.7% 295 -22.4%
Jun-2014 192 -29.7% 284 +2.5%
Jul-2014 229 -17.9% 276 -19.1%
Aug-2014 209 -12.2% 287 -5.3%
Sep-2014 195 +3.2% 245 +7.0%
Oct-2014 278 +8.6% 317 -5.7%
Nov-2014 193 -19.6% 208 -26.8%
12-Month Avg 201 -9.0% 263 -5.5%
Historical Sold Listings by Month
Current as of December 11, 2014. All data from the San Francisco MLS. Powered by 10K Research and Marketing. | Click for Cover Page | 6
A count of the actual sales that closed in a given month.
272 270
240
284
193208
Single Family Condo/TIC/Coop
November
0
100
200
300
400
1-2005 1-2006 1-2007 1-2008 1-2009 1-2010 1-2011 1-2012 1-2013 1-2014
Single Family Condo/TIC/Coop
2,425
2,918
2,446
3,087
2,200
2,908
Single Family Condo/TIC/Coop
Year to Date
2012 2013 2014
- 26.8%+ 5.2%- 19.6%- 11.8% + 5.8%- 10.1%+ 0.9% - 5.8%
2012 2013 2014 2012 2013 2014 2012 2013 2014
+ 16.7% + 8.0% + 23.2%+ 29.8%

Median Sales Price
Median Sales PriceSingleFamily
Year-Over-YearChange
Condo/TIC/Coop
Year-Over-YearChange
Dec-2013 $947,000 +13.4% $762,500 +9.1%
Jan-2014 $925,000 +24.2% $950,000 +24.6%
Feb-2014 $1,050,000 +31.2% $937,000 +24.9%
Mar-2014 $985,000 +7.1% $970,000 +17.9%
Apr-2014 $1,100,000 +10.0% $905,000 +7.1%
May-2014 $1,090,500 +7.2% $940,000 +13.3%
Jun-2014 $1,175,000 +25.3% $967,500 +24.0%
Jul-2014 $1,082,000 +24.4% $944,500 +11.1%
Aug-2014 $968,000 +3.6% $930,000 +14.8%
Sep-2014 $1,040,000 +12.1% $915,000 +10.8%
Oct-2014 $1,200,000 +32.6% $955,000 +10.5%
Nov-2014 $1,150,000 +20.2% $1,025,000 +24.1%
12-Month Avg* $1,060,000 +17.1% $930,000 +13.8%
Historical Median Sales Price by Month* Median Sales Price for all properties from December 2013 through November 2014. This is not the average of the individual figures above.
Current as of December 11, 2014. All data from the San Francisco MLS. Powered by 10K Research and Marketing. | Click for Cover Page | 7
Point at which half of the sales sold for more and half sold for less, not accounting for seller concessions, in a given month.
$810,000$775,000
$957,000
$826,000
$1,150,000
$1,025,000
Single Family Condo/TIC/Coop
November
$400,000
$600,000
$800,000
$1,000,000
$1,200,000
$1,400,000
1-2005 1-2006 1-2007 1-2008 1-2009 1-2010 1-2011 1-2012 1-2013 1-2014
Single Family Condo/TIC/Coop
$755,000$709,500
$910,000
$825,000
$1,075,000
$945,000
Single Family Condo/TIC/Coop
Year to Date
2012 2013 2014
+ 24.1%+ 6.6%+ 20.2%+ 18.1% + 16.3%+ 18.1%+ 20.5% + 14.5%
2012 2013 2014 2012 2013 2014 2012 2013 2014
+ 20.0% + 8.2% + 12.8%+ 26.5%

Average Sales Price
Avg. Sales PriceSingleFamily
Year-Over-YearChange
Condo/TIC/Coop
Year-Over-YearChange
Dec-2013 $1,376,546 -0.6% $1,020,083 +19.3%
Jan-2014 $1,238,831 +36.1% $1,126,706 +35.3%
Feb-2014 $1,462,472 +25.4% $994,160 +13.6%
Mar-2014 $1,423,755 +4.3% $1,062,576 +11.4%
Apr-2014 $1,510,889 +10.9% $1,114,835 +14.6%
May-2014 $1,459,316 -2.1% $1,160,115 +18.4%
Jun-2014 $1,597,260 +33.9% $1,170,918 +25.9%
Jul-2014 $1,408,308 +10.1% $1,093,443 +7.4%
Aug-2014 $1,328,942 +2.1% $1,092,040 +17.5%
Sep-2014 $1,332,003 +8.1% $1,015,048 +7.8%
Oct-2014 $1,673,397 +24.1% $1,071,763 +6.3%
Nov-2014 $1,522,050 +15.0% $1,127,697 +15.2%
12-Month Avg* $1,455,898 +12.5% $1,089,299 +14.7%
Historical Average Sales Price by Month* Avg. Sales Price for all properties from December 2013 through November 2014. This is not the average of the individual figures above.
Current as of December 11, 2014. All data from the San Francisco MLS. Powered by 10K Research and Marketing. | Click for Cover Page | 8
Average sales price for all closed sales, not accounting for seller concessions, in a given month.
$1,114,319
$970,414
$1,323,997
$978,584
$1,522,050
$1,127,697
Single Family Condo/TIC/Coop
November
$600,000
$800,000
$1,000,000
$1,200,000
$1,400,000
$1,600,000
$1,800,000
1-2005 1-2006 1-2007 1-2008 1-2009 1-2010 1-2011 1-2012 1-2013 1-2014
Single Family Condo/TIC/Coop
$1,079,832
$815,267
$1,286,133
$957,797
$1,463,696
$1,095,156
Single Family Condo/TIC/Coop
Year to Date
2012 2013 2014
+ 15.2%+ 0.8%+ 15.0%+ 18.8% + 17.5%+ 13.8%+ 19.1% + 14.3%
2012 2013 2014 2012 2013 2014 2012 2013 2014
+ 1.6% + 12.3% + 10.9%+ 23.7%

Days on Market Until Sale
Days on MarketSingleFamily
Year-Over-YearChange
Condo/TIC/Coop
Year-Over-YearChange
Dec-2013 42 -12.5% 44 -27.9%
Jan-2014 40 -18.4% 51 -19.0%
Feb-2014 38 -7.3% 40 -18.4%
Mar-2014 32 -17.9% 33 -21.4%
Apr-2014 35 0.0% 33 -19.5%
May-2014 26 -18.8% 29 -19.4%
Jun-2014 27 -22.9% 36 -5.3%
Jul-2014 30 -9.1% 34 -12.8%
Aug-2014 29 -23.7% 34 -10.5%
Sep-2014 27 -10.0% 39 +5.4%
Oct-2014 31 -8.8% 37 -2.6%
Nov-2014 32 -5.9% 39 -4.9%
12-Month Avg* 32 -12.5% 37 -12.9%
Historical Days on Market Until Sale by Month* Days on Market for all properties from December 2013 through November 2014. This is not the average of the individual figures above.
Current as of December 11, 2014. All data from the San Francisco MLS. Powered by 10K Research and Marketing. | Click for Cover Page | 9
Average number of days between when a property is listed and when an offer is accepted in a given month.
42
51
34
41
32
39
Single Family Condo/TIC/Coop
November
20
40
60
80
100
120
1-2005 1-2006 1-2007 1-2008 1-2009 1-2010 1-2011 1-2012 1-2013 1-2014
Single Family Condo/TIC/Coop
53
62
3641
3136
Single Family Condo/TIC/Coop
Year to Date
2012 2013 2014
- 4.9%- 19.6%- 5.9%- 19.0% - 33.9%- 13.9%- 32.1% - 12.2%
2012 2013 2014 2012 2013 2014 2012 2013 2014
- 26.3% - 17.2% - 22.5%- 37.8%

Inventory of Active Listings
Active ListingsSingleFamily
Year-Over-YearChange
Condo/TIC/Coop
Year-Over-YearChange
D ec-2013 273 -14.7% 336 -18.0%
Jan-2014 324 -4.7% 463 -7.8%
F eb -2014 332 -13.3% 492 -14.7%
M ar-2014 334 -18.1% 474 -23.1%
A p r-2014 344 -22.9% 523 -21.0%
M ay-2014 380 -21.8% 553 -13.9%
Jun-2014 428 -8.7% 568 -13.5%
Jul-2014 429 -6.3% 576 -6.0%
A ug-2014 398 -15.1% 507 -14.1%
S ep -2014 491 -2.6% 564 -21.9%
O ct-2014 409 -17.2% 529 -17.5%
Nov-2014 280 -29.5% 404 -20.3%
12-M o nth A vg* 369 -14.5% 499 -16.1%
Historical Inventory of Active Listings by Month* A c tive L is tings fo r a ll p ro p erties fro m D ecem b er 2013 thro ugh N o vem b er 2014. Th is is no t the average o f the ind iv id ua l figures ab o ve.
C urrent as o f D ecem b er 11, 2014. A ll d ata fro m the S an F ranc isco M LS . P o wered b y 10K R esearch and M arketing . | C lick fo r C o ver P age | 10
The num b er o f p ro p erties availab le fo r sa le in ac tive s tatus at the end o f a g iven m o nth.
446
602
397
507
280
404
Single Family Condo/TIC/Coop
November
200
400
600
800
1,000
1,200
1,400
1,600
1-2005 1-2006 1-2007 1-2008 1-2009 1-2010 1-2011 1-2012 1-2013 1-2014
Single Family Condo/TIC/Coop
2012 2013 2014- 20.3%- 15.8%- 29.5%- 11.0%
2012 2013 2014
- 33.5% - 29.9%
% of Properties Sold Over List Price
% of Properties Sold Over List Price
SingleFamily
Year-Over-YearChange
Condo/TIC/Coop
Year-Over-YearChange
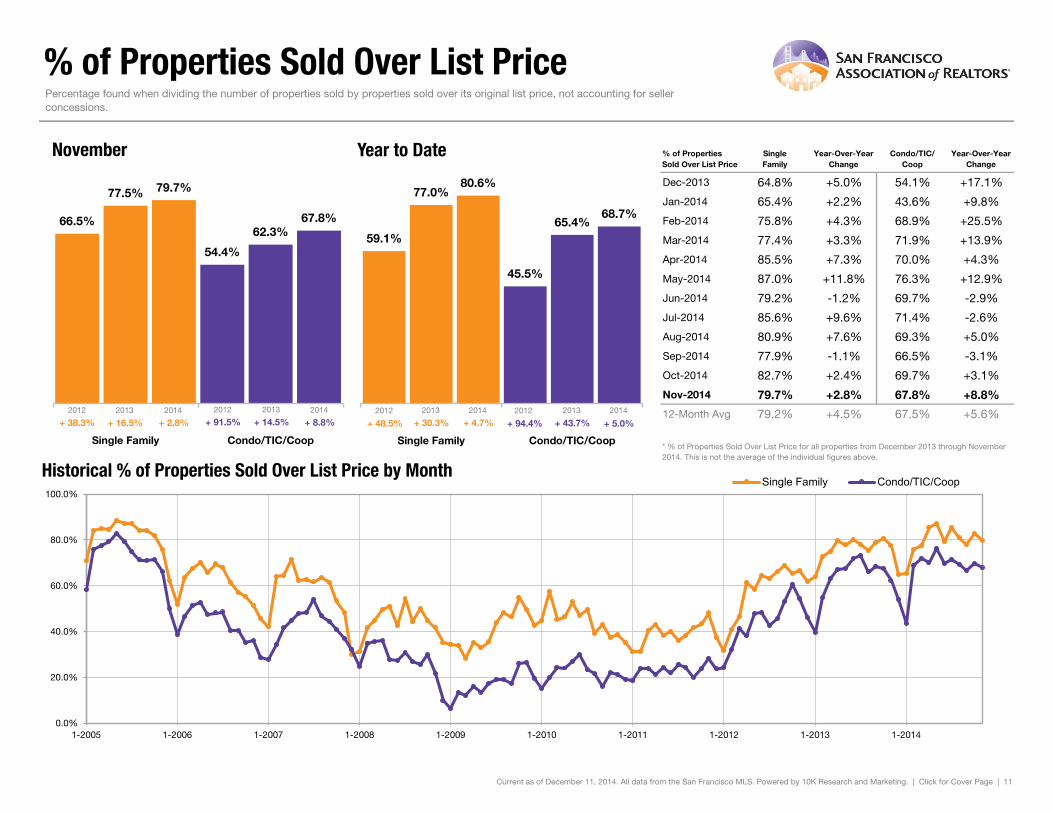
Dec-2013 64.8% +5.0% 54.1% +17.1%
Jan-2014 65.4% +2.2% 43.6% +9.8%
Feb-2014 75.8% +4.3% 68.9% +25.5%
Mar-2014 77.4% +3.3% 71.9% +13.9%
Apr-2014 85.5% +7.3% 70.0% +4.3%
May-2014 87.0% +11.8% 76.3% +12.9%
Jun-2014 79.2% -1.2% 69.7% -2.9%
Jul-2014 85.6% +9.6% 71.4% -2.6%
Aug-2014 80.9% +7.6% 69.3% +5.0%
Sep-2014 77.9% -1.1% 66.5% -3.1%
Oct-2014 82.7% +2.4% 69.7% +3.1%
Nov-2014 79.7% +2.8% 67.8% +8.8%
12-Month Avg 79.2% +4.5% 67.5% +5.6%
Historical % of Properties Sold Over List Price by Month* % of Properties Sold Over List Price for all properties from December 2013 through November 2014. This is not the average of the individual figures above.
Current as of December 11, 2014. All data from the San Francisco MLS. Powered by 10K Research and Marketing. | Click for Cover Page | 11
Percentage found when dividing the number of properties sold by properties sold over its original list price, not accounting for seller concessions.
66.5%
54.4%
77.5%
62.3%
79.7%
67.8%
Single Family Condo/TIC/Coop
November
0.0%
20.0%
40.0%
60.0%
80.0%
100.0%
1-2005 1-2006 1-2007 1-2008 1-2009 1-2010 1-2011 1-2012 1-2013 1-2014
Single Family Condo/TIC/Coop
59.1%
45.5%
77.0%
65.4%
80.6%
68.7%
Single Family Condo/TIC/Coop
Year to Date
2012 2013 2014
+ 8.8%+ 14.5%+ 2.8%+ 16.5% + 43.7%+ 4.7%+ 30.3% + 5.0%
2012 2013 2014 2012 2013 2014 2012 2013 2014
+ 38.3% + 48.5% + 94.4%+ 91.5%
% of List Price Received
% of List Price Received
SingleFamily
Year-Over-YearChange
Condo/TIC/Coop
Year-Over-YearChange
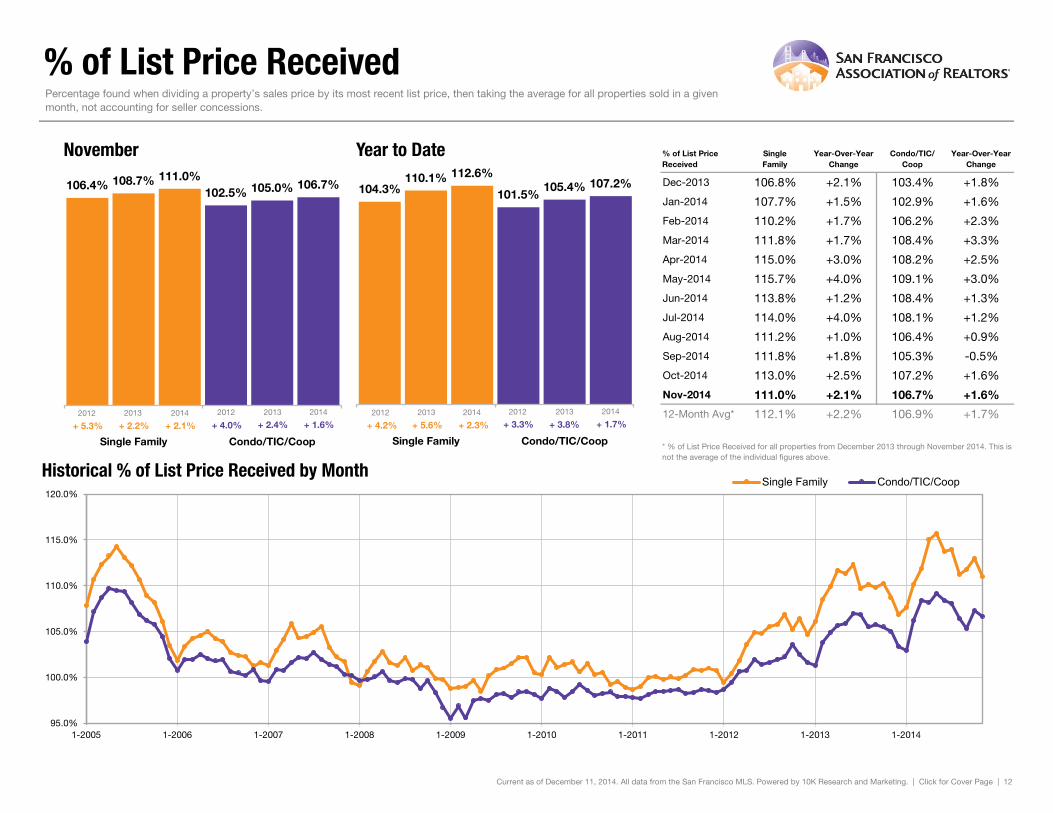
Dec-2013 106.8% +2.1% 103.4% +1.8%
Jan-2014 107.7% +1.5% 102.9% +1.6%
Feb-2014 110.2% +1.7% 106.2% +2.3%
Mar-2014 111.8% +1.7% 108.4% +3.3%
Apr-2014 115.0% +3.0% 108.2% +2.5%
May-2014 115.7% +4.0% 109.1% +3.0%
Jun-2014 113.8% +1.2% 108.4% +1.3%
Jul-2014 114.0% +4.0% 108.1% +1.2%
Aug-2014 111.2% +1.0% 106.4% +0.9%
Sep-2014 111.8% +1.8% 105.3% -0.5%
Oct-2014 113.0% +2.5% 107.2% +1.6%
Nov-2014 111.0% +2.1% 106.7% +1.6%
12-Month Avg* 112.1% +2.2% 106.9% +1.7%
Historical % of List Price Received by Month* % of List Price Received for all properties from December 2013 through November 2014. This is not the average of the individual figures above.
Current as of December 11, 2014. All data from the San Francisco MLS. Powered by 10K Research and Marketing. | Click for Cover Page | 12
Percentage found when dividing a property’s sales price by its most recent list price, then taking the average for all properties sold in a given month, not accounting for seller concessions.
106.4%102.5%
108.7% 105.0%111.0%
106.7%
Single Family Condo/TIC/Coop
November
104.3% 101.5%110.1%
105.4%112.6%
107.2%
Single Family Condo/TIC/Coop
Year to Date
95.0%
100.0%
105.0%
110.0%
115.0%
120.0%
1-2005 1-2006 1-2007 1-2008 1-2009 1-2010 1-2011 1-2012 1-2013 1-2014
Single Family Condo/TIC/Coop
2012 2013 2014
+ 1.6%+ 2.4%+ 2.1%+ 2.2%
2012 2013 2014
+ 5.3% + 4.0%2012 2013 2014
+ 1.7%+ 3.8%+ 2.3%+ 5.6%
2012 2013 2014
+ 4.2% + 3.3%

Housing Affordability Ratio
Affordability RatioSingleFamily
Year-Over-YearChange
Condo/TIC/Coop
Year-Over-YearChange
Dec-2013 49 -19.7% 69 -16.9%
Jan-2014 47 -29.9% 53 -30.3%
Feb-2014 42 -31.1% 54 -28.0%
Mar-2014 45 -15.1% 53 -23.2%
Apr-2014 40 -20.0% 56 -17.6%
May-2014 42 -10.6% 56 -16.4%
Jun-2014 39 -18.8% 54 -18.2%
Jul-2014 42 -20.8% 55 -9.8%
Aug-2014 47 -2.1% 56 -11.1%
Sep-2014 43 -12.2% 57 -9.5%
Oct-2014 38 -25.5% 55 -9.8%
Nov-2014 40 -21.6% 52 -22.4%
12-Month Avg* 43 -25.0% 53 -23.9%
Historical Housing Affordability Ratio by Month* Affordability Ratio for all properties from December 2013 through November 2014. This is not the average of the individual figures above.
Current as of December 11, 2014. All data from the San Francisco MLS. Powered by 10K Research and Marketing. | Click for Cover Page | 13
This index measures housing affordability for the region. An index of 120 means the median household income is 120% of what is necessary to qualify for the median-priced home under prevailing interest rates. A higher number means greater affordability.
62
75
51
67
40
52
Single Family Condo/TIC/Coop
November
30
40
50
60
70
80
90
100
1-2005 1-2006 1-2007 1-2008 1-2009 1-2010 1-2011 1-2012 1-2013 1-2014
Single Family Condo/TIC/Coop
2012 2013 2014
- 22.4%- 10.7%- 21.6%- 17.7%
2012 2013 2014
- 10.1% - 12.8%
67
81
53
68
43
56
Single Family Condo/TIC/Coop
Year to Date
2012 2013 2014
- 17.6%- 16.0%- 18.9%- 20.9%2012 2013 2014
0.0% - 3.6%

Months Supply of Inventory
Months SupplySingleFamily
Year-Over-YearChange
Condo/TIC/Coop
Year-Over-YearChange
Dec-2013 1.2 -20.0% 1.2 -25.0%
Jan-2014 1.5 0.0% 1.7 -10.5%
Feb-2014 1.5 -16.7% 1.7 -22.7%
Mar-2014 1.5 -21.1% 1.7 -26.1%
Apr-2014 1.6 -23.8% 1.9 -24.0%
May-2014 1.8 -18.2% 2.0 -16.7%
Jun-2014 2.1 0.0% 2.0 -20.0%
Jul-2014 2.1 0.0% 2.1 -8.7%
Aug-2014 2.0 -4.8% 1.9 -13.6%
Sep-2014 2.4 +9.1% 2.1 -19.2%
Oct-2014 2.0 -9.1% 2.0 -13.0%
Nov-2014 1.4 -22.2% 1.5 -16.7%
12-Month Avg* 1.8 -10.4% 1.8 -17.9%
Historical Months Supply of Inventory by Month* Months Supply for all properties from December 2013 through November 2014. This is not the average of the individual figures above.
Current as of December 11, 2014. All data from the San Francisco MLS. Powered by 10K Research and Marketing. | Click for Cover Page | 14
The inventory of homes for sale at the end of a given month, divided by the average monthly pending sales from the last 12 months.
2.0
2.3
1.8 1.8
1.41.5
Single Family Condo/TIC/Coop
November
0.0
2.0
4.0
6.0
8.0
10.0
1-2005 1-2006 1-2007 1-2008 1-2009 1-2010 1-2011 1-2012 1-2013 1-2014
Single Family Condo/TIC/Coop
2012 2013 2014- 16.7%- 21.7%- 22.2%- 10.0%
2012 2013 2014
- 37.5% - 42.5%

All Properties Activity OverviewKey metrics by report month and for year-to-date (YTD) starting from the first of the year.
Key Metrics Historical Sparkbars 11-2013 11-2014 Percent Change YTD 2013 YTD 2014 Percent Change
- 7.7%
Pending Sales 493 420 - 14.8% 5,606 5,212 - 7.0%
New Listings 362 258 - 28.7% 6,648 6,133
Sold Listings 524 401 - 23.5% 5,533 5,108 - 7.7%
Median Sales Price $903,500 $1,100,000 + 21.7% $851,000 $995,000 + 16.9%
+ 13.7%
34 - 10.5%
$1,253,834
-- --
Days on Market 37 36 - 2.7% 38
Avg. Sales Price $1,136,789 $1,316,987 + 15.9% $1,102,880
Active Listings 904 684 - 24.3% --
% of Properties Sold Over List Price 69.3% 73.5% + 6.1% 70.5%
51
73.8% + 4.7%
+ 1.9%
43 - 16.5%
109.5%% of List Price Received 106.7% 108.7% + 1.9% 107.5%
Current as of December 11, 2014. All data from the San Francisco MLS. Powered by 10K Research and Marketing. | Click for Cover Page | 15
Months Supply 1.8 1.5 - 16.7% -- -- --
Affordability Ratio 50 41 - 18.1%
11-2011 11-2012 11-2013 11-2014
11-2011 11-2012 11-2013 11-2014
11-2011 11-2012 11-2013 11-2014
11-2011 11-2012 11-2013 11-2014
11-2011 11-2012 11-2013 11-2014
11-2011 11-2012 11-2013 11-2014
11-2011 11-2012 11-2013 11-2014
11-2011 11-2012 11-2013 11-2014
11-2011 11-2012 11-2013 11-2014
11-2011 11-2012 11-2013 11-2014
11-2011 11-2012 11-2013 11-2014

Activity by District
SF District 1: Northwest (Sea Cliff, Lake, Jordan Park / Laurel Heights, Outer Richmond, Central Richmond, Inner Richmond, Lone Mountain)
SF District 2: Central West (Outer Sunset, Central Sunset, Inner Sunset, Outer Parkside, Parkside, Inner Parkside, Golden Gate Heights)
SF District 3: Southwest (Pine Lake Park, Lake Shore, Merced Manor, Stonestown, Lakeside, Merced Heights, Ingleside, Ingleside Heights, Oceanview)
SF District 4: Twin Peaks W (Forest Hill (& Ext), W Portal, St Francis Wd, Balboa Terr, Mt Dav Manor, Ingleside Terr, Monterey Hts, Wstwd Pk & H'lnds, Shrwd Fst, Miraloma Pk, Dmnd Hts, Mdtwn Terr)
SF District 5: Central (Haight Ashbury, Cole Vly / Prnssus Hts, Clarndn Hts, Corona Hts, Twin Pks, Glen Pk, Noe Vly, Eureka Vly / Dolores Hts, Mission Dolores, Duboce Trngl, Buena Vista / Ashbury Hts)
SF District 6: Central North (Lower Pacific Heights, Anza Vista, Western Addition, North Panhandle, Alamo Square, Hayes Valley)
SF District 7: North (Marina, Cow Hollow, Presidio Heights, Pacific Heights)
SF District 8: Northeast (North Waterfront, North Beach, Russian Hill, Telegraph Hill, Nob Hill, Financial District / Barbary Coast, Downtown, Van Ness / Civic Center, Tenderloin)
SF District 9: Central East (Yerba Buena, South Beach, South of Market, Mission Bay, Inner Mission, Potrero Hill, Central Waterfront / Dogpatch, Bernal Heights)
SF District 10: Southeast (Outer Mission, Mission Terr, Excelsior, Portola, Bayview, Silver Terr, Hunters Pt, Candlestick Pt, Bayview Hts, Little Hollywood, Visitation Vly, Crocker Amazon)
11-2013 11-2014 + / – 11-2013 11-2014 + / – 11-2013 11-2014 + / – 11-2013 11-2014 + / – 11-2013 11-2014 + / –
Single Family
1 SF District 1 31 19 -38.7% 20 18 -10.0% $1,372,500 $1,400,000 +2.0% 33 28 -14.5% 1.7 1.0 -37.9%
2 SF District 2 58 43 -25.9% 49 36 -26.5% $870,000 $1,047,500 +20.4% 41 26 -36.8% 1.5 1.2 -18.8%
3 SF District 3 37 17 -54.1% 18 12 -33.3% $733,085 $762,500 +4.0% 41 56 +34.1% 2.5 1.1 -55.6%
4 SF District 4 51 33 -35.3% 31 33 +6.5% $1,055,000 $1,180,000 +11.8% 28 23 -18.4% 1.9 1.3 -33.2%
5 SF District 5 44 26 -40.9% 33 29 -12.1% $1,550,000 $1,725,000 +11.3% 37 27 -26.3% 1.4 0.9 -33.3%
6 SF District 6 11 9 -18.2% 7 2 -71.4% $1,960,000 $1,600,000 -18.4% 12 26 +122.0% 2.9 2.4 -16.7%
7 SF District 7 22 20 -9.1% 11 11 0.0% $3,701,000 $3,950,000 +6.7% 25 38 +51.1% 1.9 2.0 +6.8%
8 SF District 8 8 6 -25.0% 0 0 -- $0 $0 -- 0 0 -- 4.0 2.8 -30.8%
9 SF District 9 29 16 -44.8% 25 23 -8.0% $1,285,000 $1,137,500 -11.5% 24 33 +35.9% 1.2 0.8 -32.1%
10 SF District 10 106 91 -14.2% 46 29 -37.0% $605,000 $710,000 +17.4% 34 42 +22.9% 2.3 2.1 -9.2%
Condo/TIC/Coop
1 SF District 1 29 16 -44.8% 15 8 -46.7% $780,000 $1,178,000 +51.0% 41 39 -3.3% 2.2 1.1 -49.4%
2 SF District 2 8 7 -12.5% 7 5 -28.6% $589,922 $650,000 +10.2% 50 54 +8.9% 1.8 1.5 -16.6%
3 SF District 3 6 9 +50.0% 2 1 -50.0% $495,000 $412,000 -16.8% 17 58 +251.5% 2.1 3.4 +58.5%
4 SF District 4 6 7 +16.7% 8 5 -37.5% $497,500 $620,000 +24.6% 56 21 -62.9% 1.2 1.4 +22.7%
5 SF District 5 52 52 0.0% 44 29 -34.1% $1,010,000 $1,090,000 +7.9% 38 28 -25.2% 1.2 1.4 +11.9%
6 SF District 6 60 38 -36.7% 26 23 -11.5% $825,500 $1,000,500 +21.2% 28 49 +76.0% 2.1 1.5 -29.2%
7 SF District 7 40 33 -17.5% 32 31 -3.1% $1,200,000 $1,333,000 +11.1% 46 30 -33.1% 1.2 1.3 +5.1%
8 SF District 8 114 83 -27.2% 39 27 -30.8% $665,000 $1,005,000 +51.1% 43 42 -0.2% 2.5 1.9 -23.3%
9 SF District 9 167 145 -13.2% 107 70 -34.6% $825,000 $982,500 +19.1% 41 42 +4.3% 1.7 1.5 -14.0%
10 SF District 10 25 14 -44.0% 4 9 +125.0% $314,701 $570,000 +81.1% 68 49 -28.2% 3.9 2.8 -29.1%
Key metrics by report month for the districts of San Fransisco.
Current as of December 11, 2014. All data from the San Francisco MLS. Powered by 10K Research and Marketing. | Click for Cover Page | 16
Active Listings Sold Listings Median Sales Price Days on Market Months Supply


![LUXr 1-day workshop, Wed November 07, 2012 [San Francisco]](https://img.pdfslide.net/doc/110x75/54415682afaf9f4e208b46a9/luxr-1-day-workshop-wed-november-07-2012-san-francisco.jpg)