Embed Size (px)
Citation preview
25 21419
972.0 28
2.0
0
87
2.0 10
139
1
4
30
$ 239,450
1
1
10
2.0
12.0
848
10
$ 213,999
2.0
89
$ 267,448
3.0$ 329,998
26
3
1127
Prices appear to be hovering around their high point. Look for apersistent down-shift in the Market Action Index before we seeprices deviate from these levels.
The market has been cooling over time and prices plateaued for awhile. Despite the consistent decrease in MAI, we're in the Seller'szone. Watch for changes in MAI. If the MAI resumes it's climb, priceswill likely follow suit. If the MAI drops consistently or falls into theBuyer's zone, watch for downward pressure on prices.
Even though the days-on-market is trending higher, so is theMarket Action Index at these inventory levels, providing a neutraloutlook for the market.
CANYON COUNTRY, CAParis911 Intel ReportsExecutive Summary
10
1007
2.0
Monday March 2, 2015
The median list price in CANYON COUNTRY, CA this week is$252,400.
Investigate the market in quartiles -where each quartile is 25% of homesordered by price.
Most expensive 25% of properties
Upper-middle 25% of properties
Lower-middle 25% of properties
Least expensive 25% of properties
Quartile Median Price Beds Baths Age Inventory New Absorbed DOMSquare Feet
The Paris911 Team | www.Paris911.com | 661-400-1720
No change Strong upward trend Strong downward trend
Slight upward trend Slight downward trend±+ == ≠≠
≠=
Powered by Altos Research LLC | www.altosresearch.com | Copyright ©2005-2014 Altos Research LLC
Condos - Townhomes
45.8
Percent Relisted (reset DOM)
1071
2.0
5 %
Median Number of Bathrooms
103
Median List Price
Average Days on Market (DOM)$ 234
Percent Flip (price increased)Median House Size (sq ft)
$ 252,400
28 %
2.0
Market Action Index
Median Number of Bedrooms
Asking Price Per Square Foot
18 %Percent of Properties with Price Decrease
Strong Seller's
±+
±+
==
≠≠
Bottom/Fourth
Lower/Third
Upper/Second
Top/First
This Week
Supply and Demand
Real-Time Market Profile Trend
Price
Price Trends
Market Action Index
The Market Action Index answers the question "How's theMarket?" by measuring the current rate of sale versus theamount of the inventory. Index above 30 implies Seller'sMarket conditions. Below 30, conditions favor the buyer.
QuartilesCharacteristics per Quartile
90-Day Rolling Average7-Day Rolling Average Buyer/Seller Cutoff
90-Day Rolling Average7-Day Rolling Average
42 11228
192.0 26
2.0
1
42
2.0 6
111
0
1
52
$ 231,500
2
0
7
2.0
12.0
864
6
$ 173,500
2.0
111
$ 245,000
2.0$ 323,850
48
1
1109
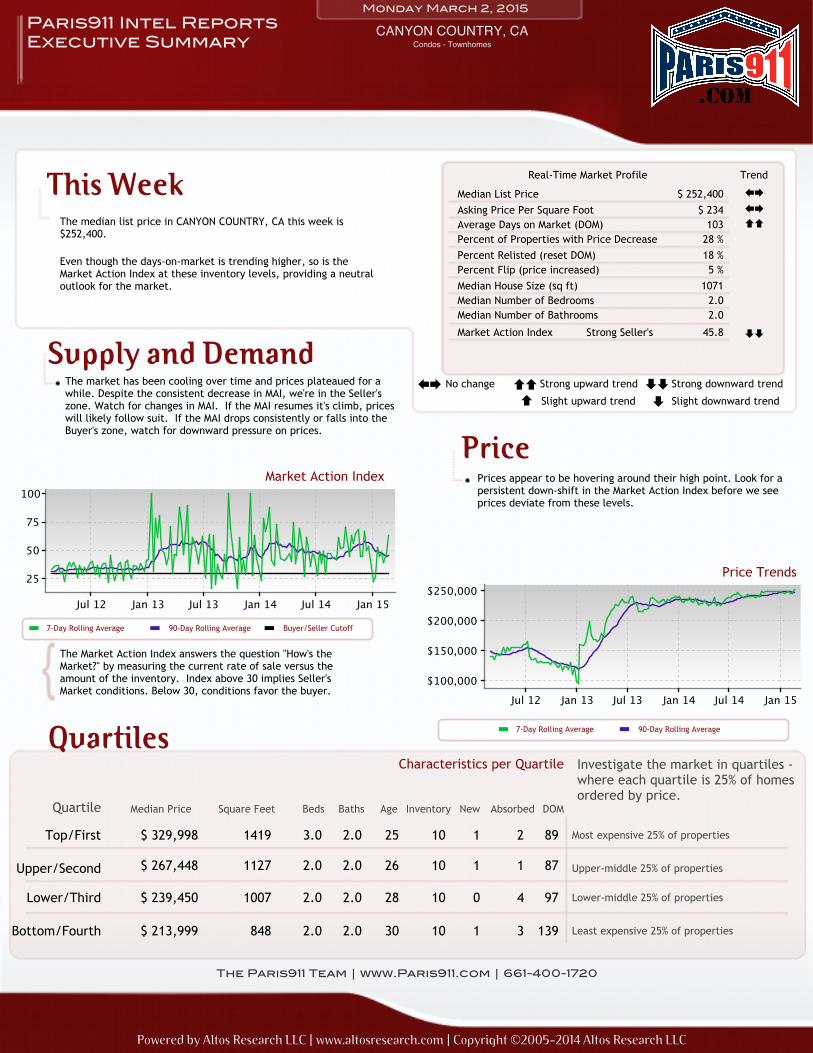
The market seems to have paused around this plateau. TheMarket Action Index is a good leading indicator for the durabilityof this trend.
In the last few weeks the market has achieved a relative stasis pointin terms of sales to inventory. However, inventory is sufficiently lowto keep us in the Seller's Market zone so watch changes in the MAI.If the market heats up, prices are likely to resume an upward climb.
The Market Action Index has been trending down recently, but asdays-on-market decreases also, there are not strong signals for thedirection of the market.
NEWHALL, CAParis911 Intel ReportsExecutive Summary
6
968
1.5
Monday March 2, 2015
The median list price in NEWHALL, CA this week is $239,000.
Investigate the market in quartiles -where each quartile is 25% of homesordered by price.
Most expensive 25% of properties
Upper-middle 25% of properties
Lower-middle 25% of properties
Least expensive 25% of properties
Quartile Median Price Beds Baths Age Inventory New Absorbed DOMSquare Feet
The Paris911 Team | www.Paris911.com | 661-400-1720
No change Strong upward trend Strong downward trend
Slight upward trend Slight downward trend±+ == ≠≠
≠=
Powered by Altos Research LLC | www.altosresearch.com | Copyright ©2005-2014 Altos Research LLC
Condos - Townhomes
47.8
Percent Relisted (reset DOM)
970
2.0
0 %
Median Number of Bathrooms
72
Median List Price
Average Days on Market (DOM)$ 227
Percent Flip (price increased)Median House Size (sq ft)
$ 239,000
12 %
2.0
Market Action Index
Median Number of Bedrooms
Asking Price Per Square Foot
8 %Percent of Properties with Price Decrease
Strong Seller's
±+
±+
≠≠
±+
Bottom/Fourth
Lower/Third
Upper/Second
Top/First
This Week
Supply and Demand
Real-Time Market Profile Trend
Price
Price Trends
Market Action Index
The Market Action Index answers the question "How's theMarket?" by measuring the current rate of sale versus theamount of the inventory. Index above 30 implies Seller'sMarket conditions. Below 30, conditions favor the buyer.
QuartilesCharacteristics per Quartile
90-Day Rolling Average7-Day Rolling Average Buyer/Seller Cutoff
90-Day Rolling Average7-Day Rolling Average
1 02409
942.0 10
2.0
1
110
2.0 6
82
0
0
20
$ 327,450
1
0
6
4.0
12.2
1001
6
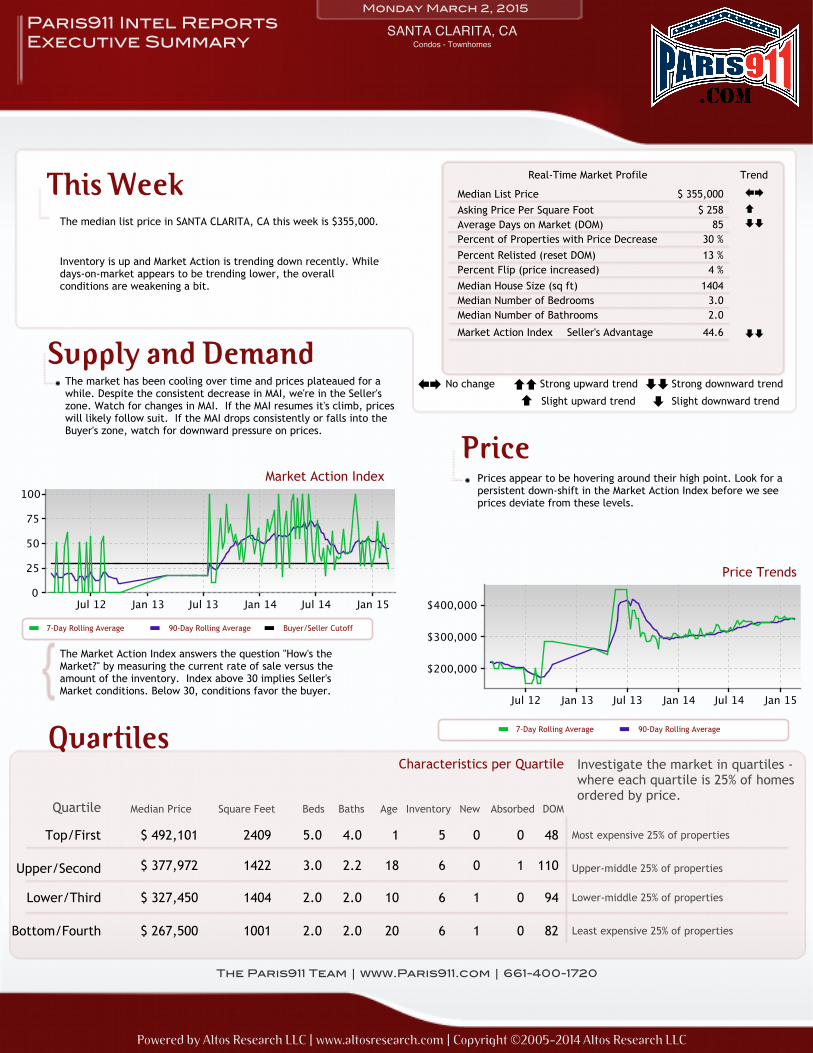
$ 267,500
3.0
48
$ 377,972
5.0$ 492,101
18
0
1422
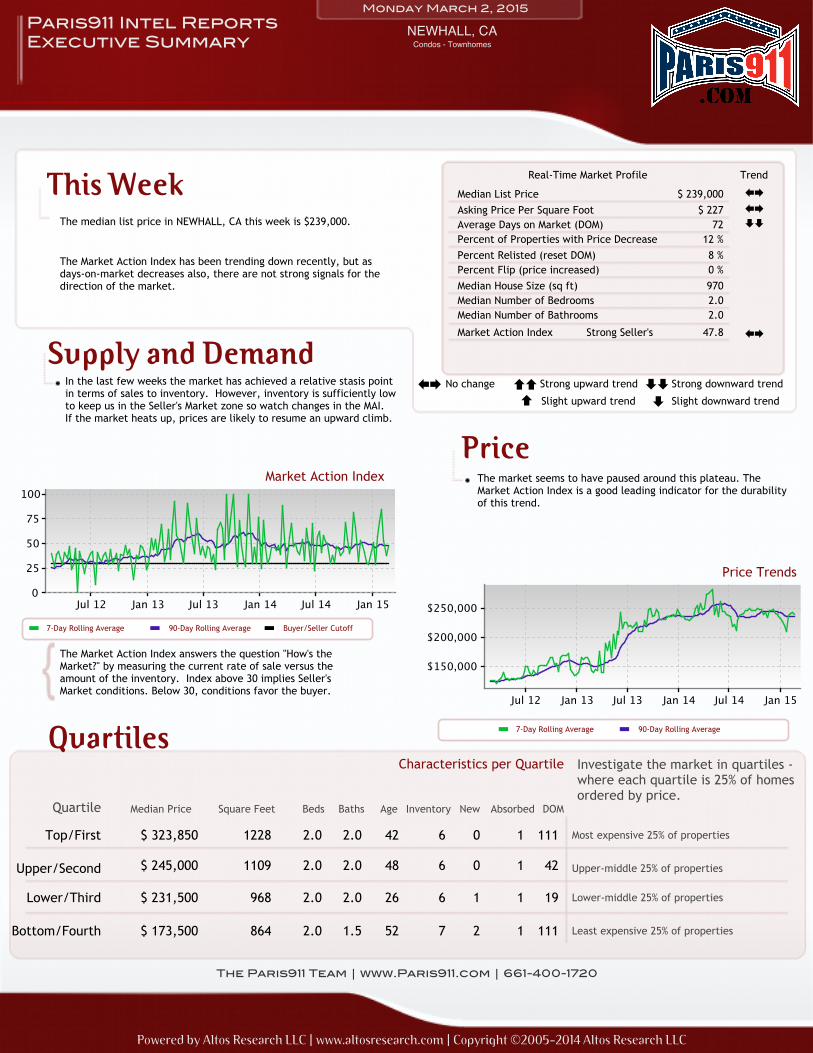
Prices appear to be hovering around their high point. Look for apersistent down-shift in the Market Action Index before we seeprices deviate from these levels.
The market has been cooling over time and prices plateaued for awhile. Despite the consistent decrease in MAI, we're in the Seller'szone. Watch for changes in MAI. If the MAI resumes it's climb, priceswill likely follow suit. If the MAI drops consistently or falls into theBuyer's zone, watch for downward pressure on prices.
Inventory is up and Market Action is trending down recently. Whiledays-on-market appears to be trending lower, the overallconditions are weakening a bit.
SANTA CLARITA, CAParis911 Intel ReportsExecutive Summary
5
1404
2.0
Monday March 2, 2015
The median list price in SANTA CLARITA, CA this week is $355,000.
Investigate the market in quartiles -where each quartile is 25% of homesordered by price.
Most expensive 25% of properties
Upper-middle 25% of properties
Lower-middle 25% of properties
Least expensive 25% of properties
Quartile Median Price Beds Baths Age Inventory New Absorbed DOMSquare Feet
The Paris911 Team | www.Paris911.com | 661-400-1720
No change Strong upward trend Strong downward trend
Slight upward trend Slight downward trend±+ == ≠≠
≠=
Powered by Altos Research LLC | www.altosresearch.com | Copyright ©2005-2014 Altos Research LLC
Condos - Townhomes
44.6
Percent Relisted (reset DOM)
1404
2.0
4 %
Median Number of Bathrooms
85
Median List Price
Average Days on Market (DOM)$ 258
Percent Flip (price increased)Median House Size (sq ft)
$ 355,000
30 %
3.0
Market Action Index
Median Number of Bedrooms
Asking Price Per Square Foot
13 %Percent of Properties with Price Decrease
Seller's Advantage
±+
=
≠≠
≠≠
Bottom/Fourth
Lower/Third
Upper/Second
Top/First
This Week
Supply and Demand
Real-Time Market Profile Trend
Price
Price Trends
Market Action Index
The Market Action Index answers the question "How's theMarket?" by measuring the current rate of sale versus theamount of the inventory. Index above 30 implies Seller'sMarket conditions. Below 30, conditions favor the buyer.
QuartilesCharacteristics per Quartile
90-Day Rolling Average7-Day Rolling Average Buyer/Seller Cutoff
90-Day Rolling Average7-Day Rolling Average
12 01838
582.5 25
2.0
0
112
3.0 3
77
0
1
25
$ 350,000
1
0
3
2.5
02.0
963
2
$ 309,900
3.0
24
$ 472,450
3.0$ 565,000
12
0
1680
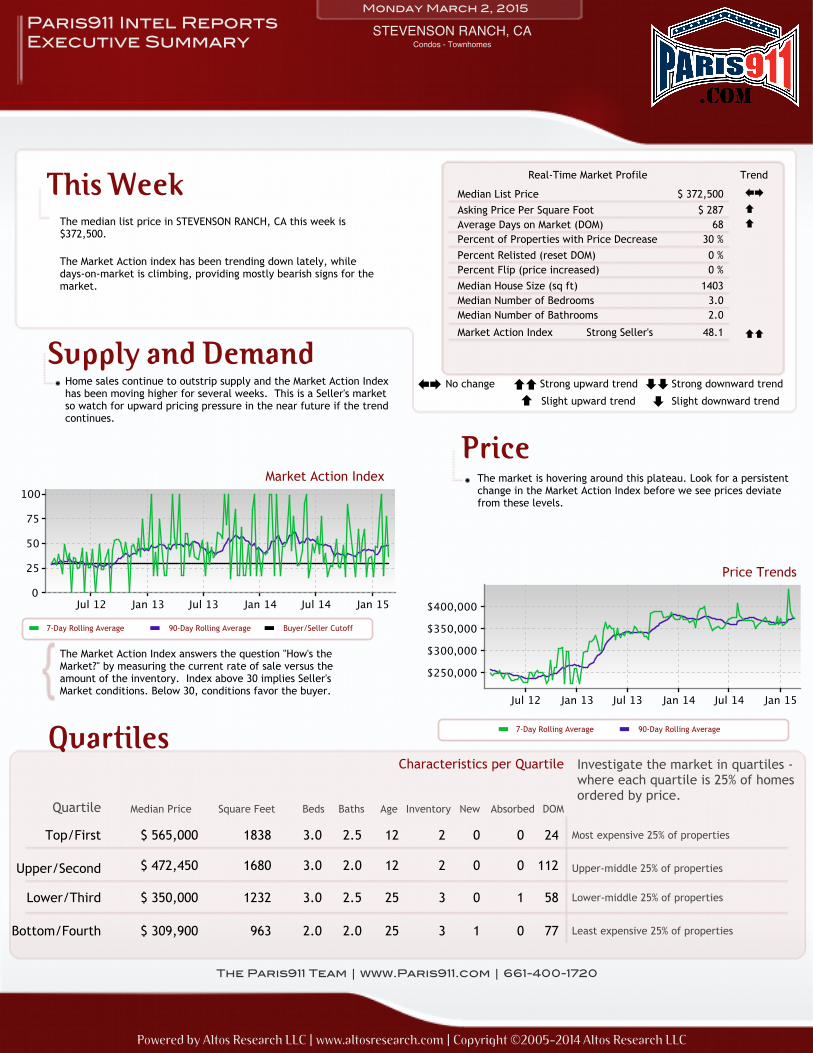
The market is hovering around this plateau. Look for a persistentchange in the Market Action Index before we see prices deviatefrom these levels.
Home sales continue to outstrip supply and the Market Action Indexhas been moving higher for several weeks. This is a Seller's marketso watch for upward pricing pressure in the near future if the trendcontinues.
The Market Action index has been trending down lately, whiledays-on-market is climbing, providing mostly bearish signs for themarket.
STEVENSON RANCH, CAParis911 Intel ReportsExecutive Summary
2
1232
2.0
Monday March 2, 2015
The median list price in STEVENSON RANCH, CA this week is$372,500.
Investigate the market in quartiles -where each quartile is 25% of homesordered by price.
Most expensive 25% of properties
Upper-middle 25% of properties
Lower-middle 25% of properties
Least expensive 25% of properties
Quartile Median Price Beds Baths Age Inventory New Absorbed DOMSquare Feet
The Paris911 Team | www.Paris911.com | 661-400-1720
No change Strong upward trend Strong downward trend
Slight upward trend Slight downward trend±+ == ≠≠
≠=
Powered by Altos Research LLC | www.altosresearch.com | Copyright ©2005-2014 Altos Research LLC
Condos - Townhomes
48.1
Percent Relisted (reset DOM)
1403
2.0
0 %
Median Number of Bathrooms
68
Median List Price
Average Days on Market (DOM)$ 287
Percent Flip (price increased)Median House Size (sq ft)
$ 372,500
30 %
3.0
Market Action Index
Median Number of Bedrooms
Asking Price Per Square Foot
0 %Percent of Properties with Price Decrease
Strong Seller's
±+
=
=
==
Bottom/Fourth
Lower/Third
Upper/Second
Top/First
This Week
Supply and Demand
Real-Time Market Profile Trend
Price
Price Trends
Market Action Index
The Market Action Index answers the question "How's theMarket?" by measuring the current rate of sale versus theamount of the inventory. Index above 30 implies Seller'sMarket conditions. Below 30, conditions favor the buyer.
QuartilesCharacteristics per Quartile
90-Day Rolling Average7-Day Rolling Average Buyer/Seller Cutoff
90-Day Rolling Average7-Day Rolling Average
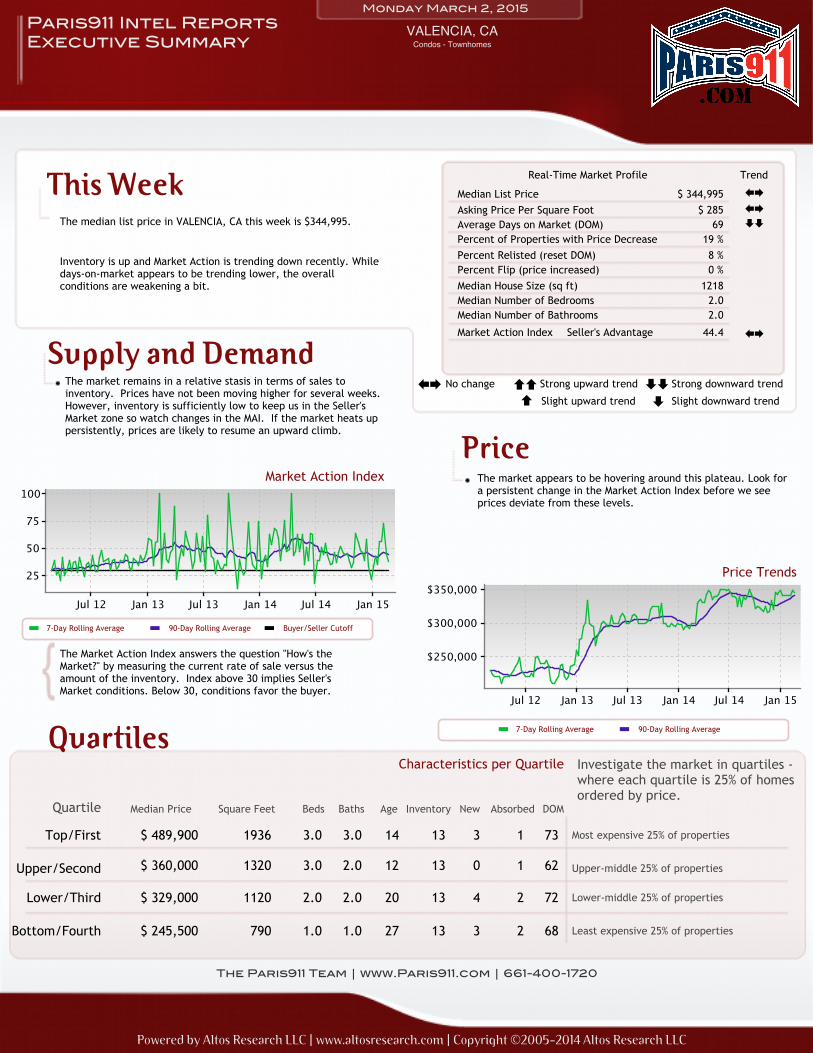
14 11936
722.0 20
1.0
4
62
2.0 13
68
0
2
27
$ 329,000
3
3
13
3.0
12.0
790
13
$ 245,500
3.0
73
$ 360,000
3.0$ 489,900
12
2
1320
The market appears to be hovering around this plateau. Look fora persistent change in the Market Action Index before we seeprices deviate from these levels.
The market remains in a relative stasis in terms of sales toinventory. Prices have not been moving higher for several weeks.However, inventory is sufficiently low to keep us in the Seller'sMarket zone so watch changes in the MAI. If the market heats uppersistently, prices are likely to resume an upward climb.
Inventory is up and Market Action is trending down recently. Whiledays-on-market appears to be trending lower, the overallconditions are weakening a bit.
VALENCIA, CAParis911 Intel ReportsExecutive Summary
13
1120
1.0
Monday March 2, 2015
The median list price in VALENCIA, CA this week is $344,995.
Investigate the market in quartiles -where each quartile is 25% of homesordered by price.
Most expensive 25% of properties
Upper-middle 25% of properties
Lower-middle 25% of properties
Least expensive 25% of properties
Quartile Median Price Beds Baths Age Inventory New Absorbed DOMSquare Feet
The Paris911 Team | www.Paris911.com | 661-400-1720
No change Strong upward trend Strong downward trend
Slight upward trend Slight downward trend±+ == ≠≠
≠=
Powered by Altos Research LLC | www.altosresearch.com | Copyright ©2005-2014 Altos Research LLC
Condos - Townhomes
44.4
Percent Relisted (reset DOM)
1218
2.0
0 %
Median Number of Bathrooms
69
Median List Price
Average Days on Market (DOM)$ 285
Percent Flip (price increased)Median House Size (sq ft)
$ 344,995
19 %
2.0
Market Action Index
Median Number of Bedrooms
Asking Price Per Square Foot
8 %Percent of Properties with Price Decrease
Seller's Advantage
±+
±+
≠≠
±+
Bottom/Fourth
Lower/Third
Upper/Second
Top/First
This Week
Supply and Demand
Real-Time Market Profile Trend
Price
Price Trends
Market Action Index
The Market Action Index answers the question "How's theMarket?" by measuring the current rate of sale versus theamount of the inventory. Index above 30 implies Seller'sMarket conditions. Below 30, conditions favor the buyer.
QuartilesCharacteristics per Quartile
90-Day Rolling Average7-Day Rolling Average Buyer/Seller Cutoff
90-Day Rolling Average7-Day Rolling Average