Embed Size (px)
Citation preview

Research & Forecast Report
GREATER TORONTO AREAOFFICE Q2 2015

2 Research & Forecast Report | Q2 2015 | Greater Toronto Area / Office | Colliers International
Market Summaries
GTA Market Overview ....................................................................................................3 Downtown ............................................................................................................... 4 Midtown .................................................................................................................. 5 Central North .......................................................................................................... 6 Central East ............................................................................................................ 7 GTA East ................................................................................................................. 8 GTA North ............................................................................................................... 9 GTA West .............................................................................................................. 10
Glossary .............................................................................................................................. 11
Table of Contents

3Research & Forecast Report | Q2 2015 | Greater Toronto Area / Office | Colliers International
GTA Market Overview
Market OverviewToronto’s Downtown office market continues to experience high demand, where vacancy rates declined once again and now sit at 2.6 percent. As displayed in previous quarters, much of demand within the Downtown market continues to be for newly-built or renovated space. Numerous companies have vacated and continue to leave older buildings within the Downtown for newer ones. Currently, of the big block spaces (100,000 square feet and up) available within the Downtown, much is within older Class AAA and Class A buildings. On the other hand, many of the newly-constructed buildings have no available space, and of the almost four million square feet of office space that is currently under construction, much of this is fully pre-leased or more than 50 percent pre-leased. This is a trend that is not exclusive to Downtown as large tenants are favouring newer space within certain suburban markets. An example of the shift towards new office space is Marsh & Mclennan Companies and TJX Companies occupying space within newly- built 120 Bremner (Downtown) and 60 Standish Court (GTA Suburban West) this quarter, both leaving big block space that is still available in the older buildings that they vacated. Building amenities, collaborative workspaces and environmental efficiencies show the differences between newly-built buildings and older office stock and why these new spaces are successfully attracting tenants across various industries.
Investment MarketThe Toronto investment market saw a gradual increase in activity over Q1, 2015 but has continued to remain relatively slow in transaction activity in contrast to recent years. Despite the slowdown within the central markets, buyers continue to purchase space throughout the Greater Toronto Area, beyond the traditional Downtown and Midtown markets. According to RealNet data, during Q2, 2015, sales outside of the Downtown and Midtown markets (+$2MM CND) attributed to 64% of all deal volume. Sales within the City of Markham alone contributed to 31% of the total deal volume, with the GTA’s largest sale in Q2, 2015 taking place in Markham at 675 Cochrane Drive, a 365,000 office asset sold by BCIMC Realty Corporation to Crown Realty Partners for $97,470,000.
Market IndicatorsRelative to prior period
Market Q1 2015
Market Q2 2015
Market Q3 2015* Trend
VACANCY RATE 5.3% 5.5%
NET ABSORPTION 432,300 391,852
AVAILABILITY RATE 11.4% 10.7%
NET RENTAL RATE** $17.77 $18.65 *Projected **Rental rates for current quarter are for CBD. Rent forecast is for metro-wide rents.
Tenant DemandThe financial services sector is leading demand for office space throughout the GTA, but primarily in the Downtown and GTA West this quarter. There is also an increased demand from engineering and communications companies looking for space within the GTA. The engineering companies are almost exclusively looking for space within the GTA West, while Communications companies are seeking space throughout the city.
Q2 2015 – 1,678,600 Square Feet Financial Services
Engineering
Communications
Technology/Software
Architectural, Engineering and Related Services
Government Services
* Other (Entertainment, Interior Design, Law, Transportation and Retail Trade.
30%
15%
15%
10%
5%
5%
4%
3%
3%2%
8%Financial Services
Engineering
Communications
Technology/Software
Architectural, Engineering, and Related Services
Government Services
Real Estate
Wholesale trade
Security Services
Banking
Other (Entertainement, Interior Design, Law, Transportation andRetail Trade)
Real Estate
Wholesale Trade
Security Services
Banking
Other*
Historical Performance and Forecast
0.0%
1.0%
2.0%
3.0%
4.0%
5.0%
6.0%
7.0%
8.0%
9.0%
10.0%
-1,000,000
-500,000
0
500,000
1,000,000
1,500,000
2,000,000
2,500,000
2011
Q1
2011
Q2
2011
Q3
2011
Q4
2012
Q1
2012
Q2
2012
Q3
2012
Q4
2013
Q1
2013
Q2
2013
Q3
2013
Q4
2014
Q1
2014
Q2
2014
Q3
2014
Q4
2015
1Q
2015
2Q
2015
3Q
2015
4Q
2016
1Q
(600,000)
(400,000)
(200,000)
-
200,000
400,000
600,000
800,000
0.0%
1.0%
2.0%
3.0%
4.0%
5.0%
6.0%
7.0%
8.0%
9.0%
10.0%
2009
Q2
2009
Q3
2009
Q4
2010
Q1
2010
Q2
2010
Q3
2010
Q4
2011
Q1
2011
Q2
2011
Q3
2011
Q4
2012
Q1
2012
Q2
2012
Q3
2012
Q4
2013
Q1
2013
Q2
2013
Q3
2013
Q4
2014
Q1
2014
Q2
Net Absorption (SF) New Supply (SF) Vacancy Rate (%)

4 Research & Forecast Report | Q2 2015 | Greater Toronto Area / Office | Colliers International
DowntownWhile overall vacancy rates continue to be low within the Downtown market, there is a large amount of big block space available in some of the market’s bigger Class AAA and A buildings. 181 Bay Street, First Canadian Place, Bay Adelaide Centre and 161 Bay Street are some examples of high-quality buildings with an inventory of available big block space. This is partially due to increased competition stemming from the success of new or under construction buildings in attracting a diverse set of tenants. Not only are large tenants such as RBC and Marsh & Mclennan Companies moving into new buildings, but smaller companies across numerous industries are favoring newly-built office space. For example, 134 Peter (currently under construction) has been fully pre-leased with a mix of small- and medium-sized tenants across numerous industries such as investment, consumer goods, technology/software and others.
Trends > Vacancy rates remain low within the Downtown submarkets, primarily the Downtown West, South and East.
Notable Lease TransactionsTENANT NAME - ADDRESS TYPE APPROXIMATE
SIZE (SF)
1. Blaney McMurty LLP - 2 Queen St East Renewal 80,000
2. Torkin Manes LLP - 151 Yonge St Renewal 50,000
3. D+H - 120 Bremner Blvd Headlease 31,000
Summary Statistics Q2 2015 Regional Office Market Q1 2015 Q2 2015 Trend
Office Inventory 75,928,990 75,928,990
Net Absorption 602,230 236,367
Vacancy Rate 2.7% 2.6%
Availability Rate 9.2% 7.7%
Average Asking Net Rent $28.55 $29.18
Notable Lease Notable Sale New Supply
Upcoming New SupplyADDRESS CLASS FLOORS SIZE (SF) DEVELOPER COMPLETION STATUS
6. 134 Peter Street A 17 299,178 Allied Properties REIT Q2 2015 Under Construction
7. 22 Adelaide Street West AAA 44 1,020,000 Brookfield Financial Real Estate Group Q1 2016 Under Construction
8. 351 King Street East A 17 500,000 First Gulf Q2 2016 Under Construction
9. 43A Parliament St 5 71,000 Bresler, Urbacon Q2 2016 Under Construction
10. 1 York Street A 35 800,000 HOOPP / Menkes Q3 2016 Under Construction
11. 100 Adelaide Street W AAA 40 905,722 Oxford Properties Group Inc. Q2 2017 Under Construction
12. 130 Queens Quay East 178,300 Daniels Corporation Q2 2019 Under Construction
Notable Sale TransactionsPURCHASER - ADDRESS PRICE APPROXIMATE
SIZE (SF)
4. Hullmark - 230 & 240 Richmond Street West $17,500,000 119,442
5. Allied Properties REIT - 176 - 180 John Street $8,290,000 62,469
TORONTO
Union
Dundas
Bloor / YongeBay Castlefrank
Wellesley
Queen’s ParkCarlton StCollege St
Dundas St
Queen St
King St
Spad
ina
Ave
Univ
ersi
ty A
ve
Yong
e St
Parli
amen
t St
Bloor St
Gardiner Expwy
15
94
3
6 827
10
11
12
Lake Ontario
Historical Performance and Forecast
(600,000)
(400,000)
(200,000)
-
200,000
400,000
600,000
800,000
0.0%
1.0%
2.0%
3.0%
4.0%
5.0%
6.0%
7.0%
8.0%
9.0%
10.0%
2009
Q2
2009
Q3
2009
Q4
2010
Q1
2010
Q2
2010
Q3
2010
Q4
2011
Q1
2011
Q2
2011
Q3
2011
Q4
2012
Q1
2012
Q2
2012
Q3
2012
Q4
2013
Q1
2013
Q2
2013
Q3
2013
Q4
2014
Q1
2014
Q2
Net Absorption (SF) New Supply (SF) Vacancy Rate (%)
0.0%
1.0%
2.0%
3.0%
4.0%
5.0%
6.0%
7.0%
8.0%
9.0%
-200,0000
200,000400,000600,000800,000
1,000,0001,200,0001,400,0001,600,0001,800,000
2011
Q1
2011
Q2
2011
Q3
2011
Q4
2012
Q1
2012
Q2
2012
Q3
2012
Q4
2013
Q1
2013
Q2
2013
Q3
2013
Q4
2014
Q1
2014
Q2
2014
Q3
2014
Q4
2015
1Q
2015
2Q
2015
3Q
2015
4Q
2016
1Q

5Research & Forecast Report | Q2 2015 | Greater Toronto Area / Office | Colliers International
MidtownThe overall vacancy rate in the Midtown market once again decreased this quarter from the previous one from 3.0 percent to 2.4 percent. The Yonge-Bloor and Yonge-Eglinton submarkets continue to have very low vacancy and availability rates as space demand increases within these transit accessible markets. With no new supply or office space under construction within the Midtown market, vacancy rates are likely to remain the same for the foreseeable future. This could lead to an increase in average rental rates.
Trends > The total number of under construction and planned residential condominiums within the Yonge-Bloor and Yonge-Eglinton submarkets continues to increase.
> The condominiums that are currently under construction within the Yonge-Bloor and Yonge-Eglinton submarkets could lead to increased demand for live-work office space within the area.
Summary Statistics Q2 2015 Regional Office Market Q1 2015 Q2 2015 Trend
Office Inventory 19,387,861 19,387,861
Net Absorption -18,575 65,388
Vacancy Rate 3.0% 2.4%
Availability Rate 8.6% 6.8%
Average Asking Net Rent $19.19 $18.48
Notable Lease Notable Sale New Supply
Upcoming New SupplyADDRESS CLASS FLOORS SIZE (SF) DEVELOPER COMPLETION STATUS
4. 135 Yorkville Avenue A 11 50,000 Camrost Felcorp Q3 2016 Planned
Notable Sale TransactionsPURCHASER - ADDRESS PRICE APPROXIMATE
SIZE (SF)
1. Clifton Blake - 1133 Yonge Street $21,500,000 63,237
2. 2462790 Ontario Inc. - 17 Prince Arthur Avenue $16,200,000 20,000
3. Manulife Financial - 1300 Yonge Street $9,310,000 99,875
Bloor St
Dundas St
Queen St
Eglinton Ave
Lans
dow
ne A
ve
Yong
e St
Bayv
iew
Ave
Duffe
rin S
t
Lawrence Ave
Gardiner Expwy
TORONTO
314
2
Historical Performance and Forecast
(600,000)
(400,000)
(200,000)
-
200,000
400,000
600,000
800,000
0.0%
1.0%
2.0%
3.0%
4.0%
5.0%
6.0%
7.0%
8.0%
9.0%
10.0%
2009
Q2
2009
Q3
2009
Q4
2010
Q1
2010
Q2
2010
Q3
2010
Q4
2011
Q1
2011
Q2
2011
Q3
2011
Q4
2012
Q1
2012
Q2
2012
Q3
2012
Q4
2013
Q1
2013
Q2
2013
Q3
2013
Q4
2014
Q1
2014
Q2
Net Absorption (SF) New Supply (SF) Vacancy Rate (%)
0.0%
1.0%
2.0%
3.0%
4.0%
5.0%
6.0%
7.0%
8.0%
-100,000
-50,000
0
50,000
100,000
150,000
200,000
2011
Q1
2011
Q2
2011
Q3
2011
Q4
2012
Q1
2012
Q2
2012
Q3
2012
Q4
2013
Q1
2013
Q2
2013
Q3
2013
Q4
2014
Q1
2014
Q2
2014
Q3
2014
Q4
2015
1Q
2015
2Q
2015
3Q
2015
4Q
2016
1Q

6 Research & Forecast Report | Q2 2015 | Greater Toronto Area / Office | Colliers International
Central NorthThe Central North experienced negative absorption this quarter as space previously held by Proctor and Gamble within 4711 Yonge has become available. With this large block of space coming to market, it could test the demand for space within area. Little space was previously available throughout the Central North, especially in the North-Yonge Corridor.
Trends > With great public transit and highway accessibility, the North-Yonge Corridor continues to be an attractive submarket for companies.
Summary Statistics Q2 2015 Regional Office Market Q1 2015 Q2 2015 Trend
Office Inventory 12,026,988 12,026,988
Net Absorption -1,456 -183,571
Vacancy Rate 1.7% 3.2%
Availability Rate 6.8% 6.1%
Average Asking Net Rent $17.27 $17.08
Notable Lease Notable Sale New Supply
Upcoming New SupplyADDRESS CLASS FLOORS SIZE (SF) DEVELOPER COMPLETION STATUS
2. 4800 Yonge Street A 25 393,000 Oxford Properties Group Q4 2016 Planned
3. 4050 Yonge Street A 7 367,000 Build Toronto Inc. Q4 2016 Planned
Notable Sale TransactionsPURCHASER - ADDRESS PRICE APPROXIMATE
SIZE (SF)
1. Manulife Financial - 100 Sheppard Avenue East $33,329,000 273,850
Sheppard Ave
Highway 401
Lawrence Ave
Finch Ave
Yong
e St
Bayv
iew
Ave
Keel
e St
Steeles Ave
Eglinton Ave
Bath
urst
St
York University
3
2
TORONTO
VAUGHAN
1
Lawrence
Sheppard
Finch
Downsview
Lawrence West
Eglinton West Eglinton
Historical Performance and Forecast
(600,000)
(400,000)
(200,000)
-
200,000
400,000
600,000
800,000
0.0%
1.0%
2.0%
3.0%
4.0%
5.0%
6.0%
7.0%
8.0%
9.0%
10.0%
2009
Q2
2009
Q3
2009
Q4
2010
Q1
2010
Q2
2010
Q3
2010
Q4
2011
Q1
2011
Q2
2011
Q3
2011
Q4
2012
Q1
2012
Q2
2012
Q3
2012
Q4
2013
Q1
2013
Q2
2013
Q3
2013
Q4
2014
Q1
2014
Q2
Net Absorption (SF) New Supply (SF) Vacancy Rate (%)
0.0%
1.0%
2.0%
3.0%
4.0%
5.0%
6.0%
7.0%
8.0%
9.0%
-100,000
-50,000
0
50,000
100,000
150,000
200,000
250,000
2011
Q1
2011
Q2
2011
Q3
2011
Q4
2012
Q1
2012
Q2
2012
Q3
2012
Q4
2013
Q1
2013
Q2
2013
Q3
2013
Q4
2014
Q1
2014
Q2
2014
Q3
2014
Q4
2015
1Q
2015
2Q
2015
3Q
2015
4Q
2016
1Q
7Research & Forecast Report | Q2 2015 | Greater Toronto Area / Office | Colliers International
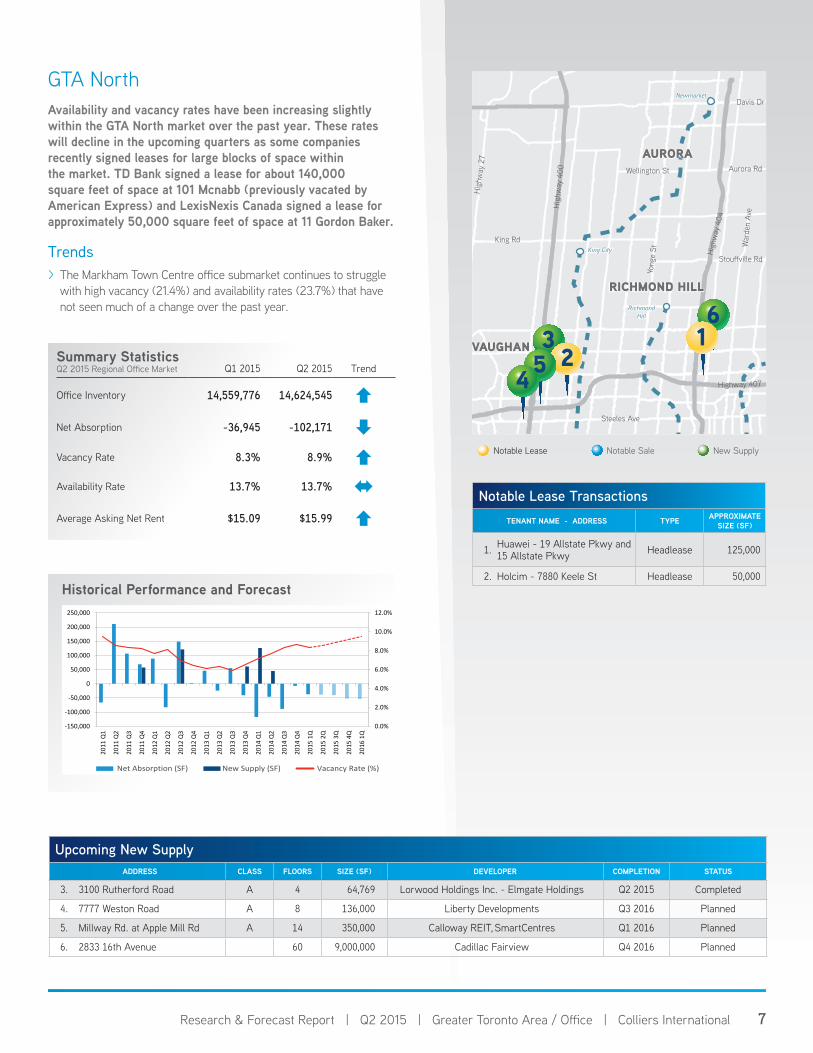
GTA NorthAvailability and vacancy rates have been increasing slightly within the GTA North market over the past year. These rates will decline in the upcoming quarters as some companies recently signed leases for large blocks of space within the market. TD Bank signed a lease for about 140,000 square feet of space at 101 Mcnabb (previously vacated by American Express) and LexisNexis Canada signed a lease for approximately 50,000 square feet of space at 11 Gordon Baker.
Trends > The Markham Town Centre office submarket continues to struggle with high vacancy (21.4%) and availability rates (23.7%) that have not seen much of a change over the past year.
Notable Lease TransactionsTENANT NAME - ADDRESS TYPE APPROXIMATE
SIZE (SF)
1. Huawei - 19 Allstate Pkwy and 15 Allstate Pkwy Headlease 125,000
2. Holcim - 7880 Keele St Headlease 50,000
Summary Statistics Q2 2015 Regional Office Market Q1 2015 Q2 2015 Trend
Office Inventory 14,559,776 14,624,545
Net Absorption -36,945 -102,171
Vacancy Rate 8.3% 8.9%
Availability Rate 13.7% 13.7%
Average Asking Net Rent $15.09 $15.99
Notable Lease Notable Sale New Supply
Upcoming New SupplyADDRESS CLASS FLOORS SIZE (SF) DEVELOPER COMPLETION STATUS
3. 3100 Rutherford Road A 4 64,769 Lorwood Holdings Inc. - Elmgate Holdings Q2 2015 Completed
4. 7777 Weston Road A 8 136,000 Liberty Developments Q3 2016 Planned
5. Millway Rd. at Apple Mill Rd A 14 350,000 Calloway REIT, SmartCentres Q1 2016 Planned
6. 2833 16th Avenue 60 9,000,000 Cadillac Fairview Q4 2016 Planned
Newmarket
RichmondHill
King City
Highway 407
Aurora RdWellington St
High
way
404
Yong
e St
Stouffville Rd
War
den
AveH
ighw
ay 4
00
Steeles Ave
King Rd
Hig
hway
27
Davis Dr
36
VAUGHAN
RICHMOND HILL
AURORA
1254
Historical Performance and Forecast
(600,000)
(400,000)
(200,000)
-
200,000
400,000
600,000
800,000
0.0%
1.0%
2.0%
3.0%
4.0%
5.0%
6.0%
7.0%
8.0%
9.0%
10.0%
2009
Q2
2009
Q3
2009
Q4
2010
Q1
2010
Q2
2010
Q3
2010
Q4
2011
Q1
2011
Q2
2011
Q3
2011
Q4
2012
Q1
2012
Q2
2012
Q3
2012
Q4
2013
Q1
2013
Q2
2013
Q3
2013
Q4
2014
Q1
2014
Q2
Net Absorption (SF) New Supply (SF) Vacancy Rate (%)
0.0%
2.0%
4.0%
6.0%
8.0%
10.0%
12.0%
-150,000
-100,000
-50,000
0
50,000
100,000
150,000
200,000
250,000
2011
Q1
2011
Q2
2011
Q3
2011
Q4
2012
Q1
2012
Q2
2012
Q3
2012
Q4
2013
Q1
2013
Q2
2013
Q3
2013
Q4
2014
Q1
2014
Q2
2014
Q3
2014
Q4
2015
1Q
2015
2Q
2015
3Q
2015
4Q
2016
1Q

8 Research & Forecast Report | Q2 2015 | Greater Toronto Area / Office | Colliers International
Central EastThe overall vacancy rate within the Central East market was left unchanged from the previous quarter, remaining at 5.5 percent. While vacancy rates have stayed relatively the same within this market, opportunity could exist for growth as the Eglinton LRT gets closer to completion. The availability of transit (LRT), coupled with great highway access and very competitive net and gross rents, could increase office leasing activity within this market, primarily the Don Mills/Eglinton Submarket.
Trends > No new office buildings are currently under construction within this market, as supply seems to be currently meeting market demand. not seen much of a change over the past year.
Notable Lease TransactionsTENANT NAME - ADDRESS TYPE APPROXIMATE
SIZE (SF)
1. TD Bank - 101 McNabb St Headlease 140,000
Summary Statistics Q2 2015 Regional Office Market Q1 2015 Q2 2015 Trend
Office Inventory 18,259,041 18,259,041
Net Absorption -23,719 -17,548
Vacancy Rate 5.5% 5.5%
Availability Rate 10.6% 12.0%
Average Asking Net Rent $12.96 $13.38
Notable Lease Notable Sale New Supply
Upcoming New SupplyADDRESS CLASS FLOORS SIZE (SF) DEVELOPER COMPLETION STATUS
4. 3377 Steeles Avenue East A 6 280,000 Bentall Real Estate Services Planned
5. 101 Gordon Baker Road A 12 250,000 Osmington Inc. Planned
Notable Sale TransactionsPURCHASER - ADDRESS PRICE APPROXIMATE
SIZE (SF)
2. The Bank of Nova Scotia - 90 Wynford Drive $16,600,000 172,113
3. Integrated Condominium Management - 18 Wynford Drive $12,311,830 97,615
Highway 407
Eglinton Ave
Finch Ave
Hig
hway
404
Yong
e St
Vict
oria
Par
k Av
e
Kenn
edy
Ave
Sheppard Ave
Steeles Ave
Highway 401
Mar
kham
Rd
Keel
e St
4
SCARBOROUGH
TORONTO
5Finch
Kennedy
Union
Lake Ontario
1
3 2
Historical Performance and Forecast
(600,000)
(400,000)
(200,000)
-
200,000
400,000
600,000
800,000
0.0%
1.0%
2.0%
3.0%
4.0%
5.0%
6.0%
7.0%
8.0%
9.0%
10.0%
2009
Q2
2009
Q3
2009
Q4
2010
Q1
2010
Q2
2010
Q3
2010
Q4
2011
Q1
2011
Q2
2011
Q3
2011
Q4
2012
Q1
2012
Q2
2012
Q3
2012
Q4
2013
Q1
2013
Q2
2013
Q3
2013
Q4
2014
Q1
2014
Q2
Net Absorption (SF) New Supply (SF) Vacancy Rate (%)
0.0%
1.0%
2.0%
3.0%
4.0%
5.0%
6.0%
7.0%
8.0%
9.0%
10.0%
-300,000
-200,000
-100,000
0
100,000
200,000
300,000
400,000
2011
Q1
2011
Q2
2011
Q3
2011
Q4
2012
Q1
2012
Q2
2012
Q3
2012
Q4
2013
Q1
2013
Q2
2013
Q3
2013
Q4
2014
Q1
2014
Q2
2014
Q3
2014
Q4
2015
1Q
2015
2Q
2015
3Q
2015
4Q
2016
1Q

9Research & Forecast Report | Q2 2015 | Greater Toronto Area / Office | Colliers International
GTA EastLittle has changed within this market over the past year with a slowing in leasing activity. Vacancy and availability rates remain relatively high in the Pickering/Oshawa submarket at 7.4 percent and 15.6 percent respectively. Leasing activity within the Scarborough Town Centre submarket will be enhanced by the Consilium Place renovations which will be completed this fall. With businesses throughout the city displaying an appetite for new built-out office space, Consilium Place should be competitive in attracting companies. The location of the STC subway stop is under review.
Trends > Average Net and Gross Rents in the GTA East market are very cost competitive as they remain the lowest in the GTA.
Summary Statistics Q2 2015 Regional Office Market Q1 2015 Q2 2015 Trend
Office Inventory 7,406,240 7,406,240
Net Absorption -52,552 -12,531
Vacancy Rate 6.9% 7.1%
Availability Rate 7.7% 9.9%
Average Asking Net Rent $11.51 $11.53
Notable Lease Notable Sale New Supply
Upcoming New SupplyADDRESS CLASS FLOORS SIZE (SF) DEVELOPER COMPLETION STATUS
1. 65 Bayly Street West 2 31500 Medallion Corporation 2016 Under Construction
2. 400 Consilium Place 15 375,000 (up to 900,000 available in 3 towers) Kevric Corporation Planned
Taunton Rd
Kingston Rd
Highway 407
Broc
k Rd
Harm
ony Rd
Sheppard Ave
Steeles Ave
Highway 401
York
& D
urha
m L
ine
ScarboroughTown Centre
Stouffville
Pickering Oshawa
Markham
21
TORONTO
OSHAWA
PICKERING
Lake Ontario
Historical Performance and Forecast
(600,000)
(400,000)
(200,000)
-
200,000
400,000
600,000
800,000
0.0%
1.0%
2.0%
3.0%
4.0%
5.0%
6.0%
7.0%
8.0%
9.0%
10.0%
2009
Q2
2009
Q3
2009
Q4
2010
Q1
2010
Q2
2010
Q3
2010
Q4
2011
Q1
2011
Q2
2011
Q3
2011
Q4
2012
Q1
2012
Q2
2012
Q3
2012
Q4
2013
Q1
2013
Q2
2013
Q3
2013
Q4
2014
Q1
2014
Q2
Net Absorption (SF) New Supply (SF) Vacancy Rate (%)
0.0%
2.0%
4.0%
6.0%
8.0%
10.0%
12.0%
14.0%
-150,000
-100,000
-50,000
0
50,000
100,000
150,000
200,000
250,000
2011
Q1
2011
Q2
2011
Q3
2011
Q4
2012
Q1
2012
Q2
2012
Q3
2012
Q4
2013
Q1
2013
Q2
2013
Q3
2013
Q4
2014
Q1
2014
Q2
2014
Q3
2014
Q4
2015
1Q
2015
2Q
2015
3Q
2015
4Q
2016
1Q

10 Research & Forecast Report | Q2 2015 | Greater Toronto Area / Office | Colliers International
GTA WestAlthough the GTA West vacancy and availability rates continue to trail the performances of other suburban centers and the downtown node, there was just under 800,000 square feet of new office inventory added to the market and another 1.3 million square feet that is currently under construction. Sobeys Inc. completed their office expansion and consolidation into 237,000 square feet in Q2, 2015 as did TJX Group of Companies with their new facility at 60 Standish Court. This continuing trend of movement to newer office facilities has developers announcing further speculative office projects with the most recent being Carterra Private Equities who will break ground on just over 100,000 square feet within their Oakwoods Business Park Development in Oakville in late summer.
Trends > Recent announcements have several of the large block vacancies being leased up. These include PointClickCare and the Bank of Nova Scotia.
Notable Lease TransactionsTENANT NAME - ADDRESS TYPE APPROXIMATE
SIZE (SF)
1. Desjardins - 3 Robert Speck pkwy & 1 Robert Speck pkwy
Renewal and Expansion
190,000 & 60,000
2. PointClickCare - 5550 Explorer Dr Headlease 185,000
3. Maple Leaf Foods - 6985 Financial Dr Renewal 104,731
4. Investment Planning Council - Spectrum Square Headlease 50,000
Summary Statistics Q2 2015 Regional Office Market Q1 2015 Q2 2015 Trend
Office Inventory 49,617,239 50,402,705
Net Absorption -36,683 405,918
Vacancy Rate 10.0% 10.4%
Availability Rate 16.9% 16.6%
Average Asking Net Rent $15.13 $14.63
Notable Lease Notable Sale New Supply
Upcoming New SupplyADDRESS CLASS FLOORS SIZE (SF) DEVELOPER COMPLETION STATUS
8. 60 Standish Court (West Tower) A 7 179,000 Orlando Corporation Q2 2015 Completed
9. 60 Standish Court (East Tower) A 6 156,000 Orlando Corporation Q2 2015 Completed
10. 1 Prologis Boulevard A 5 146,863 HOOPP - Healthcare of Ontario Pension Plan Q2 2015 Completed
11. 5015 Spectrum Way A 5 134,000 HOOPP - Healthcare of Ontario Pension Plan Q2 2015 Completed
12. 1100 Walker’s Line A 6 60,000 Kamisa Corp Q2 2015 Completed
13. 85 Prologis Boulevard B 1 44,751 HOOPP - Healthcare of Ontario Pension Plan Q2 2015 Completed
14. 1006 Skyview Drive A 2 36,339 Q2 2015 Completed
15. 1375 North Service Road East A 1 28,513 Carttera Private Equities Inc. Q2 2015 Completed
Notable Sale TransactionsPURCHASER - ADDRESS PRICE APPROXIMATE
SIZE (SF)
5. Manulife Financial - 5090 Explorer Drive $22,540,000 169,050
6. The Regional Municipality of Peel - 7150 Mississauga Road $21,950,000 79,406
7. Manulife Financial - 25 Watline Avenue $8,428,000 88,550
Kipling
Georgetown
Milton
Lake OntarioQEW
Highway
407
Highway
403
hwy 427
Highway 10
Highway 4016
15
13
14
TORONTO
BRAMPTON
OAKVILLE
MISSISSAUGA
12
38 59
1011 247 1
Historical Performance and Forecast
(600,000)
(400,000)
(200,000)
-
200,000
400,000
600,000
800,000
0.0%
1.0%
2.0%
3.0%
4.0%
5.0%
6.0%
7.0%
8.0%
9.0%
10.0%
2009
Q2
2009
Q3
2009
Q4
2010
Q1
2010
Q2
2010
Q3
2010
Q4
2011
Q1
2011
Q2
2011
Q3
2011
Q4
2012
Q1
2012
Q2
2012
Q3
2012
Q4
2013
Q1
2013
Q2
2013
Q3
2013
Q4
2014
Q1
2014
Q2
Net Absorption (SF) New Supply (SF) Vacancy Rate (%)
0.0%
2.0%
4.0%
6.0%
8.0%
10.0%
12.0%
14.0%
-600,000
-400,000
-200,000
0
200,000
400,000
600,000
800,000
1,000,000
2011
Q1
2011
Q2
2011
Q3
2011
Q4
2012
Q1
2012
Q2
2012
Q3
2012
Q4
2013
Q1
2013
Q2
2013
Q3
2013
Q4
2014
Q1
2014
Q2
2014
Q3
2014
Q4
2015
1Q
2015
2Q
2015
3Q
2015
4Q
2016
1Q

11Research & Forecast Report | Q2 2015 | Greater Toronto Area / Office | Colliers International
Glossary
Weighted Average Asking Net Rent: The dollar amount requested by landlords for an available space, expressed as an average based on the weight of available space.
Availability: The total amount of space that is currently being marketed as available for lease or sublease at the end of the quarter. It includes space that is available, regardless of whether the space is vacant or occupied.
Net Absorption: The net absorption in available space in a given market between the current quarter and the previous quarter.
Direct Availability: Space that is being offered for lease directly from the landlord or owner of a building, not space by another tenant in the building trying to sublet a space that has already been leased.
Sublease Availability: Sublet space that is available for sublease by a tenant to another lessee for a term equal to or shorter than that held by the tenant under its original lease with the landlord.
Under Construction: Buildings where actual ground breaking has occurred (site excavation or foundation poured) and construction is ongoing (not abandoned or discontinued) but for which a certificate of occupancy has not yet been issued.
New Supply: Total square footage with completed construction, where all that remains is the installation of tenant finishes.
Days on the Market (DOM): How many days an available industrial property has been on the market for.
GTA Central: Includes East York, Etobicoke, North York, Scarborough, Toronto and York.
GTA East: Includes Ajax, Oshawa, Pickering, and Whitby.
GTA North: Includes Aurora, Markham, Newmarket, Richmond Hill, Vaughan and Whitchurch-Stouffville.
GTA West: Includes Brampton, Burlington, Caledon, Milton, Mississauga and Oakville.
GTA Southwest: Includes Hamilton and Stoney Creek.
Forecast Assumptions & TerminologyAbsorption was calculated using moving averages of historical absorption data and supplemented with incoming new speculative and build-to-suit developments.Colliers International has adopted NAIOP’s terms and definitions which is reflected in this glossary and report.

Copyright © 2015 Colliers International.
The information contained herein has been obtained from sources deemed reliable. While every reasonable effort has been made to ensure its accuracy, we cannot guarantee it. No responsibility is assumed for any inaccuracies. Readers are encouraged to consult their professional advisors prior to acting on any of the material contained in this report.
About Colliers International Group Inc.Colliers International Group Inc. is a global leader in commercial real estate services, with more than 16,300 professionals operating out of 502 offices in 67 countries. Colliers International delivers a full range of services to real estate occupiers, owners and investors worldwide, including global corporate solutions, brokerage, property and asset management, hotel investment sales and consulting, valuation, consulting and appraisal services, mortgage banking and insightful research. In 2014 the firm handled $97 billion in total transaction value for 84,600 leases and sales. Colliers manages more than 1.7 billion square feet of commercial properties.
Colliers International Group Inc. generates more than US$2.3 billion in annual revenues. With significant insider ownership and an experienced management team, Colliers International has a long-term track record of creating value and superior returns for shareholders – previously under the ownership of FirstService, and as of June 2015, continuously as an independently owned company. The common shares of Colliers International Group Inc. trade on the NASDAQ under the symbol “CIGI” and on the Toronto Stock Exchange under the symbol “CIG”.
collierscanada.com
502 offices in 67 countries on 6 continentsUnited States: 140 Canada: 31 Latin America: 24 Asia Pacific: 199 EMEA: 108
$2.3billion in annual revenue
1.7billion square feet under management
16,300professionals and staff
MARKET CONTACT:John ArnoldiExecutive Managing Director | Toronto BrokerageDIRECT: +1 416 643 3733 [email protected]
REGIONAL AUTHORS:Kimberlee WestMarket Intelligence Team Leader | Toronto +1 416 643 [email protected]
Shawn GilliganMarket Intelligence Coordinator | Toronto DIRECT: +1 (416) 607 [email protected]
Colliers International | TorontoOne Queen Street East, Suite 2200Toronto, ON | Canada
+1 416 777 2200