Embed Size (px)
Citation preview
1
June 2016
DRAFT
LAND-USE ACTION PLAN
RETAIL MARKET ANALYSIS &
RECOMMENDATIONS
Westside Future Fund Land Use Action Plan Retail Market Analysis DRAFT
• Executive Summary & Study Area Definition
• Supply and Demand Conditions
• Study Area Assessment
• Strengths, Challenges, Opportunities
• Future Retail Potential Analysis
• Future Retail Potential Locations
• Other Recommendations
• Retail Site Selection Primer
REPORT CONTENTS

Westside Future Fund Land Use Action Plan Retail Market Analysis DRAFT
Study Area demographics will l ikely diminish the potential attraction of national retailers in the short-term in most Westside neighborhoods, which provides an opportunity for local entrepreneurs and initiatives to meet future retail demand.
Local resident spending patterns are similar to those of average American households in terms of retail spending categories.
While the local retail real estate market indicators lag those of the city overall, the local market supports over 800,000 SF of occupied space.
Significant leakage of local retail spending to other commercial areas exists – i.e., local household spending supports large amounts of retail space outside of the Study Area. Capturing a portion of this spending leakage back into the Study Area provides the best opportunity to support additional local retail offerings.
EXECUTIVE SUMMARY

Westside Future Fund Land Use Action Plan Retail Market Analysis DRAFT
Capturing a portion of the aforementioned leakage, as well as garnering support from new households moving into the area, and support from attendees to nearby attractions, provides the potential for up to approximately 125,000 SF of additional retail opportunity. This potential exists at strategic locations within each Study Area neighborhood.
Government entities, such as Invest Atlanta, and private organizations, such as the Westside Future Fund, are prepared to provide assistance in local redevelopment initiatives. In order to actualize the potential detailed in this report, local residents and entrepreneurs must work with these groups to initiate the retail growth. Monetary and social enterprise incentives will often be necessary to attract attention for market opportunities.
EXECUTIVE SUMMARY
Boone Corridor 6,500 - 7,750
English Ave. 4,000 - 6,250
Vine City 12,000 - 14,000
Ashview Heights 6,500 - 7,250
AUC 13,000 - 15,000
Castleberry 22,000 - 25,250
Northside Drive 42,500 - 48,750
TOTAL 106,500 - 124,250
Sq. Foot RangeNew Retail Potential by Neighborhood
Westside Future Fund Land Use Action Plan Retail Market Analysis DRAFT
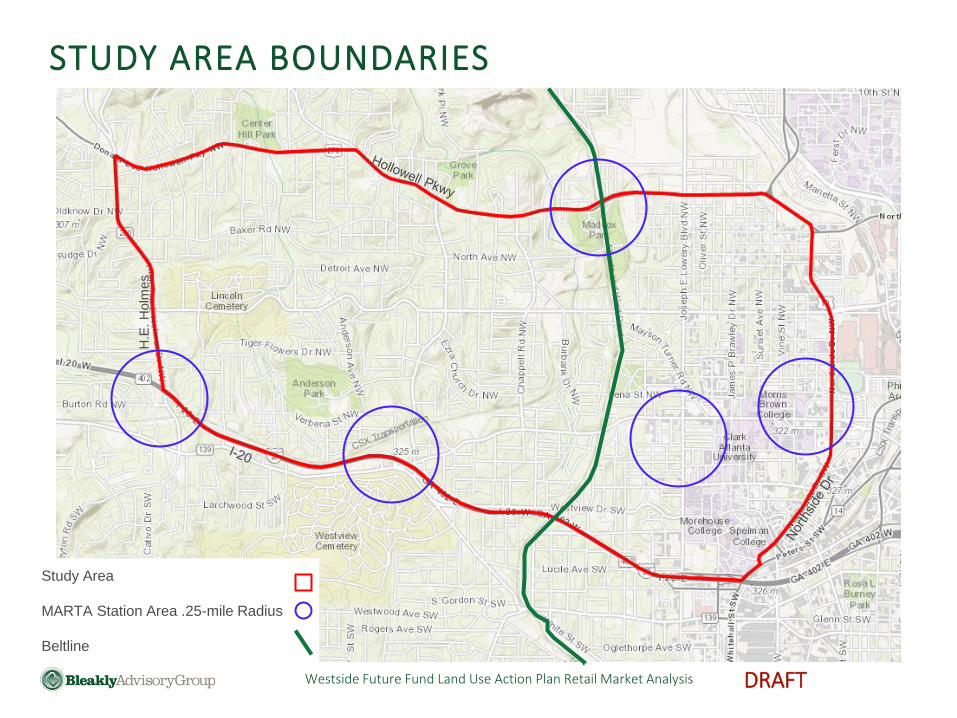
STUDY AREA BOUNDARIES
Study Area
MARTA Station Area .25-mile Radius
Beltline
H.E
. H
olm
es

Westside Future Fund Land Use Action Plan Retail Market Analysis DRAFT
SUPPLY AND DEMAND CONDITIONS
Westside Future Fund Land Use Action Plan Retail Market Analysis DRAFT
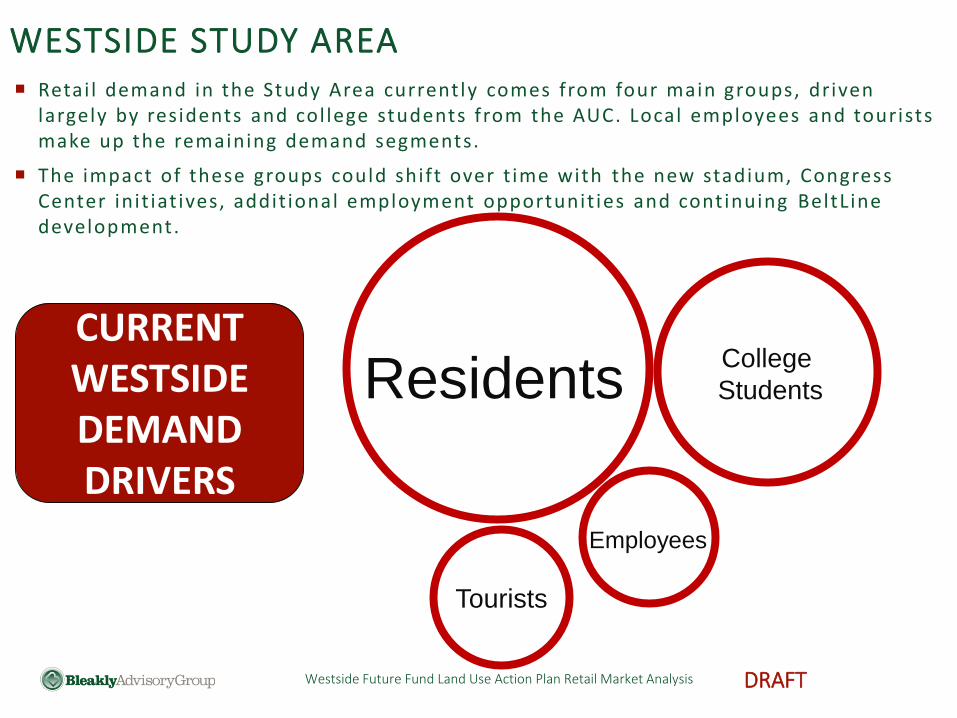
CURRENT WESTSIDE DEMAND DRIVERS
Retai l demand in the Study Area currently comes from four main groups, driven largely by residents and col lege students from the AUC. Local employees and tourists make up the remaining demand segments.
The impact of these groups could shift over t ime with the new stadium, Congress Center init iat ives, addit ional employment opportunit ies and continuing BeltLine development.
Residents
Employees
Tourists
College
Students
WESTSIDE STUDY AREA
Westside Future Fund Land Use Action Plan Retail Market Analysis DRAFT
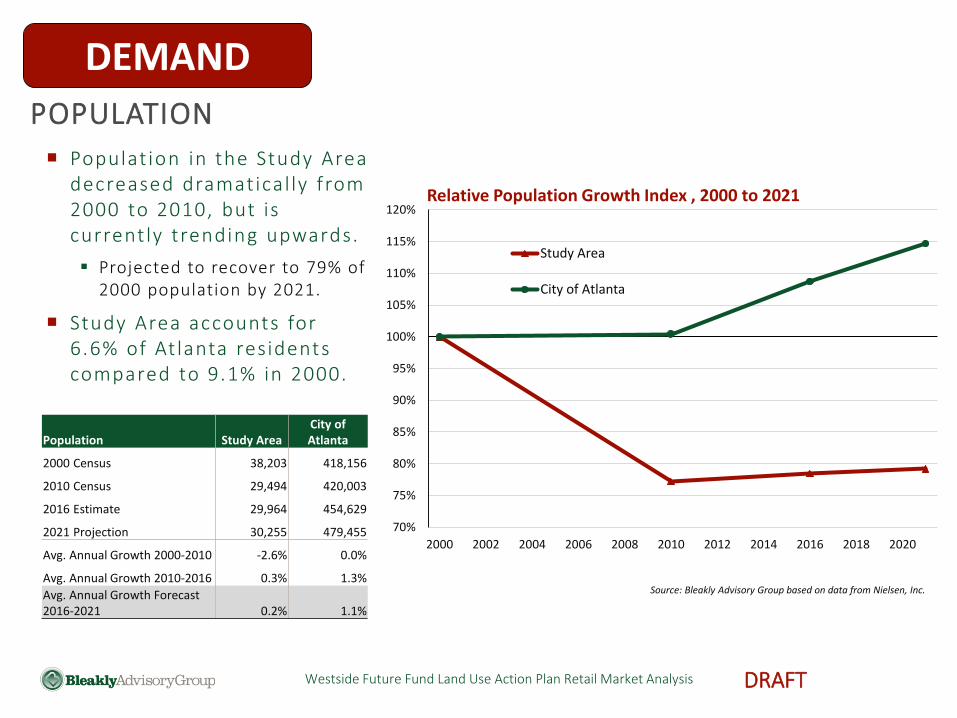
Populat ion in the Study Area decreased dramatical ly from 2000 to 2010, but is currently trending upwards.
Projected to recover to 79% of 2000 population by 2021.
Study Area accounts for 6.6% of At lanta residents compared to 9.1% in 2000.
POPULATION
70%
75%
80%
85%
90%
95%
100%
105%
110%
115%
120%
2000 2002 2004 2006 2008 2010 2012 2014 2016 2018 2020
Study Area
City of Atlanta
Relative Population Growth Index , 2000 to 2021
Population Study Area City of Atlanta
2000 Census 38,203 418,156
2010 Census 29,494 420,003
2016 Estimate 29,964 454,629
2021 Projection 30,255 479,455
Avg. Annual Growth 2000-2010 -2.6% 0.0%
Avg. Annual Growth 2010-2016 0.3% 1.3%
Avg. Annual Growth Forecast 2016-2021 0.2% 1.1%
Source: Bleakly Advisory Group based on data from Nielsen, Inc.
DEMAND

Westside Future Fund Land Use Action Plan Retail Market Analysis DRAFT
Persons per Square Mile, By Block Group
116,000 – 618,000
22,000 – 116,000
4,000 – 22,000
1,000 – 4,000
0 – 1,000
Based on Data from ESRI
Populat ion density i s greatest in the eastern port ion of the Study Area.
Greater population density will help drive retail demand.
Overal l , c i ty of At lanta populat ion density : 3 ,413 persons per Square Mi le
DEMAND POPULATION DENSITY
Source: ESRI
Westside Future Fund Land Use Action Plan Retail Market Analysis DRAFT
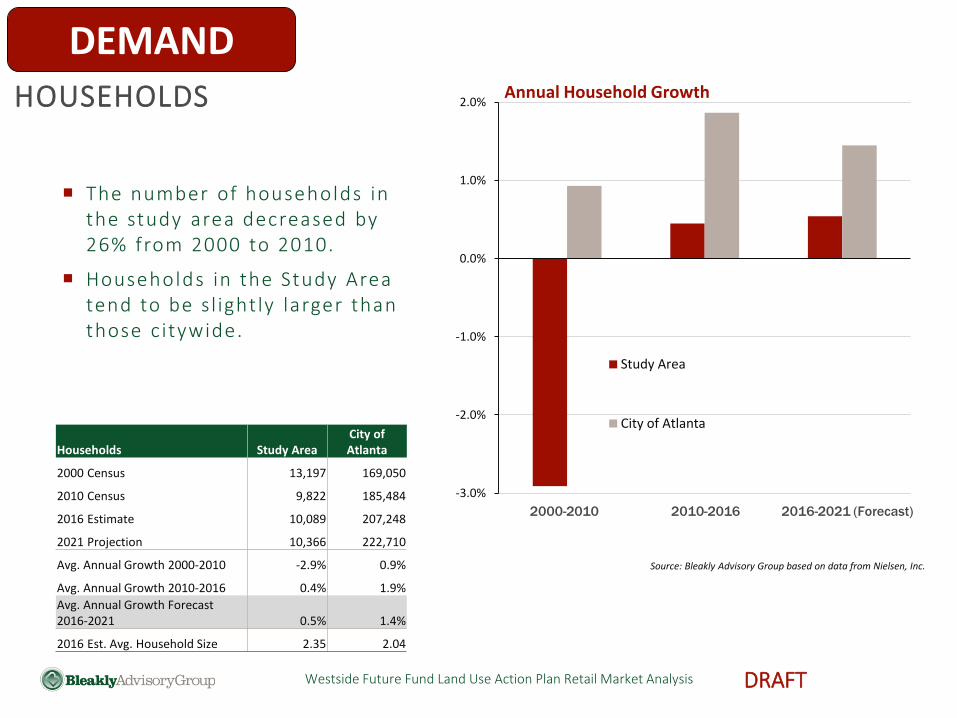
The number of households in the study area decreased by 26% from 2000 to 2010.
Households in the Study Area tend to be sl ight ly larger than those c itywide.
Households Study Area
City of Atlanta
2000 Census 13,197 169,050
2010 Census 9,822 185,484
2016 Estimate 10,089 207,248
2021 Projection 10,366 222,710
Avg. Annual Growth 2000-2010 -2.9% 0.9%
Avg. Annual Growth 2010-2016 0.4% 1.9%
Avg. Annual Growth Forecast 2016-2021 0.5% 1.4%
2016 Est. Avg. Household Size 2.35 2.04
-3.0%
-2.0%
-1.0%
0.0%
1.0%
2.0%
CAGR 2000-2010 CAGR 2010-2016 CAGR 2016-2021
Study Area
City of Atlanta
2000-2010 2010-2016 2016-2021 (Forecast)
Source: Bleakly Advisory Group based on data from Nielsen, Inc.
Annual Household Growth
DEMAND HOUSEHOLDS
Westside Future Fund Land Use Action Plan Retail Market Analysis DRAFT
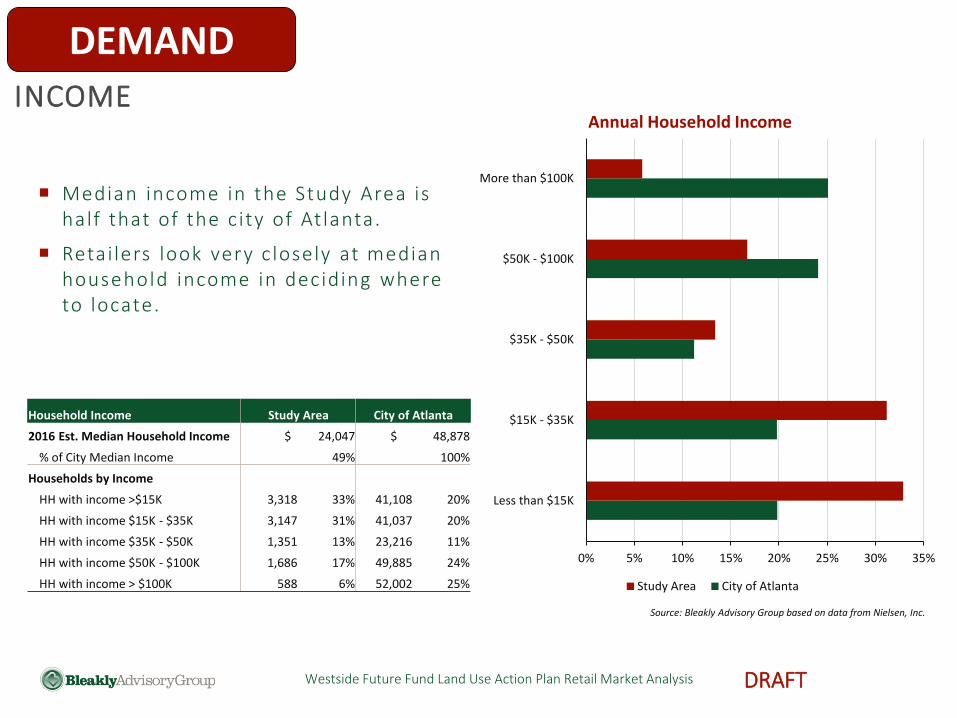
Median income in the Study Area is half that of the c ity of At lanta.
Retai lers look very c losely at median household income in deciding where to locate.
Household Income Study Area City of Atlanta
2016 Est. Median Household Income $ 24,047 $ 48,878
% of City Median Income 49% 100%
Households by Income
HH with income >$15K 3,318 33% 41,108 20%
HH with income $15K - $35K 3,147 31% 41,037 20%
HH with income $35K - $50K 1,351 13% 23,216 11%
HH with income $50K - $100K 1,686 17% 49,885 24%
HH with income > $100K 588 6% 52,002 25%
0% 5% 10% 15% 20% 25% 30% 35%
Less than $15K
$15K - $35K
$35K - $50K
$50K - $100K
More than $100K
Study Area City of Atlanta
Annual Household Income
Source: Bleakly Advisory Group based on data from Nielsen, Inc.
DEMAND INCOME
Westside Future Fund Land Use Action Plan Retail Market Analysis DRAFT
Based on Data from ESRI
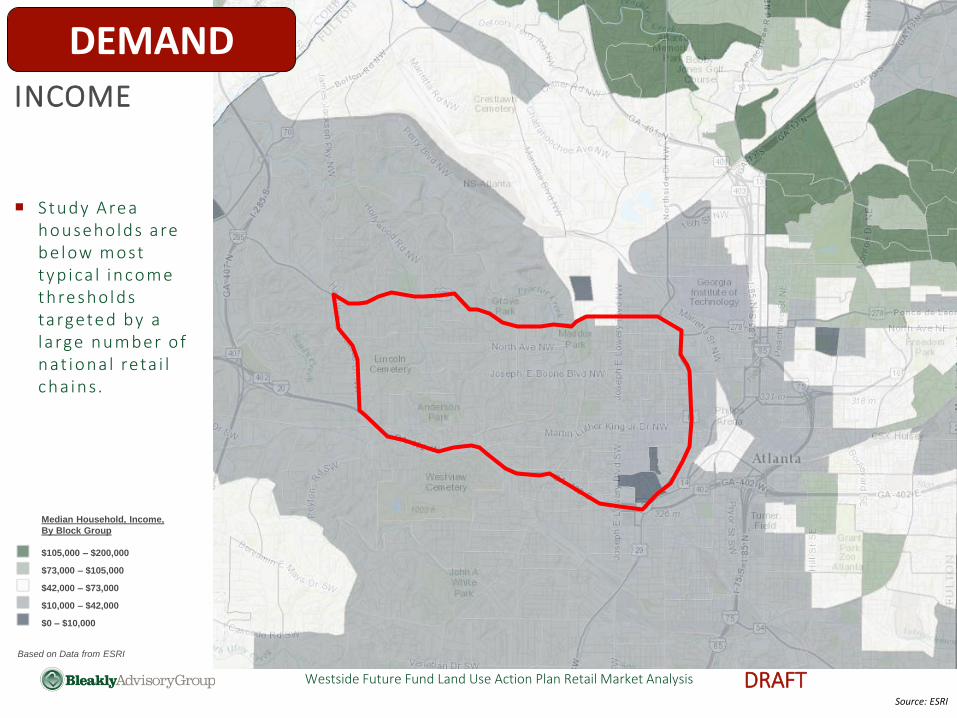
Median Household, Income,
By Block Group
$105,000 – $200,000
$73,000 – $105,000
$42,000 – $73,000
$10,000 – $42,000
$0 – $10,000
Study Area households are be low m ost ty p ica l income thresholds targeted by a l a rge num ber o f nat iona l reta i l cha ins .
DEMAND INCOME
Source: ESRI

Westside Future Fund Land Use Action Plan Retail Market Analysis DRAFT
Based on Data from ESRI
RETAIL SPENDING
DEMAND
Total Retail Spending/HH By
Census Tract
Whi le spending in the area i s s ign i f icant on a per household bas i s , i t i s be low the target leve l s sought by many nat iona l reta i le rs .
Source: ESRI
Westside Future Fund Land Use Action Plan Retail Market Analysis DRAFT
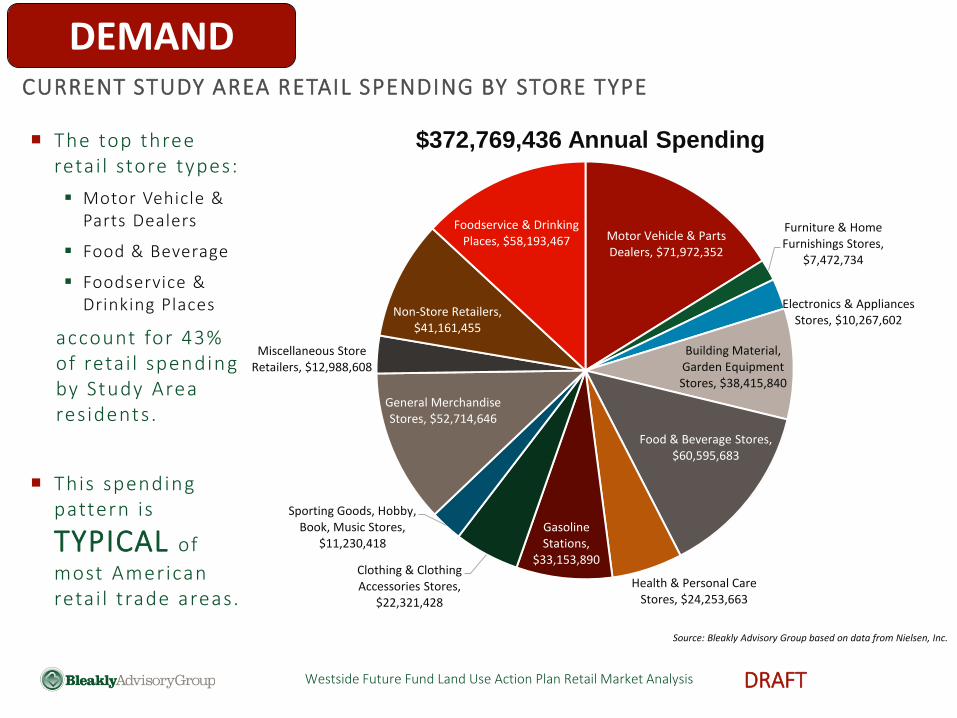
The top three retai l store types:
Motor Vehicle & Parts Dealers
Food & Beverage
Foodservice & Drinking Places
account for 43% of retai l spending by Study Area residents.
This spending pattern is
TYPICAL of
most American retai l trade areas.
CURRENT STUDY AREA RETAIL SPENDING BY STORE TYPE
Motor Vehicle & Parts Dealers, $71,972,352
Furniture & Home Furnishings Stores,
$7,472,734
Electronics & Appliances Stores, $10,267,602
Building Material, Garden Equipment Stores, $38,415,840
Food & Beverage Stores, $60,595,683
Health & Personal Care Stores, $24,253,663
Gasoline Stations,
$33,153,890 Clothing & Clothing Accessories Stores,
$22,321,428
Sporting Goods, Hobby, Book, Music Stores,
$11,230,418
General Merchandise Stores, $52,714,646
Miscellaneous Store Retailers, $12,988,608
Non-Store Retailers, $41,161,455
Foodservice & Drinking Places, $58,193,467
Source: Bleakly Advisory Group based on data from Nielsen, Inc.
DEMAND
$372,769,436 Annual Spending

Westside Future Fund Land Use Action Plan Retail Market Analysis DRAFT
Westside Study Area spending supports 1.5 million square feet of retail space(not including motor vehicles & parts)
2/3 of that spending takes place outside of the Westside Study Area.
Total Annual Resident
Consumer Expenditures
Supportable
Square Feet
Current Study Area
Occupied Retail Square
Feet
Westside Study
Area $372,769,436 1,500,000+/- 820,000
DEMAND
Source: Bleakly Advisory Group
RETAIL SPENDING & SUPPORTABLE SQUARE FEET
Current residents spending supports over 600,000 SF of retail space outside of the Study Area
Westside Future Fund Land Use Action Plan Retail Market Analysis DRAFT
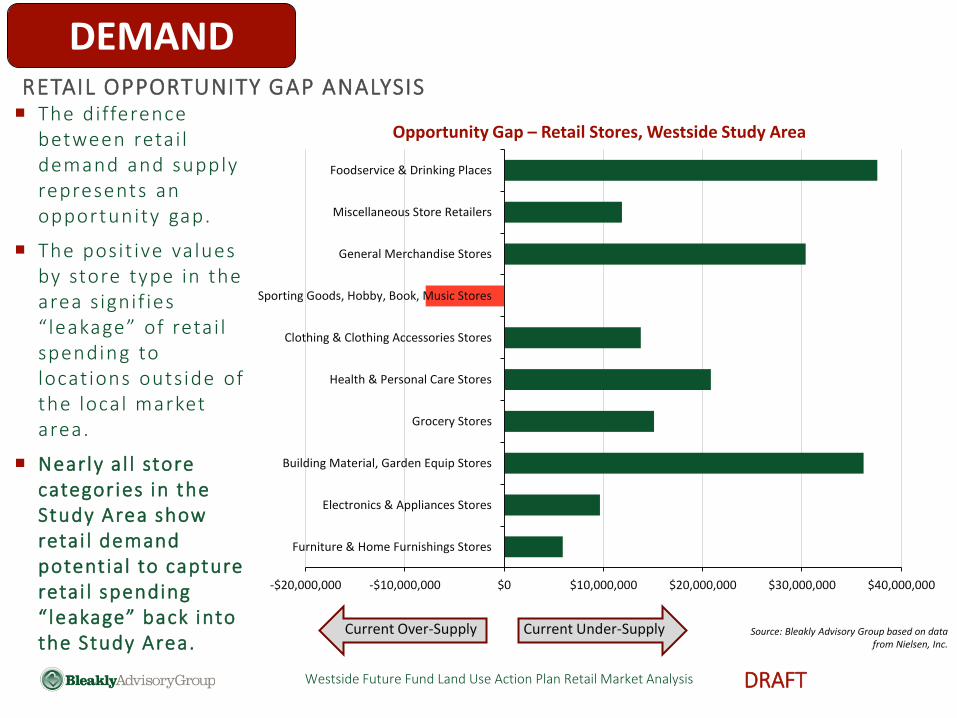
The difference between retai l demand and supply represents an opportunity gap.
The posit ive values by store type in the area signif ies “leakage” of retai l spending to locat ions outside of the local market area.
Nearly al l store categories in the Study Area show retai l demand potential to capture retai l spending “leakage” back into the Study Area.
Opportunity Gap – Retail Stores, Westside Study Area
-$20,000,000 -$10,000,000 $0 $10,000,000 $20,000,000 $30,000,000 $40,000,000
Furniture & Home Furnishings Stores
Electronics & Appliances Stores
Building Material, Garden Equip Stores
Grocery Stores
Health & Personal Care Stores
Clothing & Clothing Accessories Stores
Sporting Goods, Hobby, Book, Music Stores
General Merchandise Stores
Miscellaneous Store Retailers
Foodservice & Drinking Places
Current Over-Supply Current Under-Supply
DEMAND RETAIL OPPORTUNITY GAP ANALYSIS
Source: Bleakly Advisory Group based on data from Nielsen, Inc.

Westside Future Fund Land Use Action Plan Retail Market Analysis DRAFT
Based on Data from ESRI
DEMAND RETAIL OPPORTUNITY GAP ANALYSIS
Total Retail Opportunity Gap By
Block Group
Nearly al l block groups west of Lowery Blvd. show opportunit ies to capture retai l leakage.
Source: ESRI
Westside Future Fund Land Use Action Plan Retail Market Analysis DRAFT
1
2
3 4
5
6 7 8
9
10
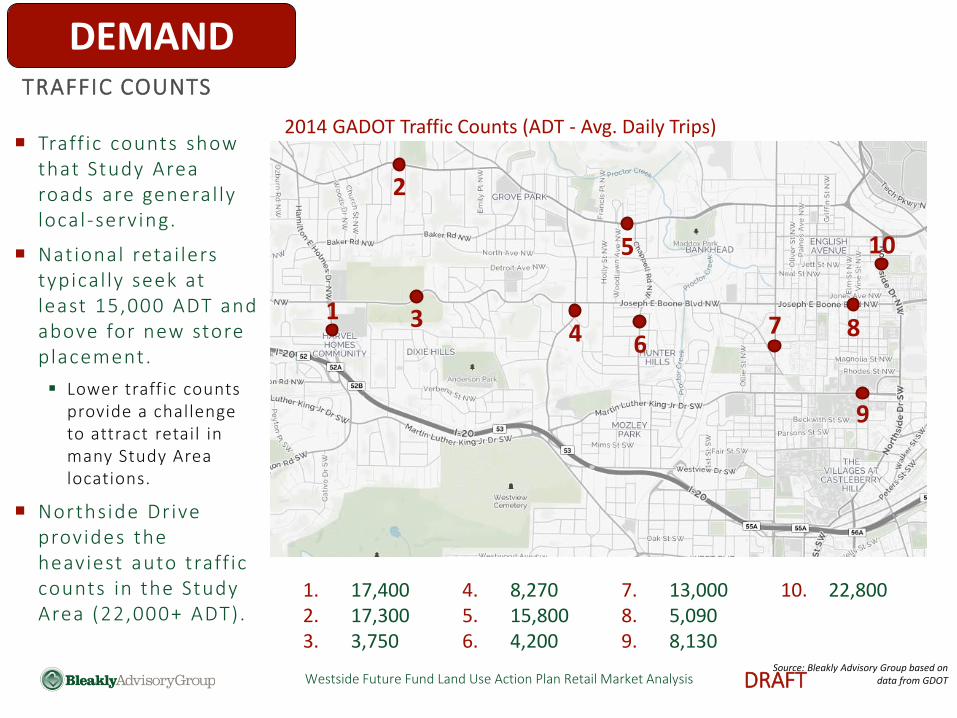
1. 17,400 2. 17,300 3. 3,750
4. 8,270 5. 15,800 6. 4,200
7. 13,000 8. 5,090 9. 8,130
10. 22,800
2014 GADOT Traffic Counts (ADT - Avg. Daily Trips)
DEMAND TRAFFIC COUNTS
Source: Bleakly Advisory Group based on data from GDOT
Traff ic counts show that Study Area roads are general ly local-serving.
National retai lers typical ly seek at least 15,000 ADT and above for new store placement.
Lower traffic counts provide a challenge to attract retail in many Study Area locations.
Northside Drive provides the heaviest auto traff ic counts in the Study Area (22,000+ ADT).
Westside Future Fund Land Use Action Plan Retail Market Analysis DRAFT
OVERVIEW
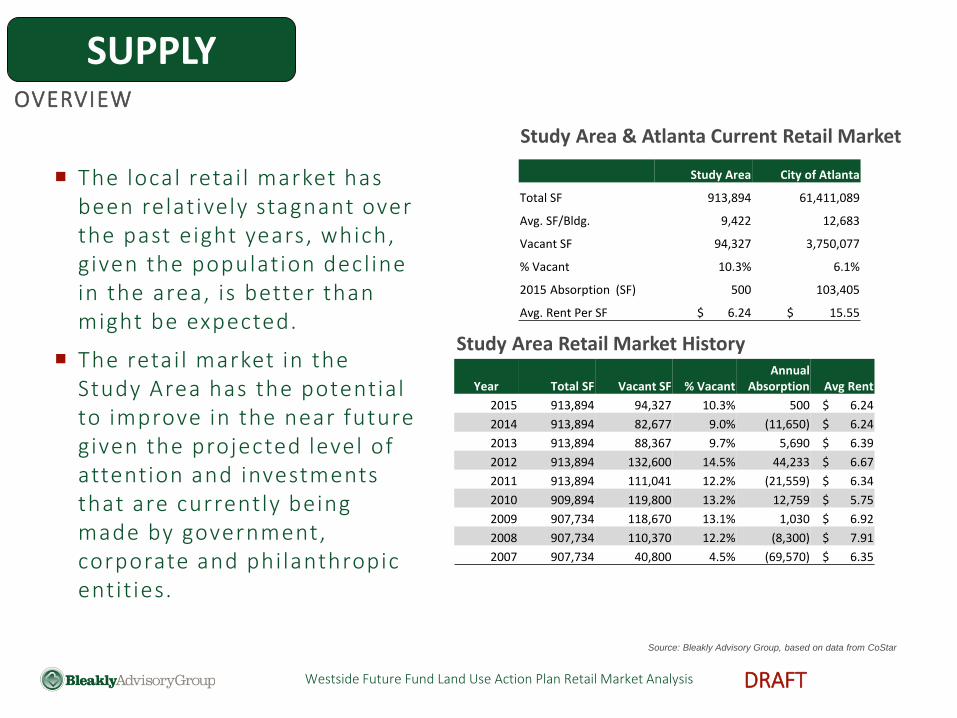
Year Total SF Vacant SF % Vacant Annual
Absorption Avg Rent
2015 913,894 94,327 10.3% 500 $ 6.24
2014 913,894 82,677 9.0% (11,650) $ 6.24
2013 913,894 88,367 9.7% 5,690 $ 6.39
2012 913,894 132,600 14.5% 44,233 $ 6.67
2011 913,894 111,041 12.2% (21,559) $ 6.34
2010 909,894 119,800 13.2% 12,759 $ 5.75
2009 907,734 118,670 13.1% 1,030 $ 6.92
2008 907,734 110,370 12.2% (8,300) $ 7.91
2007 907,734 40,800 4.5% (69,570) $ 6.35
Study Area City of Atlanta
Total SF 913,894 61,411,089
Avg. SF/Bldg. 9,422 12,683
Vacant SF 94,327 3,750,077
% Vacant 10.3% 6.1%
2015 Absorption (SF) 500 103,405
Avg. Rent Per SF $ 6.24 $ 15.55
SUPPLY
Source: Bleakly Advisory Group, based on data from CoStar
The local retai l market has been relatively stagnant over the past eight years, which, given the population decl ine in the area, is better than might be expected.
The retai l market in the Study Area has the potential to improve in the near future given the projected level of attention and investments that are currently being made by government, corporate and philanthropic entit ies.
Study Area Retail Market History
Study Area & Atlanta Current Retail Market
Westside Future Fund Land Use Action Plan Retail Market Analysis DRAFT
Downtown
Atlanta
Study Area
3-Mile Radius
from
MLK/Lowery
0
366,000
Based on Data from CoStar
SUPPLY
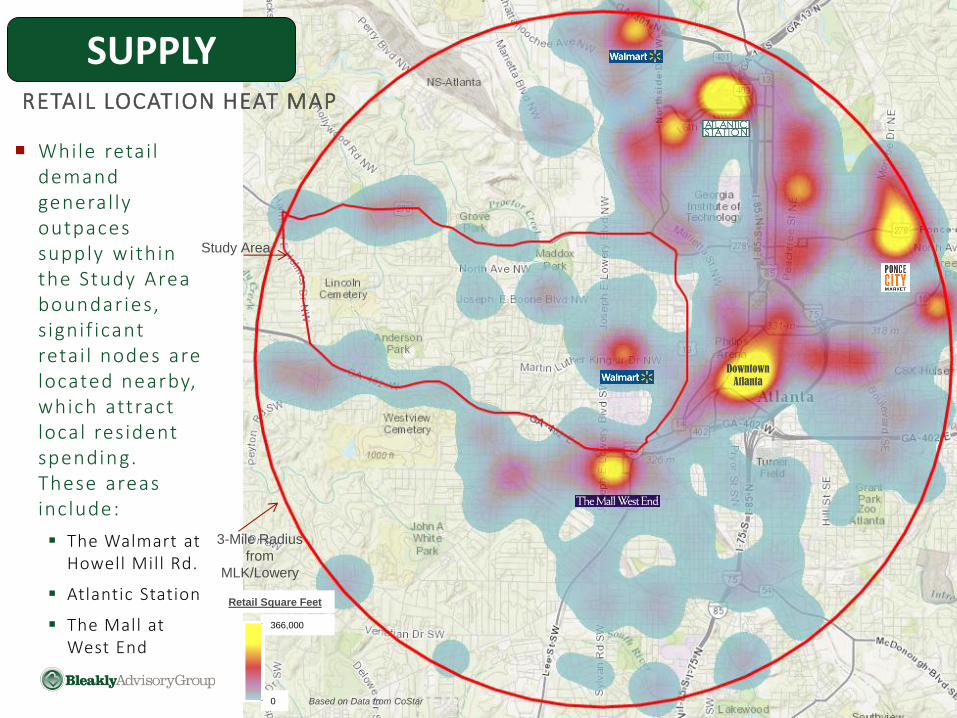
While retai l demand general ly outpaces supply within the Study Area boundaries, s ignif icant retai l nodes are located nearby, which attract local resident spending. These areas inc lude:
The Walmart at Howell Mill Rd.
Atlantic Station
The Mall at West End
RETAIL LOCATION HEAT MAP
Retail Square Feet

Westside Future Fund Land Use Action Plan Retail Market Analysis DRAFT
The Study Area’s share of the c ity ’s retai l space has remained relat ively stable, dropping by approximately 0.2% over the past decade.
1.0%
1.1%
1.2%
1.3%
1.4%
1.5%
1.6%
1.7%
1.8%
2000Q1
2001Q1
2002Q1
2003Q1
2004Q1
2005Q1
2006Q1
2007Q1
2008Q1
2009Q1
2010Q1
2011Q1
2012Q1
2013Q1
2014Q1
2015Q1
QTD
Total SF
Occupied SF
Study Area Share of City of Atlanta Retail Square Feet
STUDY AREA SHARE OF RETAIL VS. CITY OF ATLANTA
SUPPLY
Source: Bleakly Advisory Group, based on data from CoStar

Westside Future Fund Land Use Action Plan Retail Market Analysis DRAFT
Since the onset of the Great Recession retai l vacancy rates in the Study Area have remained above the c ity of At lanta rate, general ly 9% -10%.
VACANCY
0%
2%
4%
6%
8%
10%
12%
14%
16%
2000Q1
2001Q1
2002Q1
2003Q1
2004Q1
2005Q1
2006Q1
2007Q1
2008Q1
2009Q1
2010Q1
2011Q1
2012Q1
2013Q1
2014Q1
2015Q1
QTD
Study Area
City of Atlanta
SUPPLY
Source: Bleakly Advisory Group,
based on data from CoStar
Westside Future Fund Land Use Action Plan Retail Market Analysis DRAFT
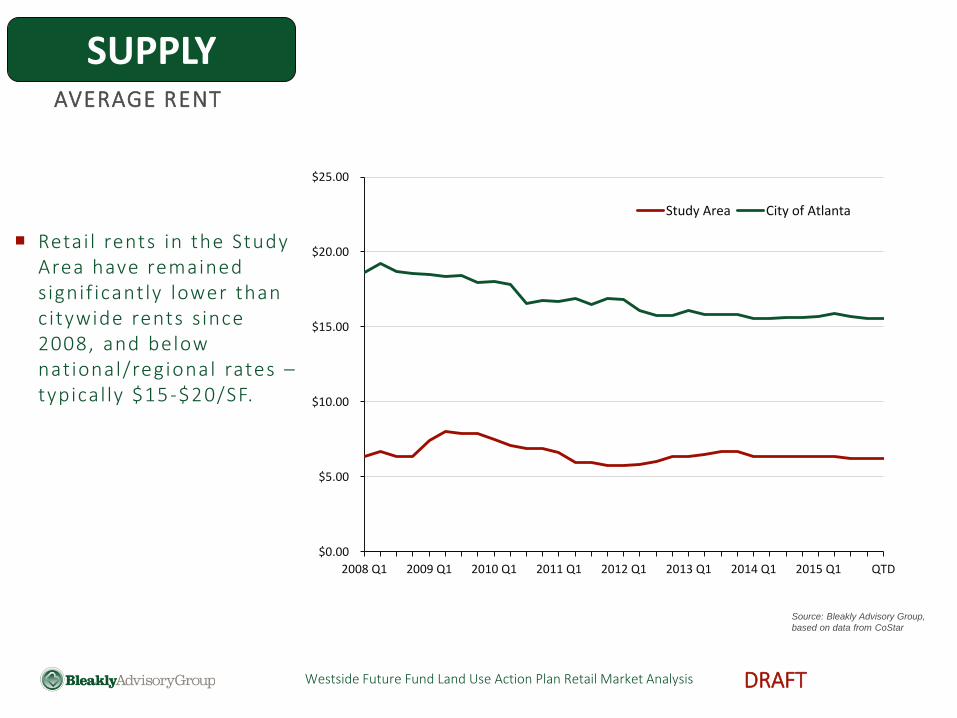
Retai l rents in the Study Area have remained signif icantly lower than citywide rents since 2008, and below national/regional rates – typical ly $15-$20/SF.
AVERAGE RENT
$0.00
$5.00
$10.00
$15.00
$20.00
$25.00
2008 Q1 2009 Q1 2010 Q1 2011 Q1 2012 Q1 2013 Q1 2014 Q1 2015 Q1 QTD
Study Area City of Atlanta
SUPPLY
Source: Bleakly Advisory Group,
based on data from CoStar
Westside Future Fund Land Use Action Plan Retail Market Analysis DRAFT
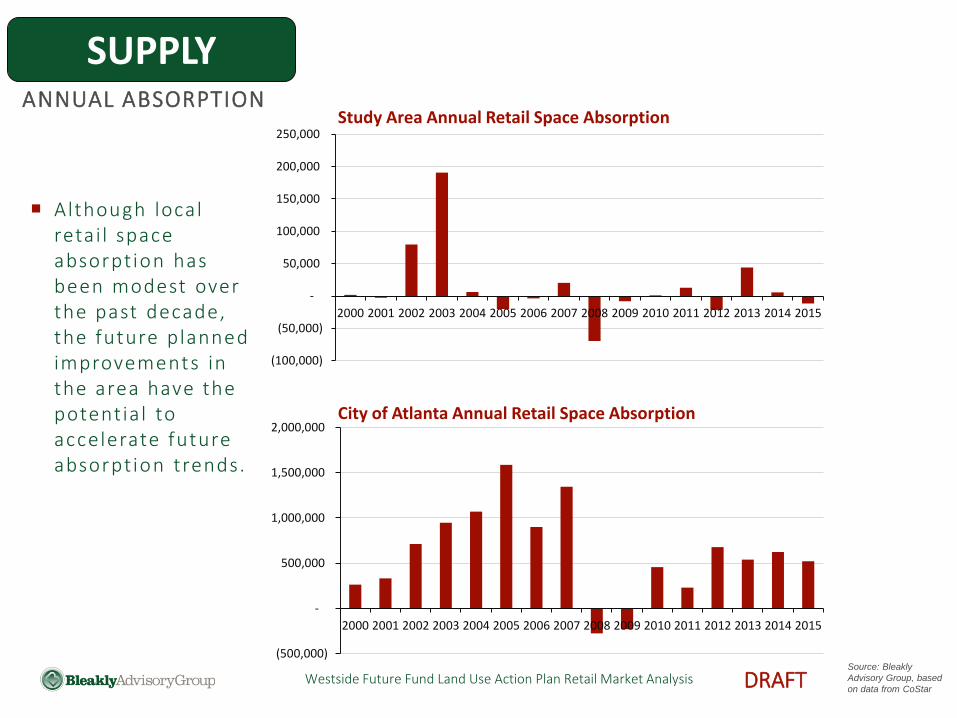
ANNUAL ABSORPTION
(100,000)
(50,000)
-
50,000
100,000
150,000
200,000
250,000
2000 2001 2002 2003 2004 2005 2006 2007 2008 2009 2010 2011 2012 2013 2014 2015
(500,000)
-
500,000
1,000,000
1,500,000
2,000,000
2000 2001 2002 2003 2004 2005 2006 2007 2008 2009 2010 2011 2012 2013 2014 2015
Study Area Annual Retail Space Absorption
City of Atlanta Annual Retail Space Absorption
SUPPLY
Source: Bleakly
Advisory Group, based
on data from CoStar
Although local retai l space absorption has been modest over the past decade, the future planned improvements in the area have the potential to accelerate future absorption trends.

Westside Future Fund Land Use Action Plan Retail Market Analysis DRAFT
STUDY AREA ASSESSMENT

Westside Future Fund Land Use Action Plan Retail Market Analysis DRAFT
S ign i f i cant locat ion: in the hear t o f the At lanta reg ion
Access to outs ide consumer support
Var iety o f locat ions for a var iety o f reta i lers
Support ive communi ty w i th deep commercia l h i s tory
STUDY AREA ASSESSMENT
Strengths
Challenges
Opportunities
Lack ing demographics (househo ld dens i ty, incomes) to att ract w ide range o f nat iona l reta i lers
Lower t raf f ic counts on major ar ter ia l s
Few larger s i tes for addi t iona l reta i l deve lopment
Histor i ca l l y lag g ing per formance o f cur rent reta i l o f fer ings
Lack o f concentrated commercia l presence
Lack o f employment and tour i st o f fer ings wi th in the S tudy Area
Leverage new investment and attent ion in the area to att ract addi t iona l reta i lers at key cata ly t i c s i tes
Recapture a por t ion o f reta i l l eakage wi th demand f rom new growth
Redeve lopment at centra l ne ighborhood locat ions prov ide smal ler -sca le potent ia l , whi le locat ions near the new stad ium and the Congress Center prov ide la rger -sca le potent ia l opportunit ies .
Westside Future Fund Land Use Action Plan Retail Market Analysis DRAFT
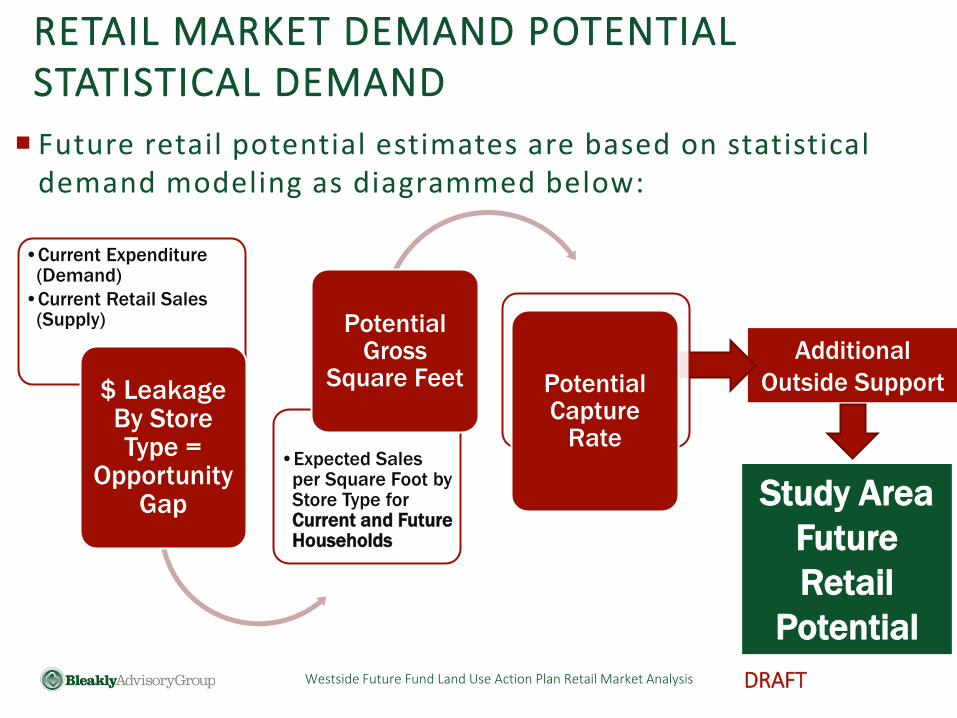
RETAIL MARKET DEMAND POTENTIAL STATISTICAL DEMAND
Additional
Outside Support
•Current Expenditure (Demand)
•Current Retail Sales (Supply)
$ Leakage By Store Type =
Opportunity Gap
•Expected Sales per Square Foot by Store Type for Current and Future Households
Potential Gross
Square Feet Potential Capture
Rate
Future retail potential estimates are based on statistical demand modeling as diagrammed below:
Study Area
Future
Retail
Potential
Westside Future Fund Land Use Action Plan Retail Market Analysis DRAFT
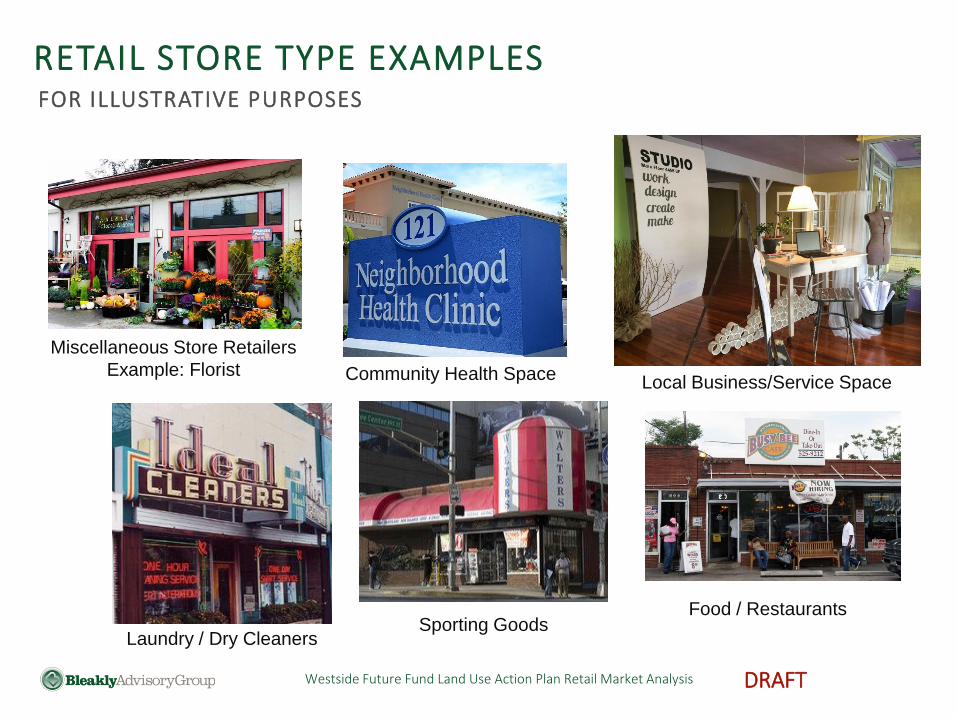
RETAIL STORE TYPE EXAMPLES FOR ILLUSTRATIVE PURPOSES
Miscellaneous Store Retailers
Example: Florist Local Business/Service Space
Laundry / Dry Cleaners Sporting Goods
Food / Restaurants
Community Health Space
Westside Future Fund Land Use Action Plan Retail Market Analysis DRAFT
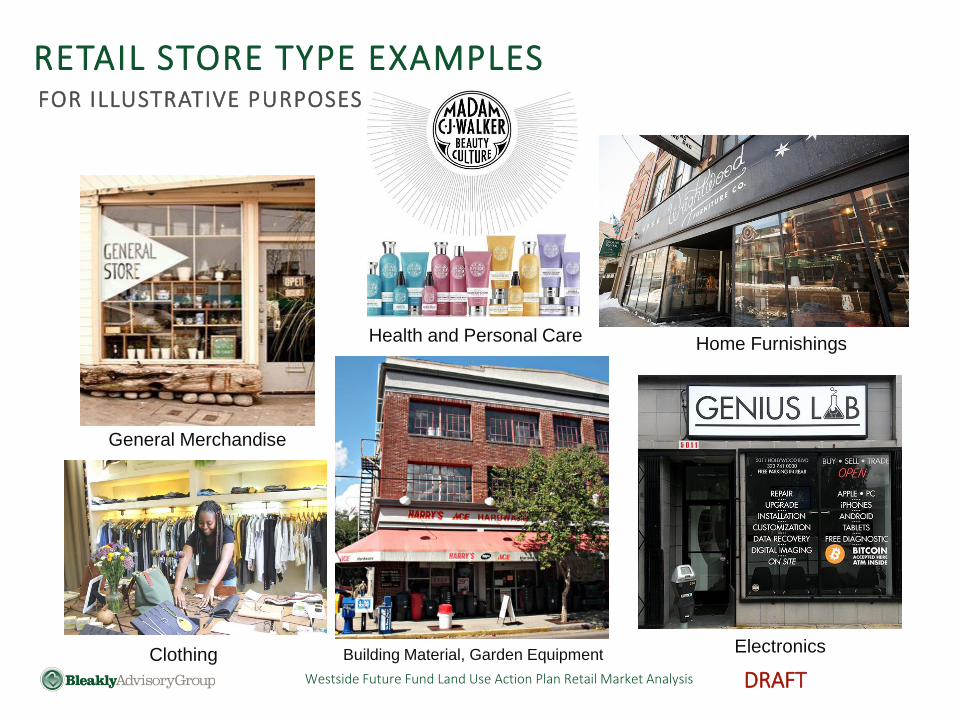
RETAIL STORE TYPE EXAMPLES FOR ILLUSTRATIVE PURPOSES
Home Furnishings
Electronics
Health and Personal Care
Building Material, Garden Equipment Clothing
General Merchandise
Westside Future Fund Land Use Action Plan Retail Market Analysis DRAFT
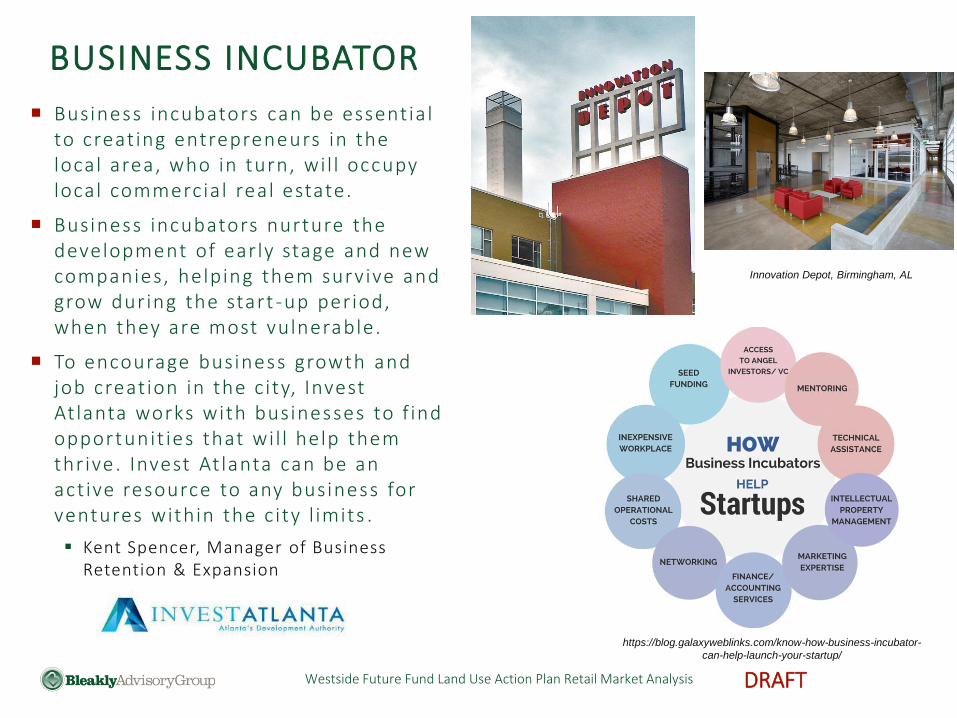
Business incubators can be essentia l to creating entrepreneurs in the local area, who in turn, wil l occupy local commercial real estate.
Business incubators nurture the development of early stage and new companies, helping them survive and grow during the start -up period, when they are most vulnerable.
To encourage business growth and job creation in the c ity, Invest At lanta works with businesses to f ind opportunit ies that wil l help them thrive. Invest At lanta can be an act ive resource to any business for ventures within the c ity l imits .
Kent Spencer, Manager of Business Retention & Expansion
BUSINESS INCUBATOR
https://blog.galaxyweblinks.com/know-how-business-incubator-
can-help-launch-your-startup/
Innovation Depot, Birmingham, AL
Westside Future Fund Land Use Action Plan Retail Market Analysis DRAFT
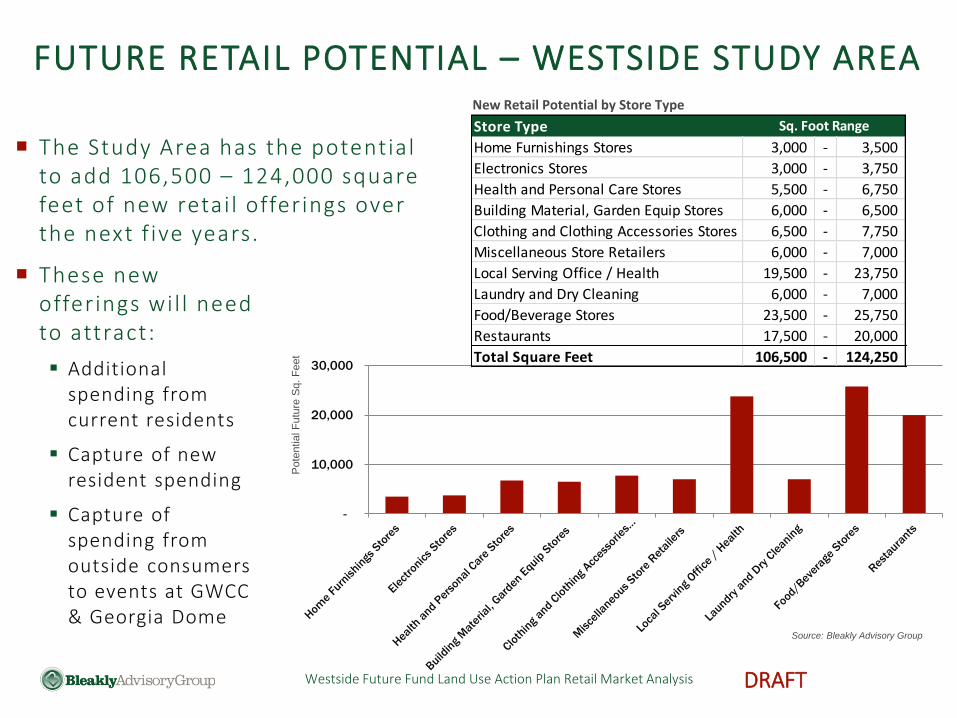
The Study Area has the potential to add 106,500 – 124,000 square feet of new retai l offerings over the next f ive years.
FUTURE RETAIL POTENTIAL – WESTSIDE STUDY AREA
These new offerings wil l need to attract:
Additional spending from current residents
Capture of new resident spending
Capture of spending from outside consumers to events at GWCC & Georgia Dome
-
10,000
20,000
30,000
Pote
ntia
l F
utu
re S
q. F
eet
Source: Bleakly Advisory Group
New Retail Potential by Store Type
Store Type
Home Furnishings Stores 3,000 - 3,500
Electronics Stores 3,000 - 3,750
Health and Personal Care Stores 5,500 - 6,750
Building Material, Garden Equip Stores 6,000 - 6,500
Clothing and Clothing Accessories Stores 6,500 - 7,750
Miscellaneous Store Retailers 6,000 - 7,000
Local Serving Office / Health 19,500 - 23,750
Laundry and Dry Cleaning 6,000 - 7,000
Food/Beverage Stores 23,500 - 25,750
Restaurants 17,500 - 20,000
Total Square Feet 106,500 - 124,250
Sq. Foot Range
Westside Future Fund Land Use Action Plan Retail Market Analysis DRAFT
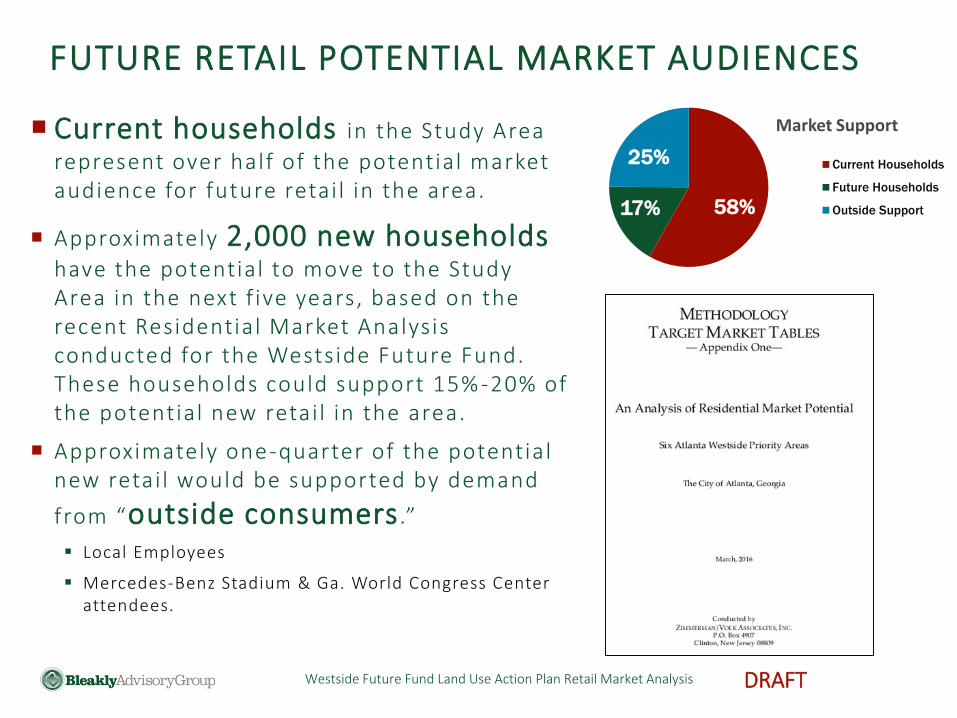
Current households in the Study Area
represent over half of the potential market audience for future retai l in the area.
Approximately 2,000 new households have the potential to move to the Study Area in the next f ive years, based on the recent Residential Market Analysis conducted for the Westside Future Fund. These households could support 15% -20% of the potential new retai l in the area.
Approximately one-quarter of the potential new retai l would be supported by demand
from “outside consumers .”
Local Employees
Mercedes-Benz Stadium & Ga. World Congress Center attendees.
FUTURE RETAIL POTENTIAL MARKET AUDIENCES
58% 17%
25% Current Households
Future Households
Outside Support
Market Support
Westside Future Fund Land Use Action Plan Retail Market Analysis DRAFT
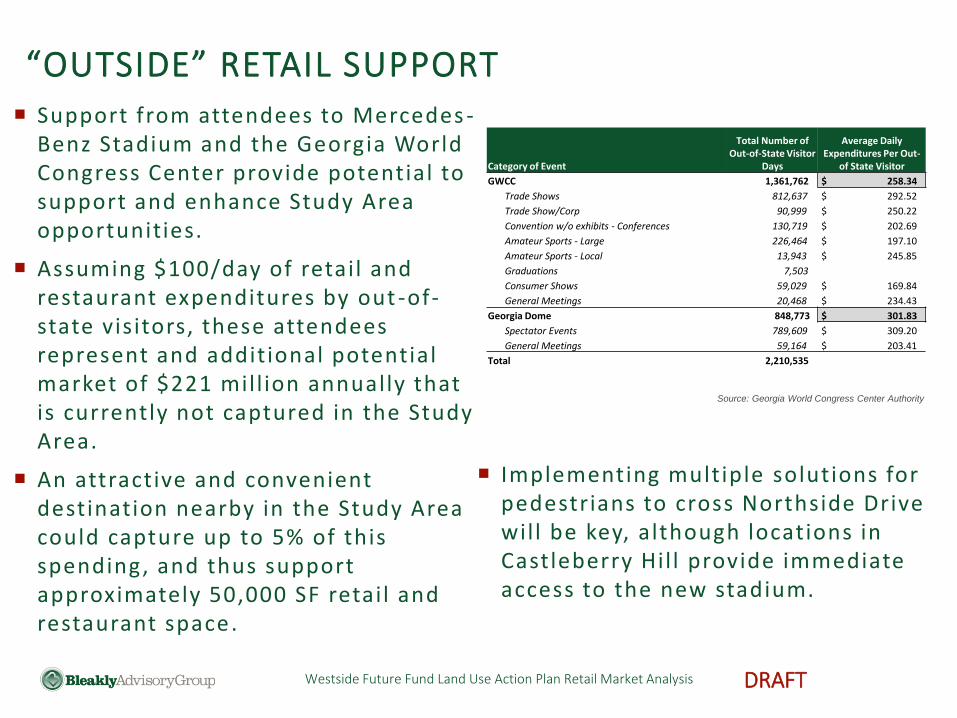
“OUTSIDE” RETAIL SUPPORT
Category of Event
Total Number of Out-of-State Visitor
Days
Average Daily Expenditures Per Out-
of State Visitor
GWCC 1,361,762 $ 258.34
Trade Shows 812,637 $ 292.52
Trade Show/Corp 90,999 $ 250.22
Convention w/o exhibits - Conferences 130,719 $ 202.69
Amateur Sports - Large 226,464 $ 197.10
Amateur Sports - Local 13,943 $ 245.85
Graduations 7,503
Consumer Shows 59,029 $ 169.84
General Meetings 20,468 $ 234.43
Georgia Dome 848,773 $ 301.83
Spectator Events 789,609 $ 309.20
General Meetings 59,164 $ 203.41
Total 2,210,535
Support from attendees to Mercedes -Benz Stadium and the Georgia World Congress Center provide potential to support and enhance Study Area opportunities.
Assuming $100/day of retail and restaurant expenditures by out -of-state visitors, these attendees represent and additional potential market of $221 mill ion annually that is currently not captured in the Study Area.
An attractive and convenient destination nearby in the Study Area could capture up to 5% of this spending, and thus support approximately 50,000 SF retail and restaurant space.
Source: Georgia World Congress Center Authority
Implementing multiple solutions for pedestrians to cross Northside Drive wil l be key, although locations in Castleberry Hil l provide immediate access to the new stadium.
Westside Future Fund Land Use Action Plan Retail Market Analysis DRAFT
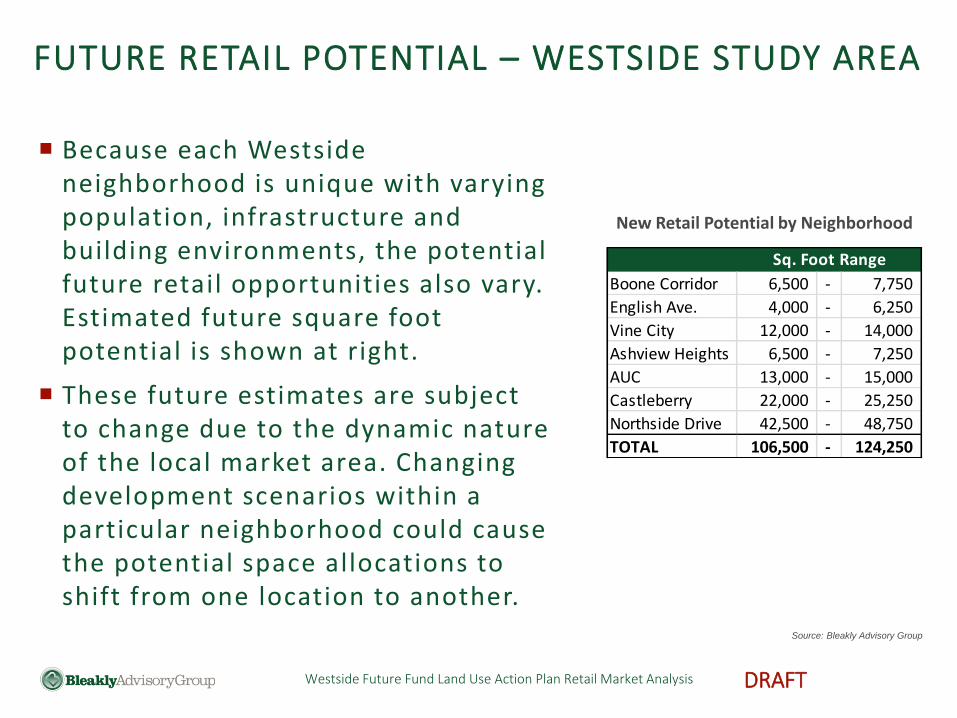
Because each Westside neighborhood is unique with varying population, infrastructure and building environments, the potential future retail opportunities also vary. Estimated future square foot potential is shown at right.
These future estimates are subject to change due to the dynamic nature of the local market area. Changing development scenarios within a particular neighborhood could cause the potential space allocations to shift from one location to another.
FUTURE RETAIL POTENTIAL – WESTSIDE STUDY AREA
Boone Corridor 6,500 - 7,750
English Ave. 4,000 - 6,250
Vine City 12,000 - 14,000
Ashview Heights 6,500 - 7,250
AUC 13,000 - 15,000
Castleberry 22,000 - 25,250
Northside Drive 42,500 - 48,750
TOTAL 106,500 - 124,250
Sq. Foot Range
Source: Bleakly Advisory Group
New Retail Potential by Neighborhood

Westside Future Fund Land Use Action Plan Retail Market Analysis DRAFT
Retai l offer ings at the Boone/Lowery intersect ion can be expanded to include Miscel laneous Store Retai lers (such as Flor ists) , Laundry, Restaurants and other options.
The new Mims Park can help attract s imilar complementary offer ings.
The Belt l ine wil l add addit ional retai l potential upon ful l development.
BOONE CORRIDOR / MIMS PARK FUTURE RETAIL POTENTIAL
Joseph E. Boone Blvd.
Joseph E
. Low
ery
Blv
d.
Future
BeltLine
Mims
Park
Total New Retail Potential: Boone Corridor
Potential Location for New Retail
Store Type
Miscellaneous Store Retailers 1,500 - 1,750
Local Serving Office / Health 1,500 - 1,750
Laundry and Dry Cleaning 1,500 - 1,750
Restaurants 2,000 - 2,500
Total Square Feet 6,500 - 7,750
Sq. Foot Range
Current GDOT Traffic Counts Joseph E. Lowery: 11,100 ADT Joseph E. Boone: 5,300 ADT
Westside Future Fund Land Use Action Plan Retail Market Analysis DRAFT
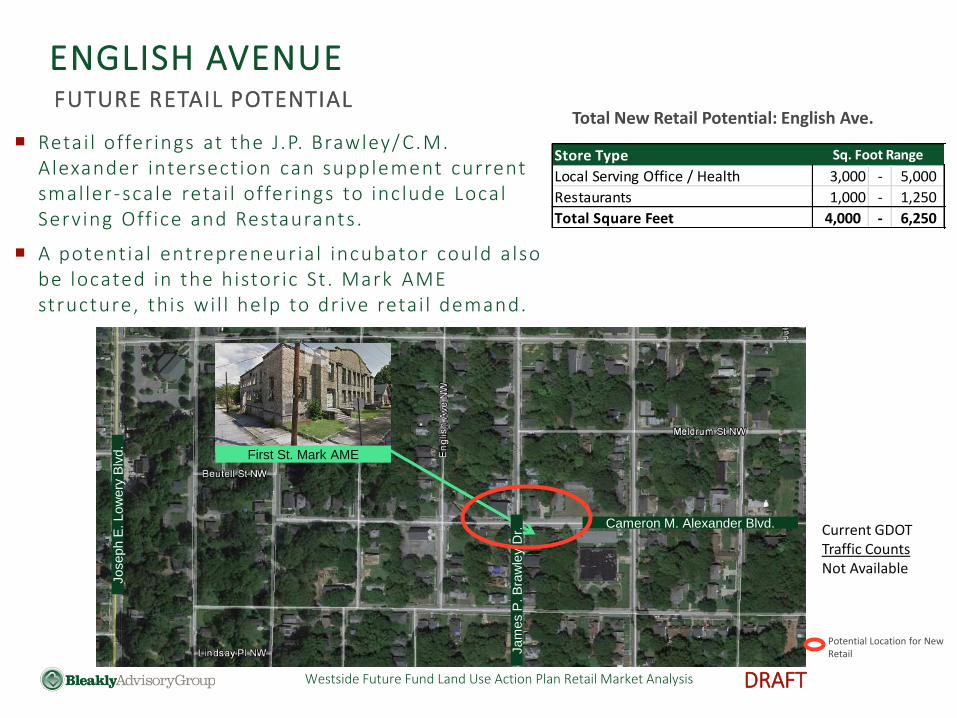
Retai l offer ings at the J.P. Brawley/ C.M. Alexander intersection can supplement current smaller-scale retai l offer ings to include Local Serving Off ice and Restaurants.
A potential entrepreneur ial incubator could also be located in the histor ic St . Mark AME structure, this wil l help to drive retai l demand.
ENGLISH AVENUE FUTURE RETAIL POTENTIAL
Cameron M. Alexander Blvd.
Joseph E
. Low
ery
Blv
d.
Total New Retail Potential: English Ave.
First St. Mark AME
Jam
es P
. B
raw
ley
Dr.
Potential Location for New Retail
Current GDOT Traffic Counts Not Available
Store Type
Local Serving Office / Health 3,000 - 5,000
Restaurants 1,000 - 1,250
Total Square Feet 4,000 - 6,250
Sq. Foot Range
Westside Future Fund Land Use Action Plan Retail Market Analysis DRAFT
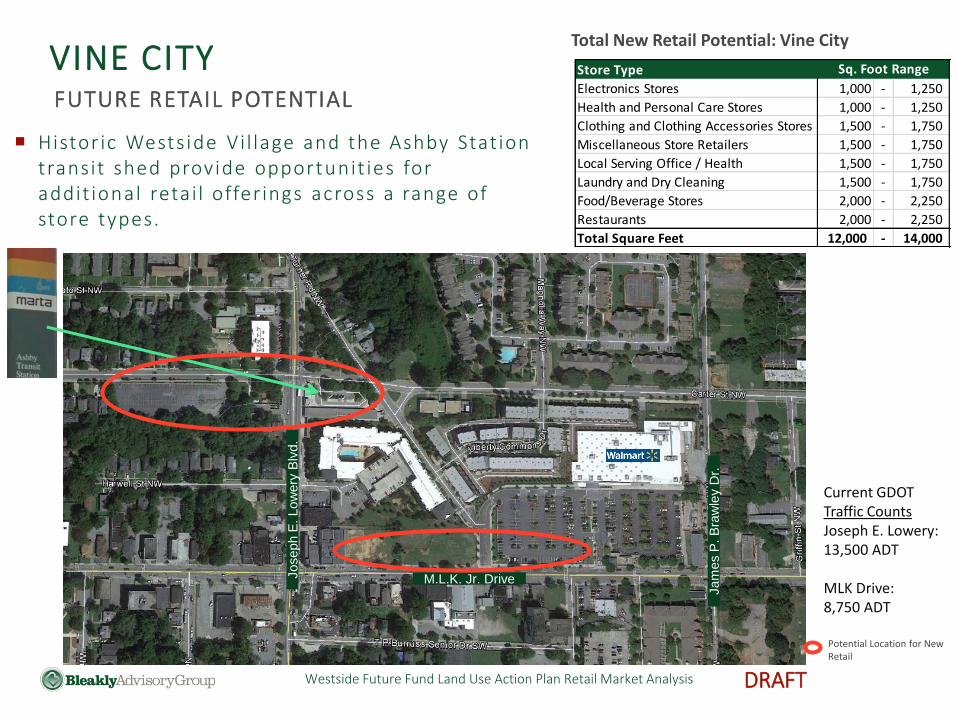
Histor ic Wests ide Vi l lage and the Ashby Stat ion transit shed provide opportunit ies for addit ional retai l offer ings across a range of store types.
VINE CITY FUTURE RETAIL POTENTIAL
M.L.K. Jr. Drive Joseph E
. Low
ery
Blv
d.
Total New Retail Potential: Vine City
Jam
es P
. B
raw
ley
Dr.
Potential Location for New Retail
Store Type
Electronics Stores 1,000 - 1,250
Health and Personal Care Stores 1,000 - 1,250
Clothing and Clothing Accessories Stores 1,500 - 1,750
Miscellaneous Store Retailers 1,500 - 1,750
Local Serving Office / Health 1,500 - 1,750
Laundry and Dry Cleaning 1,500 - 1,750
Food/Beverage Stores 2,000 - 2,250
Restaurants 2,000 - 2,250
Total Square Feet 12,000 - 14,000
Sq. Foot Range
Current GDOT Traffic Counts Joseph E. Lowery: 13,500 ADT MLK Drive: 8,750 ADT
Westside Future Fund Land Use Action Plan Retail Market Analysis DRAFT
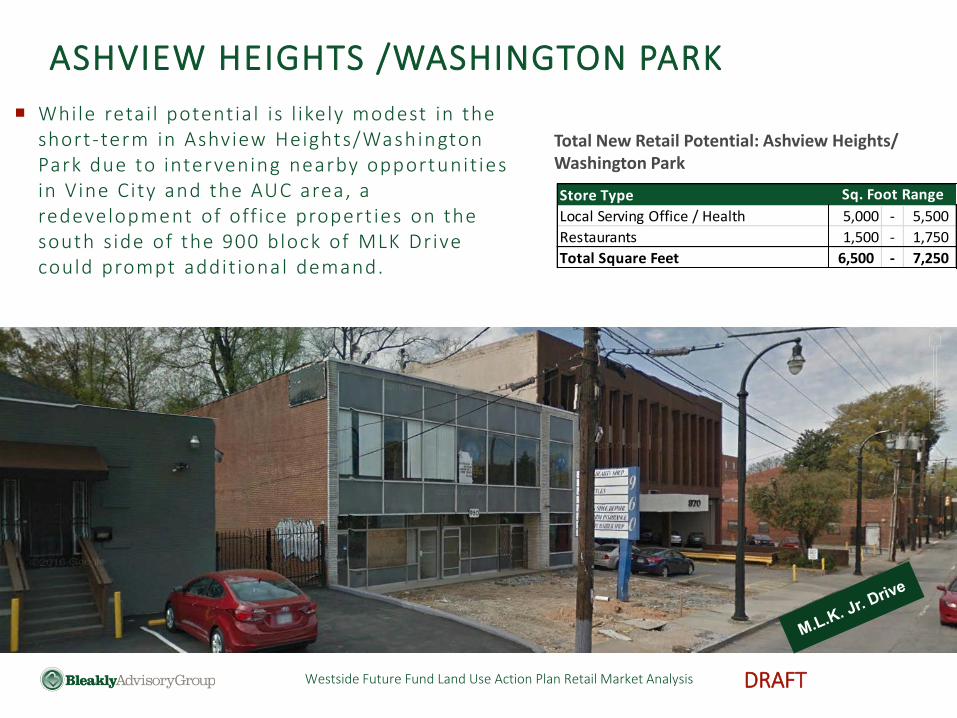
While retai l potentia l is l ikely modest in the short-term in Ashview Heights/Washington Park due to intervening nearby opportunit ies in Vine City and the AUC area, a redevelopment of off ice propert ies on the south side of the 900 block of MLK Drive could prompt addit ional demand.
ASHVIEW HEIGHTS /WASHINGTON PARK
Total New Retail Potential: Ashview Heights/ Washington Park
Store Type
Local Serving Office / Health 5,000 - 5,500
Restaurants 1,500 - 1,750
Total Square Feet 6,500 - 7,250
Sq. Foot Range
Westside Future Fund Land Use Action Plan Retail Market Analysis DRAFT
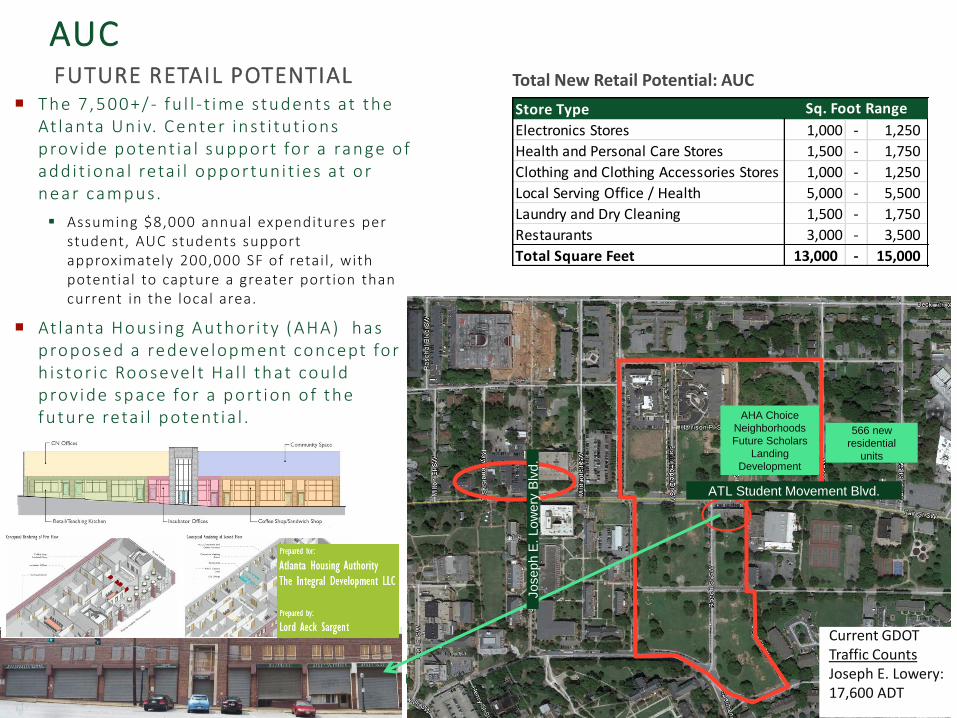
T he 7 ,500+/ - fu l l - t ime students at the At lanta Un iv. C enter inst i tut ions prov ide potent ia l support for a range of add i t iona l reta i l opportuni t ies at or near campus.
Assuming $8,000 annual expenditures per student, AUC students support approximately 200,000 SF of retail , with potential to capture a greater portion than current in the local area.
At lanta Hous ing Author i ty (AHA) has proposed a redevelopment concept for h i stor i c Roosevel t Ha l l that cou ld prov ide space for a port ion o f the future reta i l potent ia l .
AUC FUTURE RETAIL POTENTIAL Total New Retail Potential: AUC
Store Type
Electronics Stores 1,000 - 1,250
Health and Personal Care Stores 1,500 - 1,750
Clothing and Clothing Accessories Stores 1,000 - 1,250
Local Serving Office / Health 5,000 - 5,500
Laundry and Dry Cleaning 1,500 - 1,750
Restaurants 3,000 - 3,500
Total Square Feet 13,000 - 15,000
Sq. Foot Range
AHA Choice
Neighborhoods
Future Scholars
Landing
Development
Current GDOT Traffic Counts Joseph E. Lowery: 17,600 ADT
566 new
residential
units
Joseph E
. Low
ery
Blv
d.
ATL Student Movement Blvd.
Westside Future Fund Land Use Action Plan Retail Market Analysis DRAFT
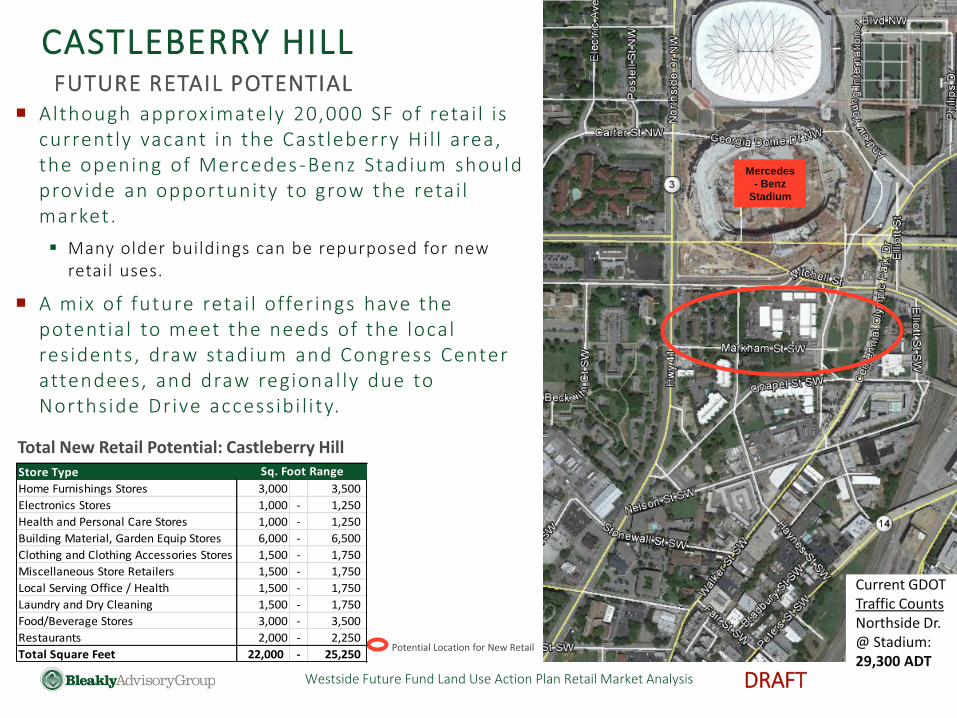
Although approx imately 20,000 SF of retai l is currently vacant in the Cast leberry Hi l l area, the opening of Mercedes -Benz Stadium should provide an opportunity to grow the retai l market.
Many older buildings can be repurposed for new retail uses.
A mix of future retai l offer ings have the potential to meet the needs of the local residents, draw stadium and Congress Center attendees, and draw regional ly due to Northside Drive accessibi l i ty.
CASTLEBERRY HILL FUTURE RETAIL POTENTIAL
Total New Retail Potential: Castleberry Hill
Mercedes
- Benz
Stadium
Potential Location for New Retail
Current GDOT Traffic Counts Northside Dr. @ Stadium: 29,300 ADT
Store Type
Home Furnishings Stores 3,000 3,500
Electronics Stores 1,000 - 1,250
Health and Personal Care Stores 1,000 - 1,250
Building Material, Garden Equip Stores 6,000 - 6,500
Clothing and Clothing Accessories Stores 1,500 - 1,750
Miscellaneous Store Retailers 1,500 - 1,750
Local Serving Office / Health 1,500 - 1,750
Laundry and Dry Cleaning 1,500 - 1,750
Food/Beverage Stores 3,000 - 3,500
Restaurants 2,000 - 2,250
Total Square Feet 22,000 - 25,250
Sq. Foot Range
Westside Future Fund Land Use Action Plan Retail Market Analysis DRAFT
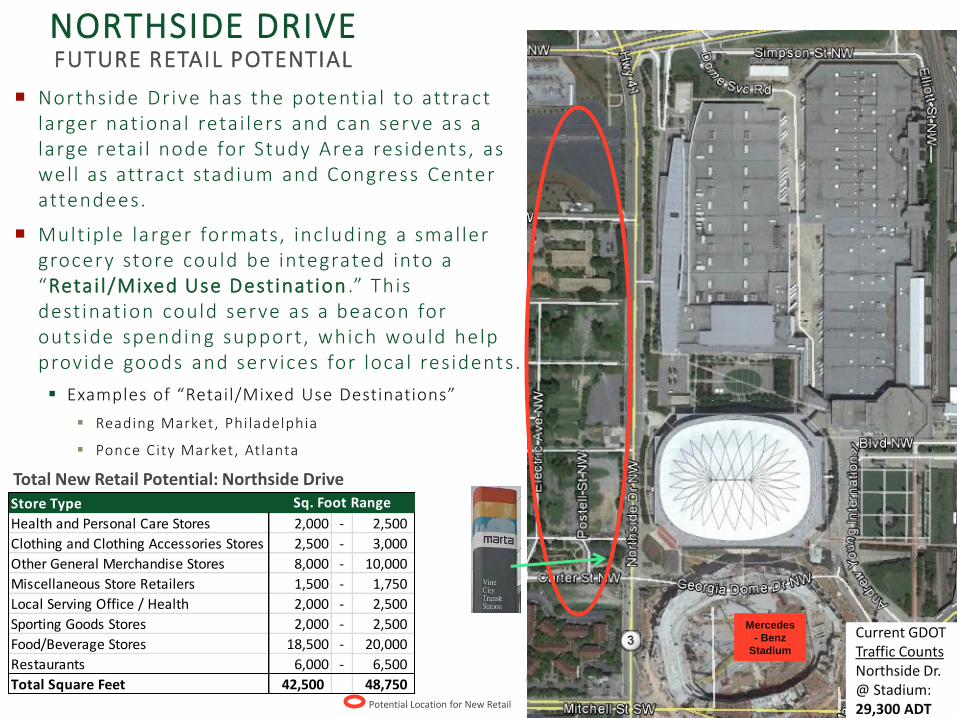
Northside Drive has the potential to attract larger national retai lers and can serve as a large retai l node for Study Area residents, as well as attract stadium and Congress Center attendees.
Multip le larger formats, including a smaller grocery store could be integrated into a “Retai l/Mixed Use Destination .” This destinat ion could serve as a beacon for outside spending support, which would help provide goods and services for local residents.
Examples of “Retail/Mixed Use Destinations”
Reading Market, Philadelphia
Ponce City Market, Atlanta
NORTHSIDE DRIVE FUTURE RETAIL POTENTIAL
Total New Retail Potential: Northside Drive
Potential Location for New Retail
Current GDOT Traffic Counts Northside Dr. @ Stadium: 29,300 ADT
Store Type
Health and Personal Care Stores 2,000 - 2,500
Clothing and Clothing Accessories Stores 2,500 - 3,000
Other General Merchandise Stores 8,000 - 10,000
Miscellaneous Store Retailers 1,500 - 1,750
Local Serving Office / Health 2,000 - 2,500
Sporting Goods Stores 2,000 - 2,500
Food/Beverage Stores 18,500 - 20,000
Restaurants 6,000 - 6,500
Total Square Feet 42,500 48,750
Sq. Foot Range
Mercedes
- Benz
Stadium

Westside Future Fund Land Use Action Plan Retail Market Analysis DRAFT
RETAIL RECOMMENDATIONS:
Key Elements of a Coordinated Retail Strategy for the Study Area:
Create clusters of retail that serve community needs and leverage current infrastructure and investments
Attract a “critical mass” of small-scale retail at key transportation intersections.
Smaller local nodes could be anchored by small “pop -up” food markets that rotate locations through the week. Would need incentives, possibly through Invest Atlanta, to provide “seed capital” for the spaces.
Retail offerings could be supplemented by small community medical -related facilities that will drive daily demand to the area. Explore partnerships with local medical schools.
Retail nodes in Castleberry/Northside Drive can provide larger retail concentration due to potential to attract outside consumers. Local residents will benefit with the expanded opportunities.
Grow the retail sector by retaining more of the current expenditure “leakage”
Focus on food, services and neighborhood needs.
Capture more student and faculty spending.
Westside Future Fund Land Use Action Plan Retail Market Analysis DRAFT
RETAIL RECOMMENDATIONS
Key Elements of a Coordinated Retail Strategy for the Study Area:
Attract more retail shoppers in the area through continued growth in “rooftops”
“Retail Follows Rooftops”
Long-range objective: Double the number of households to increase, not only the viability of the area, but also generate more self -sustaining retail demand.
Seek out new neighbors and embrace them by promoting new housing in various formats—The Westside neighborhoods have the potential to become a laboratory for new housing activity.
Leverage the considerable support structure
Invest Atlanta and private entities, such as the Westside Future Fund, are prepared to provide assistance in local redevelopment initiatives . Monetary and social enterprise incentives will often be necessary to attract market opportunities.

Westside Future Fund Land Use Action Plan Retail Market Analysis DRAFT
RETAIL SITE SELECTION PRIMER
Westside Future Fund Land Use Action Plan Retail Market Analysis DRAFT
RETAIL REALITY: SITE SELECTION
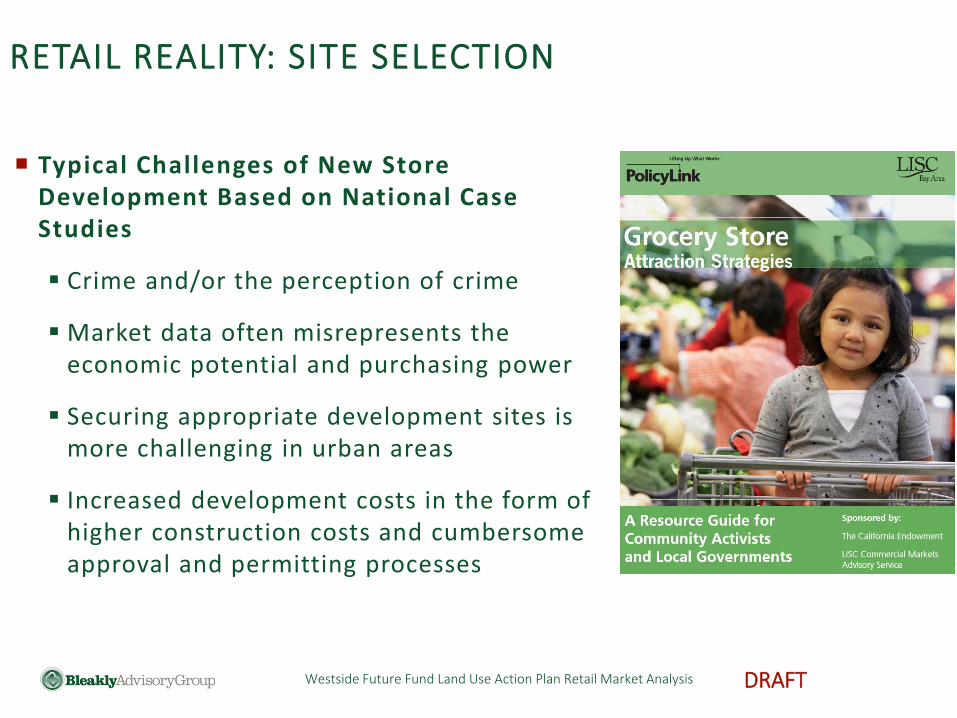
Typical Challenges of New Store Development Based on National Case Studies
Crime and/or the perception of crime
Market data often misrepresents the economic potential and purchasing power
Securing appropriate development sites is more challenging in urban areas
Increased development costs in the form of higher construction costs and cumbersome approval and permitting processes

Westside Future Fund Land Use Action Plan Retail Market Analysis DRAFT
RETAIL REALITY: SITE SELECTION
DEMAND
SUPPLY
SITE
SPACE RETAIL SITE
SELECTION
WHY DO STORES GO WHERE THEY GO?
How many people might shop there?
Demographics:
# of Households
Incomes
Etc.
What competition is
there already?
How does the
competition
perform?
Which location can generate the
most sales?
- Traffic Counts
- Parking
- Access
Which space best
suits retailer’s
needs?
Is space
available?
Westside Future Fund Land Use Action Plan Retail Market Analysis DRAFT
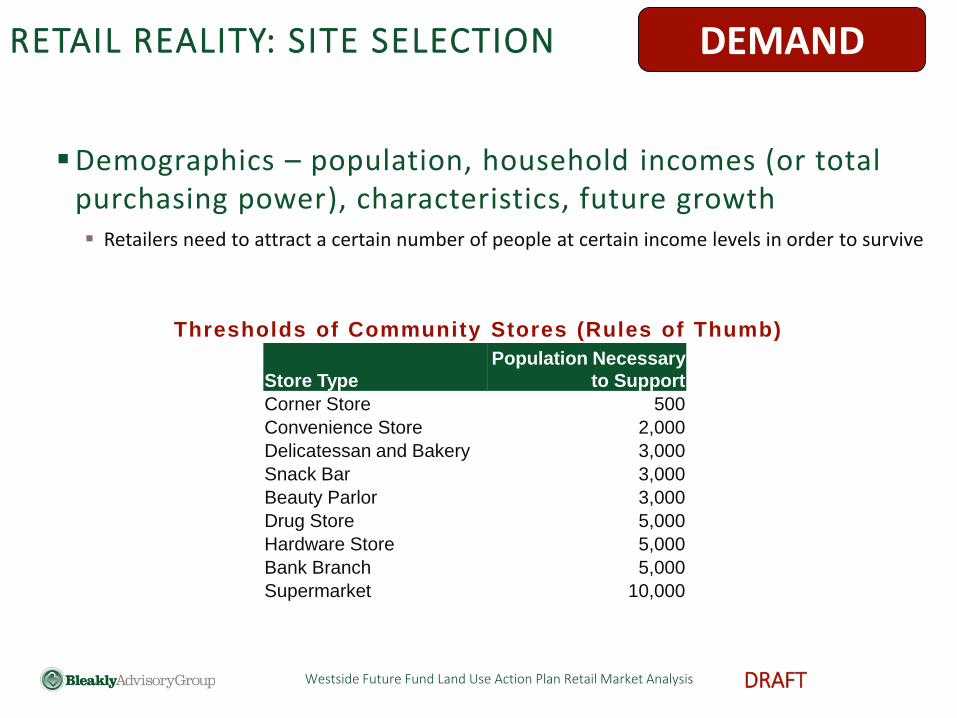
Demographics – population, household incomes (or total purchasing power), characteristics, future growth Retailers need to attract a certain number of people at certain income levels in order to survive
DEMAND
Store Type
Population Necessary
to Support
Corner Store 500
Convenience Store 2,000
Delicatessan and Bakery 3,000
Snack Bar 3,000
Beauty Parlor 3,000
Drug Store 5,000
Hardware Store 5,000
Bank Branch 5,000
Supermarket 10,000
Thresholds of Community Stores (Rules of Thumb)
RETAIL REALITY: SITE SELECTION

Westside Future Fund Land Use Action Plan Retail Market Analysis DRAFT
National retai lers typical ly fol low demand with differing requirements for their stores.
Westside Study Area meets some, not all, of the national chain requirements.
Examples (for illustrative purposes):
Store Trade Area Population Location/Other
National Drug
Store
2 mile radius 20,000 Intersection of two
main streets with
significant traffic
counts
Grocery Store 3 mile radius
20,000+ On high-visibility,
high traffic corridor
Pet Supermarket 3 mile radius 50,000 25,000 daily vehicle
traffic count
Firehouse Subs 3 mile radius 20,000+ $35,000 median
household income
Denny's 3 mile radius 40,000 30,000 daily vehicle
traffic count
RETAIL REALITY: SITE SELECTION SITE