Embed Size (px)
Citation preview
Analytical sessionNEW FIGURES AND FACTS
Kesko as a company
Quality of life every day
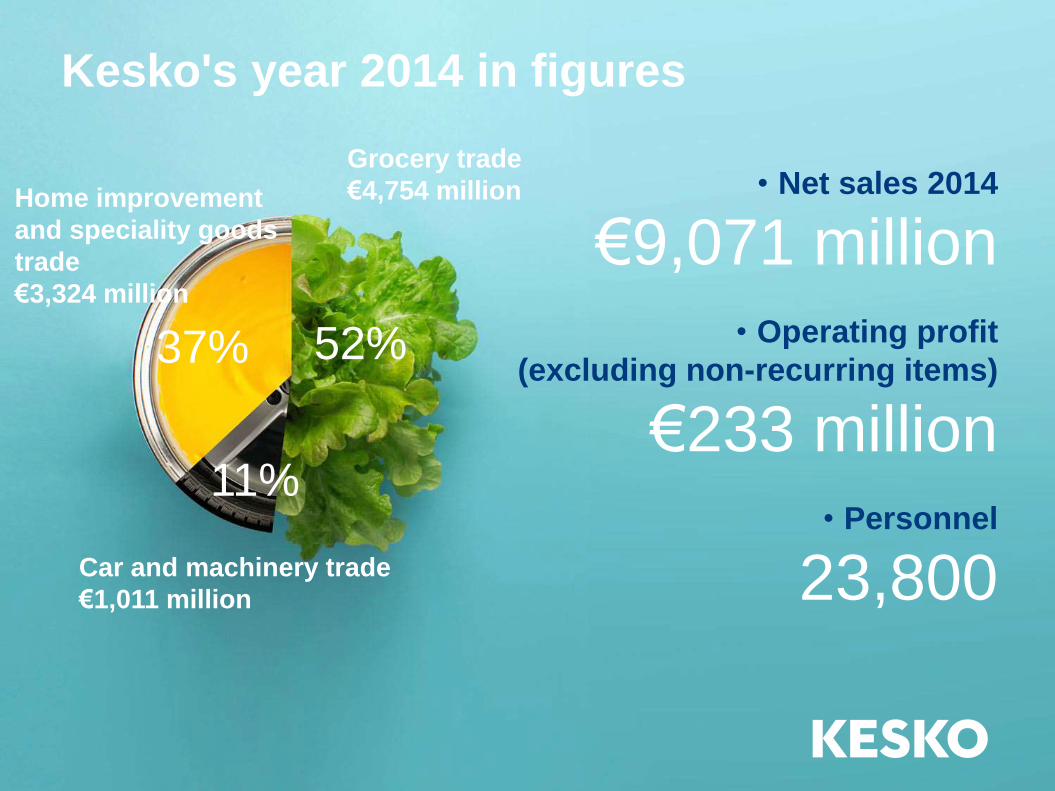
Kesko's year 2014 in figures
• Net sales 2014
€9,071 million
• Operating profit
(excluding non-recurring items)
€233 million
• Personnel
23,800
52%37%
11%
Grocery trade
€4,754 millionHome improvement
and speciality goods
trade
€3,324 million
Car and machinery trade
€1,011 million
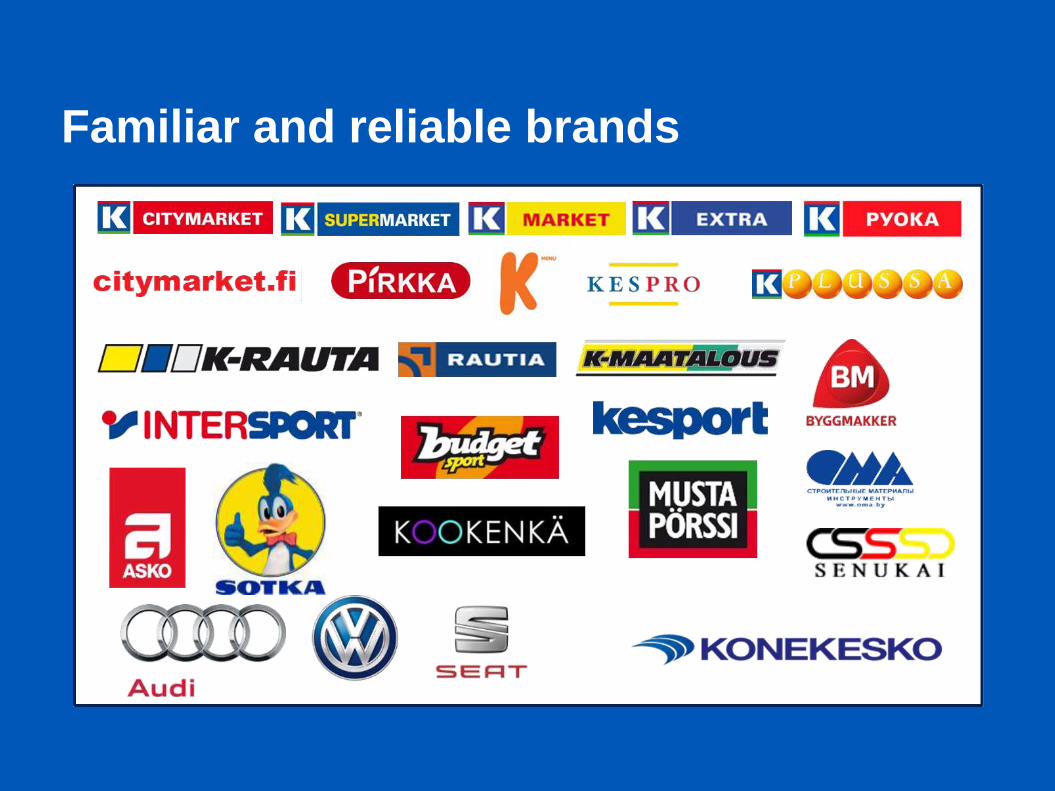
Familiar and reliable brands
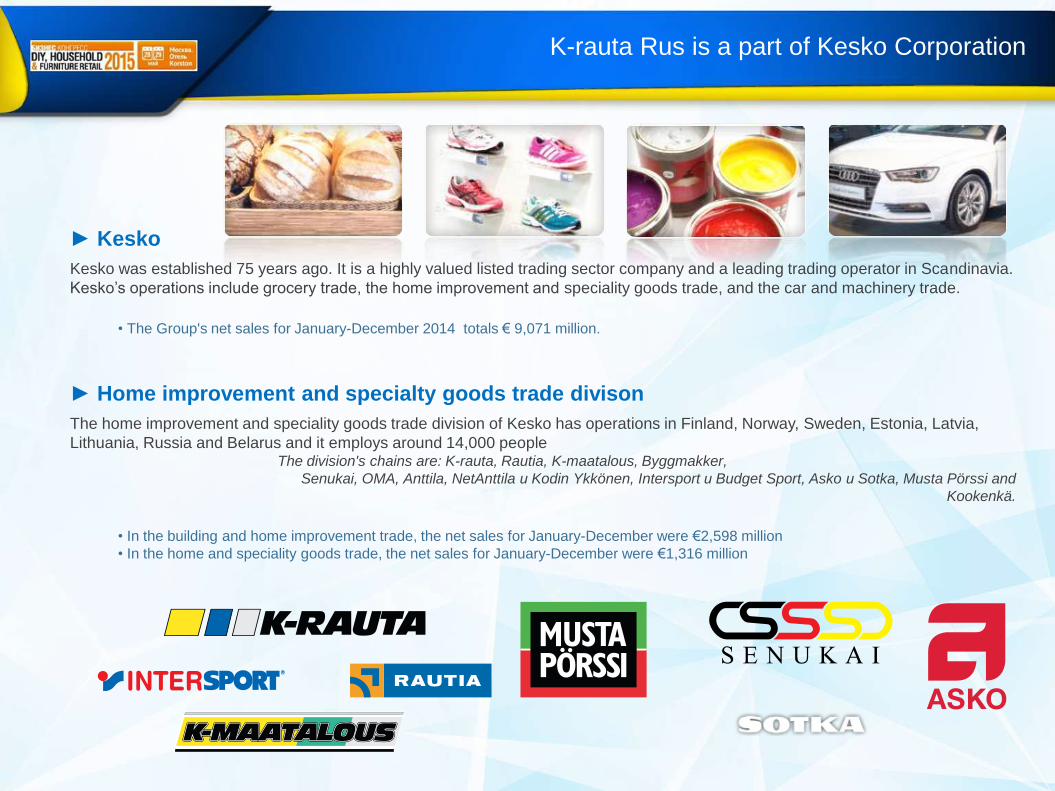
► Kesko
Kesko was established 75 years ago. It is a highly valued listed trading sector company and a leading trading operator in Scandinavia.
Kesko’s operations include grocery trade, the home improvement and speciality goods trade, and the car and machinery trade.
• The Group's net sales for January-December 2014 totals € 9,071 million.
► Home improvement and specialty goods trade divison
The home improvement and speciality goods trade division of Kesko has operations in Finland, Norway, Sweden, Estonia, Latvia,
Lithuania, Russia and Belarus and it employs around 14,000 peopleThe division's chains are: K-rauta, Rautia, K-maatalous, Byggmakker,
Senukai, OMA, Anttila, NetAnttila и Kodin Ykkönen, Intersport и Budget Sport, Asko и Sotka, Musta Pörssi and
Kookenkä.
• In the building and home improvement trade, the net sales for January-December were €2,598 million
• In the home and speciality goods trade, the net sales for January-December were €1,316 million
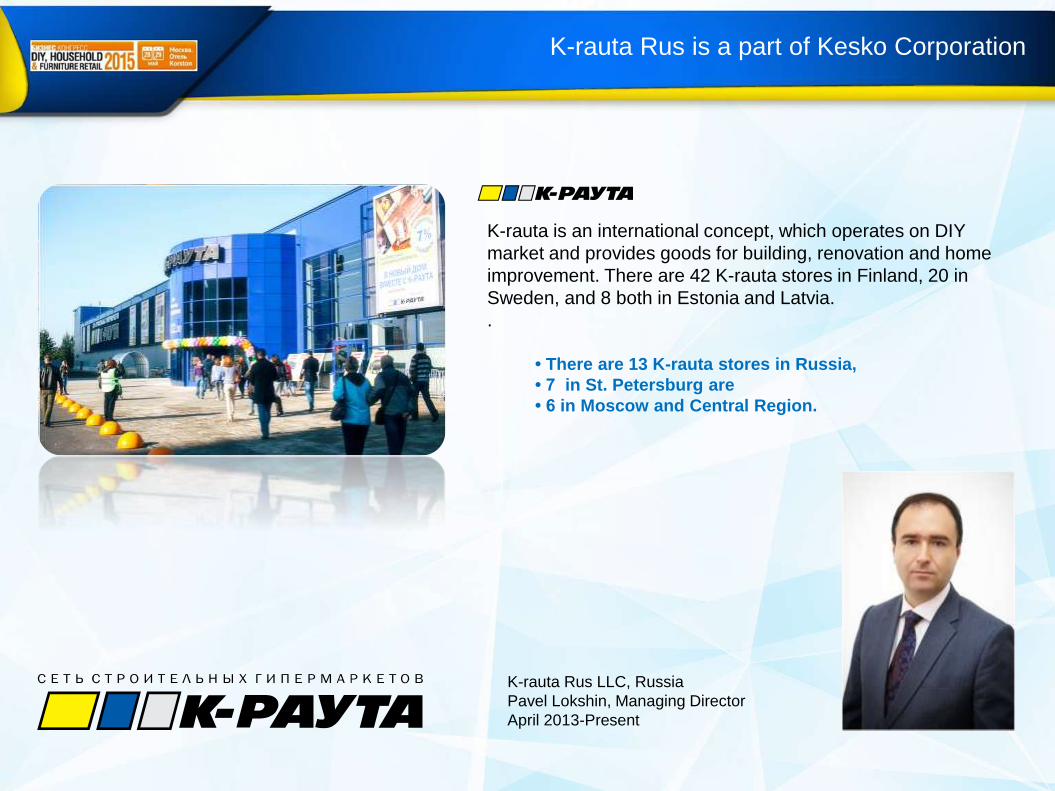
K-rauta Rus is a part of Kesko Corporation
K-rauta Rus is a part of Kesko Corporation
K-rauta is an international concept, which operates on DIY
market and provides goods for building, renovation and home
improvement. There are 42 K-rauta stores in Finland, 20 in
Sweden, and 8 both in Estonia and Latvia.
.
• There are 13 K-rauta stores in Russia,
• 7 in St. Petersburg are
• 6 in Moscow and Central Region.
K-rauta Rus LLC, Russia
Pavel Lokshin, Managing Director
April 2013-Present
NEW FIGURES AND NUMBERSHOW TO INTERPRETE?
CUSTOMER BEHAVIOR MODEL
Can you forecast customer’s demand
in a month, a quarter , a year?
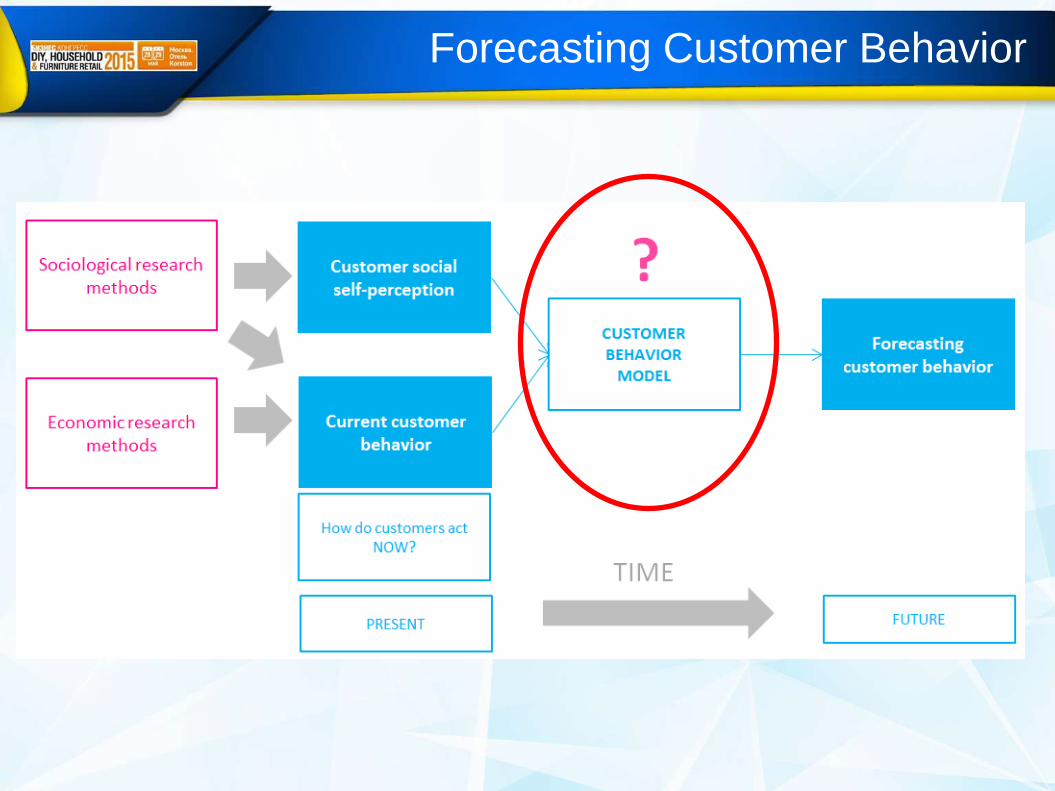
Forecasting Customer Behavior
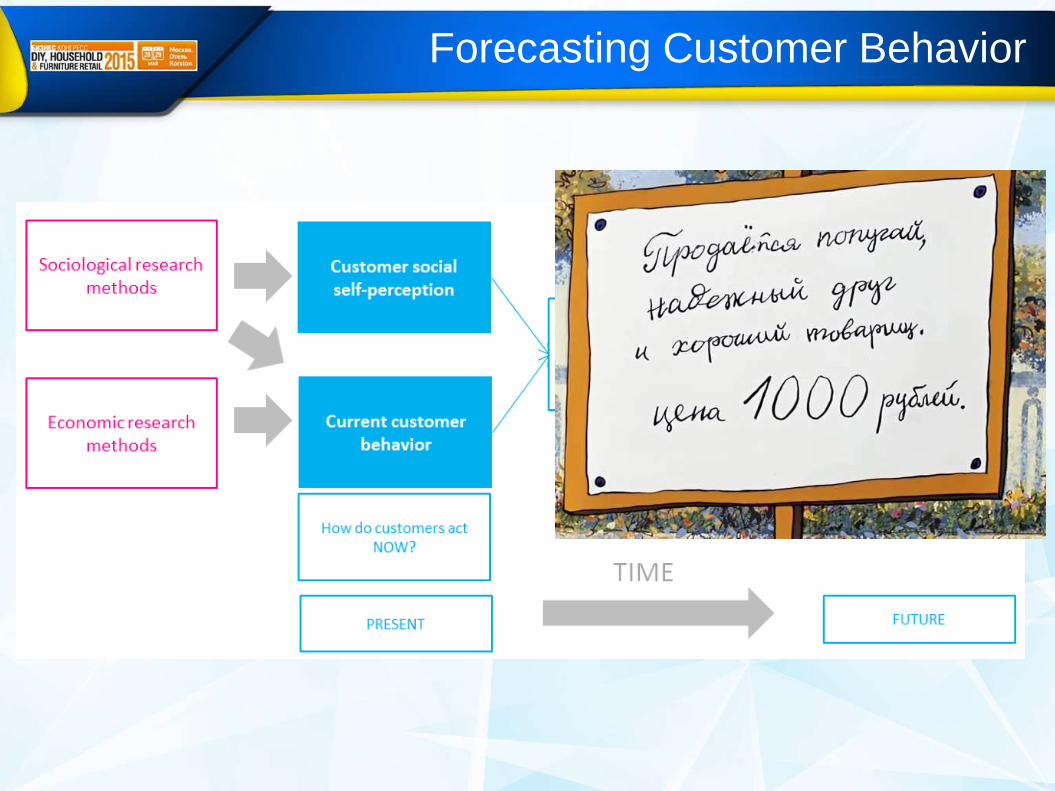
Forecasting Customer Behavior
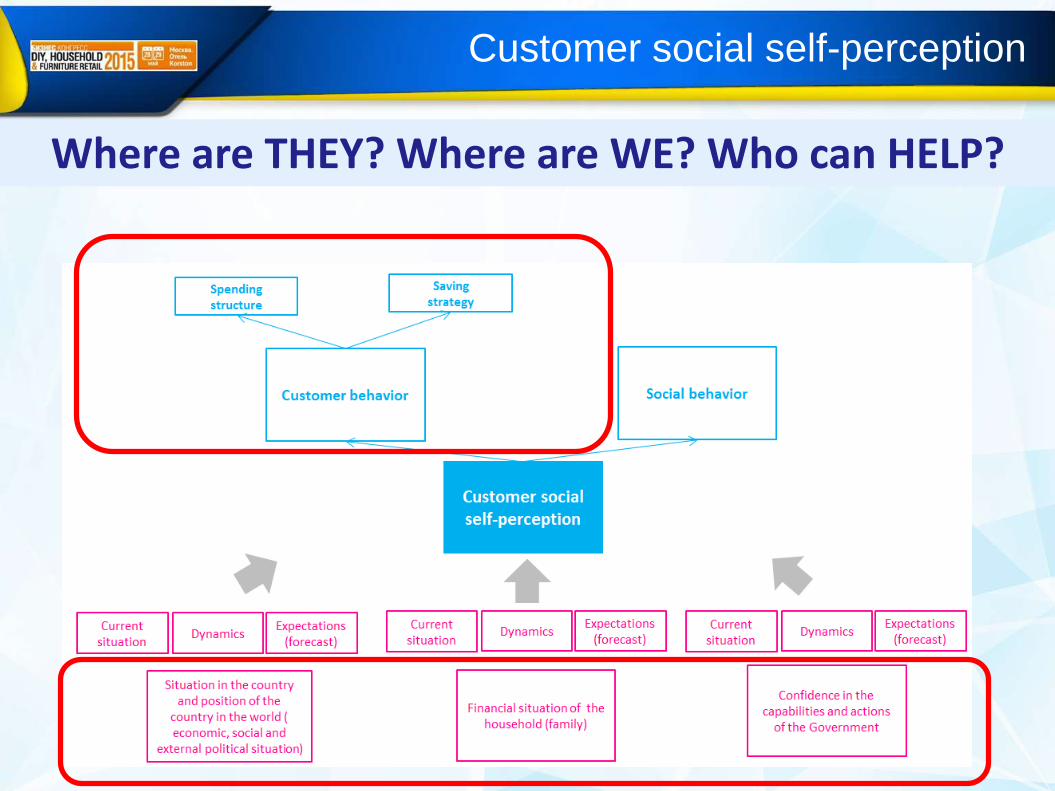
Customer social self-perception
Where are THEY? Where are WE? Who can HELP?
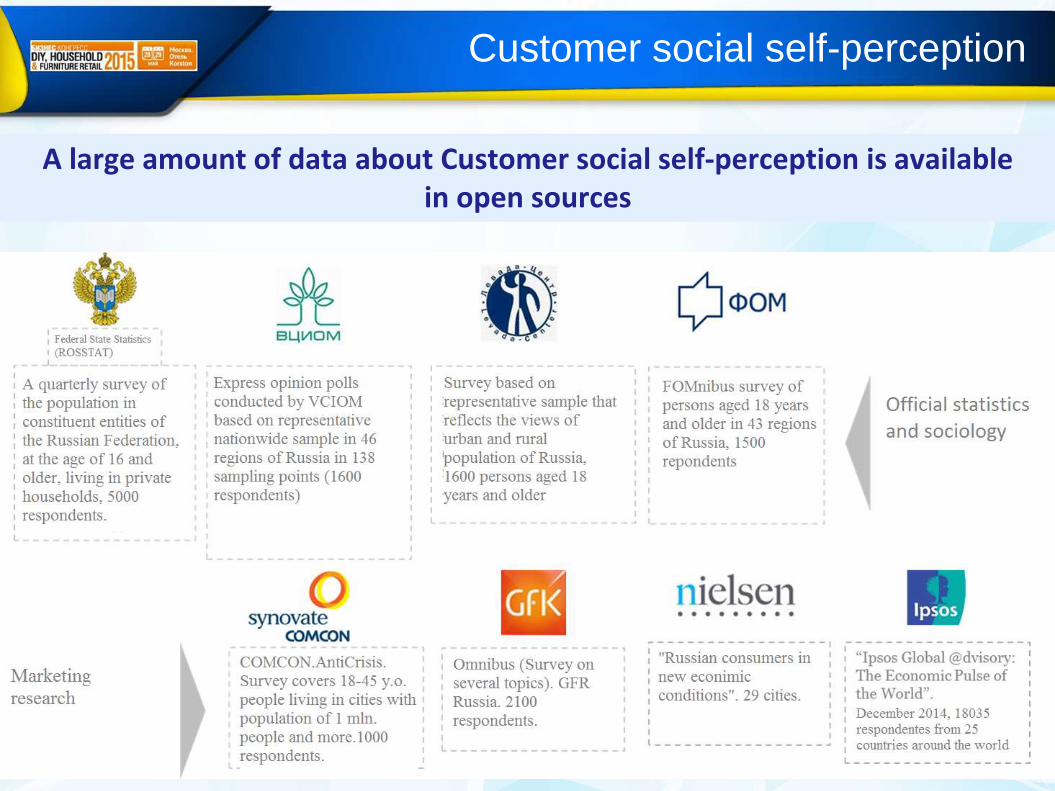
Customer social self-perception
A large amount of data about Customer social self-perception is available in open sources
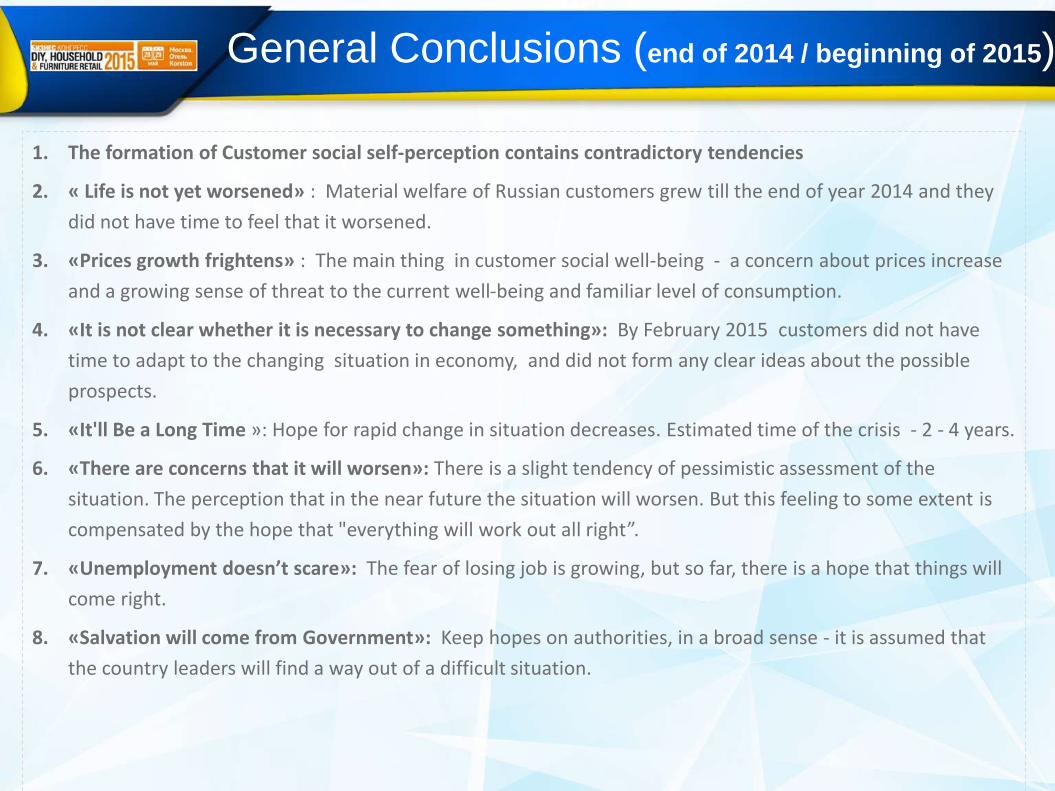
General Conclusions (end of 2014 / beginning of 2015)
1. The formation of Customer social self-perception contains contradictory tendencies
2. « Life is not yet worsened» : Material welfare of Russian customers grew till the end of year 2014 and they
did not have time to feel that it worsened.
3. «Prices growth frightens» : The main thing in customer social well-being - a concern about prices increase
and a growing sense of threat to the current well-being and familiar level of consumption.
4. «It is not clear whether it is necessary to change something»: By February 2015 customers did not have
time to adapt to the changing situation in economy, and did not form any clear ideas about the possible
prospects.
5. «It'll Be a Long Time »: Hope for rapid change in situation decreases. Estimated time of the crisis - 2 - 4 years.
6. «There are concerns that it will worsen»: There is a slight tendency of pessimistic assessment of the
situation. The perception that in the near future the situation will worsen. But this feeling to some extent is
compensated by the hope that "everything will work out all right”.
7. «Unemployment doesn’t scare»: The fear of losing job is growing, but so far, there is a hope that things will
come right.
8. «Salvation will come from Government»: Keep hopes on authorities, in a broad sense - it is assumed that
the country leaders will find a way out of a difficult situation.
Customer main objectives
Only every 10th family wants to live better than "abroad" and every second - better than
"neighbor"
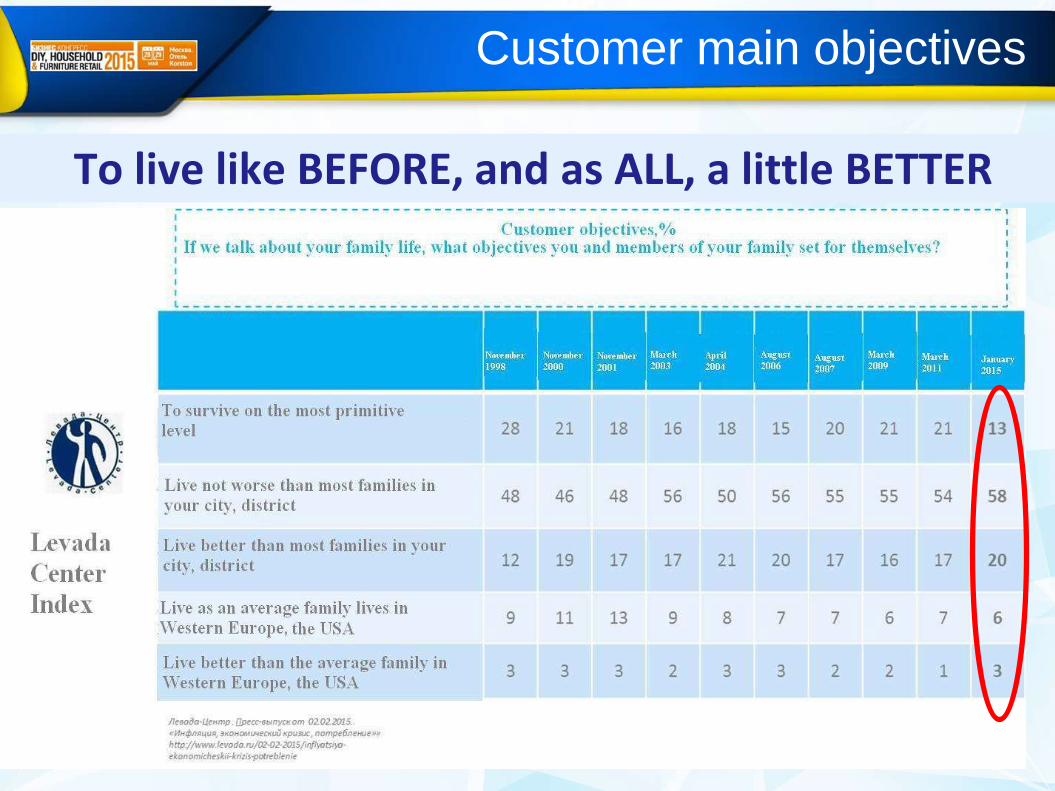
Customer main objectives
To live like BEFORE, and as ALL, a little BETTER
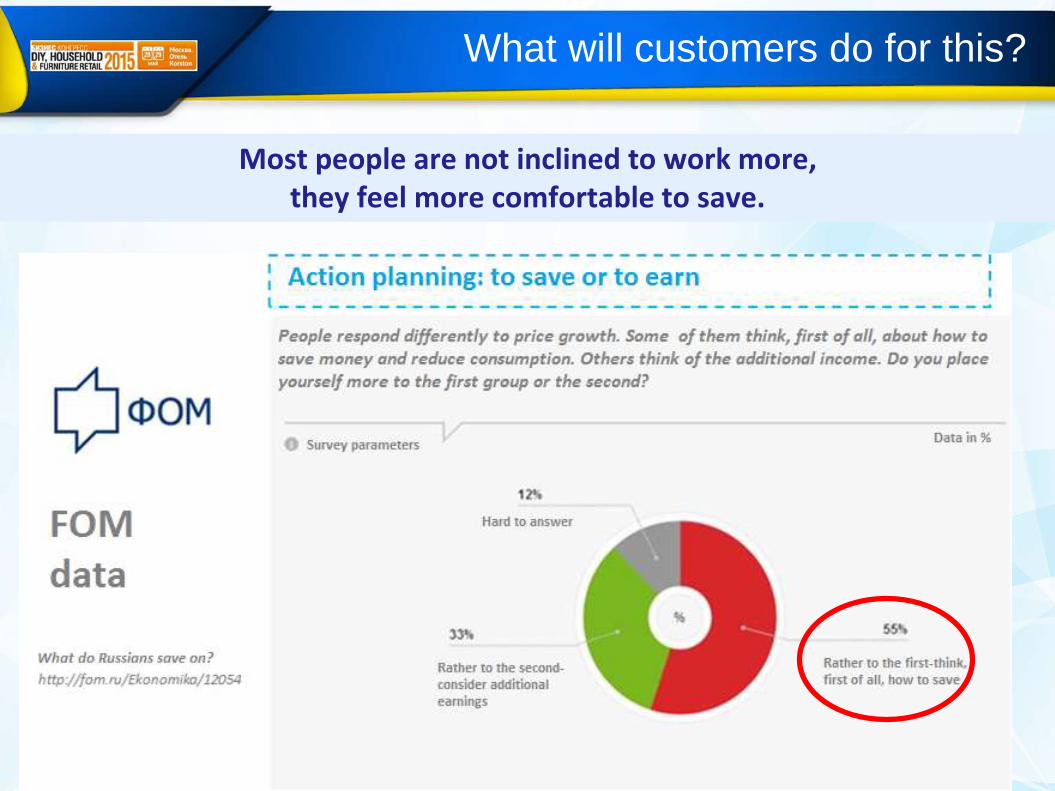
What will customers do for this?
Most people are not inclined to work more, they feel more comfortable to save.
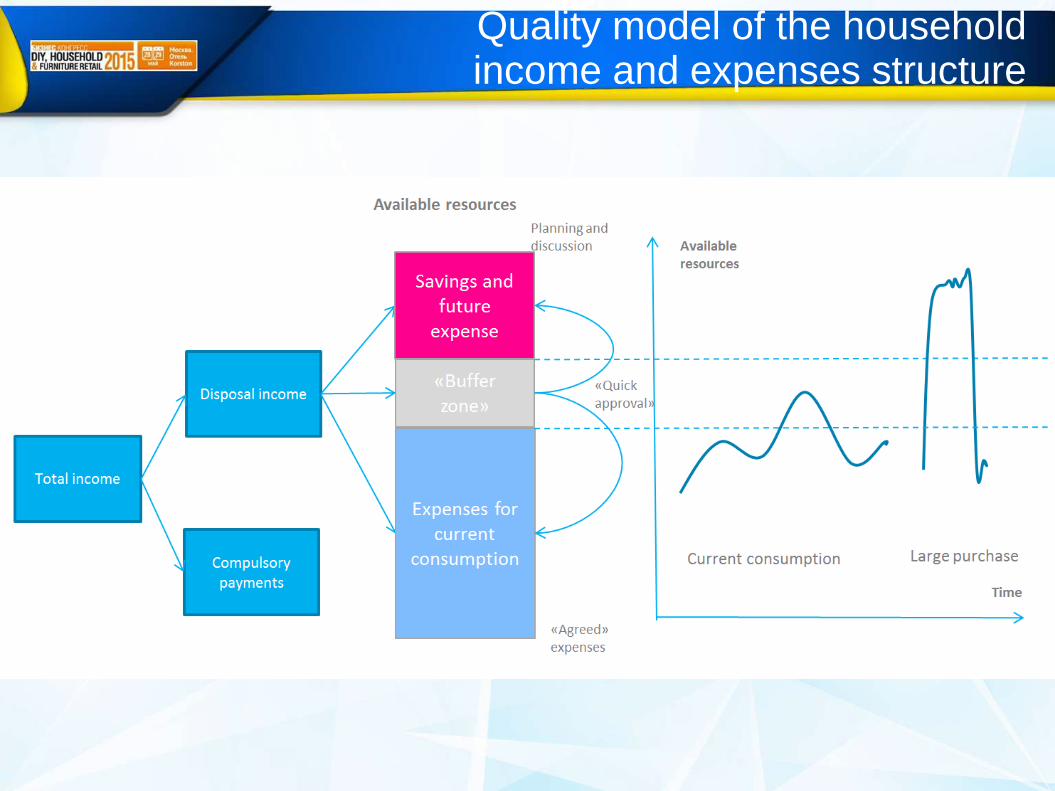
Quality model of the household income and expenses structure
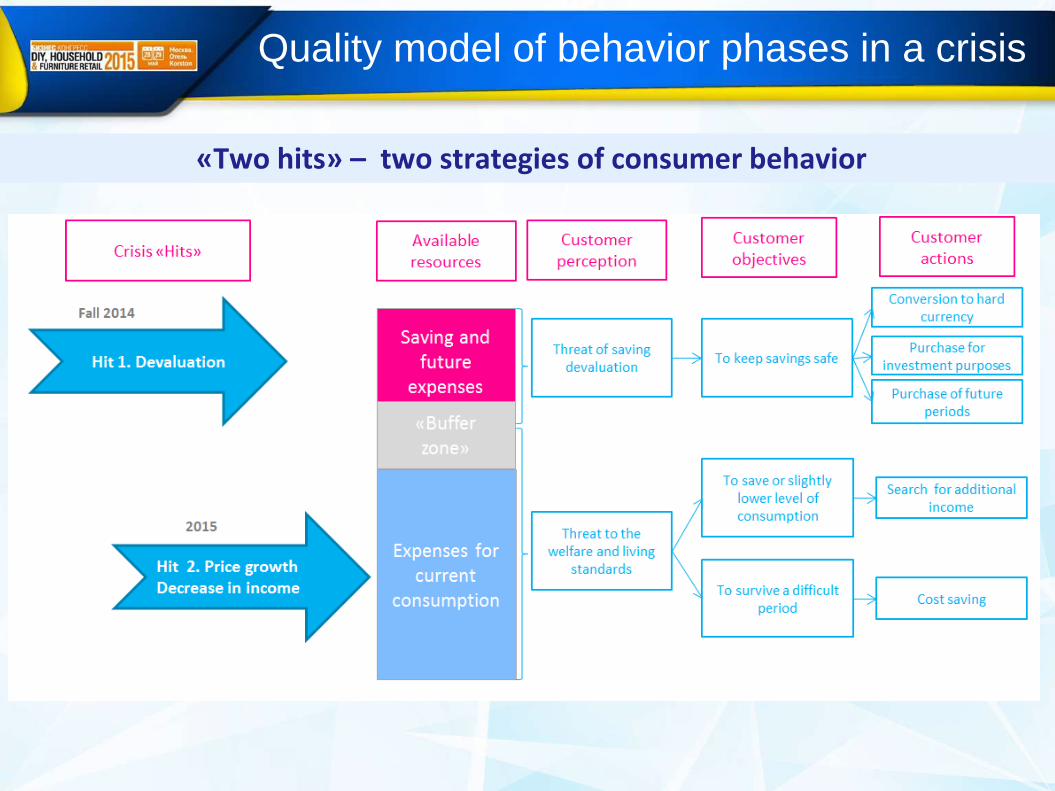
Quality model of behavior phases in a crisis
«Two hits» – two strategies of consumer behavior
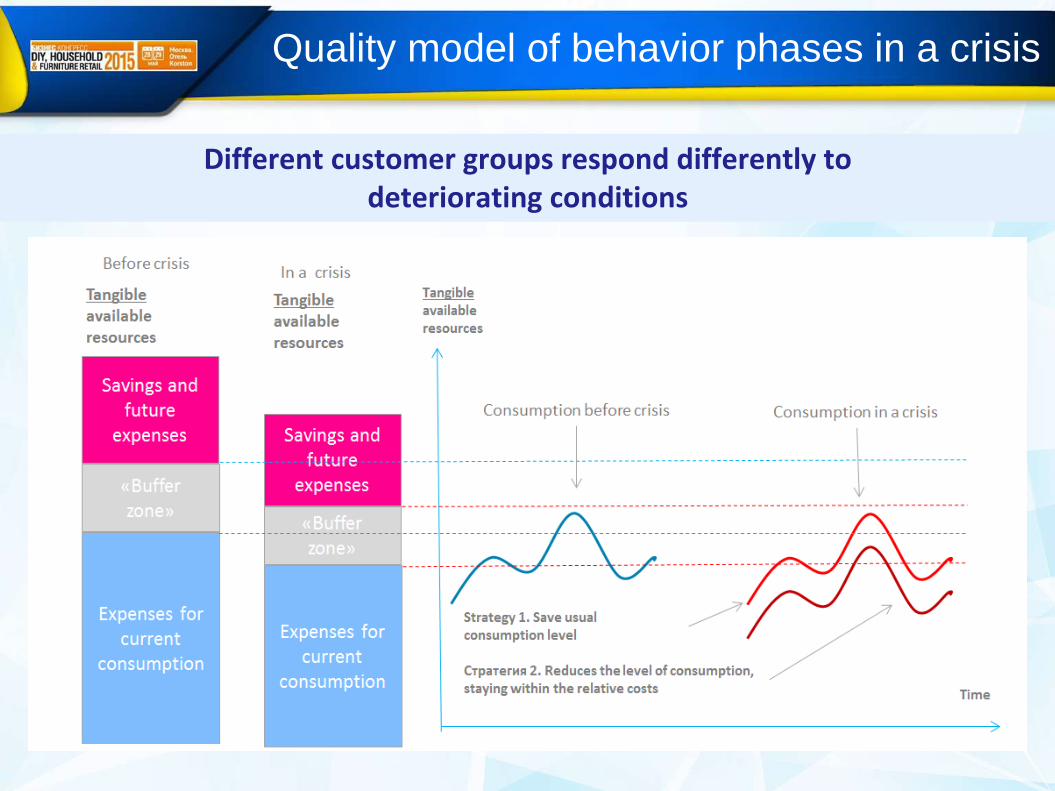
Quality model of behavior phases in a crisis
Different customer groups respond differently to deteriorating conditions
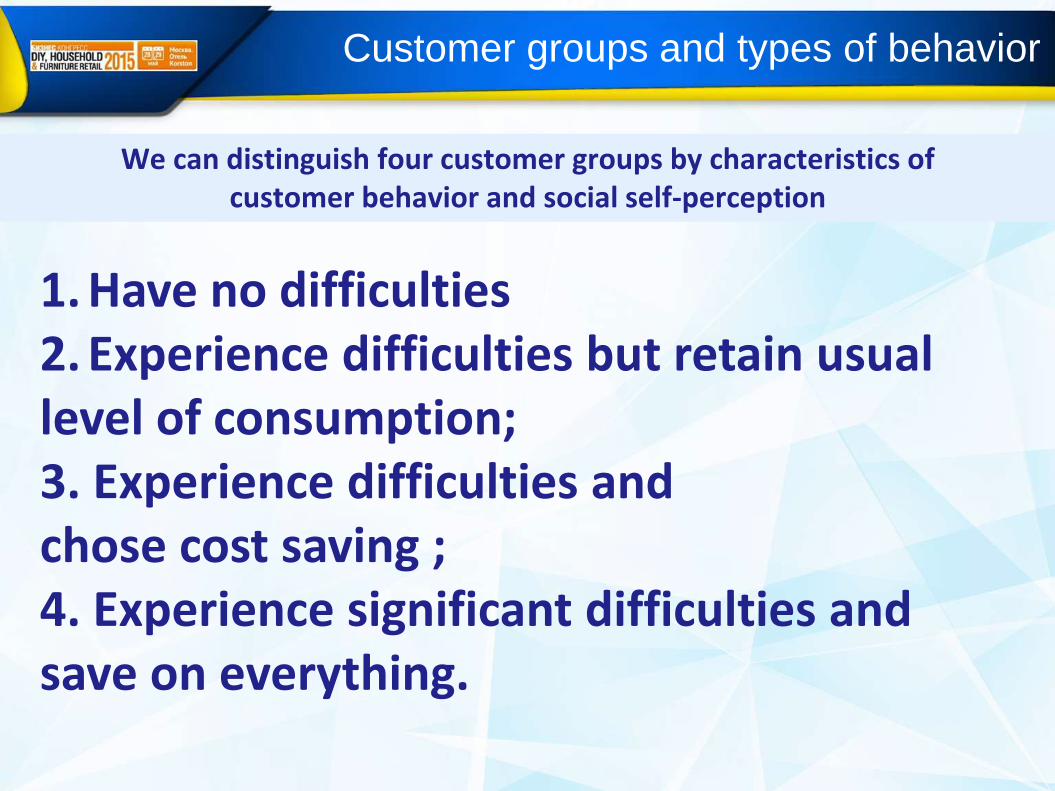
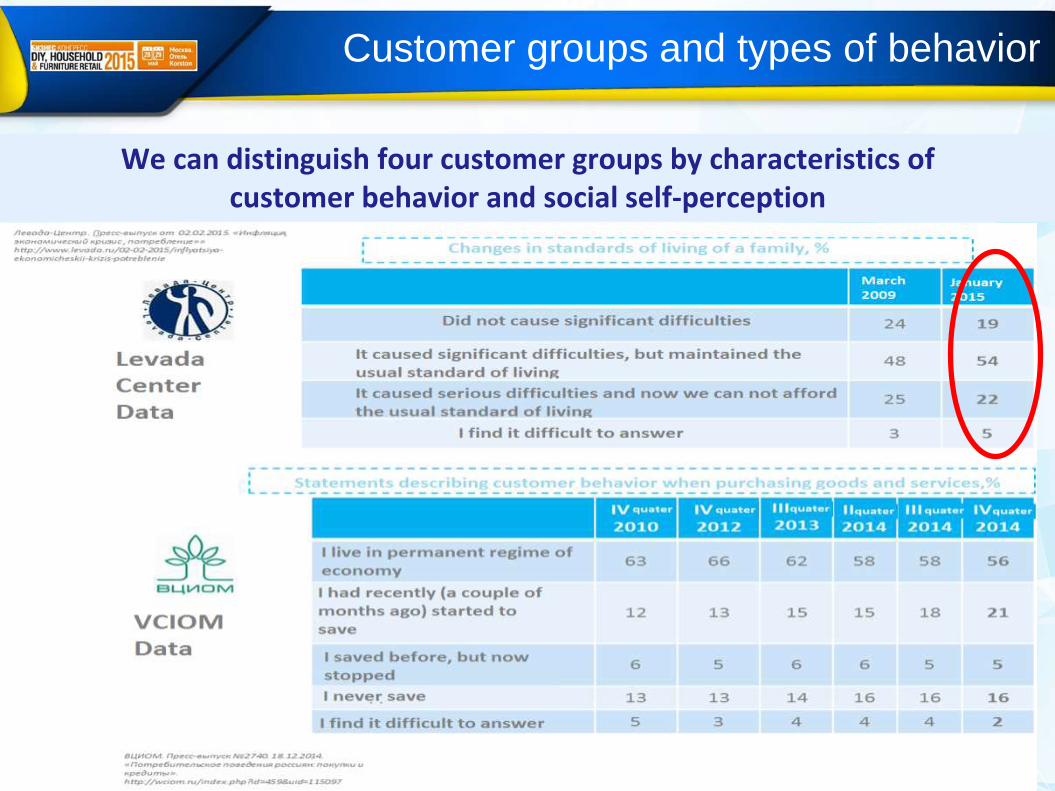
Customer groups and types of behavior
We can distinguish four customer groups by characteristics of customer behavior and social self-perception
1. Have no difficulties2. Experience difficulties but retain usual level of consumption;3. Experience difficulties and chose cost saving ;4. Experience significant difficulties and save on everything.
Customer groups and types of behavior
We can distinguish four customer groups by characteristics of customer behavior and social self-perception
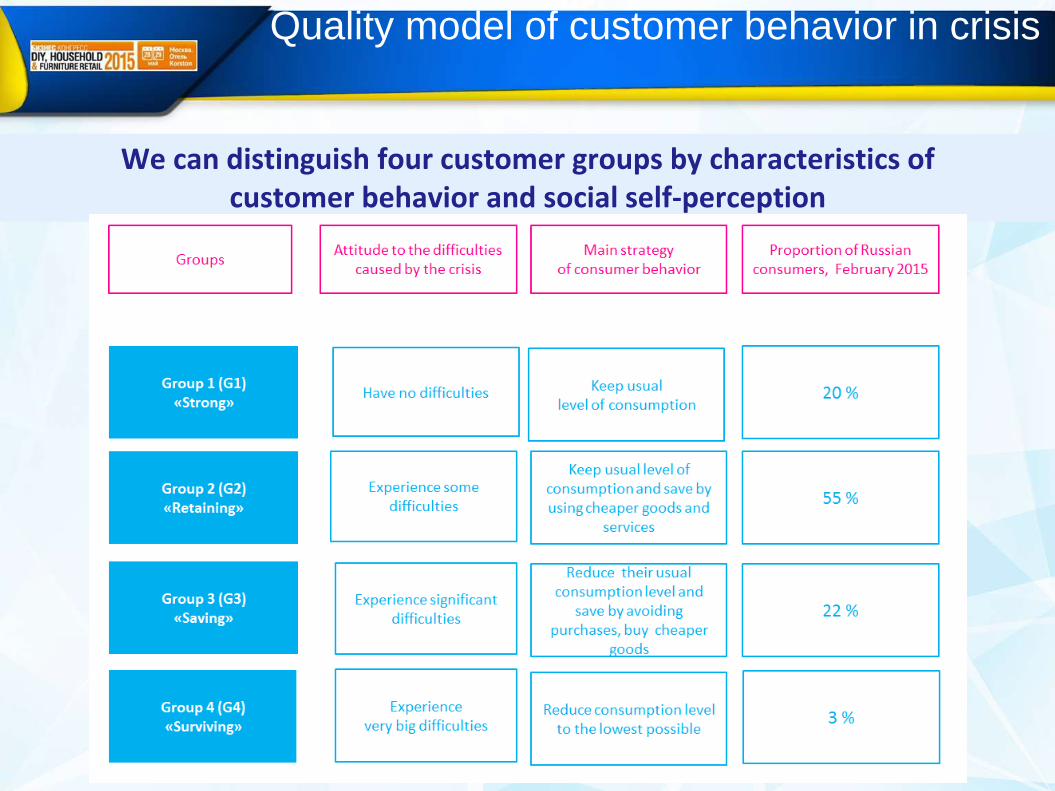
Quality model of customer behavior in crisis
We can distinguish four customer groups by characteristics of customer behavior and social self-perception
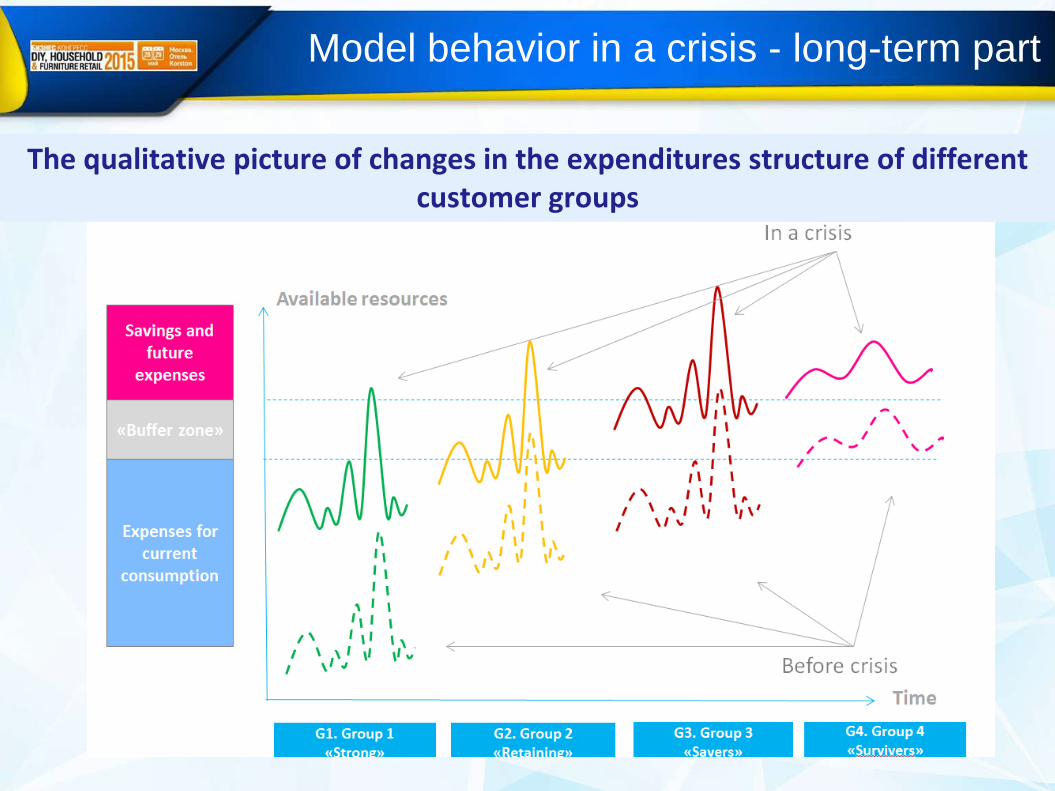
Model behavior in a crisis - long-term part
The qualitative picture of changes in the expenditures structure of different customer groups
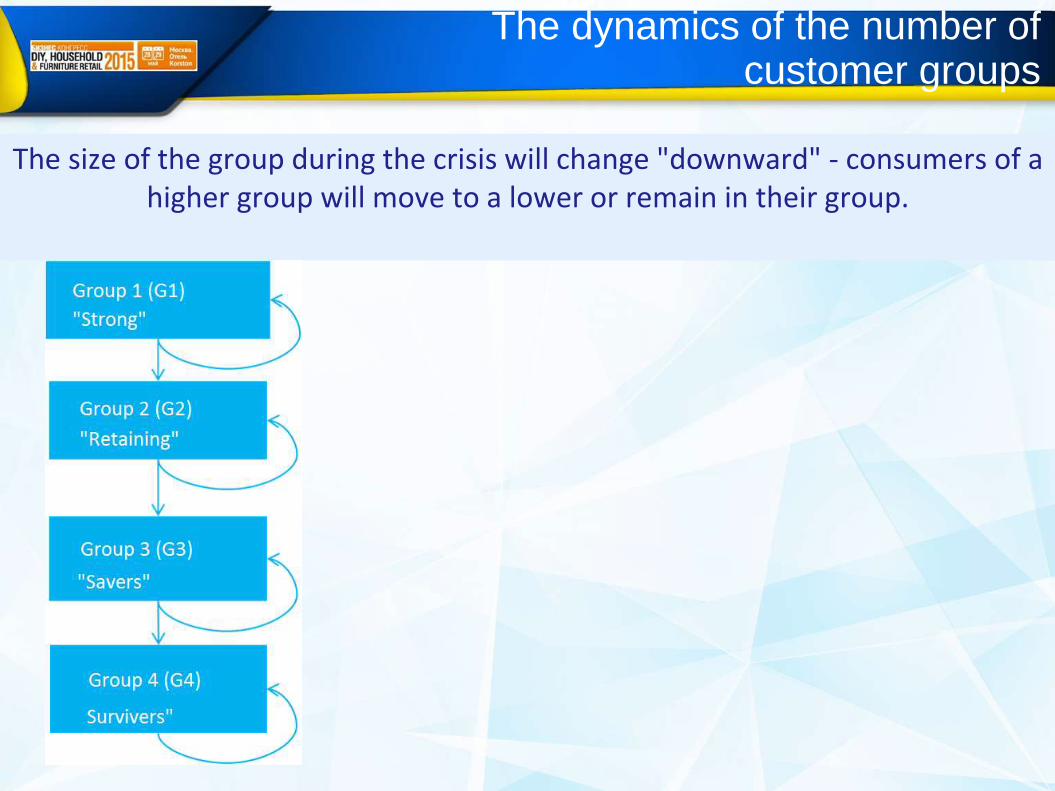
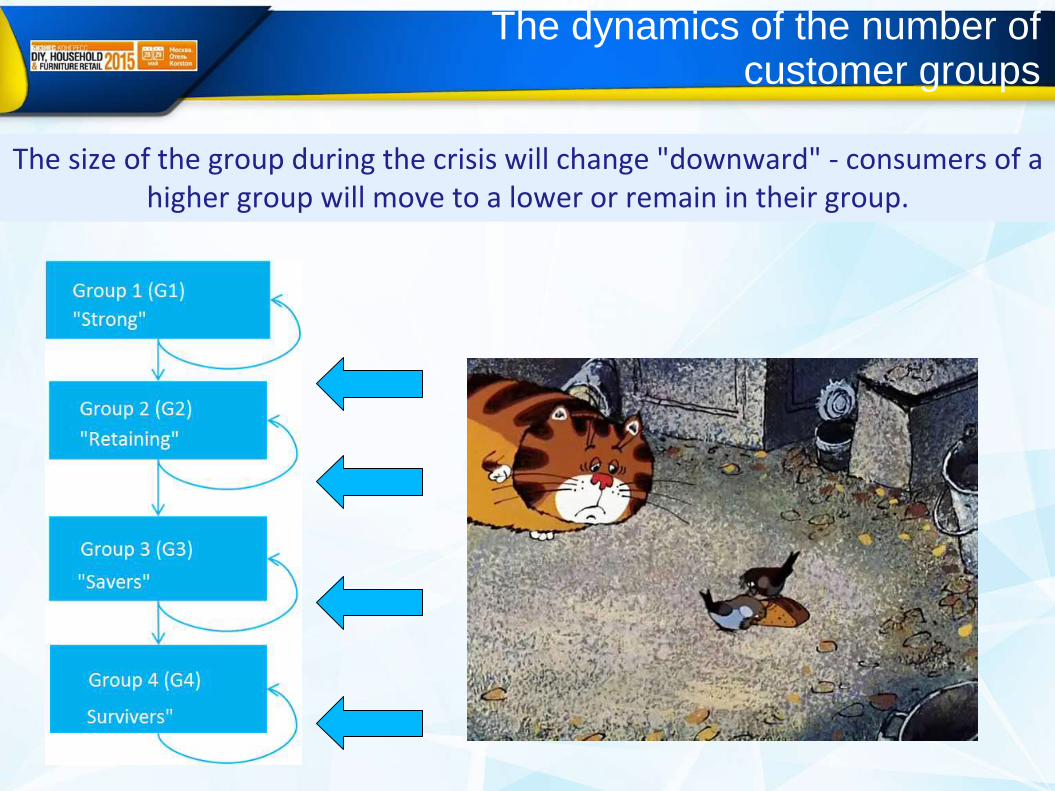
The dynamics of the number of customer groups
The size of the group during the crisis will change "downward" - consumers of a higher group will move to a lower or remain in their group.
The dynamics of the number of customer groups
The size of the group during the crisis will change "downward" - consumers of a higher group will move to a lower or remain in their group.
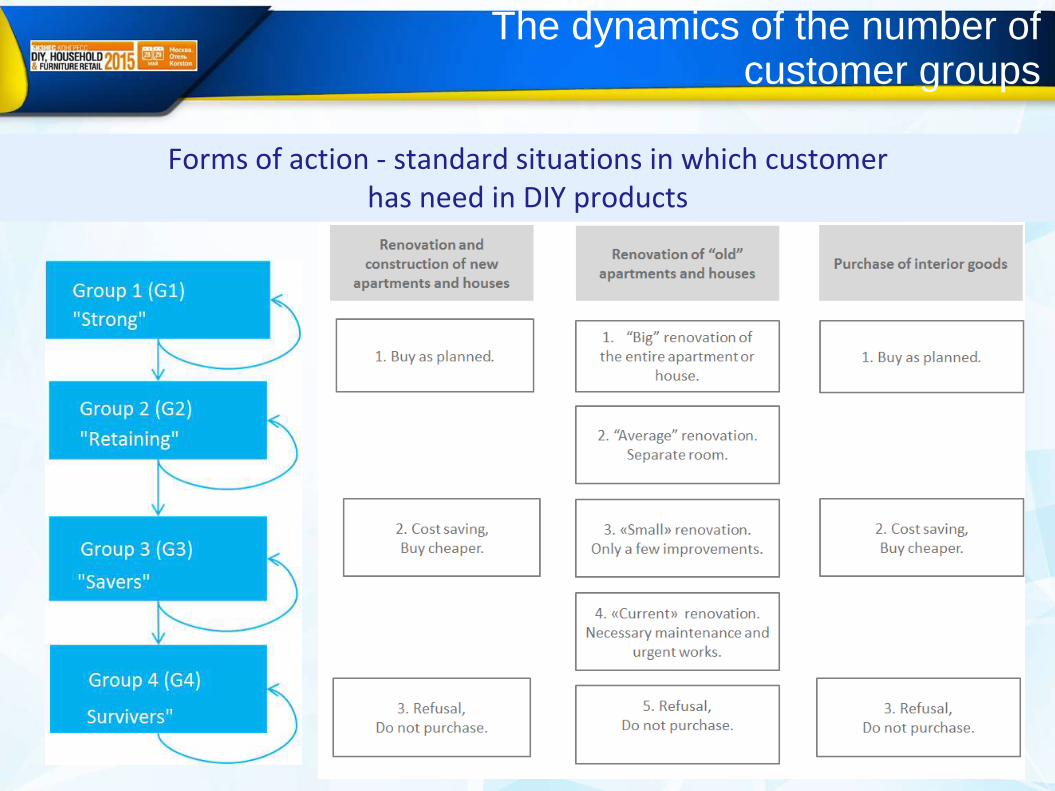
The dynamics of the number of customer groups
Forms of action - standard situations in which customer has need in DIY products
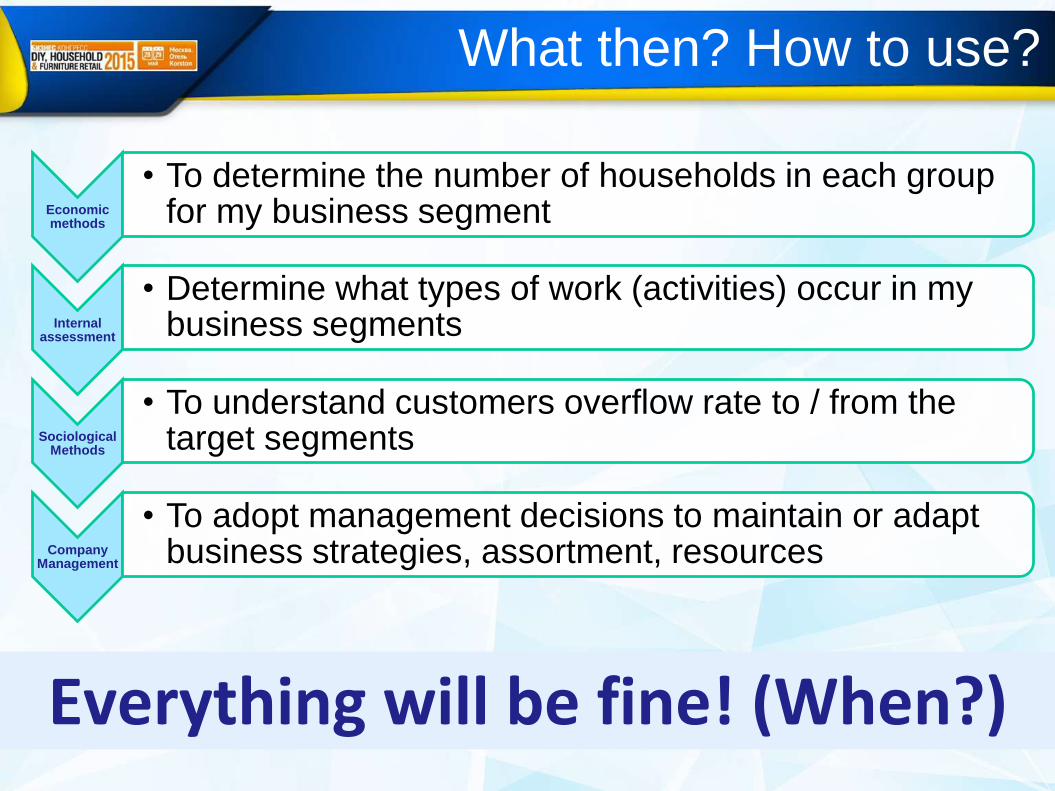
What then? How to use?
Everything will be fine! (When?)
Economic methods
• To determine the number of households in each group for my business segment
Internal assessment
• Determine what types of work (activities) occur in my business segments
Sociological Methods
• To understand customers overflow rate to / from the target segments
Company Management
• To adopt management decisions to maintain or adapt business strategies, assortment, resources
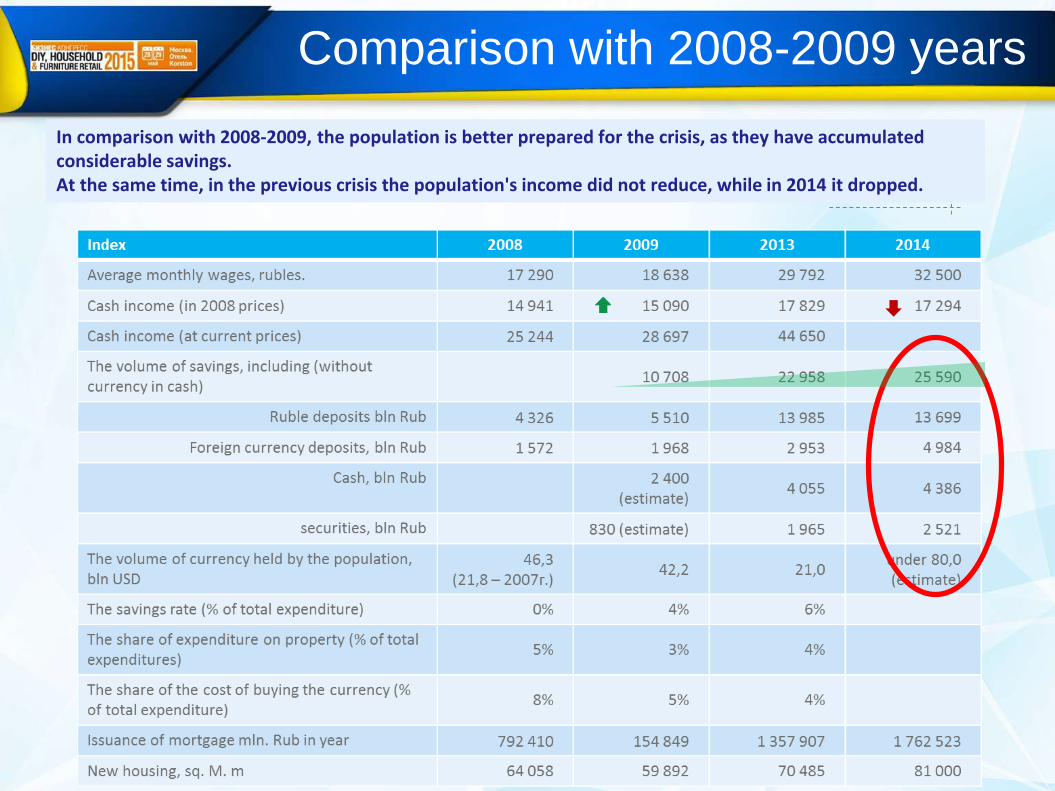
Comparison with 2008-2009 years
In comparison with 2008-2009, the population is better prepared for the crisis, as they have accumulated considerable savings.At the same time, in the previous crisis the population's income did not reduce, while in 2014 it dropped.
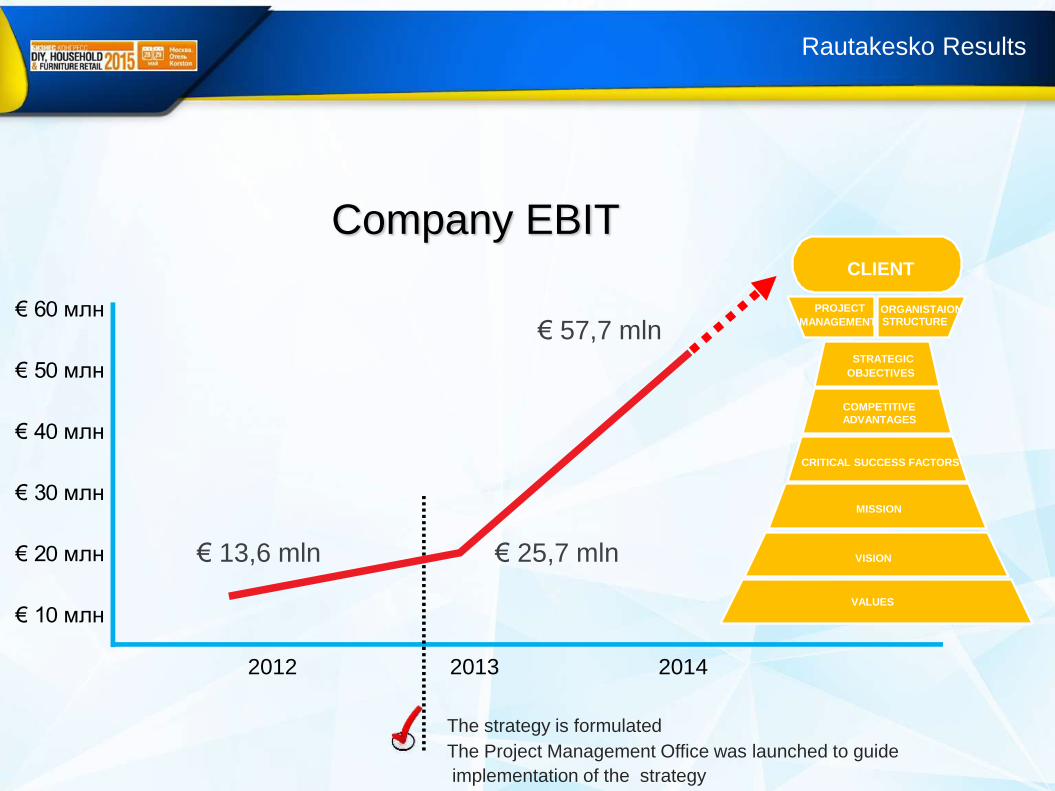
€ 60 млн
€ 50 млн
€ 40 млн
€ 30 млн
€ 20 млн
€ 10 млн
2012 2013 2014
Rautakesko Results
Company EBIT
€ 13,6 mln € 25,7 mln
€ 57,7 mln
The strategy is formulated
The Project Management Office was launched to guide
implementation of the strategy
VALUES
VISION
MISSION
COMPETITIVE
ADVANTAGES
STRATEGIC
OBJECTIVES
PROJECT
MANAGEMENT
ORGANISTAIONSTRUCTURE
CLIENT
CRITICAL SUCCESS FACTORS
Thank you for your attention!