Embed Size (px)
Citation preview


QUALITY CONTROL
QUALITY CONTROL. QUALITY CONTROL.

Quality management
Quality assurance
Quality control
Three principles of clinical lab

What is Quality?
Quality defined as conformance to the
requirements of users or customers
Total quality management of the clinical lab
Quality planning
Quality lab process
Quality control
Quality assessment
Quality improvement

Quality Control
Quality control
Emphasizes statistical and nonstatistical check procedures
Able to detect the problems early enough to prevent their consequences
Techniques and procedures that monitor performance parameters

Prerequisite for an effective lab service
Promotion of quality control and continuous
improvement of the total testing process, including
preanalytical and postanalytical phases

Test is requested by physician and ordered on the computer. Barcode is generated Specimen is collected
Specimen and order are transported to the lab
The specimen is accessioned in the lab
The specimen is processed
The specimen is analyzed
The results are reviewed and verified & dispatched
Steps in obtaining a laboratory test
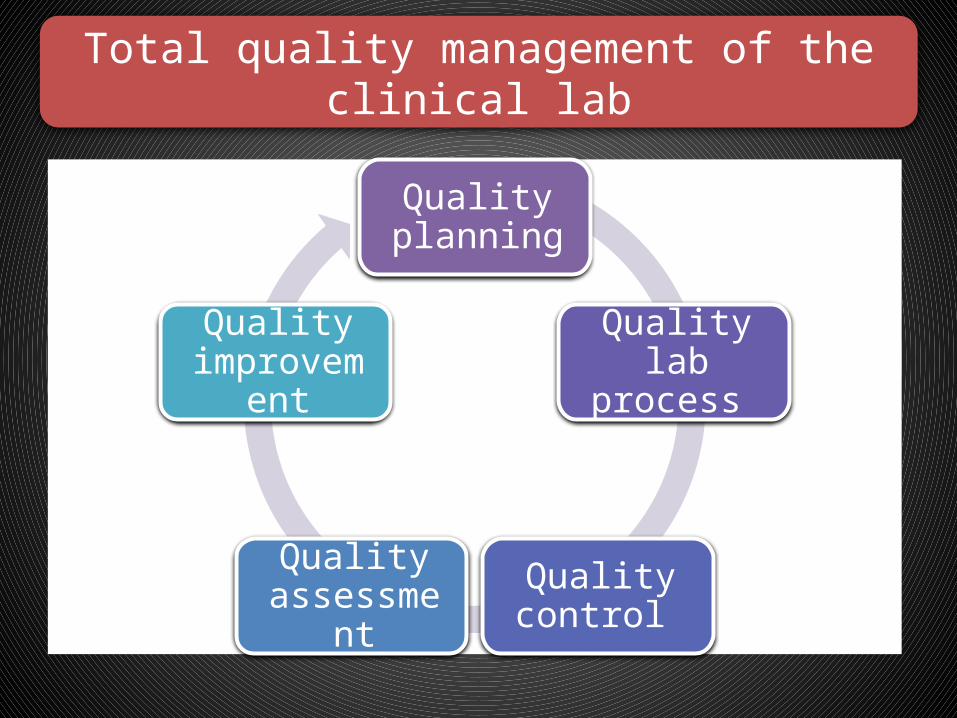
Lab testing processes and their potential errors
Test ordering Specimen acquisition
Analytical measurement Test reporting Test
interpretation

Test ordering
Inappropriate testHandwriting not
legibleWrong patien
t identification
Specimen acquisition
Analytical measurem
entTest
reportingTest
interpretation
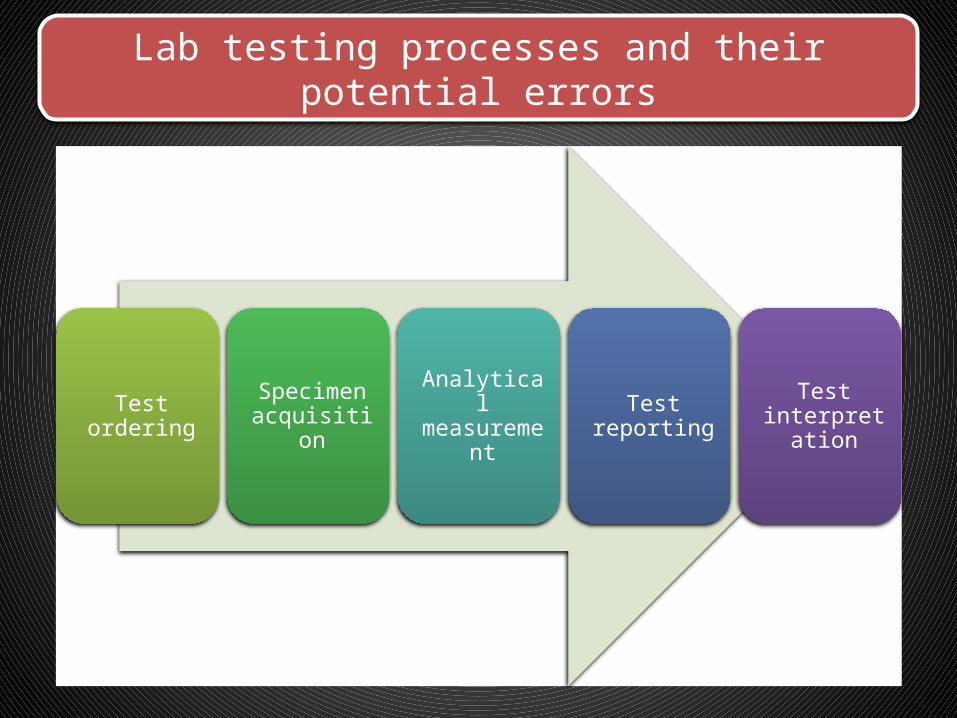
Lab testing processes and their potential errors
Test ordering
Specimen acquisitionIncorrect tube
Incorrect
patient identific
ationInadequ
ate volumeCollecte
d at wrong time
Improper
transport
conditions
Analytical measurem
entTest
reportingTest
interpretation
Lab testing processes and their potential errors

Test ordering
Specimen acquisition
Analytical
measurement
Instrument not calibrat
ed correctl
ySpecimen mix-
upIncorre
ct volume
of specim
enInterferi
ng substan
ce presentInstrum
ent precisio
n proble
m
Test reporting
Test interpretat
ion
Lab testing processes and their potential errors

Test ordering
Specimen acquisition
Analytical measurem
ent
Test report
ingWrong patient identificationReport
not legibleReport delaye
dTranscription error
Test interpretat
ion
Lab testing processes and their potential errors

Test ordering
Specimen acquisition
Analytical measurem
ent
Test reporting
Test interpretationInterferin
g substance
not recognize
dSpecificity
of the test not
understood
Precision limitation
s not recognize
dAnalytical sensitivity
not appropria
tePrevious
values not
available for
comparison
Lab testing processes and their potential errors

Elements of a QA/QC Program
Commitment
Facilities and resources
Technical competenceTechnical procedures
Problem solving mechanisms
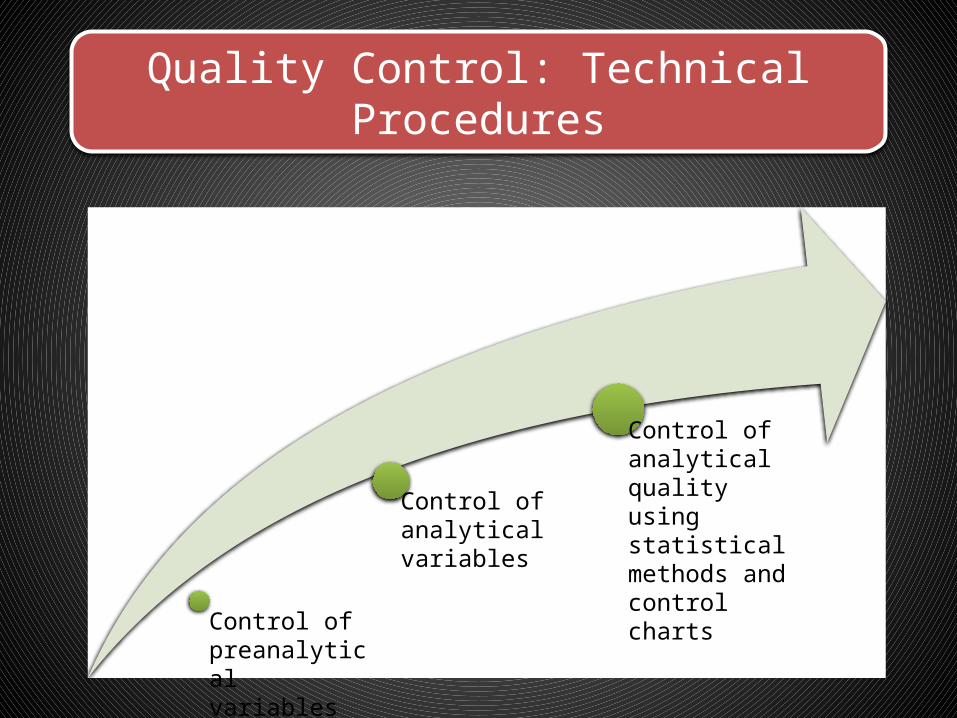
Quality Control: Technical Procedures
Control of preanalytical variables
Control of analytical variables
Control of analytical quality using statistical methods and control charts
Test requests
Patient preparation
Patient identification
Specimen acquisition
Control of preanalytical variables

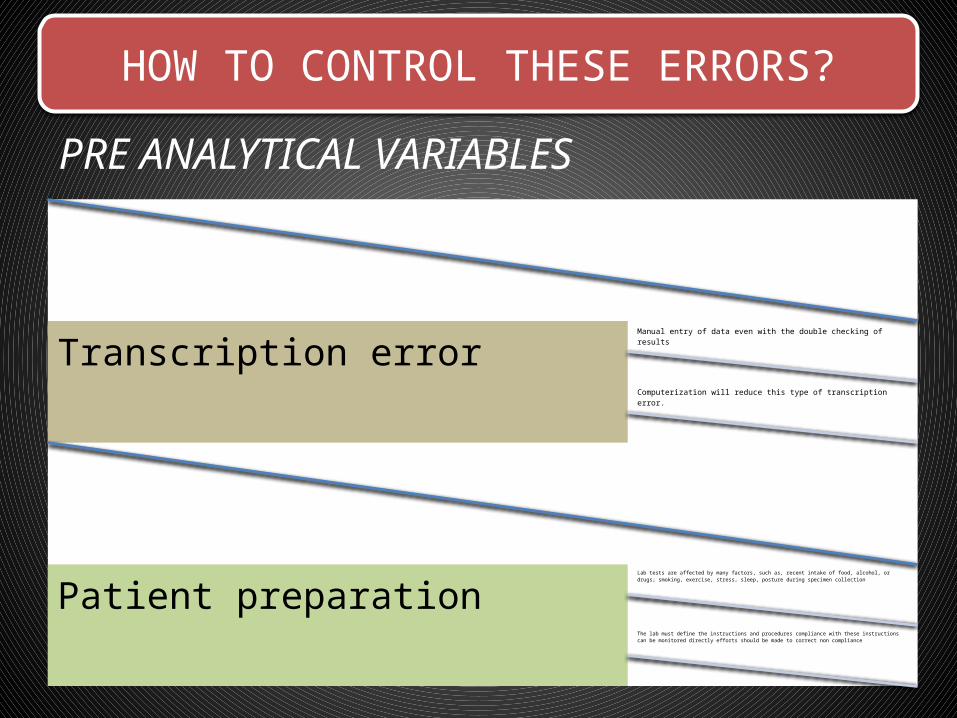
HOW TO CONTROL THESE ERRORS?
Patient Identification The highest frequency of errors occurs with the use of handwritten labels and request forms.
The use of bar code technology has significantly reduced ID problems.
Turnaround timeDelayed and lost test requisitions, specimens and reports can be major problems for labs.
Recording of the actual times of specimen collection, receipt in the lab and reporting of results with use of computers will solve these problems.
PRE ANALYTICAL VARIABLES
HOW TO CONTROL THESE ERRORS?
PRE ANALYTICAL VARIABLES
Transcription error Manual entry of data even with the double checking of results
Computerization will reduce this type of transcription error.
Patient preparation Lab tests are affected by many factors, such as, recent intake of food, alcohol, or drugs; smoking, exercise, stress, sleep, posture during specimen collection
The lab must define the instructions and procedures compliance with these instructions can be monitored directly efforts should be made to correct non compliance

HOW TO CONTROL THESE ERRORS?
PRE ANALYTICAL VARIABLES
Specimen Collection
• Prolonged tourniquet application. • Blood collection from an arm into which an intravenous infusion is running.
Hemolysis during blood collection
• To monitor and control these problems, specially trained lab team assigned to specimen collection
• The identification of the person collecting a specimen should be maintained • Clinicians should be encouraged to report clinically inconsistent results.
Analytical methodology
Standardization
Calibration procedures
Documentation of analytical protocols
Monitoring of critical equipment and materials
Control of analytical variables
HOW TO CONTROL THESE ERRORS?
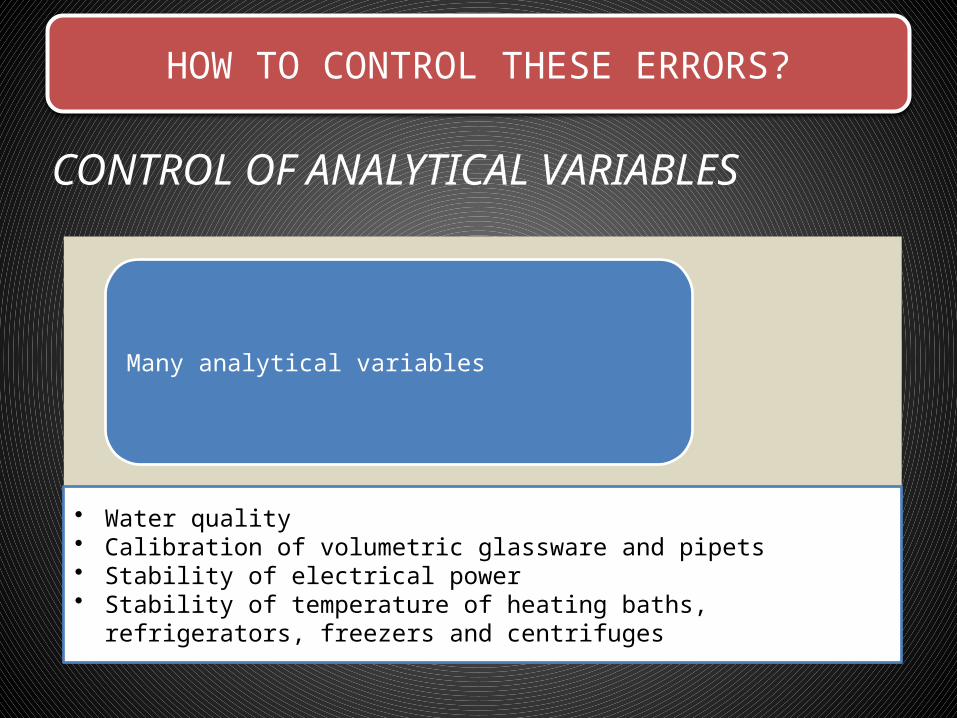
CONTROL OF ANALYTICAL VARIABLES
Many analytical variables
• Water quality• Calibration of volumetric glassware and pipets• Stability of electrical power• Stability of temperature of heating baths, refrigerators, freezers and centrifuges
HOW TO CONTROL THESE ERRORS?
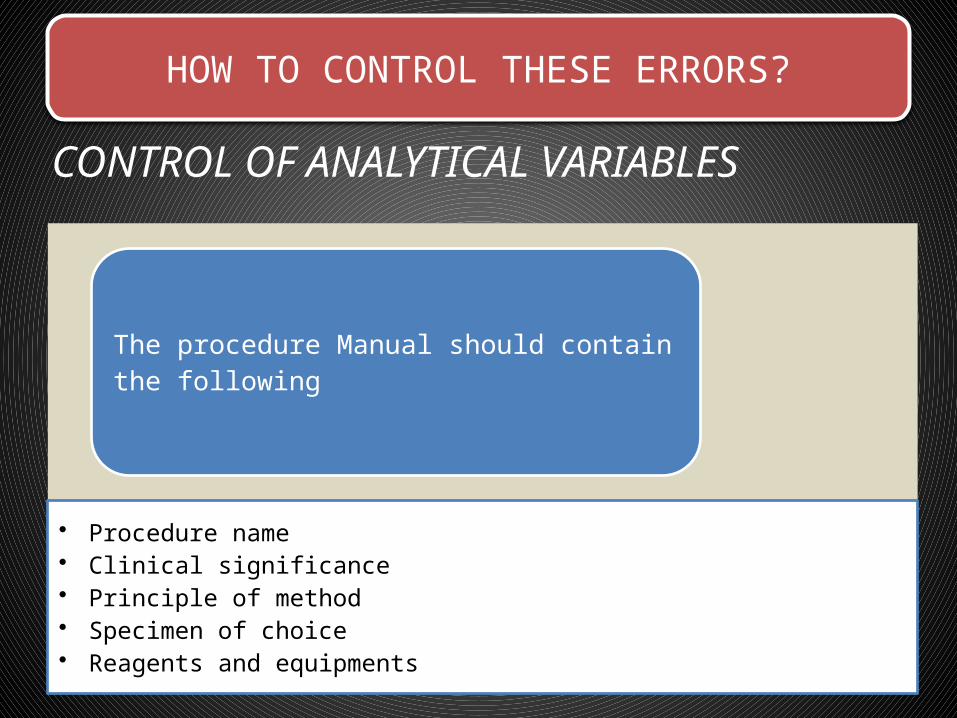
CONTROL OF ANALYTICAL VARIABLES
The procedure Manual should contain the following
• Procedure name• Clinical significance• Principle of method• Specimen of choice• Reagents and equipments
HOW TO CONTROL THESE ERRORS?
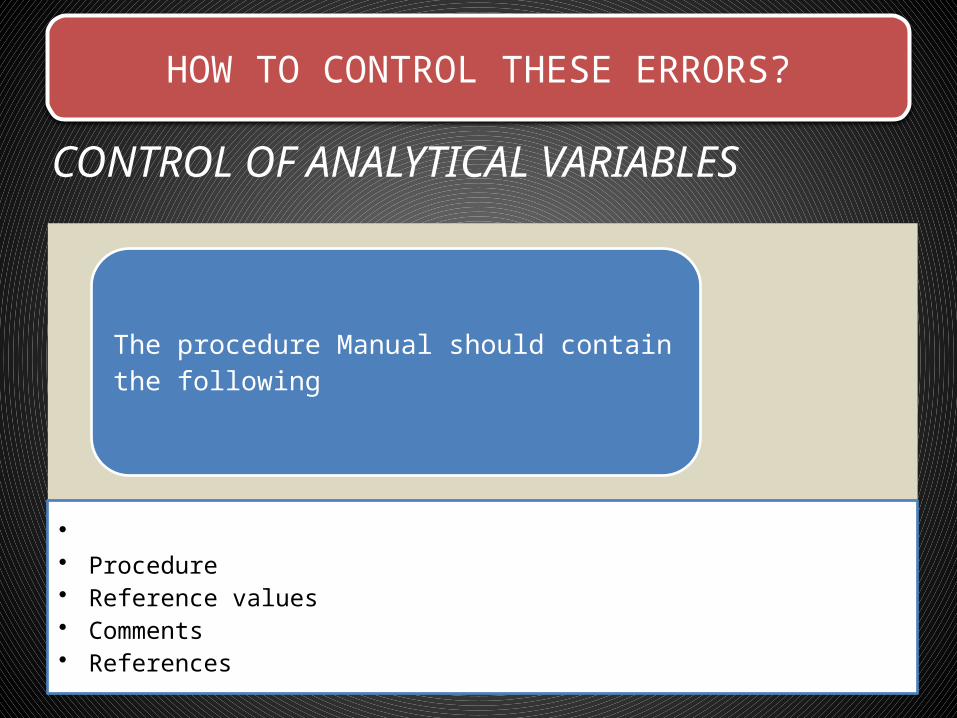
CONTROL OF ANALYTICAL VARIABLES
The procedure Manual should contain the following
•• Procedure• Reference values• Comments• References
HOW TO CONTROL THESE ERRORS?
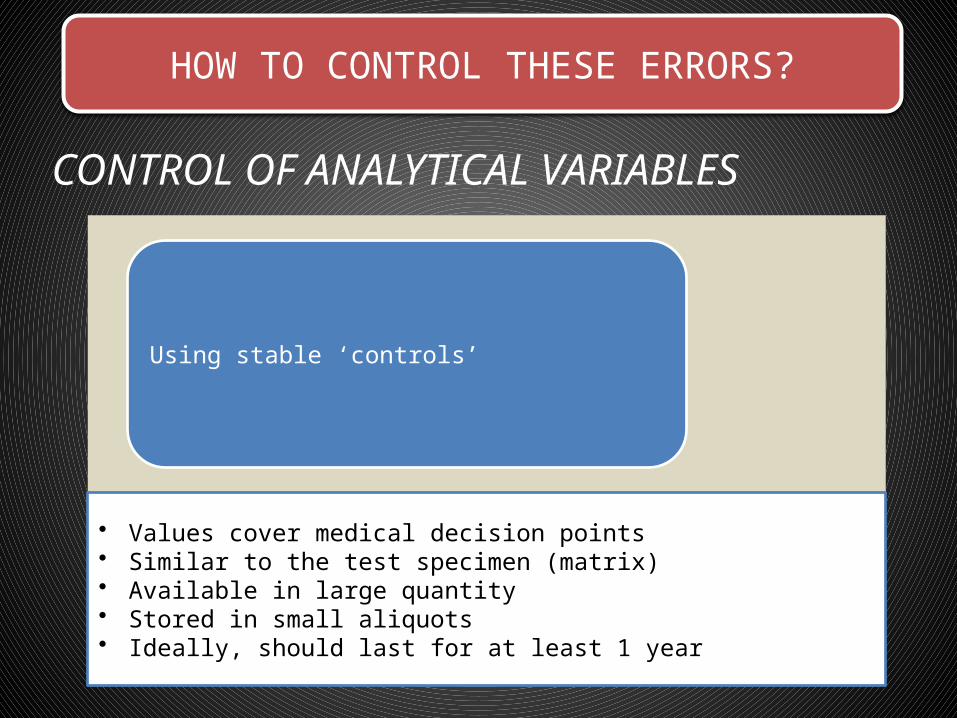
CONTROL OF ANALYTICAL VARIABLES
Using stable ‘controls’
• Values cover medical decision points • Similar to the test specimen (matrix)• Available in large quantity• Stored in small aliquots• Ideally, should last for at least 1 year

QC material- Preparation & Storage
Precautions to be followed
• Reconstitute lyophilized material carefully & strictly as per label direction• Frozen sample to be thawed properly. After attaining room temp., mix slowly
by inversion and then use.• Storage temperature to be strictly followed
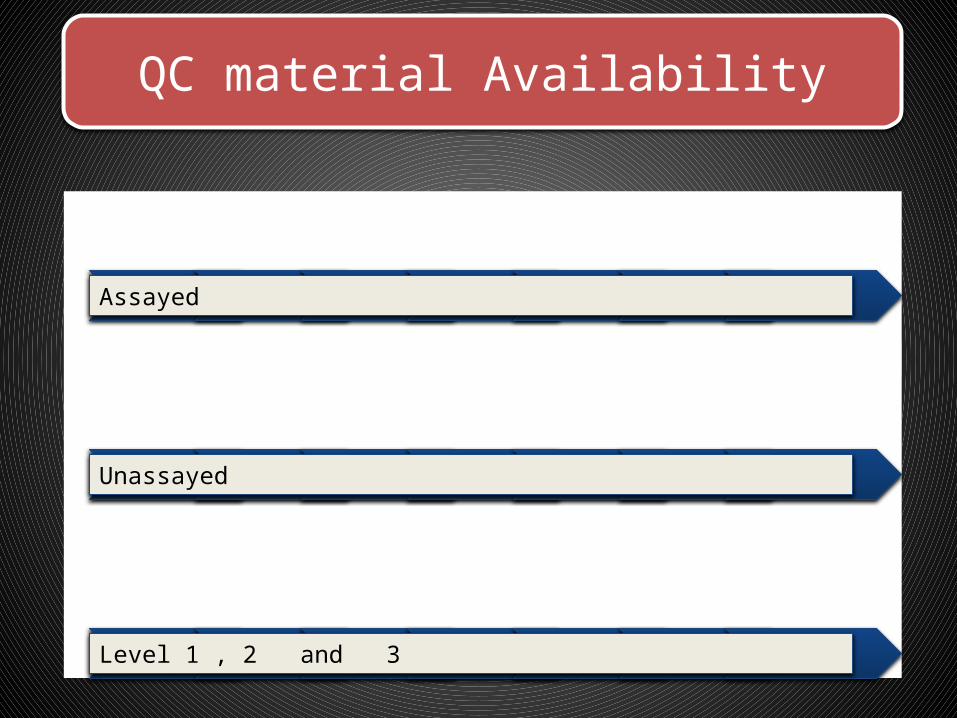
QC material Availability
Assayed
Unassayed
Level 1 , 2 and 3
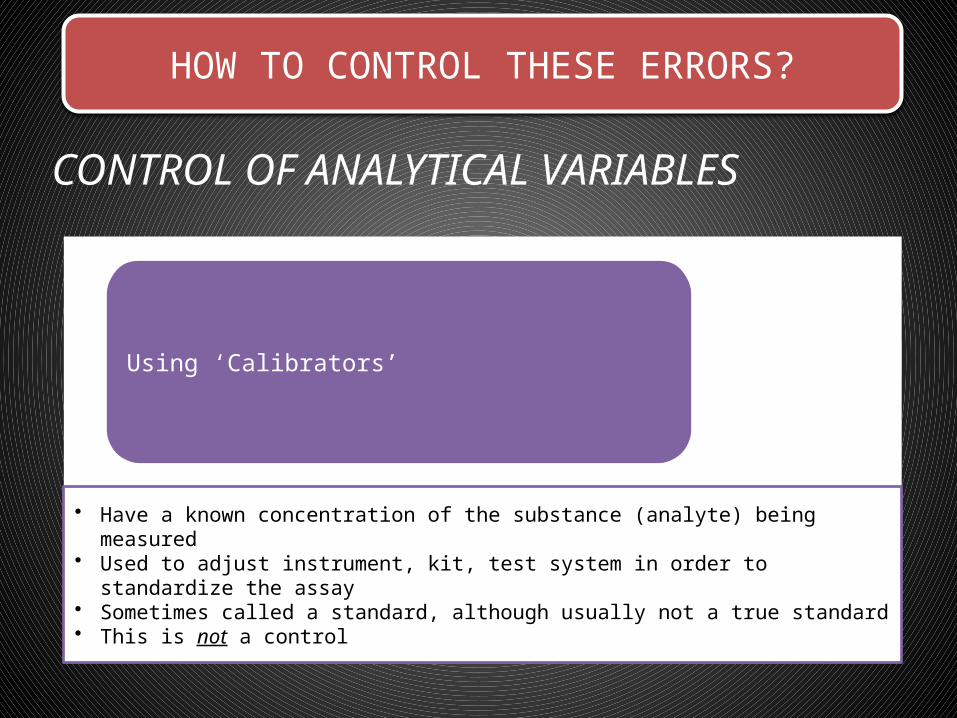
HOW TO CONTROL THESE ERRORS?
CONTROL OF ANALYTICAL VARIABLES
Using ‘Calibrators’
• Have a known concentration of the substance (analyte) being measured • Used to adjust instrument, kit, test system in order to standardize the assay• Sometimes called a standard, although usually not a true standard • This is not a control

Quantitative Aspects of QC
External Q C
Internal Q C

Internal Q C
Day to day internal QC programme
Is a most useful tool
For maintenance of long term Consistency ( Accuracy ) control
Long term Precision control of analytical method
Internal Q C monitors a single lab

External Q C
Provides independent validation of internal QC program
Gives valid estimation of long term accuracy of analytical system
Compares performance of different labs

Control of analytical quality using statistical methods and control charts
Statistical methods
Mean, SD, CV
Accuracy
Precision
Control charts
Levey-Jennings Control Chart
Westgard multirule chart
Shewhart SD control chart
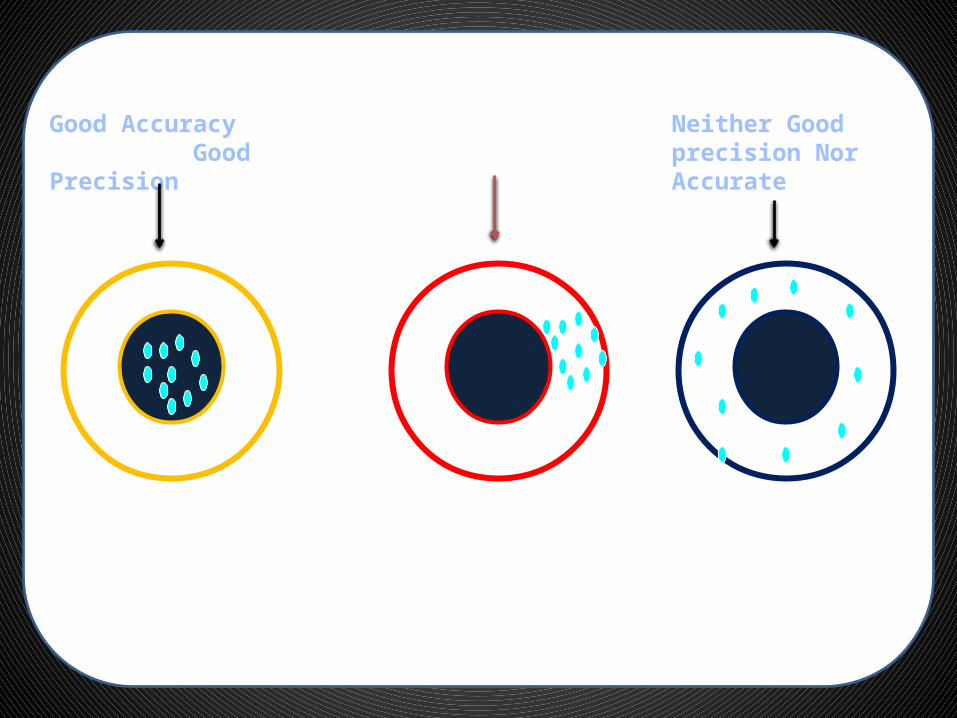
Good Accuracy Good Precision
Good Precision Only
Neither Good precision Nor Accurate

Frequency of observation
Control limit
Control limit
Stable performance Accuracy problem Precision problem
Obs
erve
d co
ntro
l con
cent
ratio
n

l
Time
Control limit
Control limit
Stable performance Accuracy problem Precision problem
Obs
erve
d co
ntro
l con
cent
ratio
n
Levey-Jennings Control Chart

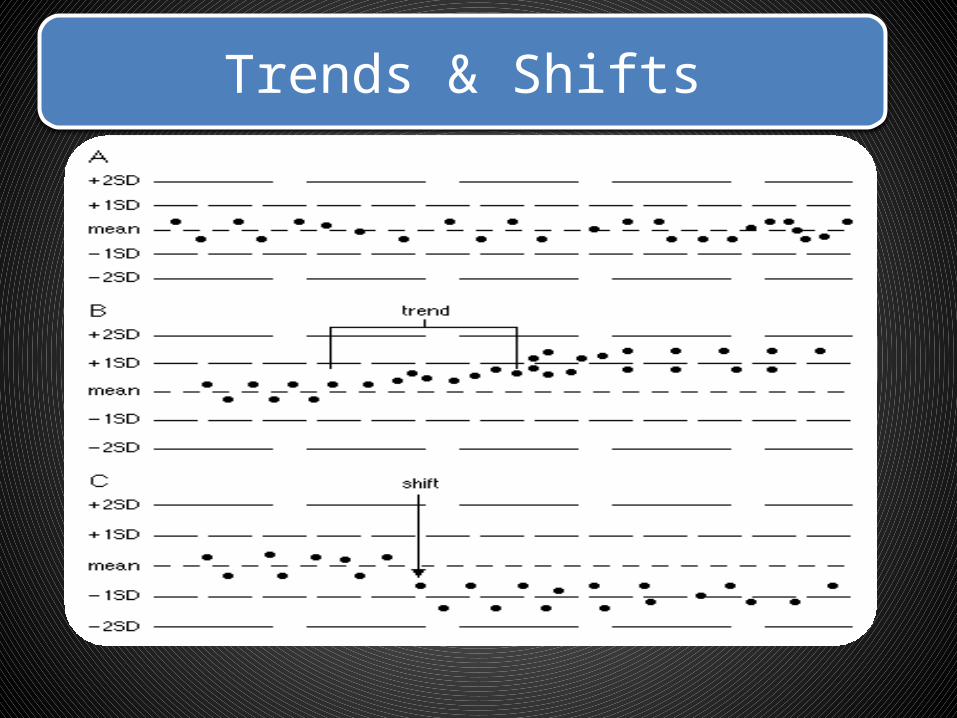
Trends & Shifts

Strandard Deviation
• In statistics and probability theory, the standard deviation (SD) (represented by the Greek letter sigma, σ) shows ;
• how much variation or dispersion from the average exists.
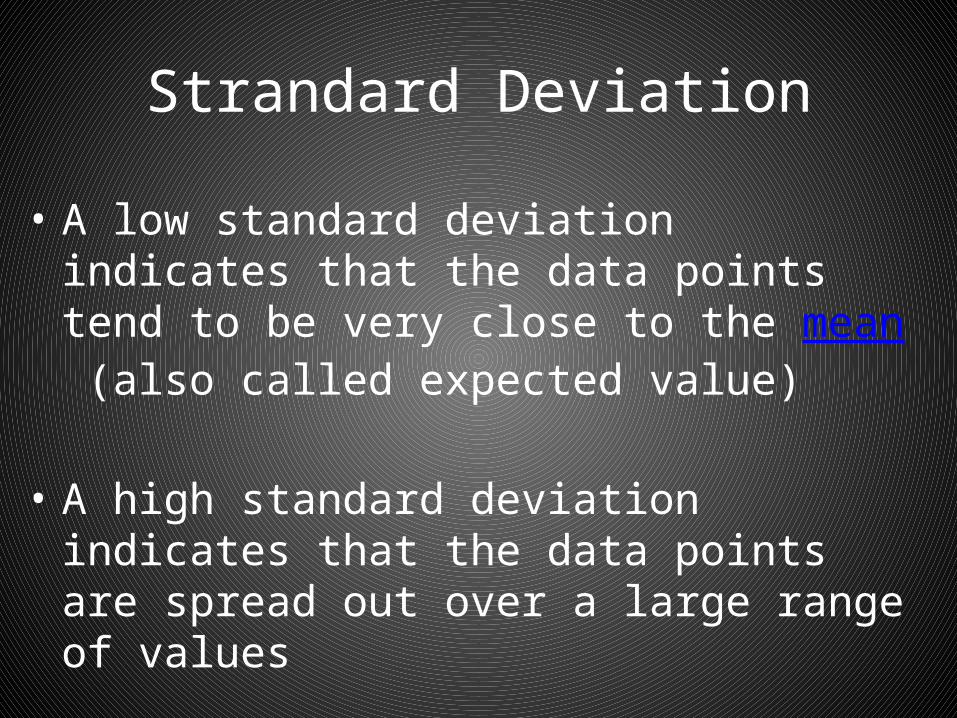
Strandard Deviation
• A low standard deviation indicates that the data points tend to be very close to the mean (also called expected value)
• A high standard deviation indicates that the data points are spread out over a large range of values

Strandard Deviation

coefficient of variation
• The coefficient of variation (CV) is defined as the ratio of the standard deviation to the mean
Levey-Jennings chart
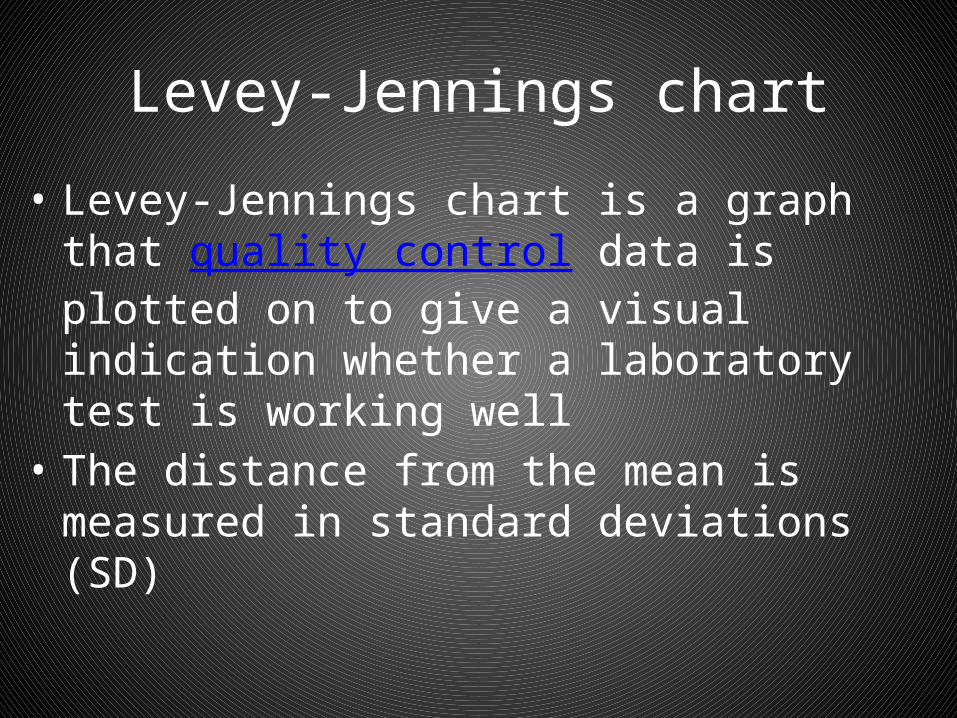
• Levey-Jennings chart is a graph that quality control data is plotted on to give a visual indication whether a laboratory test is working well
• The distance from the mean is measured in standard deviations (SD)

Levey-Jennings chart
• On the x-axis the date and time, or more usually the number of the control run, are plotted.
• A mark is made indicating how far off the actual result was from the mean (which is the expected value for the control).

Levey-Jennings chart
• Lines run across the graph at the mean, as well as one, two and sometimes three standard deviations either side of the mean.
• This makes it easy to see how far off the result was.
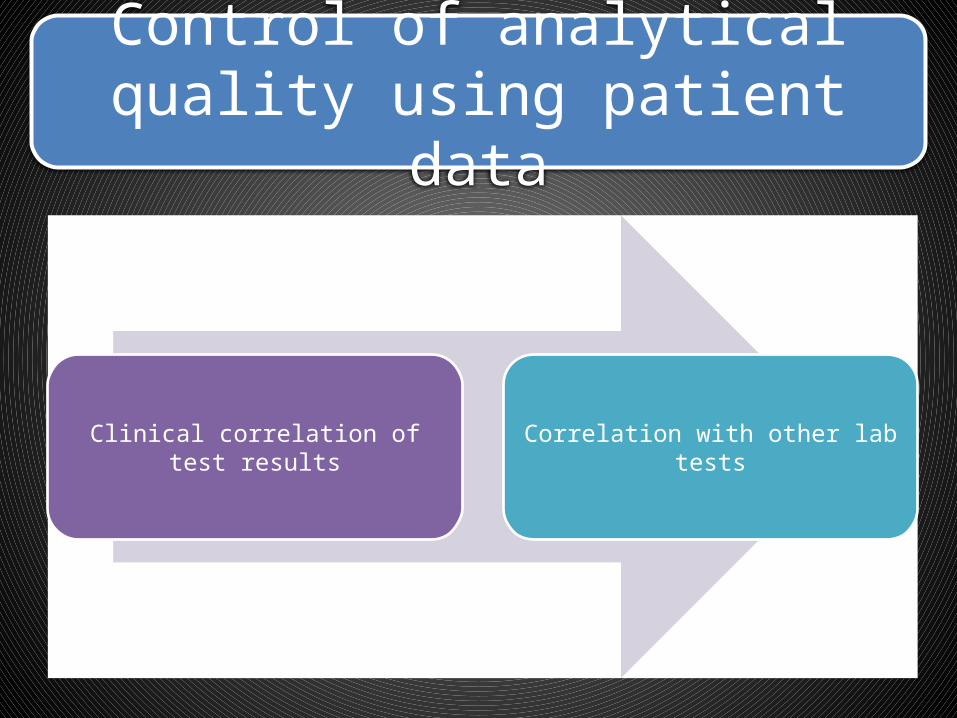
Control of analytical quality using patient data
Clinical correlation of test results Correlation with other lab tests
45
Selecting Control MaterialsCalibrators
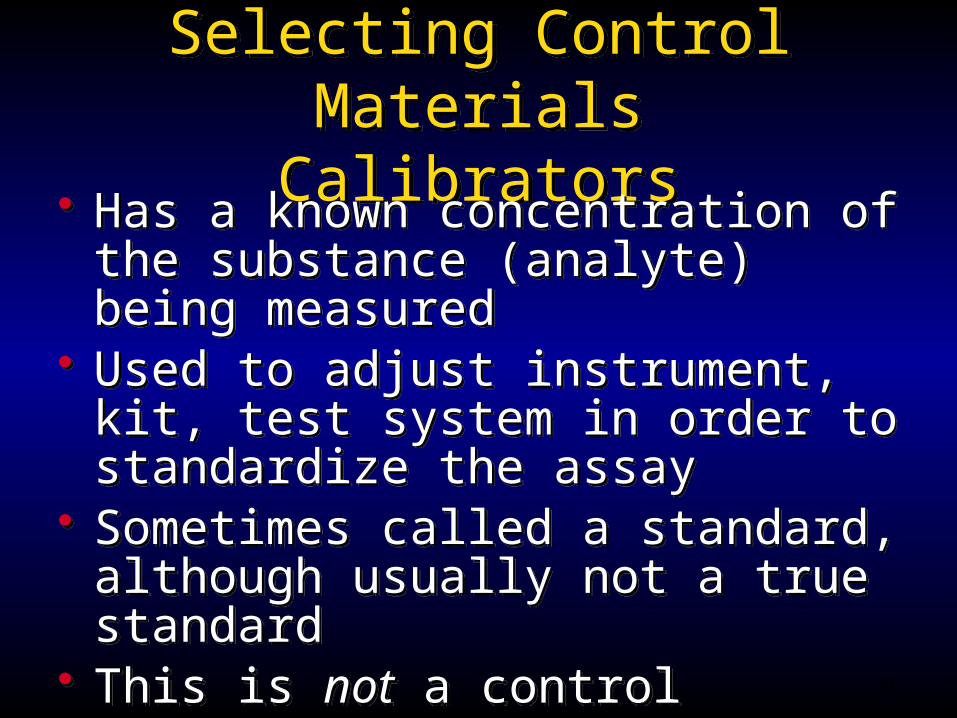
Selecting Control MaterialsCalibrators
• Has a known concentration of the substance (analyte) being measured
• Used to adjust instrument, kit, test system in order to standardize the assay
• Sometimes called a standard, although usually not a true standard
• This is not a control
• Has a known concentration of the substance (analyte) being measured
• Used to adjust instrument, kit, test system in order to standardize the assay
• Sometimes called a standard, although usually not a true standard
• This is not a control
46
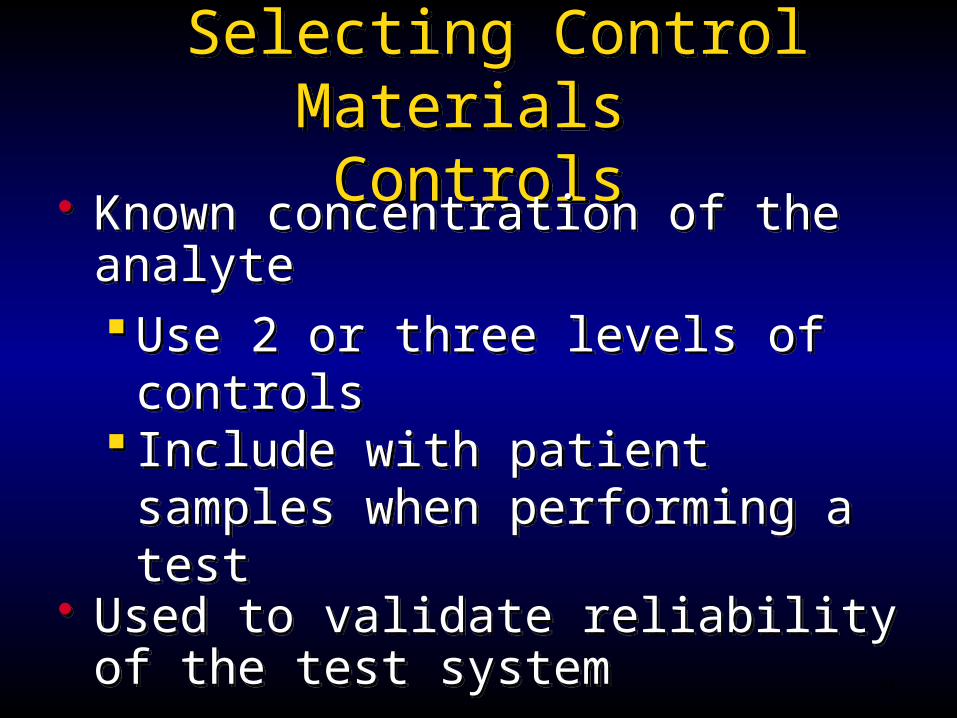
Selecting Control Materials Controls
Selecting Control Materials Controls
• Known concentration of the analyte Use 2 or three levels of controls Include with patient samples when
performing a test• Used to validate reliability of the test system
• Known concentration of the analyte Use 2 or three levels of controls Include with patient samples when
performing a test• Used to validate reliability of the test system

Biological Specimens
• Blood • Urine• Cerebrospinal Fluid• Amniotic Fluid • Duodenal Aspirate• Gastric Juice• Gall stone• Kidney Stone• Stools• Saliva• Synovial Fluid• Tissue Specimen
• Choice of specimen type depends on– Analyte to be measured – Ease of collection
Comprise the majority of all specimens analyzed
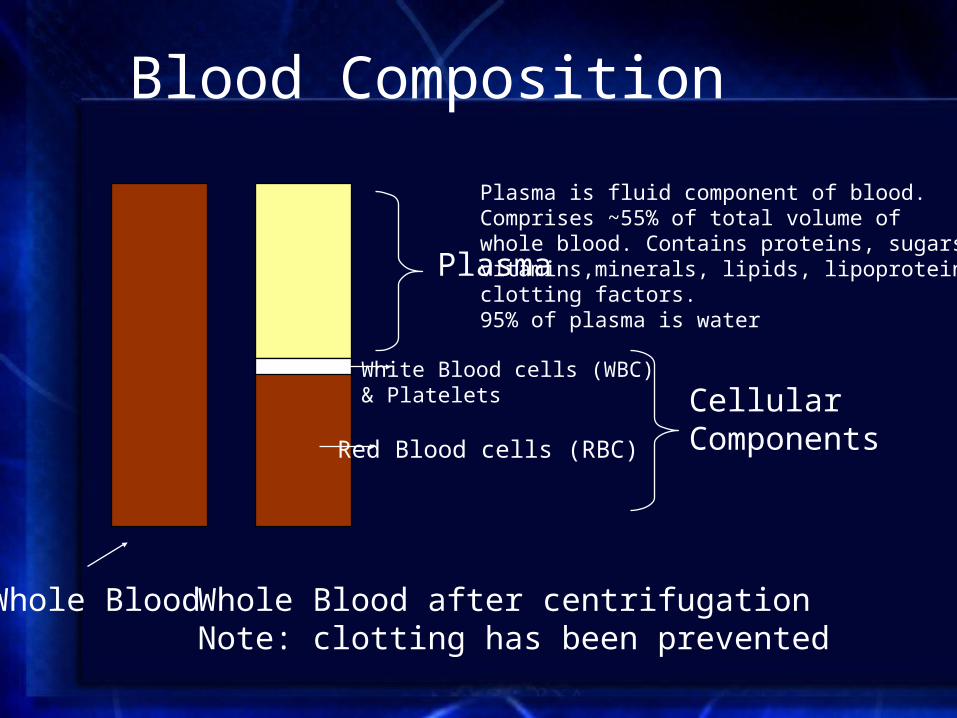
Blood Composition
Plasma
Plasma is fluid component of blood.Comprises ~55% of total volume of whole blood. Contains proteins, sugars, vitamins,minerals, lipids, lipoproteins andclotting factors. 95% of plasma is water
Red Blood cells (RBC)
Whole Blood Whole Blood after centrifugationNote: clotting has been prevented
White Blood cells (WBC) & Platelets Cellular
Components
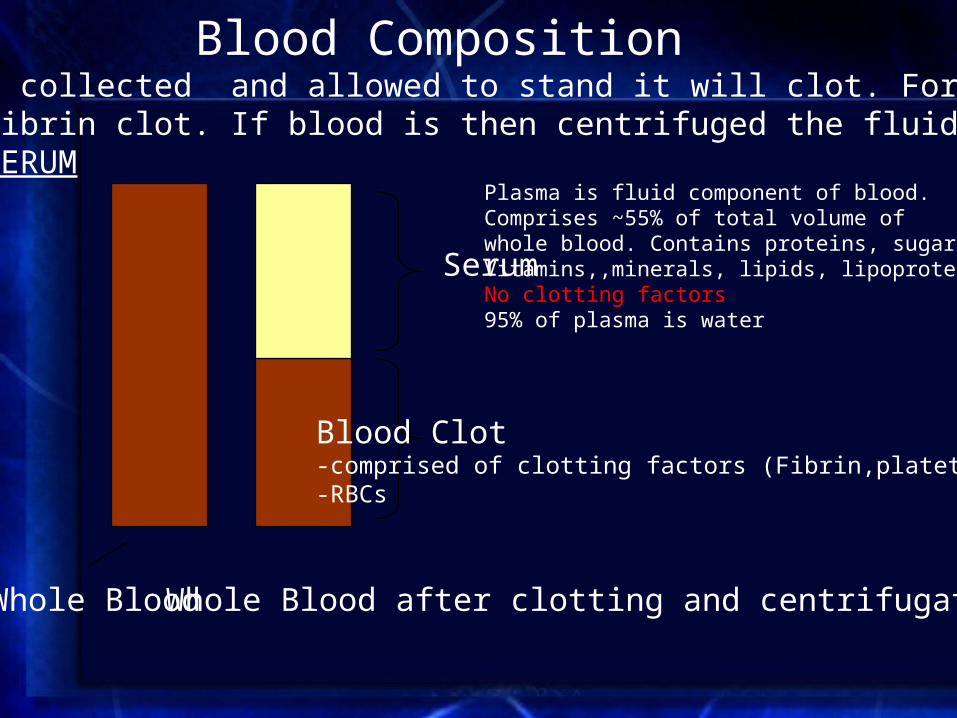
Blood Composition
Serum
Plasma is fluid component of blood.Comprises ~55% of total volume of whole blood. Contains proteins, sugars, Vitamins,,minerals, lipids, lipoproteins No clotting factors95% of plasma is water
Blood Clot-comprised of clotting factors (Fibrin,platets etc)-RBCs
Whole Blood Whole Blood after clotting and centrifugation
If blood is collected and allowed to stand it will clot. Formation of an insoluble fibrin clot. If blood is then centrifuged the fluid portion is known as SERUM

Blood Analysis• Source
– Veins – Arteries– Skin puncture-capillary blood
• Factors affecting choice of Blood Source and Collection Method– Analyte under investigation– Patient
• vascular status• ease of collection
• Collection Method– Syringe– Evacuated tube
• Additives• Separator gel
– Intravenous lines

Blood Analysis• Testing can be done on whole blood, serum or plasma. Choice depends on a
number of factors• Analyte to be measured
– Most hematology tests requires whole blood
• Instrumentation used for analysis– Most automated instruments are not set up for whole blood
analysis
• The way the test was developed. – Tests are often only validated on either plasma or serum
• Turn around time– Analysis of whole blood is the quickest. No waiting for clot or
spinning– Plasma requires centrifugation prior to analysis– With serum, the blood must clot then you have to centrifuge

Blood Analysis in the Chemistry
• Since most tests in the chemistry lab involve analytes that are dissolved in the fluid portion of blood, serum or plasma are the specimens of choice.
• Important exceptions include– Hemoglobin, Red blood cell (RBC) Folate– Blood gases
• Protein electrophoresis was developed based on the analysis of serum. Not done on plasma because of the presence of the protein fibrinogen which distorts the electrophoretic pattern.
• Many tests can use either serum or plasma
Collection Tubes• The most widely used tubes for blood collection
are evacuated tubes (Vacutainers)– Negative pressure facilitates collection– Easy to use– Sterile– Universally used colour-coded rubber stoppers to
denote tube type.– Tubes can contain various anticoagulants for the
collection of whole blood or plasma.– Tubes can have additives for specific tests (glucose,
metals)

Collection Tubes(Vacutainers)
Serum Separator Tube (SST)
Separator Gel
Separator Gel
Serum
Clot

Collection tubes
• Red-top tubes contain no anticoagulants or preservatives
• Red-top tubes are used for collecting serum– 10-15 minutes is required to allow blood to clot
before centrifuging– Used for blood bank specimens, some
chemistries

Collection tubes
• Gold (and “tiger”) top tubes contain a gel that forms a physical barrier between the serum and cells after centrifugation
• No other additives are present• Gel barrier may affect some lab tests

Collection tubes
• Used for Glucose measurement. • After blood collection, glucose concentration decreases
significantly because of cellular metabolism• Gray-top tubes contain either:
– Sodium fluoride and potassium oxalate, or– Sodium iodoacetate
• Both preservatives stabilize glucose in plasma by inhibiting enzymes of the glycolytic pathway– NaF/oxalate inhibits enolase– Iodoacetate inhibits glucose-3-phosphate dehydrogenase

Collection tubes
• Green-top tubes contain either the Na, K, or lithium (Li) salt of heparin. Most widely used anticoagulant for chemistry tests.– Should not be used for Na, K or Li measurement– Can effect the size and integrity of cellular blood components and
not recommended for hematology studies• Heparin accelerates the action of antithrombin III, which
inhibits thrombin, so blood does not clot (plasma)• The advantage of plasma is that no time is wasted waiting
for the specimen to clot

Collection tubes
• Lavender-top tubes contain the K salt of ethylenediaminetetraacetic acid (EDTA), which chelates calcium (essential for clot formation) and inhibits coagulation
• Used for hematology, and some chemistries• Cannot be used for K or Ca tests
Collection tubes
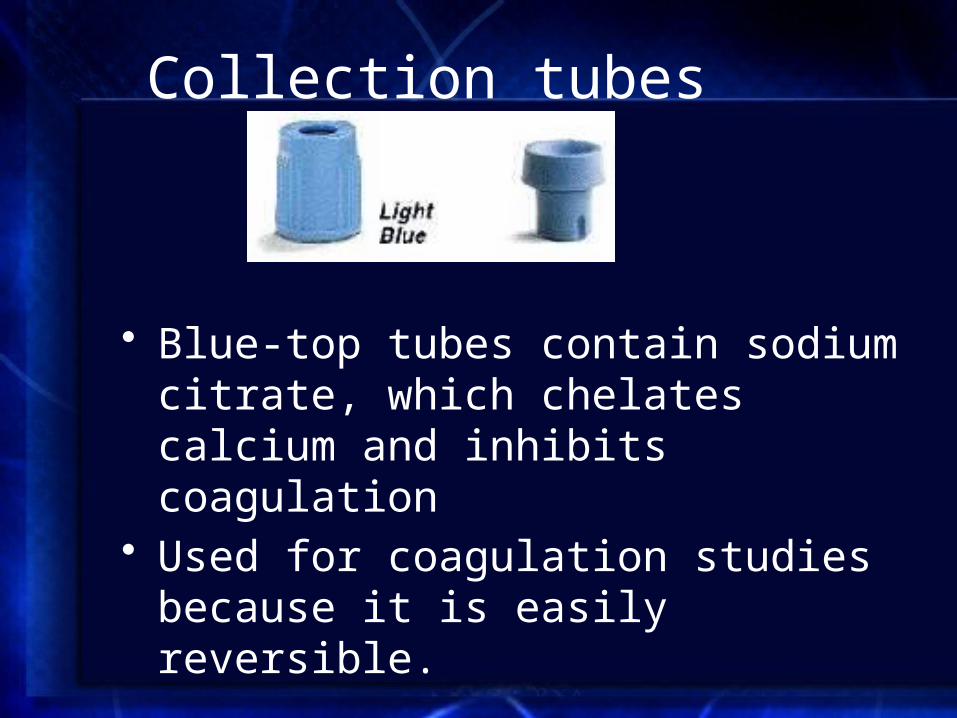
• Blue-top tubes contain sodium citrate, which chelates calcium and inhibits coagulation
• Used for coagulation studies because it is easily reversible.

Collection tubes
• Brown and Royal Blue top tubes are specially cleaned for trace metal studies– Brown-top tubes are used for lead (Pb) analysis– Royal blue-top tubes are used for other trace
element studies (acid washed)
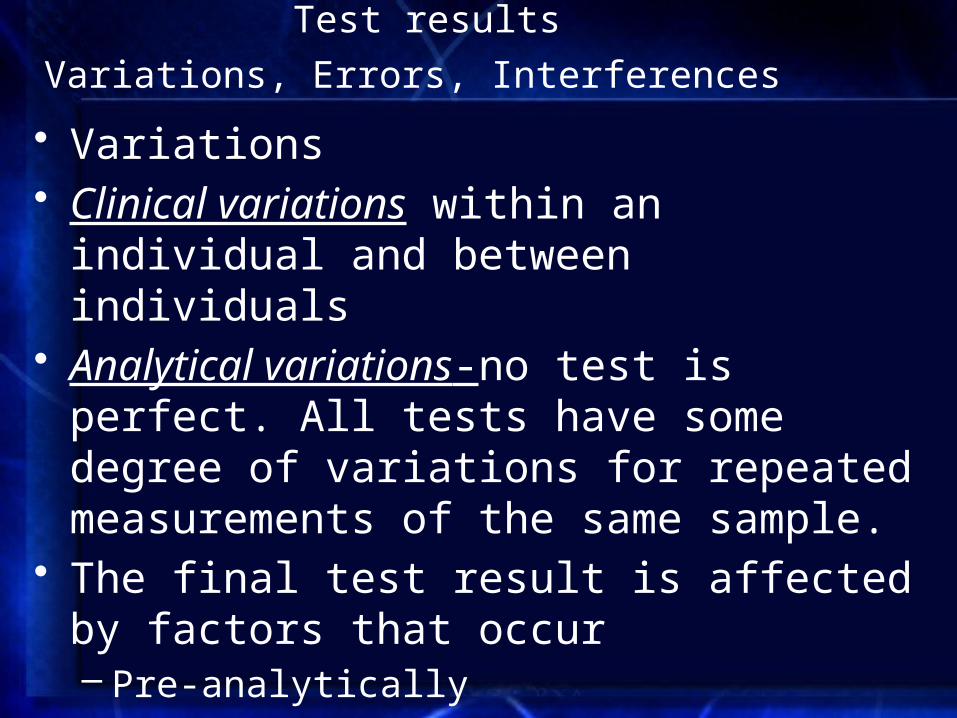
Test results
Variations, Errors, Interferences • Variations• Clinical variations within an individual and
between individuals• Analytical variations-no test is perfect. All tests
have some degree of variations for repeated measurements of the same sample.
• The final test result is affected by factors that occur – Pre-analytically– At the time of the test– After the test is completed

Steps in obtaining a laboratory test
• Test is requested by physician and ordered on the computer. Barcode is generated
• Specimen is collected
• Specimen and order are transported to the lab
• The specimen is accessioned in the lab

Steps in obtaining a laboratory test
• The specimen is processed
• The specimen is analyzed
• The results are reviewed and verified by technologists
• The results are released to the patient’s record
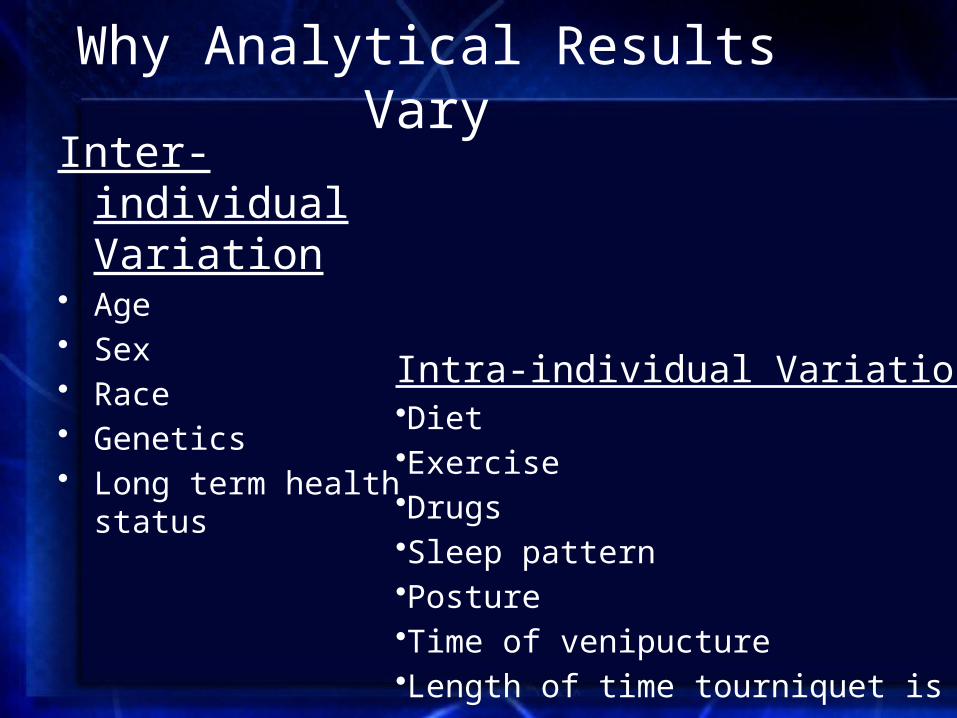
Why Analytical Results VaryInter-individual
Variation • Age• Sex• Race• Genetics• Long term health status
Intra-individual Variation •Diet•Exercise•Drugs•Sleep pattern•Posture•Time of venipucture•Length of time tourniquet is applied
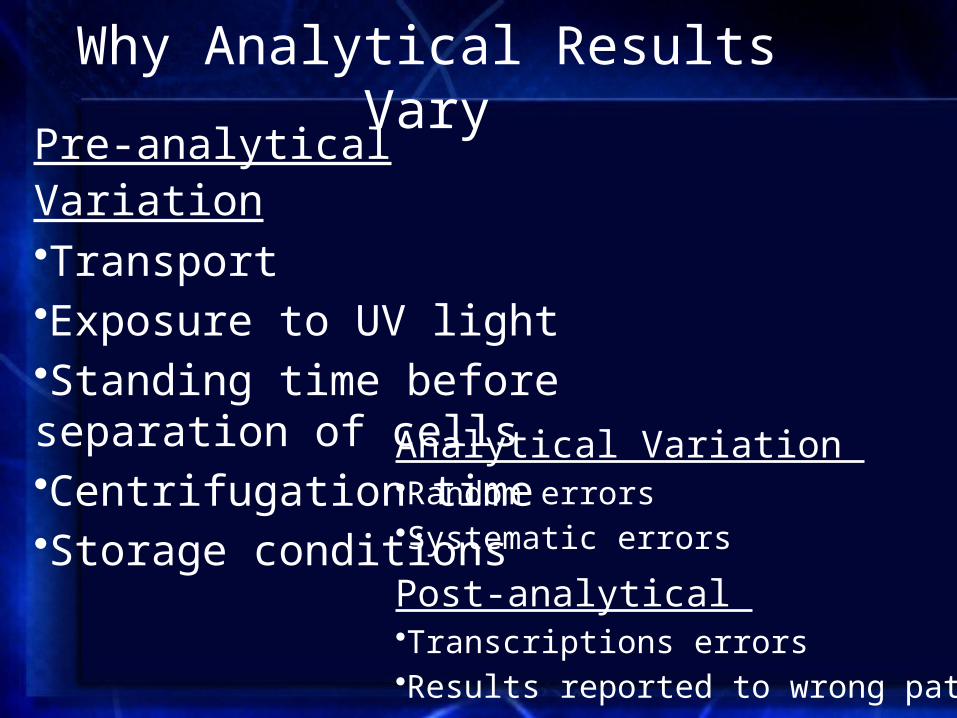
Why Analytical Results VaryPre-analytical Variation •Transport•Exposure to UV light•Standing time before separation of cells•Centrifugation time•Storage conditions
Analytical Variation •Random errors•Systematic errors
Post-analytical •Transcriptions errors•Results reported to wrong patient
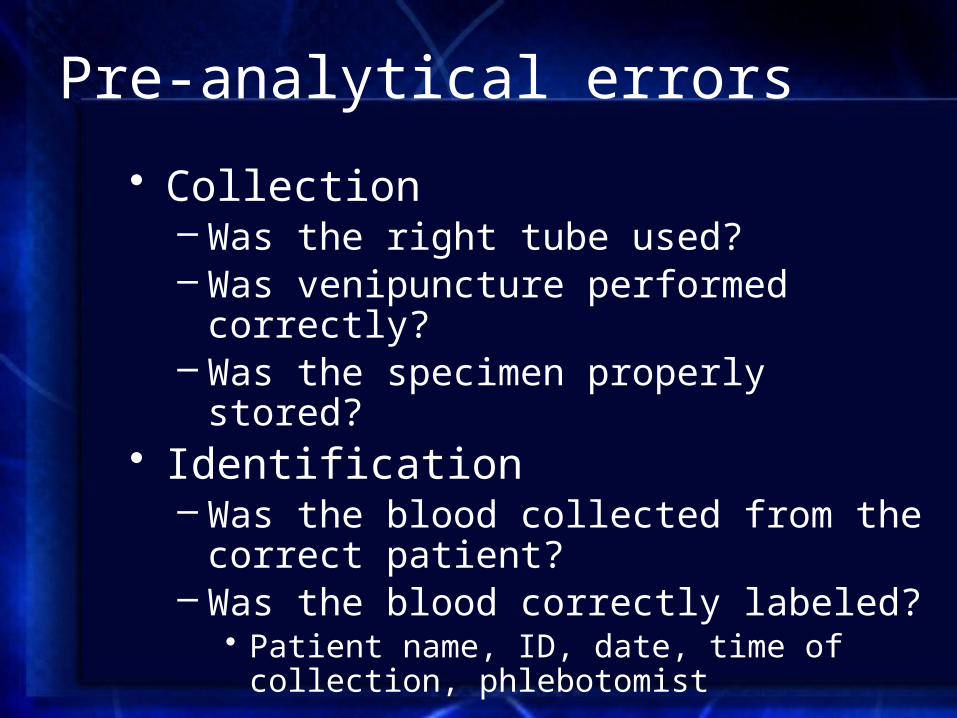
Pre-analytical errors
• Collection– Was the right tube used?– Was venipuncture performed correctly?– Was the specimen properly stored?
• Identification– Was the blood collected from the correct
patient?– Was the blood correctly labeled?
• Patient name, ID, date, time of collection, phlebotomist
Specimen identification
• One of the common sources of erroneous lab results is misidentified specimens
• The lab is required to have a clear and rational policy for identifying specimens, and handling misidentified specimens

Prolonged venous stasis
Blocking the flow of blood with the tourniquet with eventually lead to a sieving effect. Small molecules, water and ions are forced out blood vessels and larger molecules are concentrated
• Increases Total Protein, proteins, iron (Fe), cholesterol, bilirubin
• Decreases potassium
Supine vs. sitting or standing
• Going from lying (supine) to upright reduces total blood volume by about 700 ml
• The following may decrease by 5-15% in the supine patient:– Total protein– Albumin– Lipids– Iron– Calcium– Enzymes

Specimens requiring special handling
• Should be placed immediately on ice– Lactate– Ammonia– Acid phosphatase– Plasma catecholamines

Significantly affected by hemolysis:
• Hemolysis-rupture of red blood cell– Can be due to improper collection – End result is dumping cellular contents into
blood. Mild dilution effect in some analytes
• Significant increase in potassium, magnesium, phosphorous
Interferences• Hemolysis
– The release of hemoglobin into blood can effect the reactions comprising specific tests
– Causes serum or plasma to be red and can effect tests that are colorimetric
• Lipemia (lots of fats) and proteinemia (lots of protein)– Causes serum or plasma to be become turbid. This can
effect colorimetric and turbidometric based tests– Also can cause a dilution effect. Fats and proteins are
large and displace water in plasma. Can give falsely low results especially for Na

Interferences• Human Anti Animal Antibodies.
– Occurs in individual that have been exposed to foreign immunoglobins
– Can significantly increase or decrease immunoassay based tests since all utilize animal antibodies, particularly mouse. Referred to as Human Anti Mouse Antibodies (HAMA)
– Tests usually contain reagent to clear HAMA– Technicians performs a dilution test to determine if
HAMA are present– Generally have to send to another lab to test by alternate
method or different antibody


l
Time
Control limit
Control limit
Stable performance Accuracy problem Precision problem
Obs
erve
d co
ntro
l con
cent
ratio
n
Levey-Jennings Control Chart
Trends & Shifts
Run numbers
Obs
erve
d co
ntro
l con
cent
ratio
n
Mean
+1s
+3s
+2s
-2s
-1s
-3s
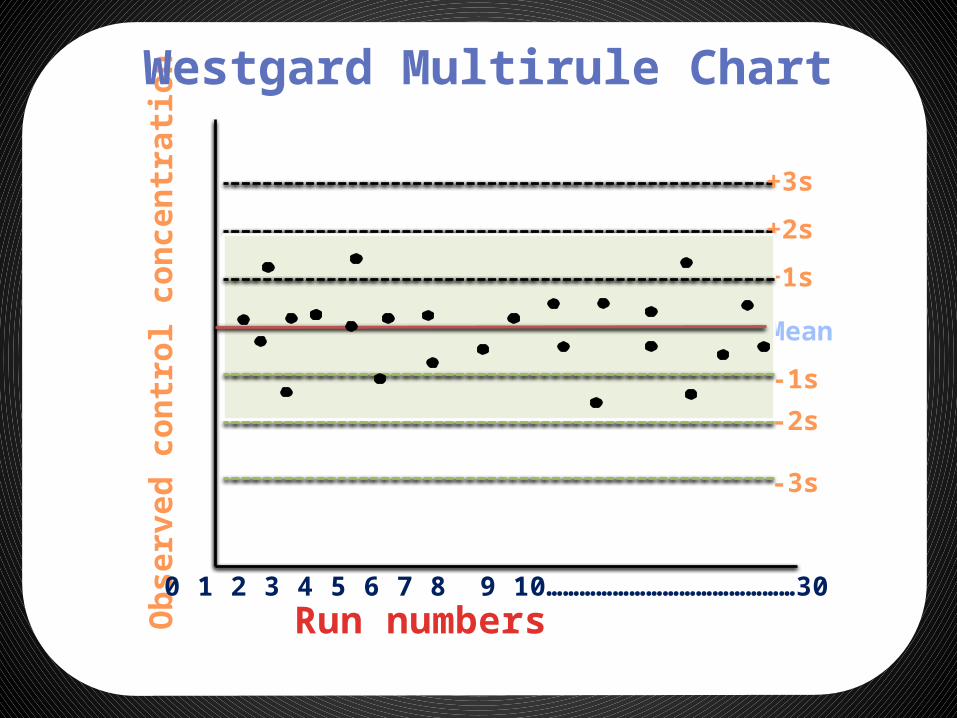
Westgard Multirule Chart
0 1 2 3 4 5 6 7 8 9 10………………………………………30

Run numbers
Obs
erve
d co
ntro
l con
cent
ratio
n
Mean
+1s
+3s
+2s
-2s
-1s
-3s
Westgard Multirule Chart
0 1 2 3 4 5 6 7 8 9 10………………………………………30
12sWarning rule

Run numbers
Obs
erve
d co
ntro
l con
cent
ratio
n
Mean
+1s
+3s
+2s
-2s
-1s
-3s
Westgard Multirule Chart
0 1 2 3 4 5 6 7 8 9 10………………………………………30
13sRejection rule

Run numbers
Obs
erve
d co
ntro
l con
cent
ratio
n
Mean
+1s
+3s
+2s
-2s
-1s
-3s
Westgard Multirule Chart
0 1 2 3 4 5 6 7 8 9 10………………………………………30
22sRejection rule

Run numbers
Obs
erve
d co
ntro
l con
cent
ratio
n
Mean
+1s
+3s
+2s
-2s
-1s
-3s
Westgard Multirule Chart
0 1 2 3 4 5 6 7 8 9 10………………………………………30
R4sRejection rule
Run numbers
Obs
erve
d co
ntro
l con
cent
ratio
n
Mean
+1s
+3s
+2s
-2s
-1s
-3s
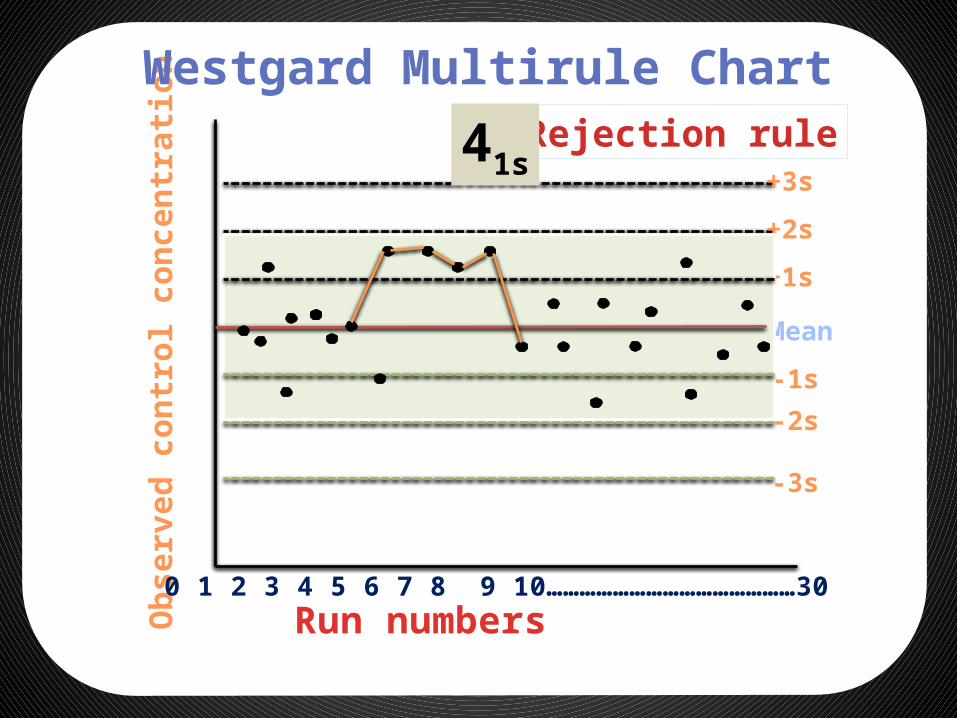
Westgard Multirule Chart
0 1 2 3 4 5 6 7 8 9 10………………………………………30
Rejection rule41s
Run numbers
Obs
erve
d co
ntro
l con
cent
ratio
n
Mean
+1s
+3s
+2s
-2s
-1s
-3s
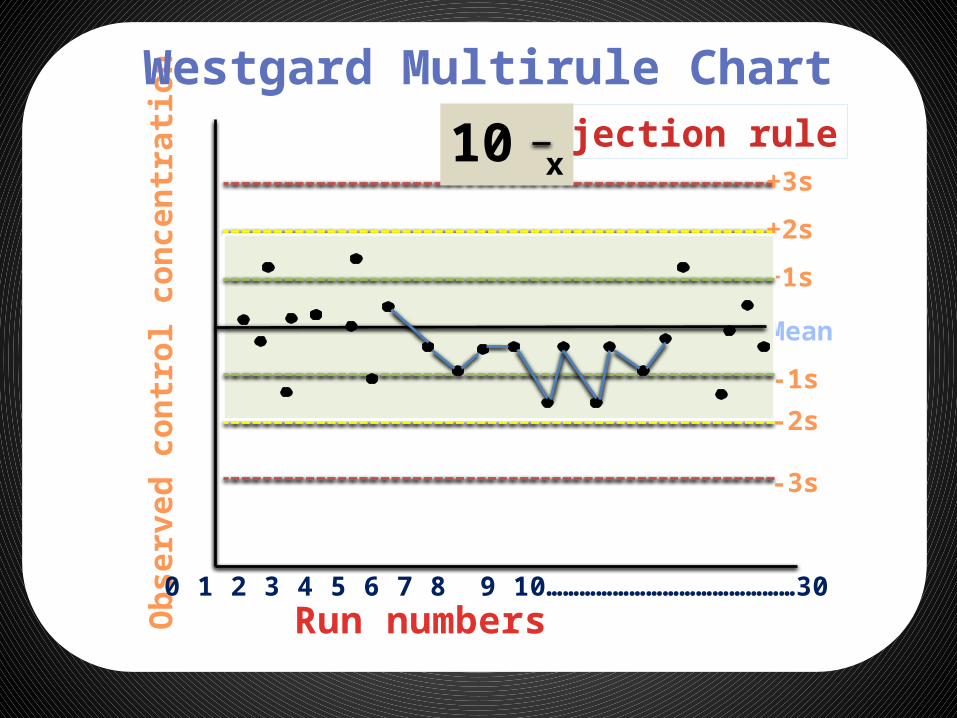
Westgard Multirule Chart
0 1 2 3 4 5 6 7 8 9 10………………………………………30
Rejection rule10 x

CUSUM Control Chart

Control of analytical quality using patient data
Clinical correlation of test results Correlation with other lab tests
References
• Tietz test book of clinical Biochemistry• Varley• Kaplan• Internet


![Abstract Final[1] Final](https://img.pdfslide.net/doc/110x75/577cceac1a28ab9e788e2749/abstract-final1-final.jpg)


![Final Final No Va Mas[1][1]](https://img.pdfslide.net/doc/110x75/5571fa924979599169928a8f/final-final-no-va-mas11.jpg)