Embed Size (px)
Citation preview
Introduction With the growing popularity of nanomaterials in a wide variety of products and processes, the need to measure and characterize
these materials has also grown. For metallic or metal-containing engineered nanoparticles (NPs), single particle ICP-MS (SP-ICP-MS) has been developed and is growing in popularity due to its ability to rapidly detect and characterize a large number of particles, determine particle size and size distributions, the particle number concentration in a sample, and the elemental mass concentration of both dissolved and particulate species. SP-ICP-MS has been applied to a wide variety of sample types1-5, demonstrating its versatility.
A key variable in SP-ICP-MS, which must be applied correctly for accurate measurement of particle concentration, is the dwell time of the ICP-MS. Although this topic has been discussed previously6,7, this work will focus on direct comparisons of results using both microsecond and millisecond dwell times. Since a detailed version of this work is available8, only a brief description will be given here.
A Comparison of Microsecond vs. Millisecond Dwell Times on Particle Number Concentration Measurements by Single Particle ICP-MS
A P P L I C A T I O N N O T E
Authors:
Isabel Abad-Álvaro1,2, Elena Peña Vázquez2, Eduardo Bolea1, Pilar Bermejo-Barrera2, Juan Castillo1, Francisco Laborda1
1 Group of Analytical Spectroscopy and Sensors (GEAS), Institute of Environmental Sciences (IUCA), University of Zaragoza, Pedro Cerbuna 12, 50009 Zaragoza, Spain
2 Group of Trace Elements, Spectroscopy and Speciation (GETEE), Department of Analytical Chemistry, Nutrition and Bromatology, University of Santiago de Compostela, Avda. Das Ciencias, s/n, 15782 Santiago de Compostela, Spain
ICP - Mass Spectrometry
2
Experimental
StandardsGold (Au) and silver (Ag) nanoparticle suspensions were purchased from commercial sources: Au NPs (60 nm) were purchased from NIST™ (SRM 8013, Gaithersburg, Maryland, USA), while 40, 60, and 100 nm silver NPs were purchased from Sigma-Aldrich (Buchs, Switzerland). Prior to analysis, the stock solutions were diluted to appropriate concentrations in ultrapure water. After dilution and prior to analysis, solutions were sonicated for one minute in an ultrasonic bath.
Aqueous Ag and Au solutions were prepared from a 1000 mg/L stock standards (Ag: Merck™, Darmstadt, Germany; Au: Panreac™, Barcelona, Spain). For Ag, dilutions were done in ultrapure water, while for Au, 5% (v/v) hydrochloric acid was used as the diluent.
InstrumentationAll measurements were made with a PerkinElmer NexION® 350X ICP-MS operating in Single Particle mode, which eliminates the settling time of the quadrupole during data acquisition. Instrumental parameters are shown in Table 1. All data were collected and processed with the Syngistix™ Nano Application Module, within the Syngisitix for ICP-MS instrument software.
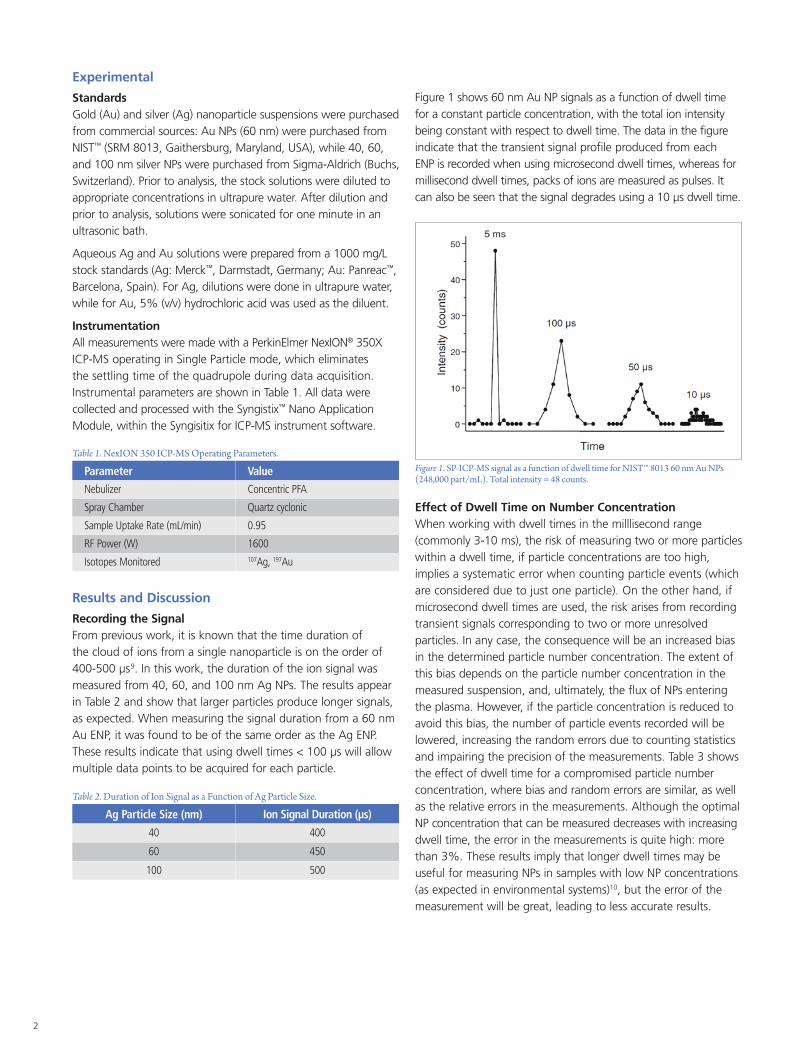
Figure 1 shows 60 nm Au NP signals as a function of dwell time for a constant particle concentration, with the total ion intensity being constant with respect to dwell time. The data in the figure indicate that the transient signal profile produced from each ENP is recorded when using microsecond dwell times, whereas for millisecond dwell times, packs of ions are measured as pulses. It can also be seen that the signal degrades using a 10 µs dwell time.
Effect of Dwell Time on Number ConcentrationWhen working with dwell times in the milllisecond range (commonly 3-10 ms), the risk of measuring two or more particles within a dwell time, if particle concentrations are too high, implies a systematic error when counting particle events (which are considered due to just one particle). On the other hand, if microsecond dwell times are used, the risk arises from recording transient signals corresponding to two or more unresolved particles. In any case, the consequence will be an increased bias in the determined particle number concentration. The extent of this bias depends on the particle number concentration in the measured suspension, and, ultimately, the flux of NPs entering the plasma. However, if the particle concentration is reduced to avoid this bias, the number of particle events recorded will be lowered, increasing the random errors due to counting statistics and impairing the precision of the measurements. Table 3 shows the effect of dwell time for a compromised particle number concentration, where bias and random errors are similar, as well as the relative errors in the measurements. Although the optimal NP concentration that can be measured decreases with increasing dwell time, the error in the measurements is quite high: more than 3%. These results imply that longer dwell times may be useful for measuring NPs in samples with low NP concentrations (as expected in environmental systems)10, but the error of the measurement will be great, leading to less accurate results.
Results and Discussion
Recording the SignalFrom previous work, it is known that the time duration of the cloud of ions from a single nanoparticle is on the order of 400-500 µs9. In this work, the duration of the ion signal was measured from 40, 60, and 100 nm Ag NPs. The results appear in Table 2 and show that larger particles produce longer signals, as expected. When measuring the signal duration from a 60 nm Au ENP, it was found to be of the same order as the Ag ENP. These results indicate that using dwell times < 100 µs will allow multiple data points to be acquired for each particle.
Figure 1. SP-ICP-MS signal as a function of dwell time for NIST™ 8013 60 nm Au NPs (248,000 part/mL). Total intensity = 48 counts.
Table 1. NexION 350 ICP-MS Operating Parameters.
Parameter ValueNebulizer Concentric PFA
Spray Chamber Quartz cyclonic
Sample Uptake Rate (mL/min) 0.95
RF Power (W) 1600
Isotopes Monitored 107Ag, 197Au
Table 2. Duration of Ion Signal as a Function of Ag Particle Size.
Ag Particle Size (nm) Ion Signal Duration (µs)
40 400
60 450
100 500
3
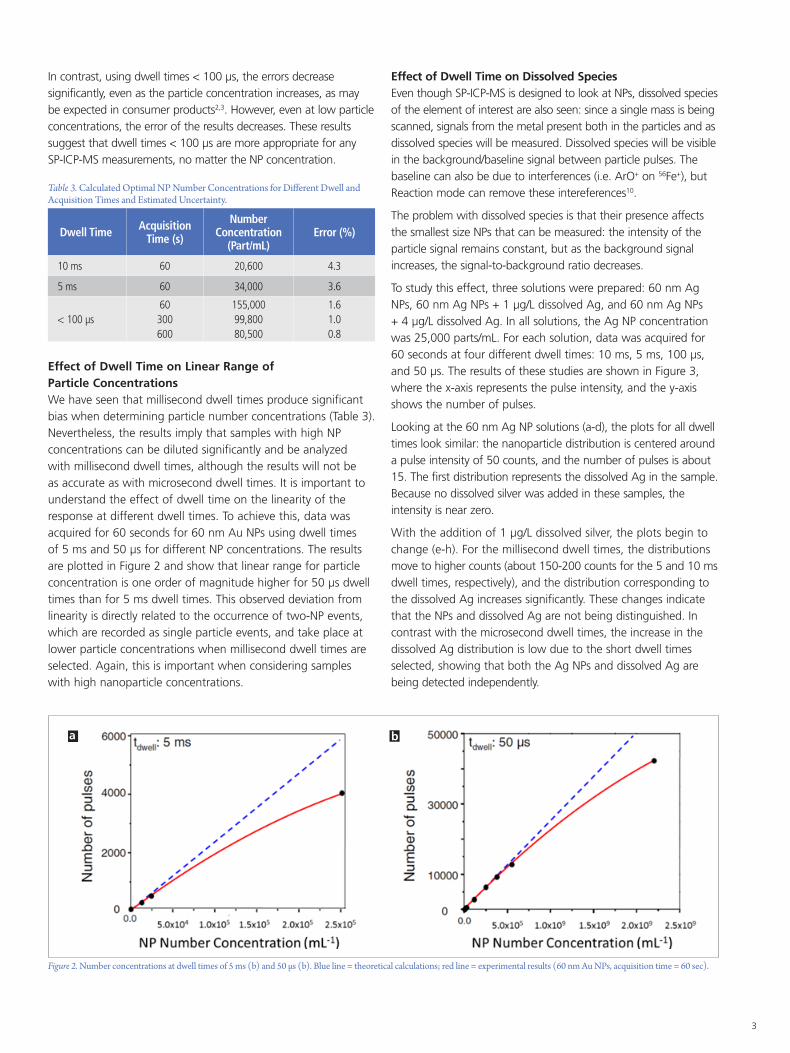
Table 3. Calculated Optimal NP Number Concentrations for Different Dwell and Acquisition Times and Estimated Uncertainty.
Dwell Time Acquisition Time (s)
Number Concentration
(Part/mL)Error (%)
10 ms 60 20,600 4.3
5 ms 60 34,000 3.6
< 100 µs60 300 600
155,000 99,800 80,500
1.6 1.0 0.8
In contrast, using dwell times < 100 µs, the errors decrease significantly, even as the particle concentration increases, as may be expected in consumer products2,3. However, even at low particle concentrations, the error of the results decreases. These results suggest that dwell times < 100 µs are more appropriate for any SP-ICP-MS measurements, no matter the NP concentration.
Effect of Dwell Time on Linear Range of Particle ConcentrationsWe have seen that millisecond dwell times produce significant bias when determining particle number concentrations (Table 3). Nevertheless, the results imply that samples with high NP concentrations can be diluted significantly and be analyzed with millisecond dwell times, although the results will not be as accurate as with microsecond dwell times. It is important to understand the effect of dwell time on the linearity of the response at different dwell times. To achieve this, data was acquired for 60 seconds for 60 nm Au NPs using dwell times of 5 ms and 50 µs for different NP concentrations. The results are plotted in Figure 2 and show that linear range for particle concentration is one order of magnitude higher for 50 µs dwell times than for 5 ms dwell times. This observed deviation from linearity is directly related to the occurrence of two-NP events, which are recorded as single particle events, and take place at lower particle concentrations when millisecond dwell times are selected. Again, this is important when considering samples with high nanoparticle concentrations.
Effect of Dwell Time on Dissolved SpeciesEven though SP-ICP-MS is designed to look at NPs, dissolved species of the element of interest are also seen: since a single mass is being scanned, signals from the metal present both in the particles and as dissolved species will be measured. Dissolved species will be visible in the background/baseline signal between particle pulses. The baseline can also be due to interferences (i.e. ArO+ on 56Fe+), but Reaction mode can remove these intereferences10.
The problem with dissolved species is that their presence affects the smallest size NPs that can be measured: the intensity of the particle signal remains constant, but as the background signal increases, the signal-to-background ratio decreases.
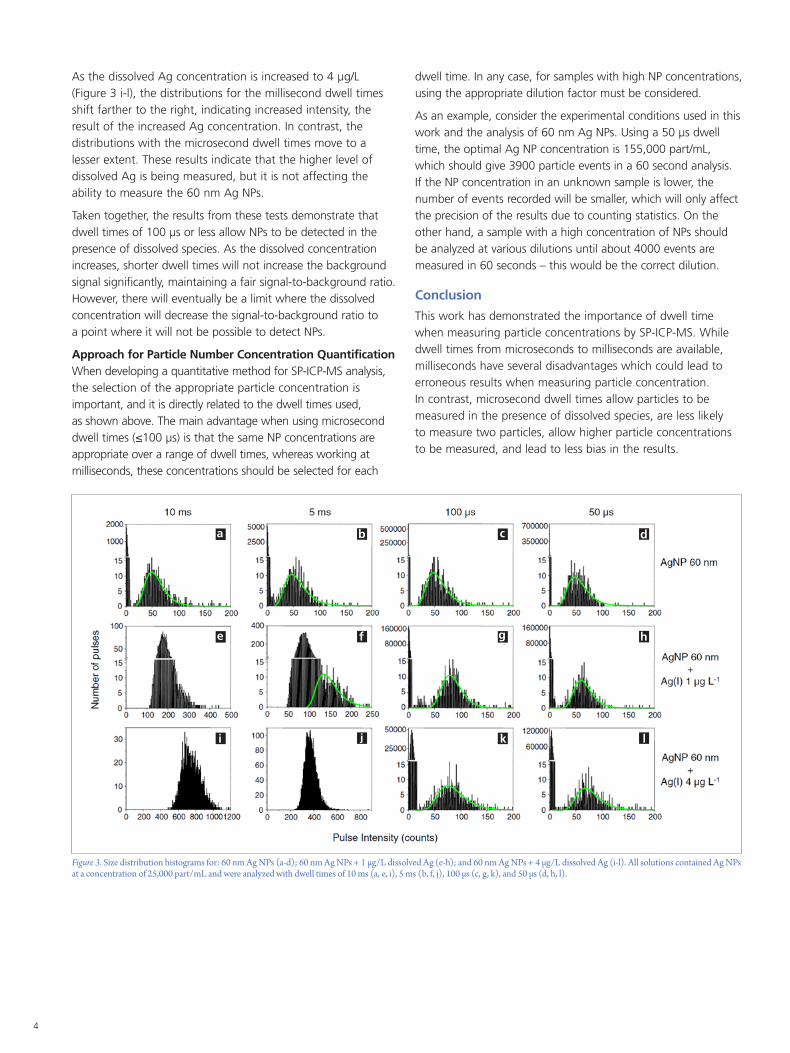
To study this effect, three solutions were prepared: 60 nm Ag NPs, 60 nm Ag NPs + 1 µg/L dissolved Ag, and 60 nm Ag NPs + 4 µg/L dissolved Ag. In all solutions, the Ag NP concentration was 25,000 parts/mL. For each solution, data was acquired for 60 seconds at four different dwell times: 10 ms, 5 ms, 100 µs, and 50 µs. The results of these studies are shown in Figure 3, where the x-axis represents the pulse intensity, and the y-axis shows the number of pulses.
Looking at the 60 nm Ag NP solutions (a-d), the plots for all dwell times look similar: the nanoparticle distribution is centered around a pulse intensity of 50 counts, and the number of pulses is about 15. The first distribution represents the dissolved Ag in the sample. Because no dissolved silver was added in these samples, the intensity is near zero.
With the addition of 1 µg/L dissolved silver, the plots begin to change (e-h). For the millisecond dwell times, the distributions move to higher counts (about 150-200 counts for the 5 and 10 ms dwell times, respectively), and the distribution corresponding to the dissolved Ag increases significantly. These changes indicate that the NPs and dissolved Ag are not being distinguished. In contrast with the microsecond dwell times, the increase in the dissolved Ag distribution is low due to the short dwell times selected, showing that both the Ag NPs and dissolved Ag are being detected independently.
Figure 2. Number concentrations at dwell times of 5 ms (b) and 50 µs (b). Blue line = theoretical calculations; red line = experimental results (60 nm Au NPs, acquisition time = 60 sec).
a b
4
As the dissolved Ag concentration is increased to 4 µg/L (Figure 3 i-l), the distributions for the millisecond dwell times shift farther to the right, indicating increased intensity, the result of the increased Ag concentration. In contrast, the distributions with the microsecond dwell times move to a lesser extent. These results indicate that the higher level of dissolved Ag is being measured, but it is not affecting the ability to measure the 60 nm Ag NPs.
Taken together, the results from these tests demonstrate that dwell times of 100 µs or less allow NPs to be detected in the presence of dissolved species. As the dissolved concentration increases, shorter dwell times will not increase the background signal significantly, maintaining a fair signal-to-background ratio. However, there will eventually be a limit where the dissolved concentration will decrease the signal-to-background ratio to a point where it will not be possible to detect NPs.
Approach for Particle Number Concentration QuantificationWhen developing a quantitative method for SP-ICP-MS analysis, the selection of the appropriate particle concentration is important, and it is directly related to the dwell times used, as shown above. The main advantage when using microsecond dwell times (≤100 µs) is that the same NP concentrations are appropriate over a range of dwell times, whereas working at milliseconds, these concentrations should be selected for each
dwell time. In any case, for samples with high NP concentrations, using the appropriate dilution factor must be considered.
As an example, consider the experimental conditions used in this work and the analysis of 60 nm Ag NPs. Using a 50 µs dwell time, the optimal Ag NP concentration is 155,000 part/mL, which should give 3900 particle events in a 60 second analysis. If the NP concentration in an unknown sample is lower, the number of events recorded will be smaller, which will only affect the precision of the results due to counting statistics. On the other hand, a sample with a high concentration of NPs should be analyzed at various dilutions until about 4000 events are measured in 60 seconds – this would be the correct dilution.
Conclusion
This work has demonstrated the importance of dwell time when measuring particle concentrations by SP-ICP-MS. While dwell times from microseconds to milliseconds are available, milliseconds have several disadvantages which could lead to erroneous results when measuring particle concentration. In contrast, microsecond dwell times allow particles to be measured in the presence of dissolved species, are less likely to measure two particles, allow higher particle concentrations to be measured, and lead to less bias in the results.
Figure 3. Size distribution histograms for: 60 nm Ag NPs (a-d); 60 nm Ag NPs + 1 µg/L dissolved Ag (e-h); and 60 nm Ag NPs + 4 µg/L dissolved Ag (i-l). All solutions contained Ag NPs at a concentration of 25,000 part/mL and were analyzed with dwell times of 10 ms (a, e, i), 5 ms (b, f, j), 100 µs (c, g, k), and 50 µs (d, h, l).
a
i
e
c
k
g
d
l
h
b
j
f
For a complete listing of our global offices, visit www.perkinelmer.com/ContactUs
Copyright ©2016, PerkinElmer, Inc. All rights reserved. PerkinElmer® is a registered trademark of PerkinElmer, Inc. All other trademarks are the property of their respective owners. 013105_01 PKI
PerkinElmer, Inc. 940 Winter Street Waltham, MA 02451 USA P: (800) 762-4000 or (+1) 203-925-4602www.perkinelmer.com
References
1. Hadioui, M., Wilkinson, K., Stephan, C. “Assessing the Fate of Silver Nanoparticles in Surface Water using Single Particle ICP-MS”, PerkinElmer application note, 2014.
2. Davidowski, L., Stephan, C. “Characterization of Silver Nanoparticles in Dietary Supplements by Single Particle ICP-Mass Spectrometry”, PerkinElmer application note, 2014.
3. Dan, Y., Shi, H., Lian, X., Stephan, C. “Measurement of Titanium Dioxide Nanoparticles in Sunscreen using Single Particle ICP-MS”, PerkinElmer application note, 2015.
4. Cirtiu, C.-M., Fleury, N., Stephan, C. “Assessing the Fate of Nanoparticles in Biological Fluids using SP-ICP-MS”, PerkinElmer application note, 2015.
5. Gray, E. Higgins, C.P., Ranville, J.F. “Analysis of Nanoparticles in Biological Tissues using SP-ICP-MS”, PerkinElmer application note, 2014.
6. Hineman, A., Stephan, C. J. Anal. At. Spectrom. 2014, 29, 1252.
7. Stephan, C., Neubauer, K. “Single Particle Inductively Coupled Plasma Mass Spectrometry: Understanding How and Why”, PerkinElmer white paper 2014.
8. Abad-Álvaro, I., Peña-Vázquez, E., Bolea, E., Bermejo-Barrera, P., Castillo, J.R., Laborda, F. Anal. Bioanal. Chem. 2016, 408, 5089.
9. Olesik, J.W., Gray, P.J. J. Anal. At. Spectrom. 2012, 27, 1143.
10. Stephan, C. “Analysis fo Iron Nanoparticles in Organic Solvents Used in the Semiconductor Industry Using Single Particle ICP-MS in Reaction Mode”, PerkinElmer white paper 2015.
Consumables Used
Component Description Part Number
Pure-Grade Silver Standard
1000 mg/L, 125 mL N9300171
Pure-Grade Gold Standard
1000 mg/L, 125 mL N9303759
60 nm Gold Nanoparticles
60 nm, 2.60E+10, 25 mL N8142303
Sample Uptake TubingGreen/orange (0.38 mm id), PVC, flared, pack of 12
N07773113
Drain TubingGray/gray (1.30 mm id), Santoprene, pack of 12
N0777444
Sample Tubes Box of 500B0193233 (15 mL) B0193234 (50 mL)