Embed Size (px)
Citation preview
Erin Shellman DAML July, 27 2016
Catching the most with high-throughput screening


Zymergen provides a platform for the rapid improvement of microbial strains through genetic engineering.
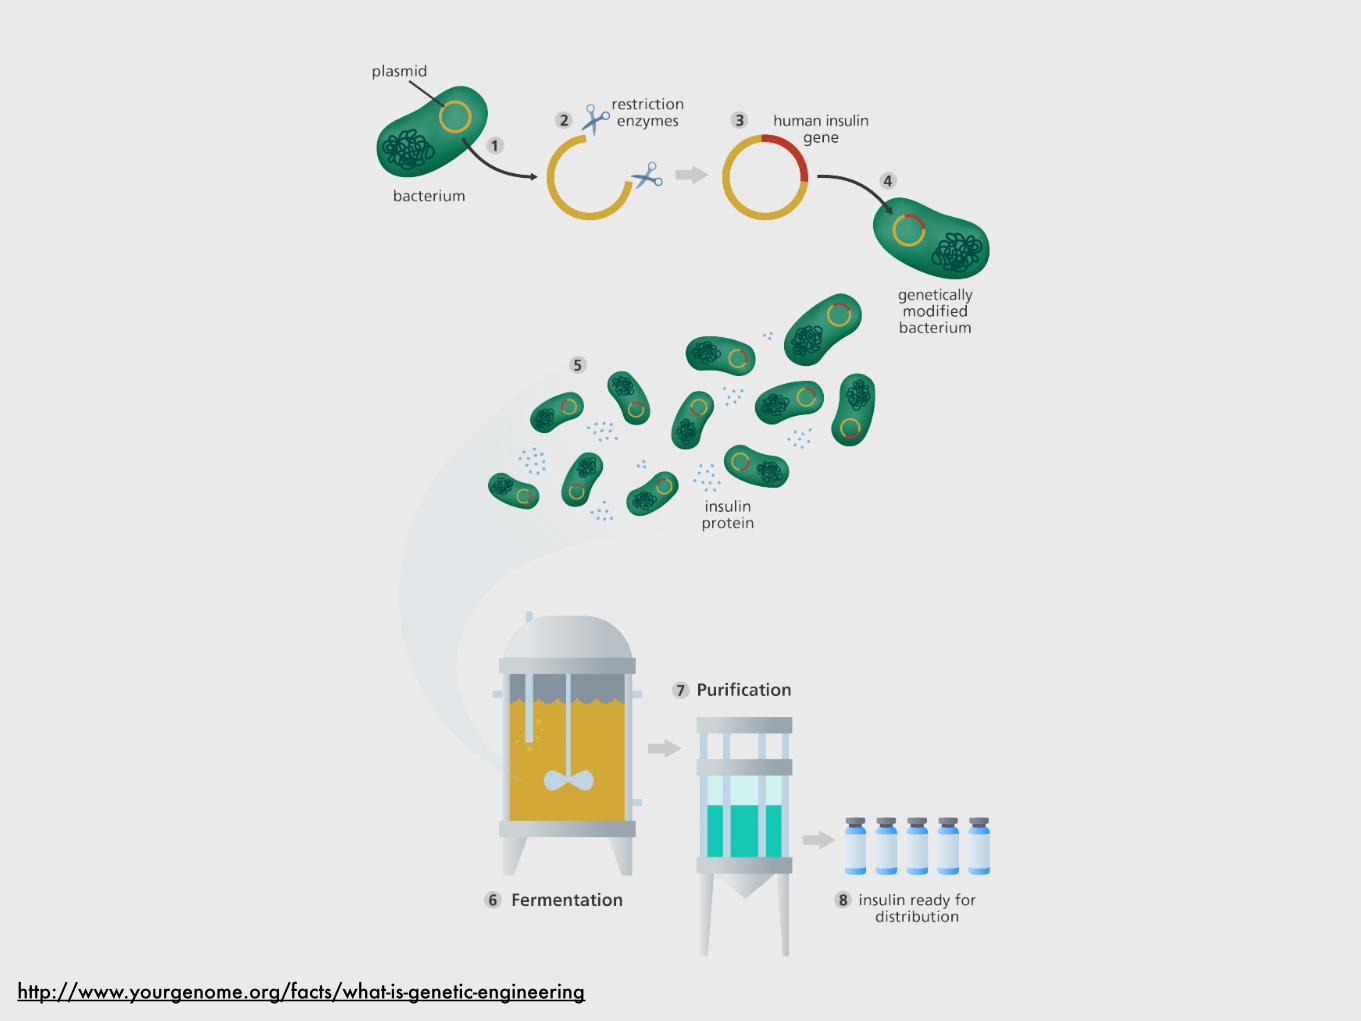
http://www.yourgenome.org/facts/what-is-genetic-engineering
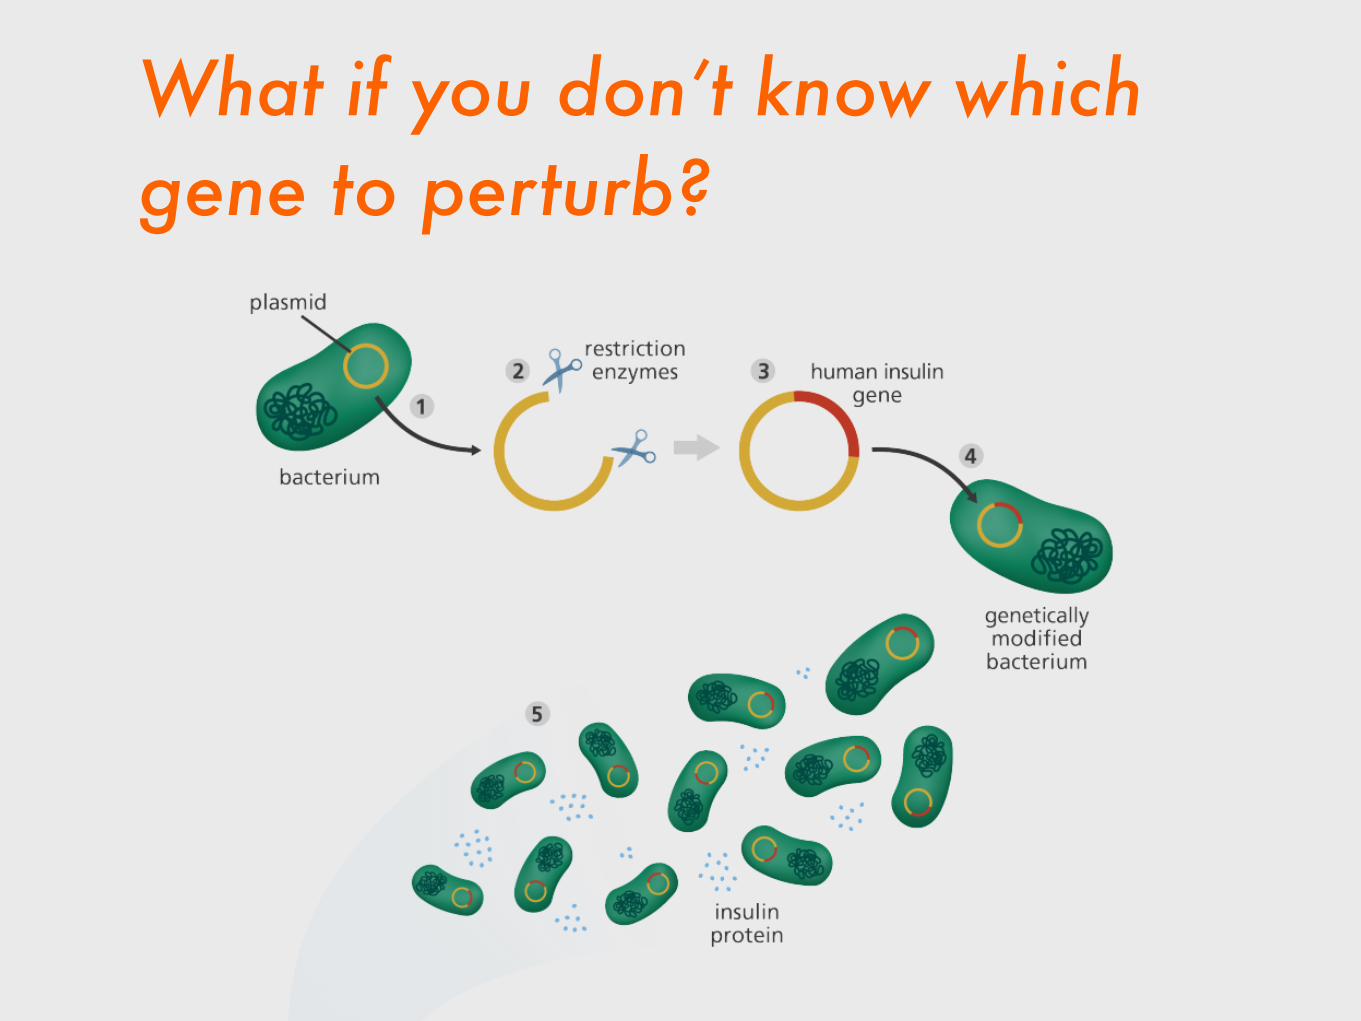
What if you don’t know which gene to perturb?
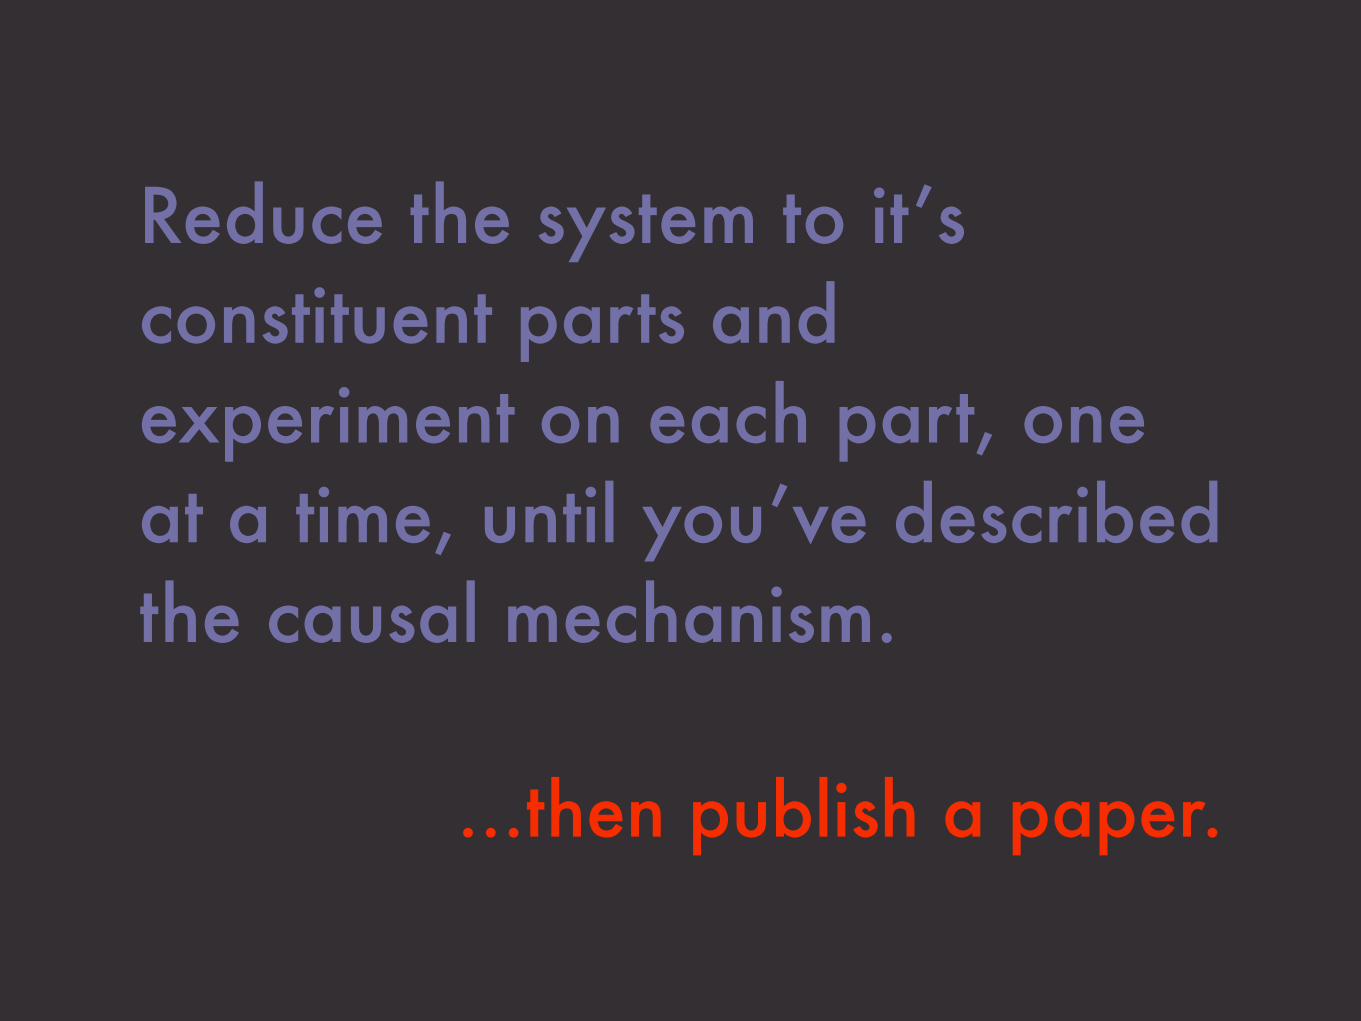
Reduce the system to it’s constituent parts and experiment on each part, one at a time, until you’ve described the causal mechanism.
…then publish a paper.

Try thousands of things and see what works.
High-throughput screening (HTS) is a process for evaluating many simultaneous hypotheses.
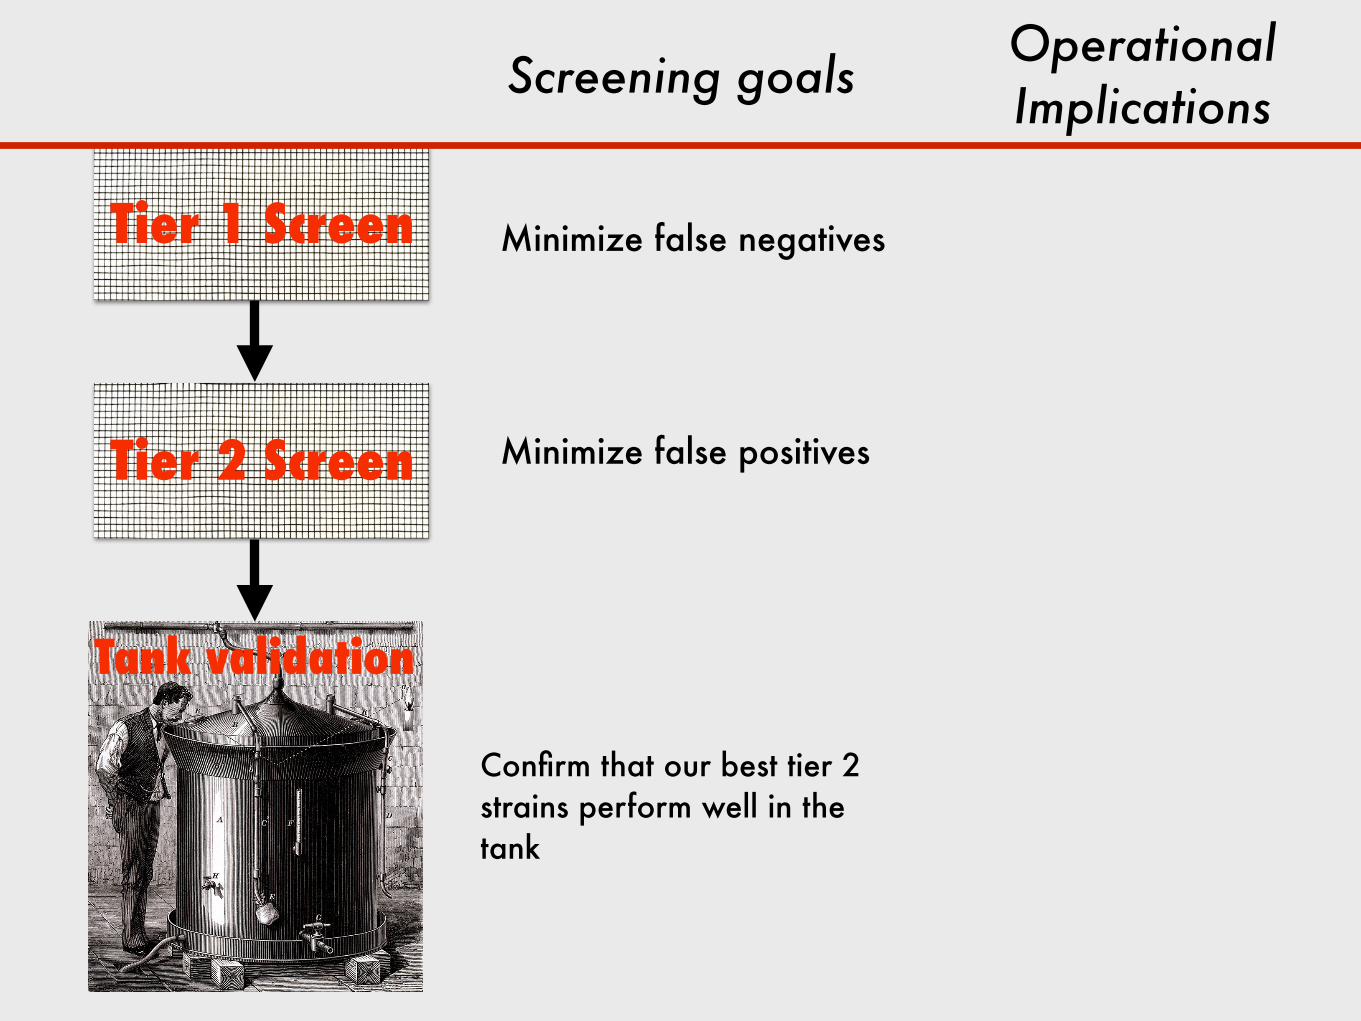
Tier 1 Screen
Tier 2 Screen
Tank validation
Screening goals
Minimize false negatives
Minimize false positives
Confirm that our best tier 2 strains perform well in the tank
Operational Implications
HTS poses two unique challenges: 1. low sample size 2. high variance
Small sample size
This is largely intentional. We know most things don’t work, so why waste resources on a gamble?
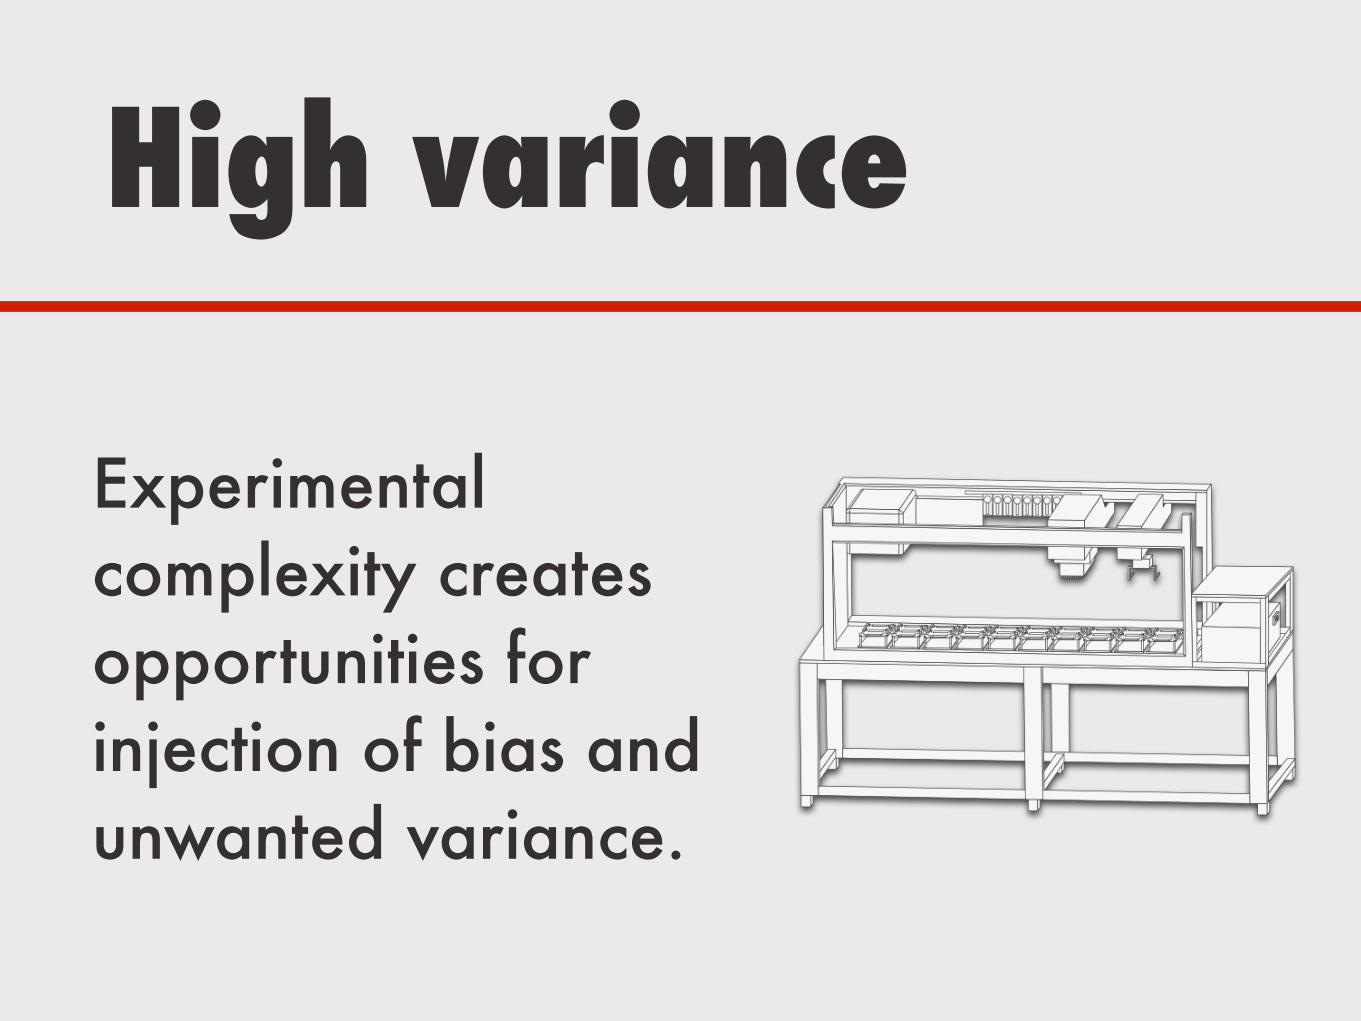
High variance
Experimental complexity creates opportunities for injection of bias and unwanted variance.
😓
• Many classical statistical methods assume normality and common variance—which we can’t assume.
• We need to be especially thoughtful in designing our tests.
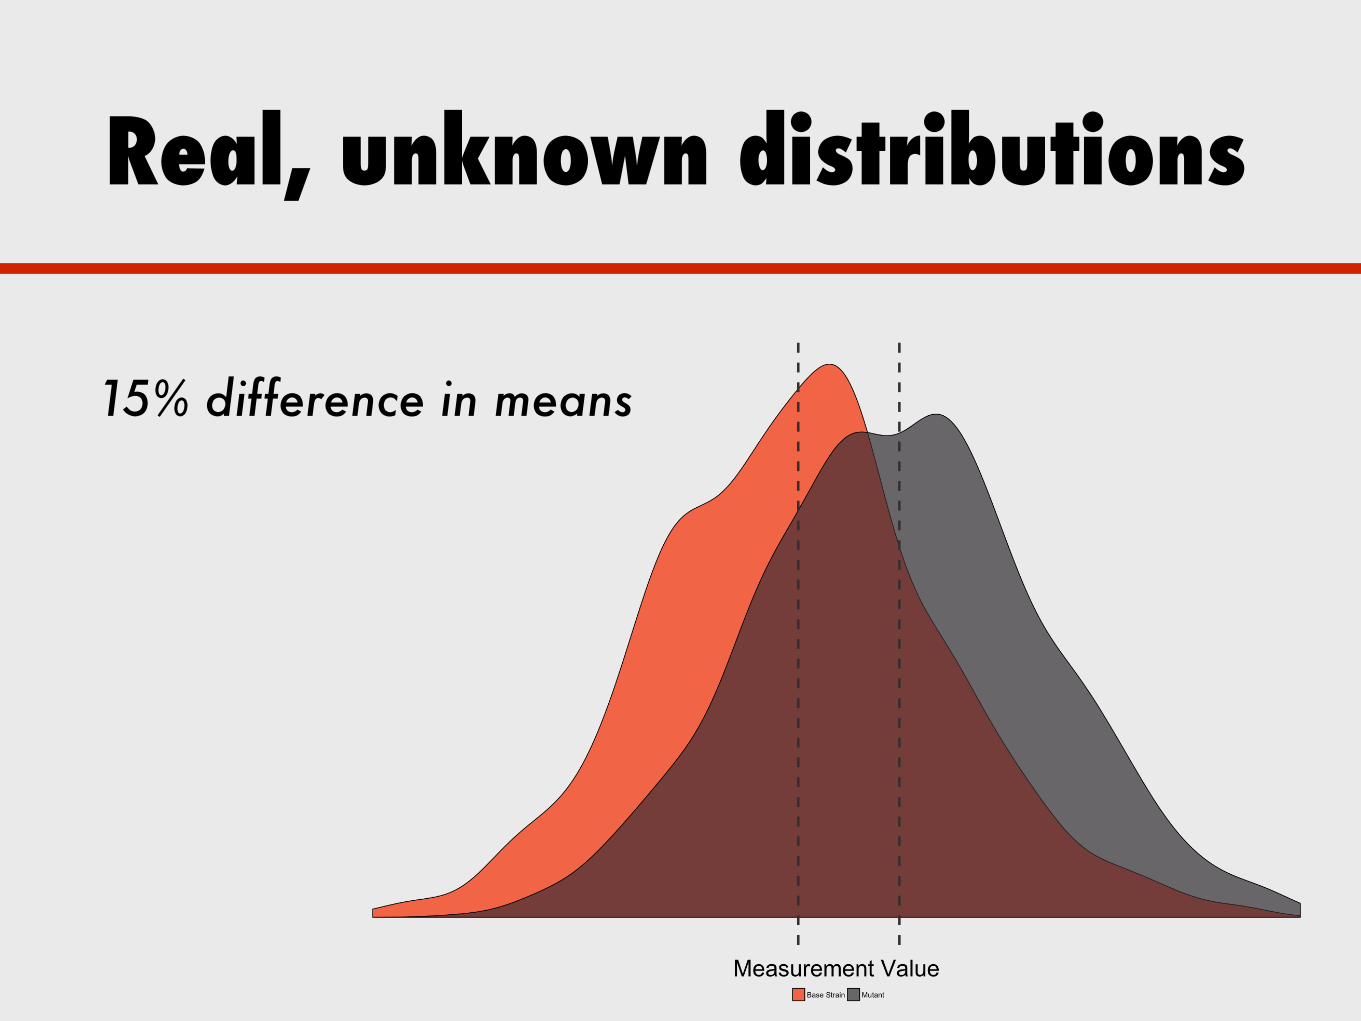
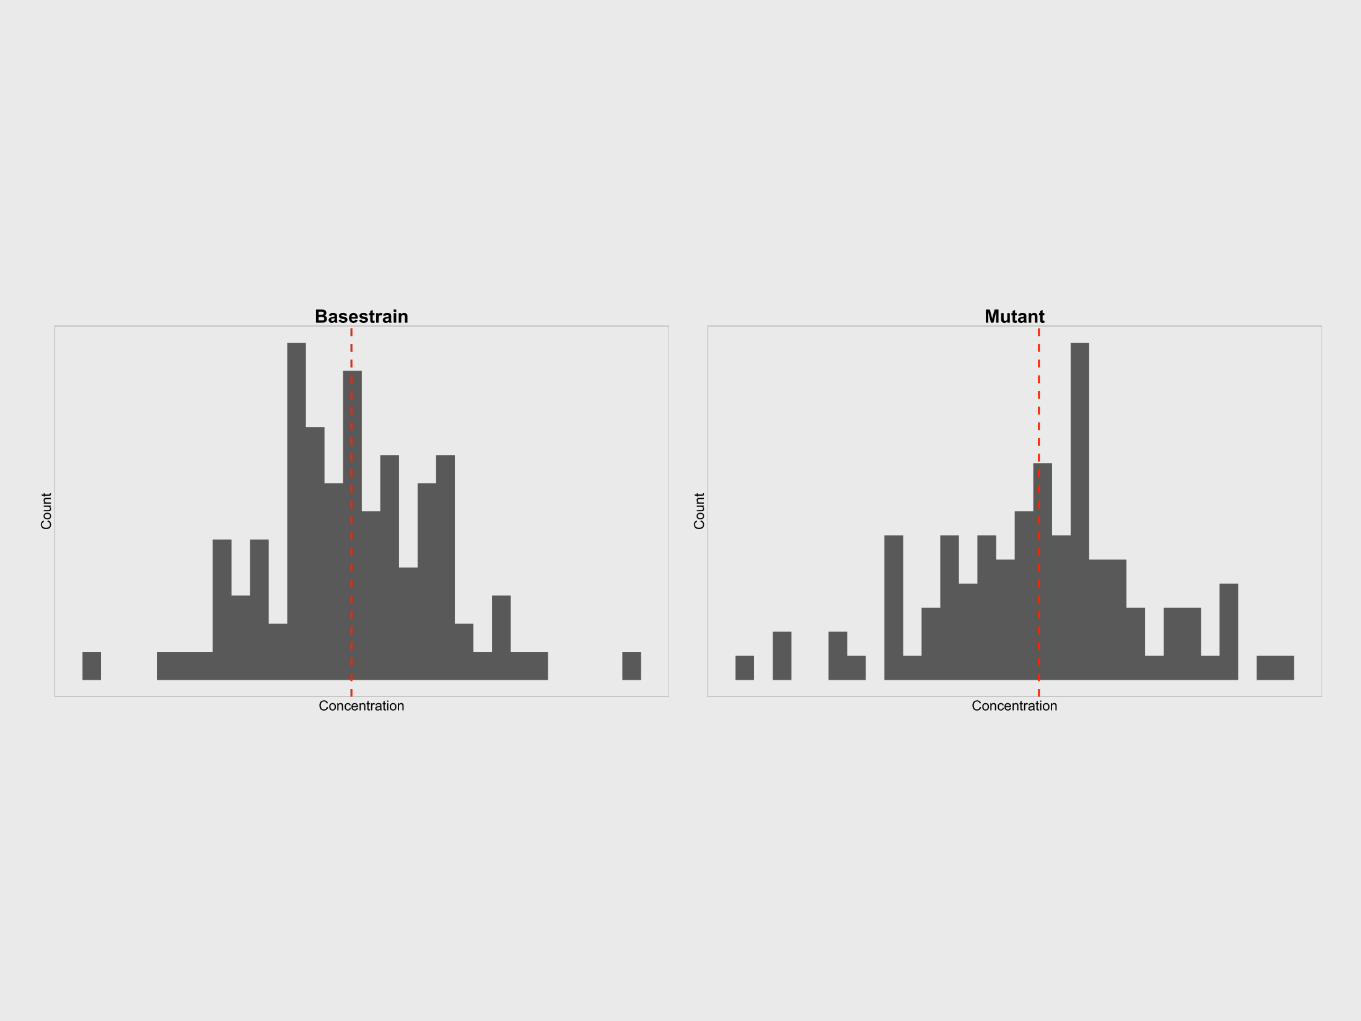
Real, unknown distributions
15% difference in means
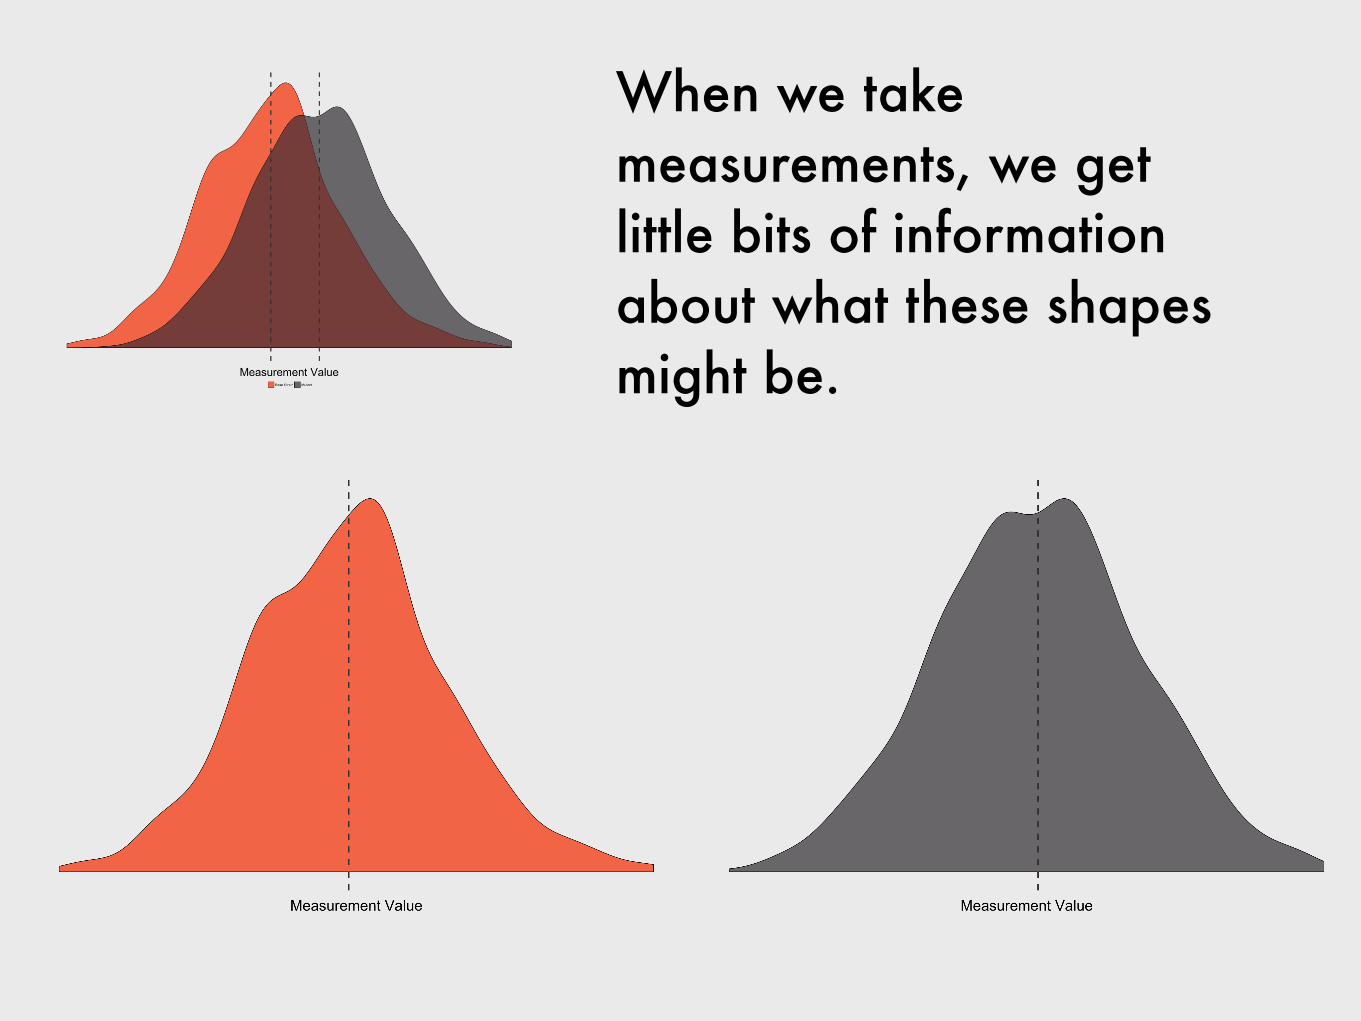
When we take measurements, we get little bits of information about what these shapes might be.
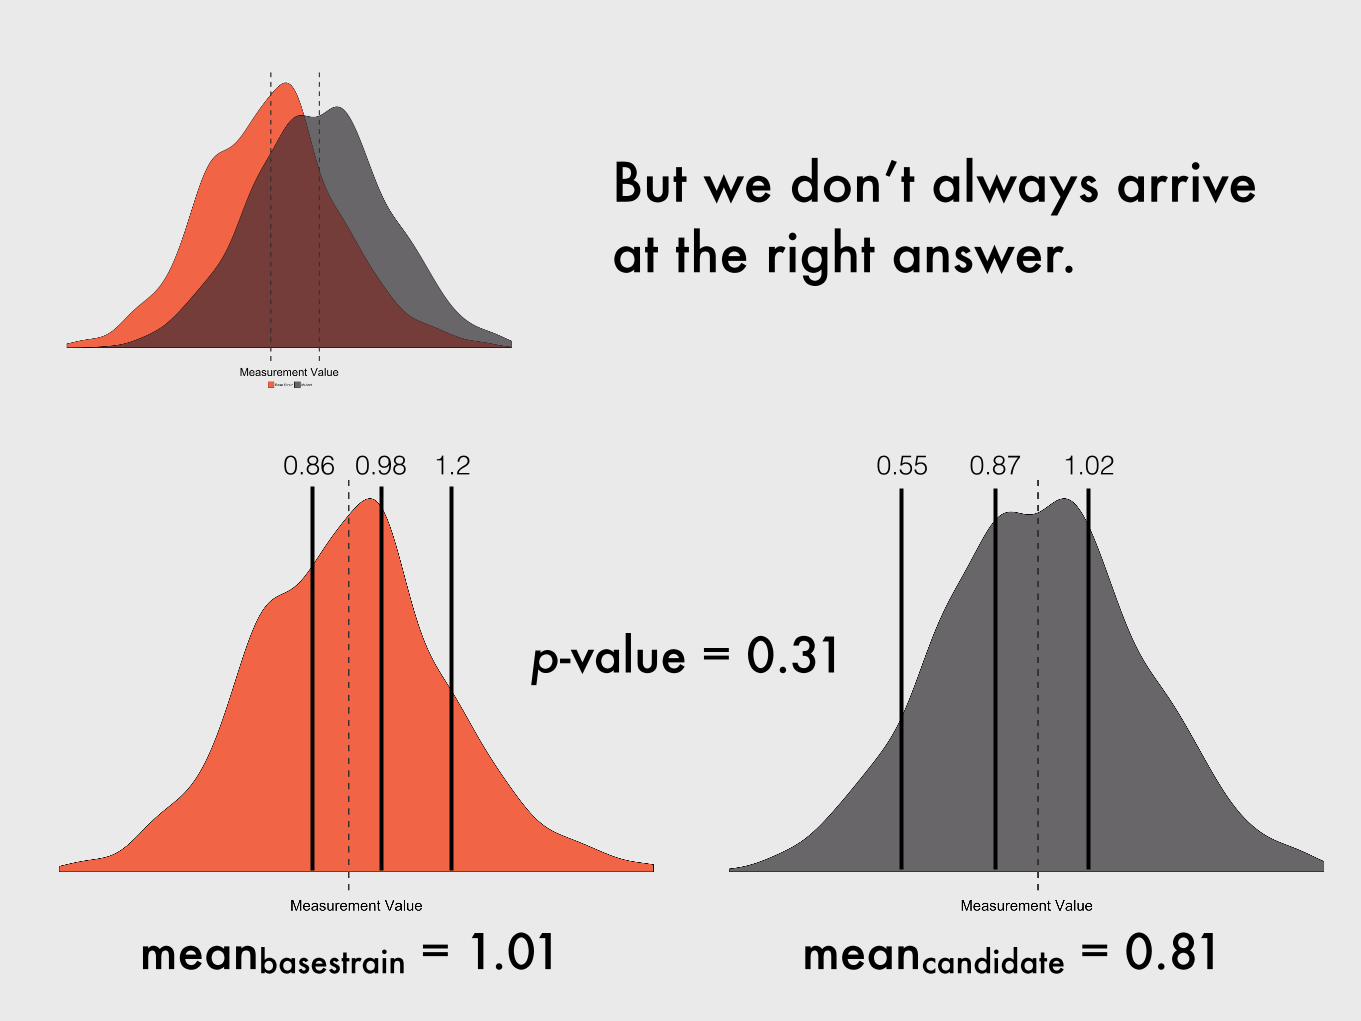
But we don’t always arrive at the right answer.
0.86 0.98 1.2
meanbasestrain = 1.01 meancandidate = 0.81
0.55 0.87 1.02
p-value = 0.31
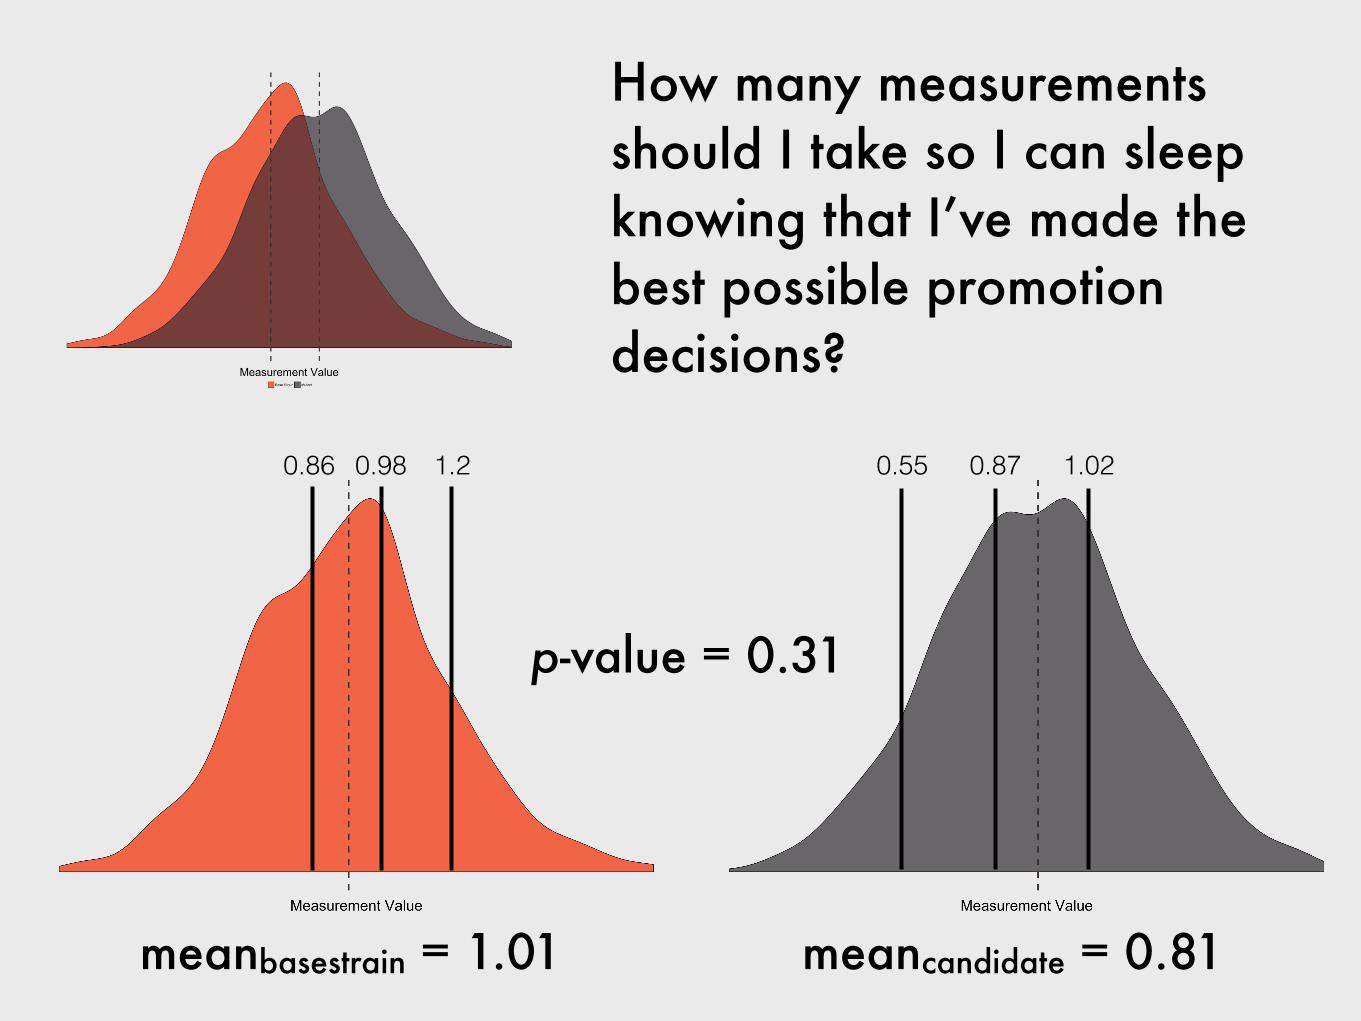
0.86 0.98 1.2
meanbasestrain = 1.01 meancandidate = 0.81
0.55 0.87 1.02
How many measurements should I take so I can sleep knowing that I’ve made the best possible promotion decisions?
p-value = 0.31
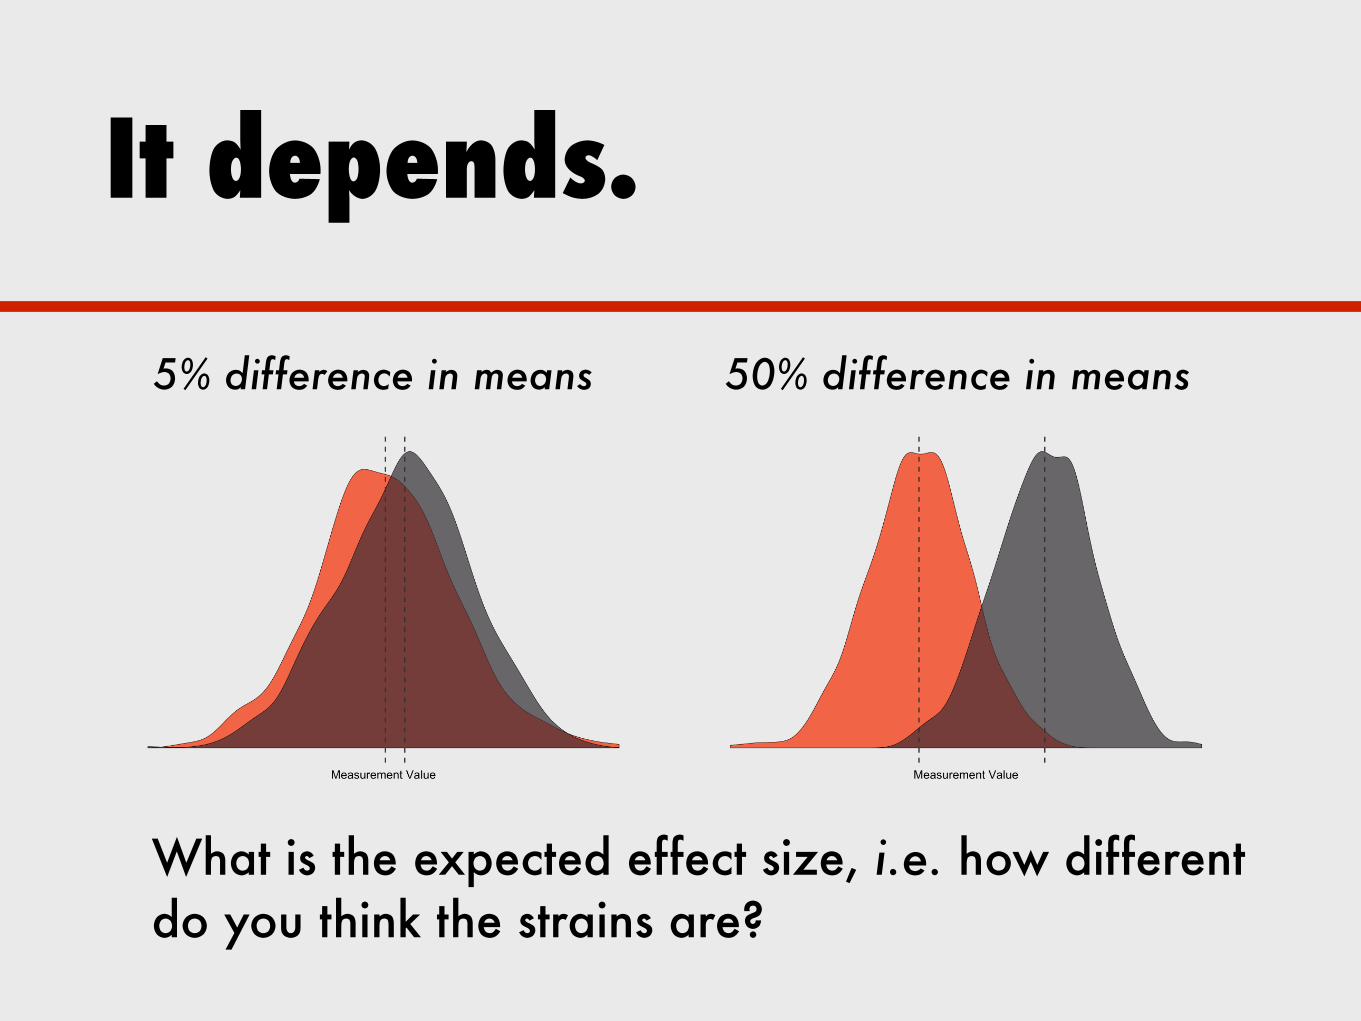
It depends.
What is the expected effect size, i.e. how different do you think the strains are?
5% difference in means 50% difference in means
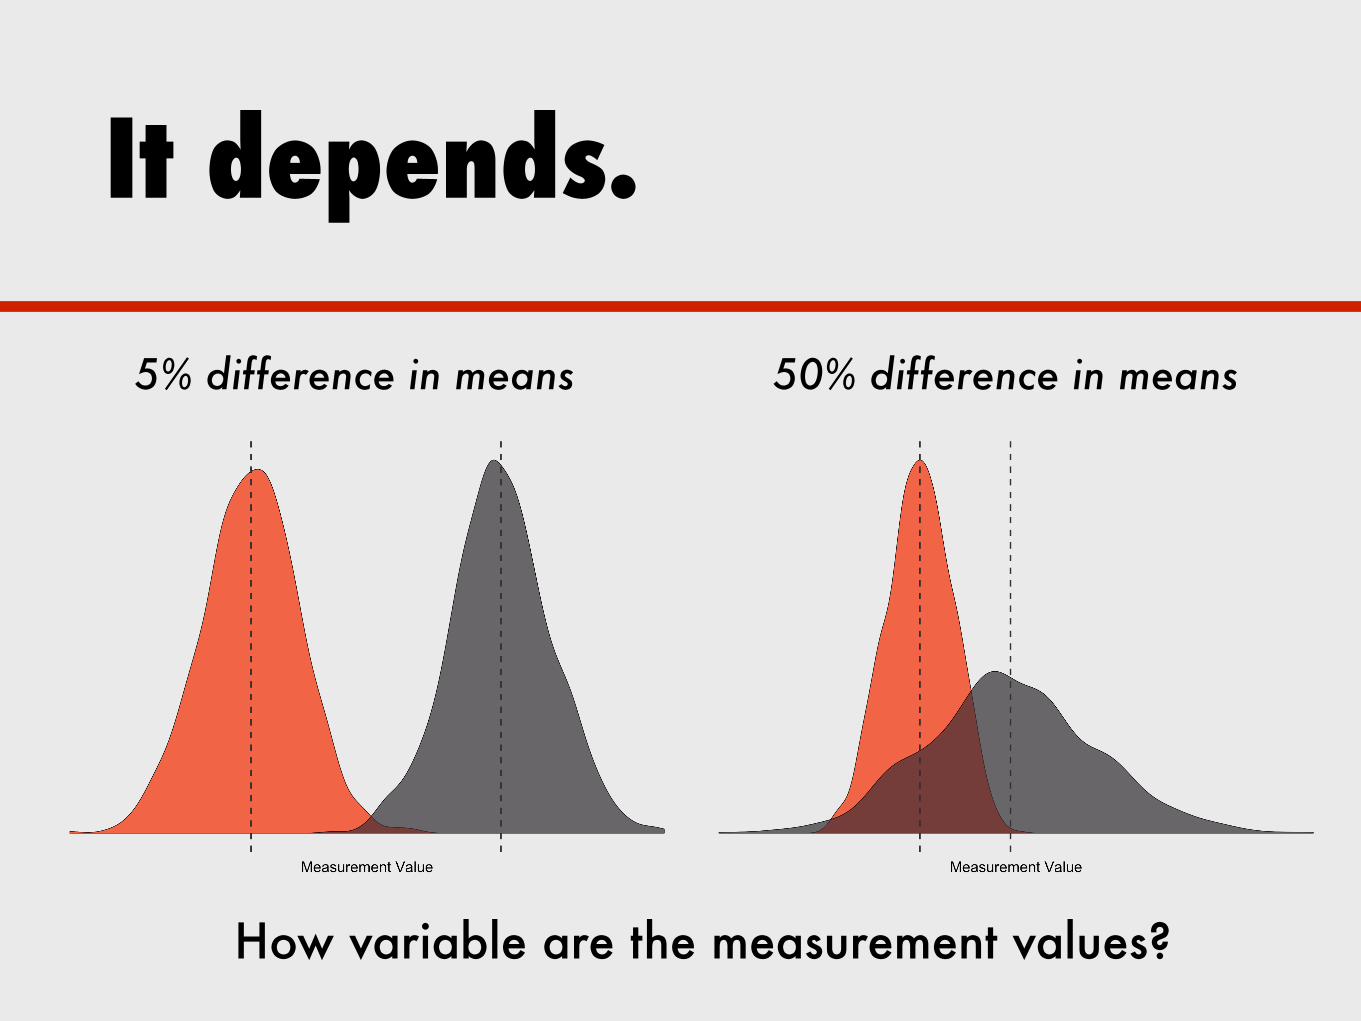
How variable are the measurement values?
It depends.
5% difference in means 50% difference in means
Power analysis
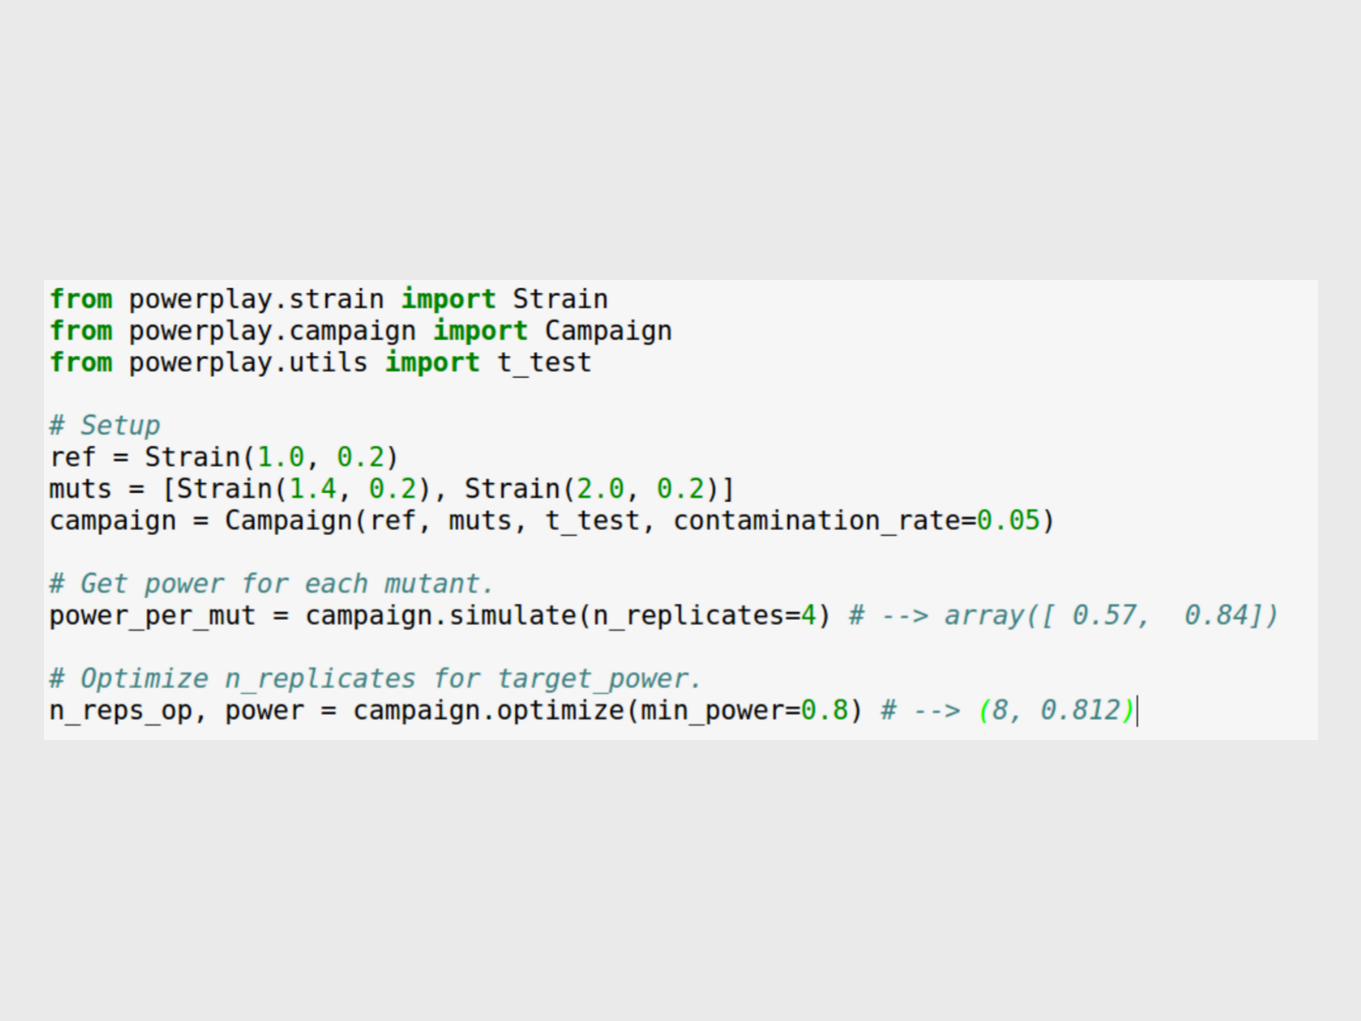
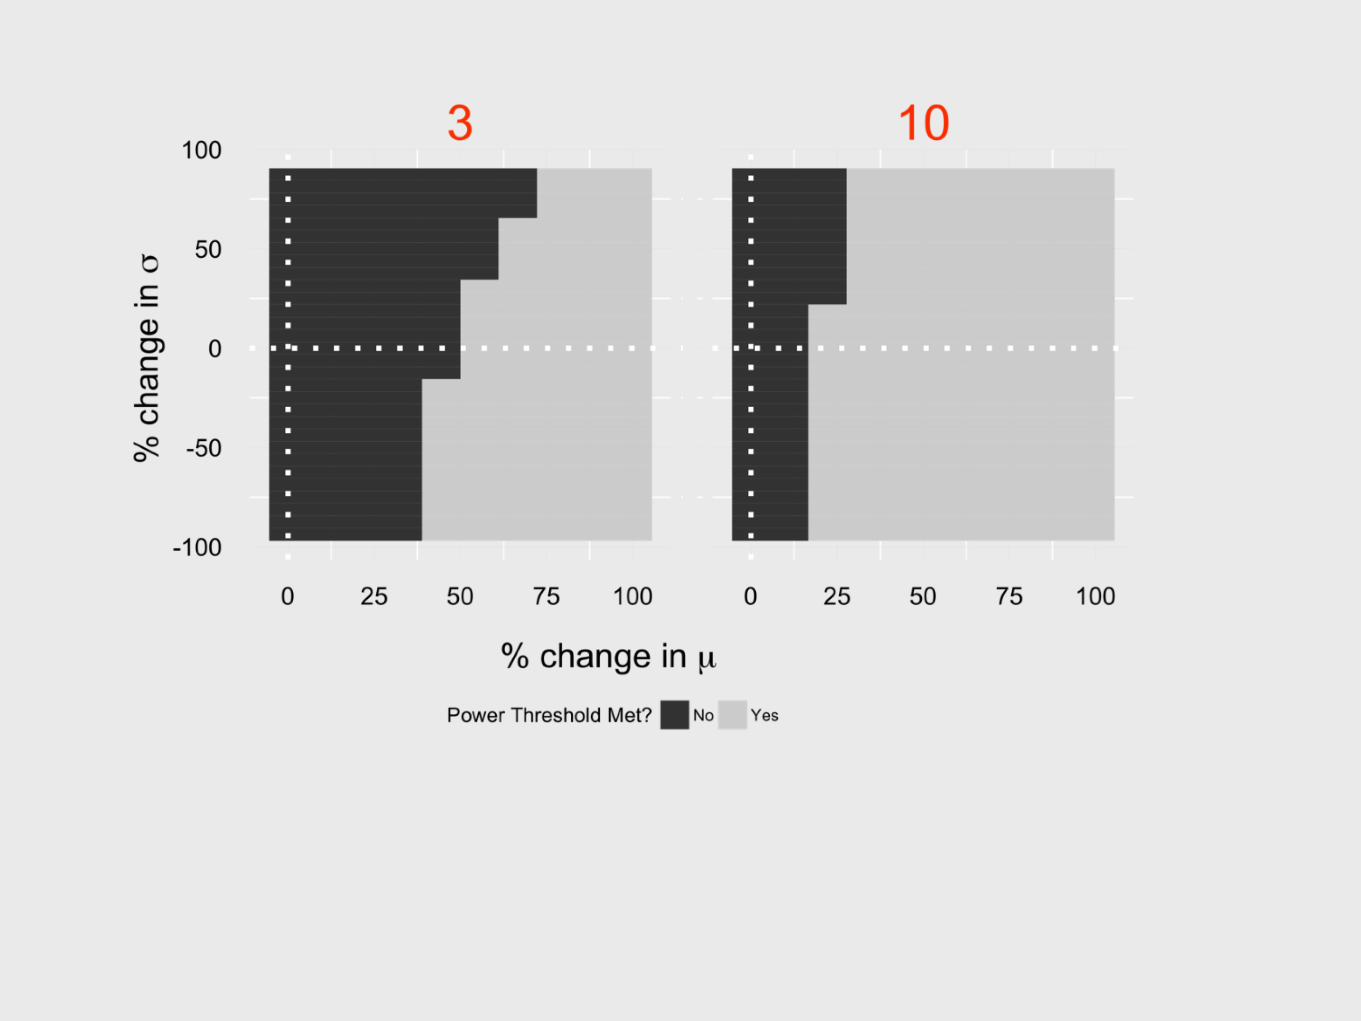
• Power analysis is a method for estimating the sample size required to detect changes at assumed levels.
• Power is the probability of detecting a difference, when a difference is present.
• We compute it through simulation.
Power is a fixed parameter
The power threshold is set at 0.80, meaning if we run the same experiment 100 times, we can expect to detect differences in means at least 80 out of those 100 times.
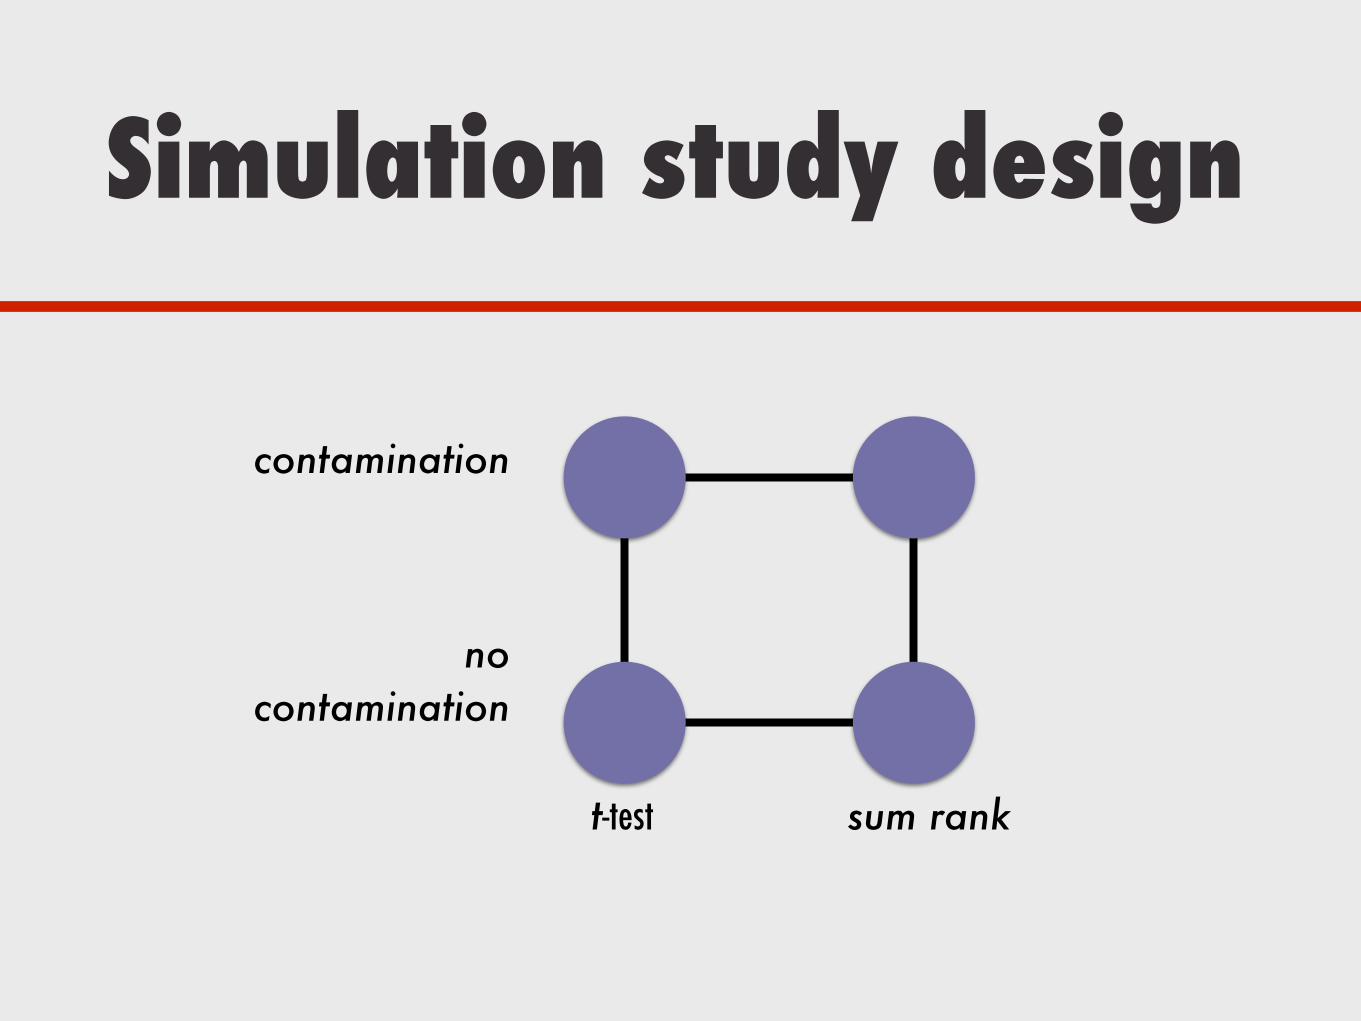
Simulation study design
t-test sum rank
contamination
no contamination
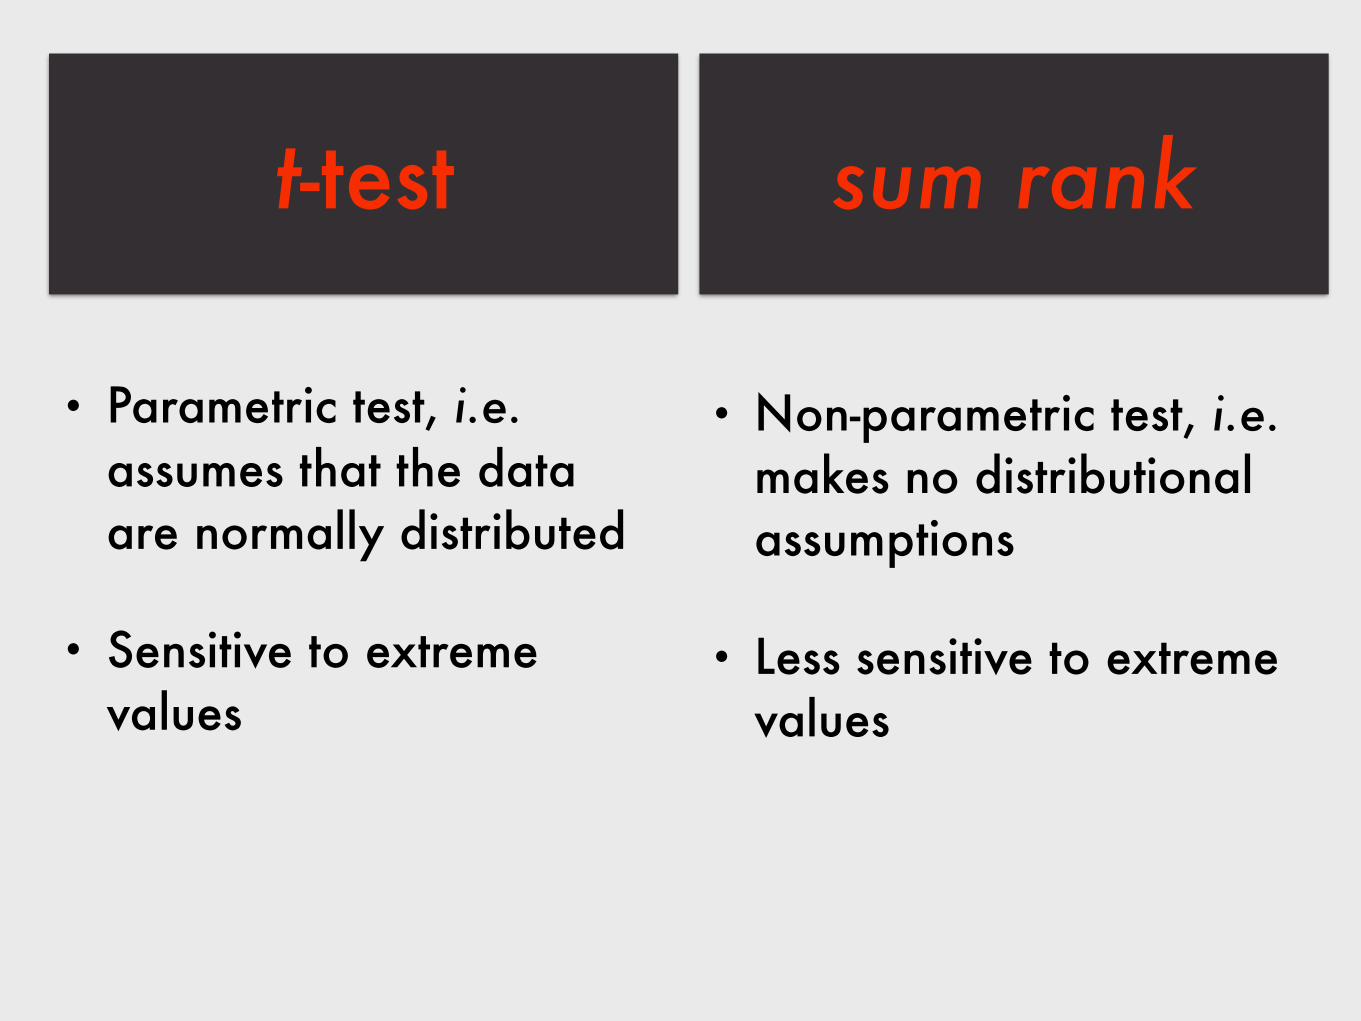
• Parametric test, i.e. assumes that the data are normally distributed
• Sensitive to extreme values
• Non-parametric test, i.e. makes no distributional assumptions
• Less sensitive to extreme values
t-test sum rank
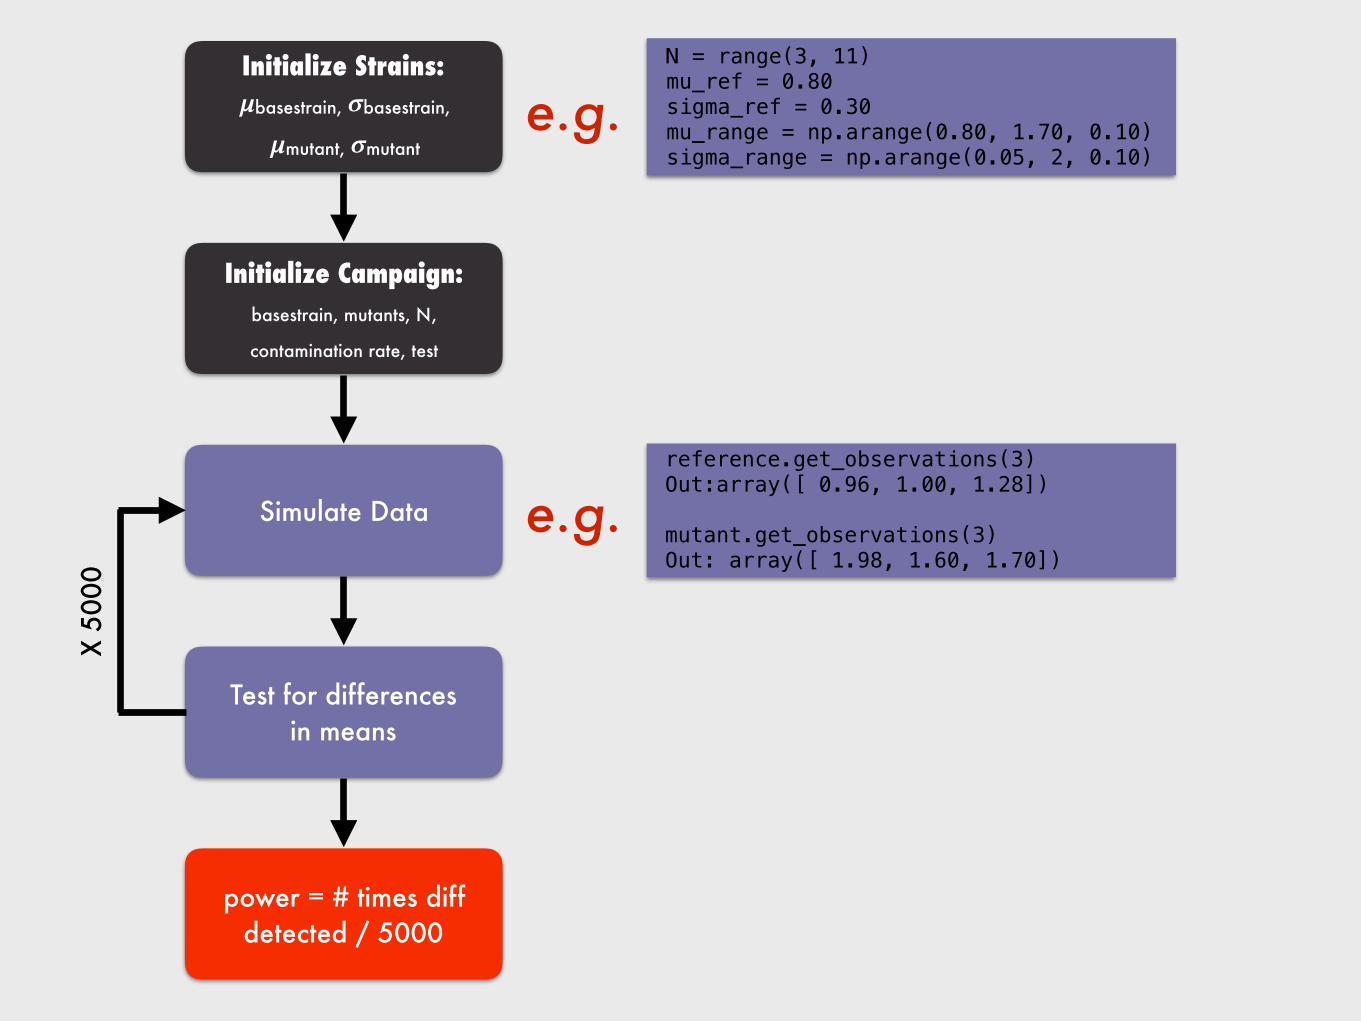
Initialize Strains: 𝝁basestrain, 𝝈basestrain,
𝝁mutant, 𝝈mutant
Initialize Campaign: basestrain, mutants, N,
contamination rate, test
Simulate Data
Test for differences in means
X 50
00
power = # times diff detected / 5000
N = range(3, 11) mu_ref = 0.80 sigma_ref = 0.30 mu_range = np.arange(0.80, 1.70, 0.10) sigma_range = np.arange(0.05, 2, 0.10)
reference.get_observations(3) Out:array([ 0.96, 1.00, 1.28])
mutant.get_observations(3) Out: array([ 1.98, 1.60, 1.70])
e.g.
e.g.
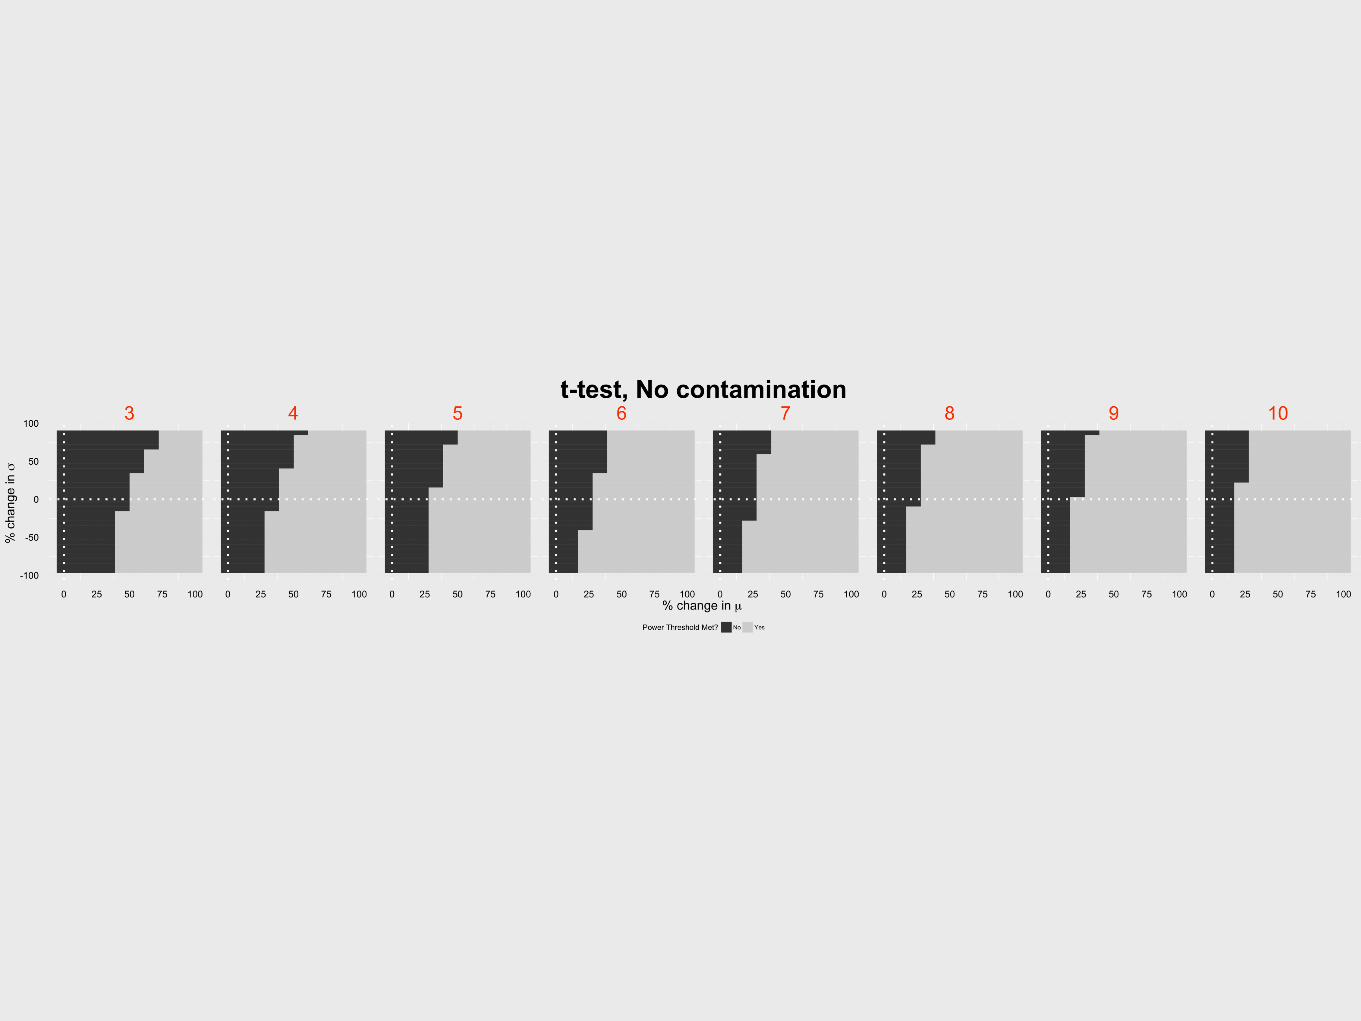
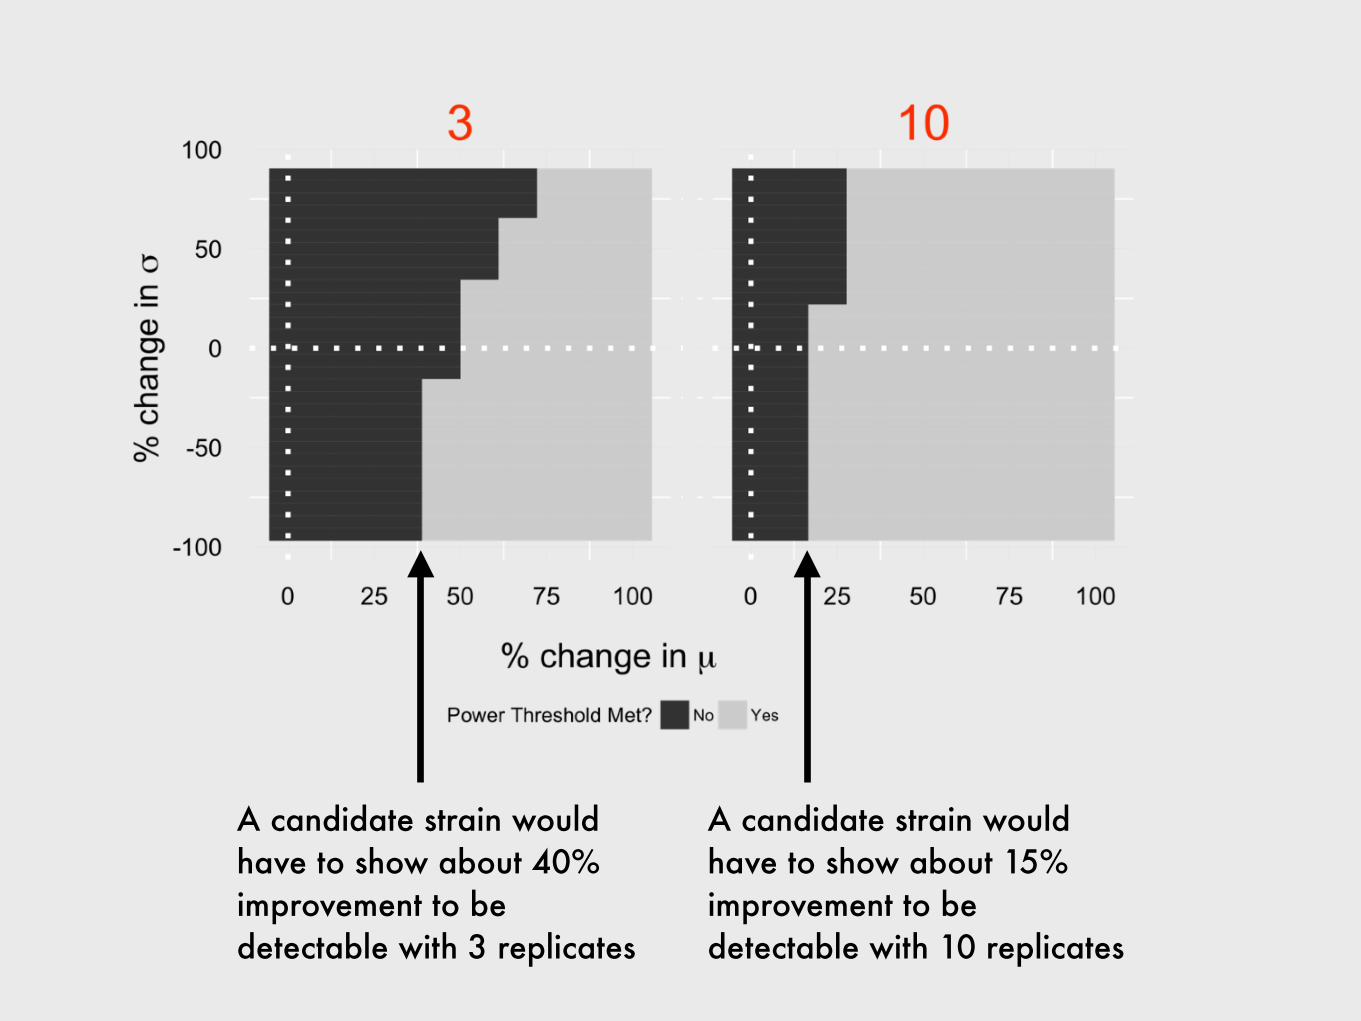
A candidate strain would have to show about 40% improvement to be detectable with 3 replicates
A candidate strain would have to show about 15% improvement to be detectable with 10 replicates
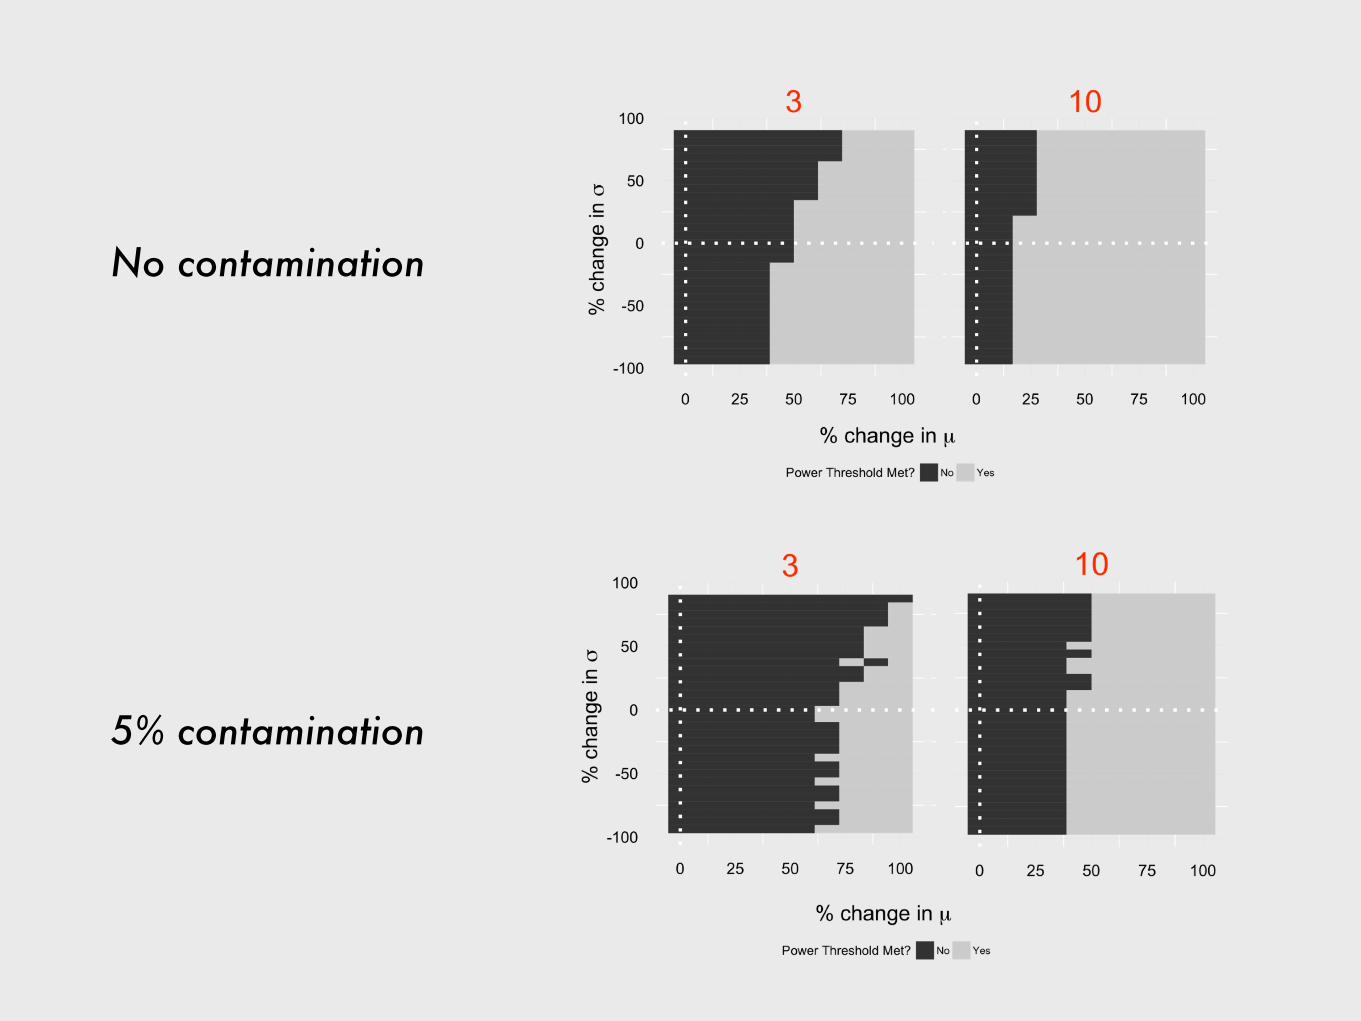
No contamination
5% contamination
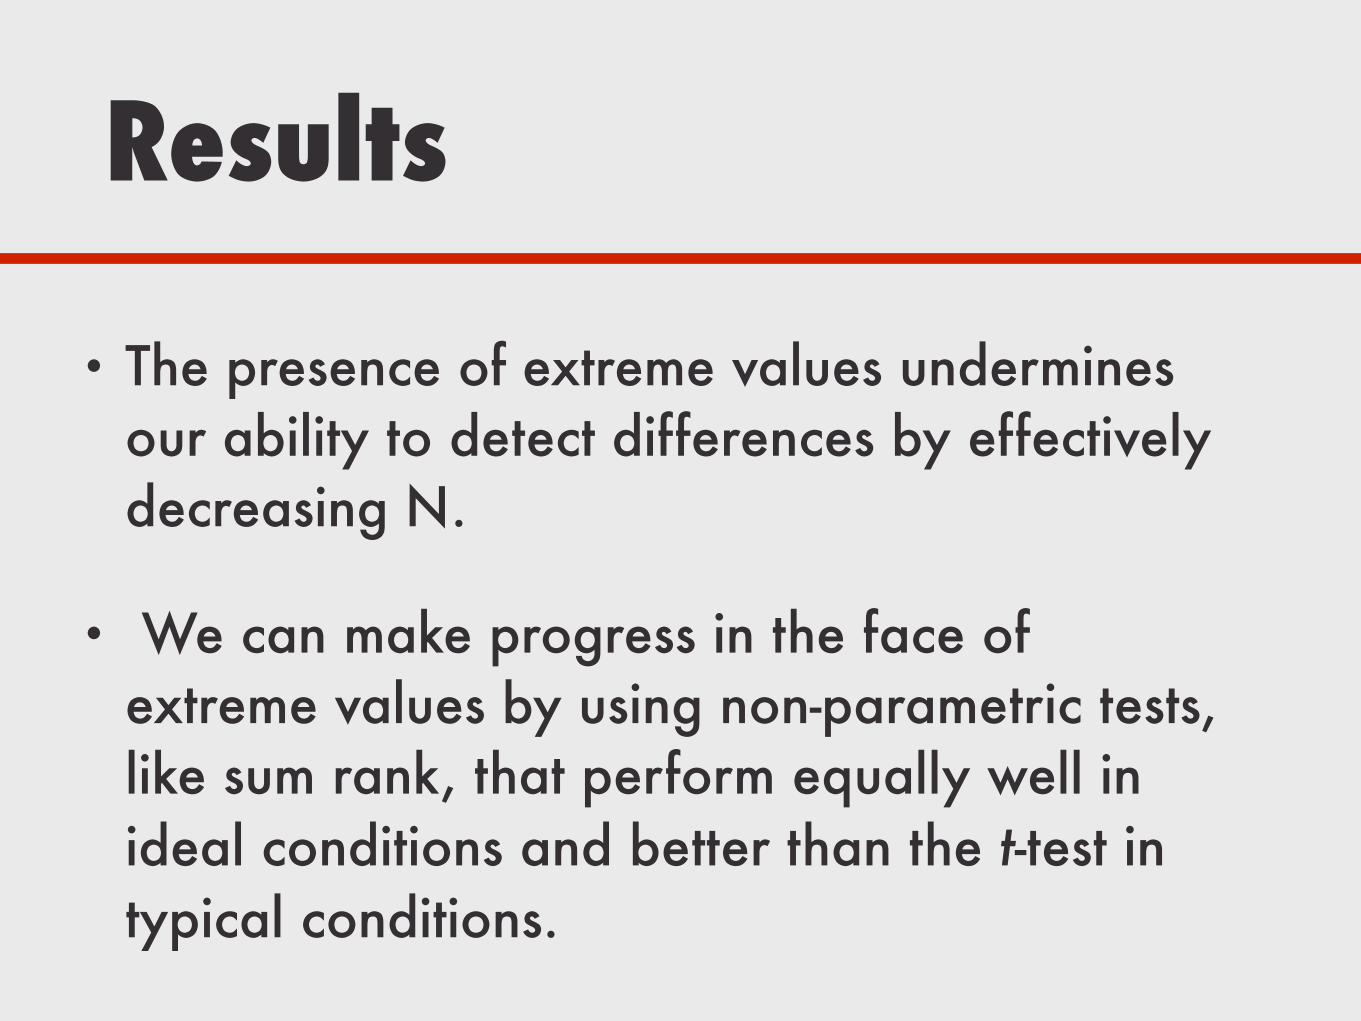
Results
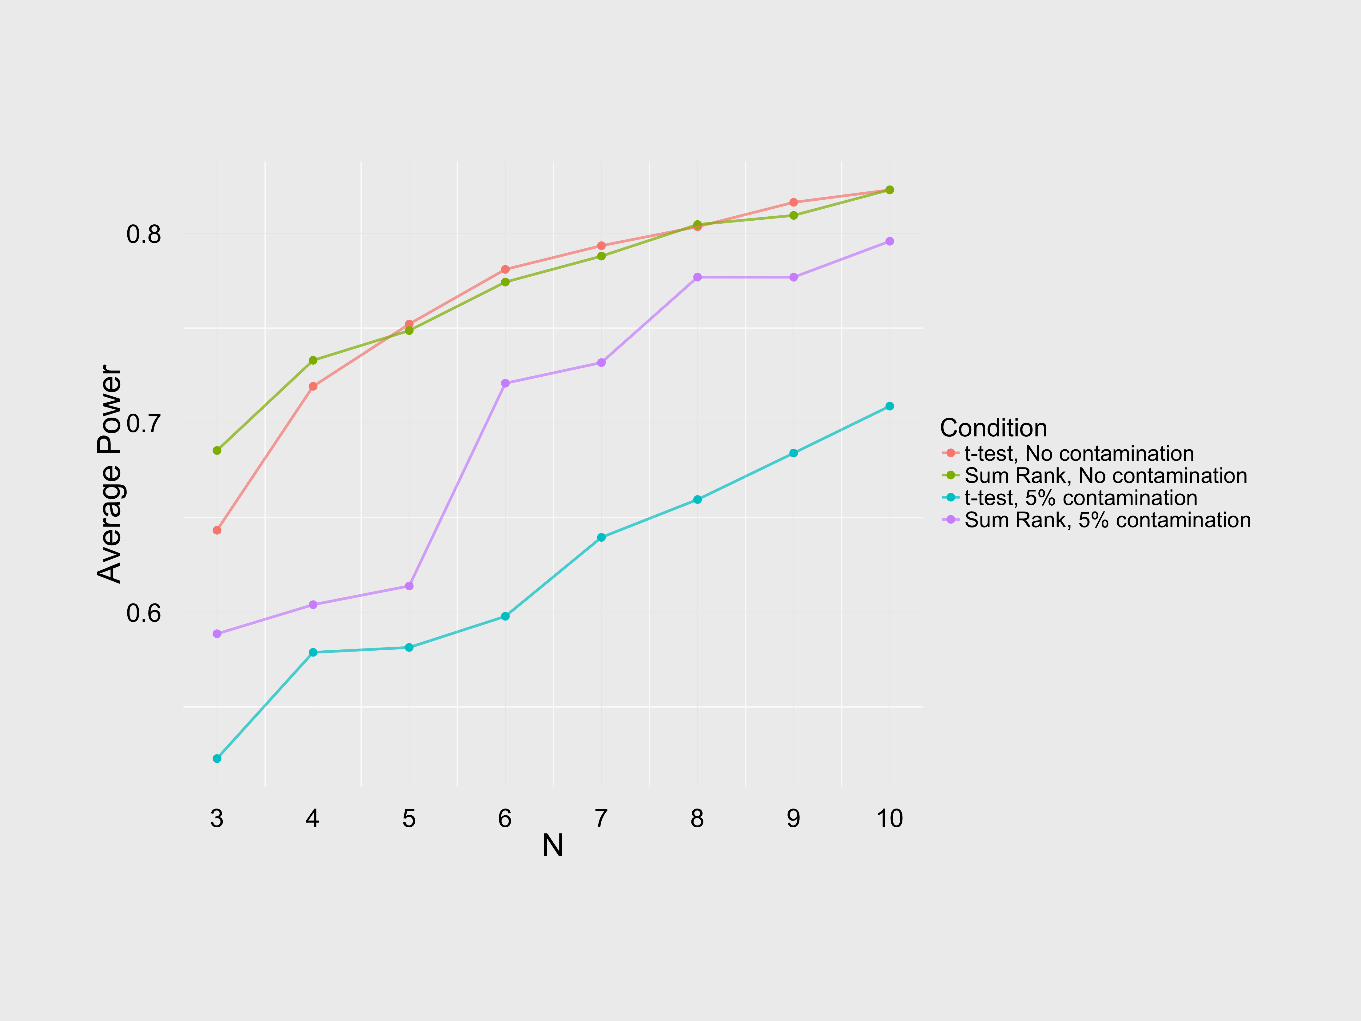
• The presence of extreme values undermines our ability to detect differences by effectively decreasing N.
• We can make progress in the face of extreme values by using non-parametric tests, like sum rank, that perform equally well in ideal conditions and better than the t-test in typical conditions.
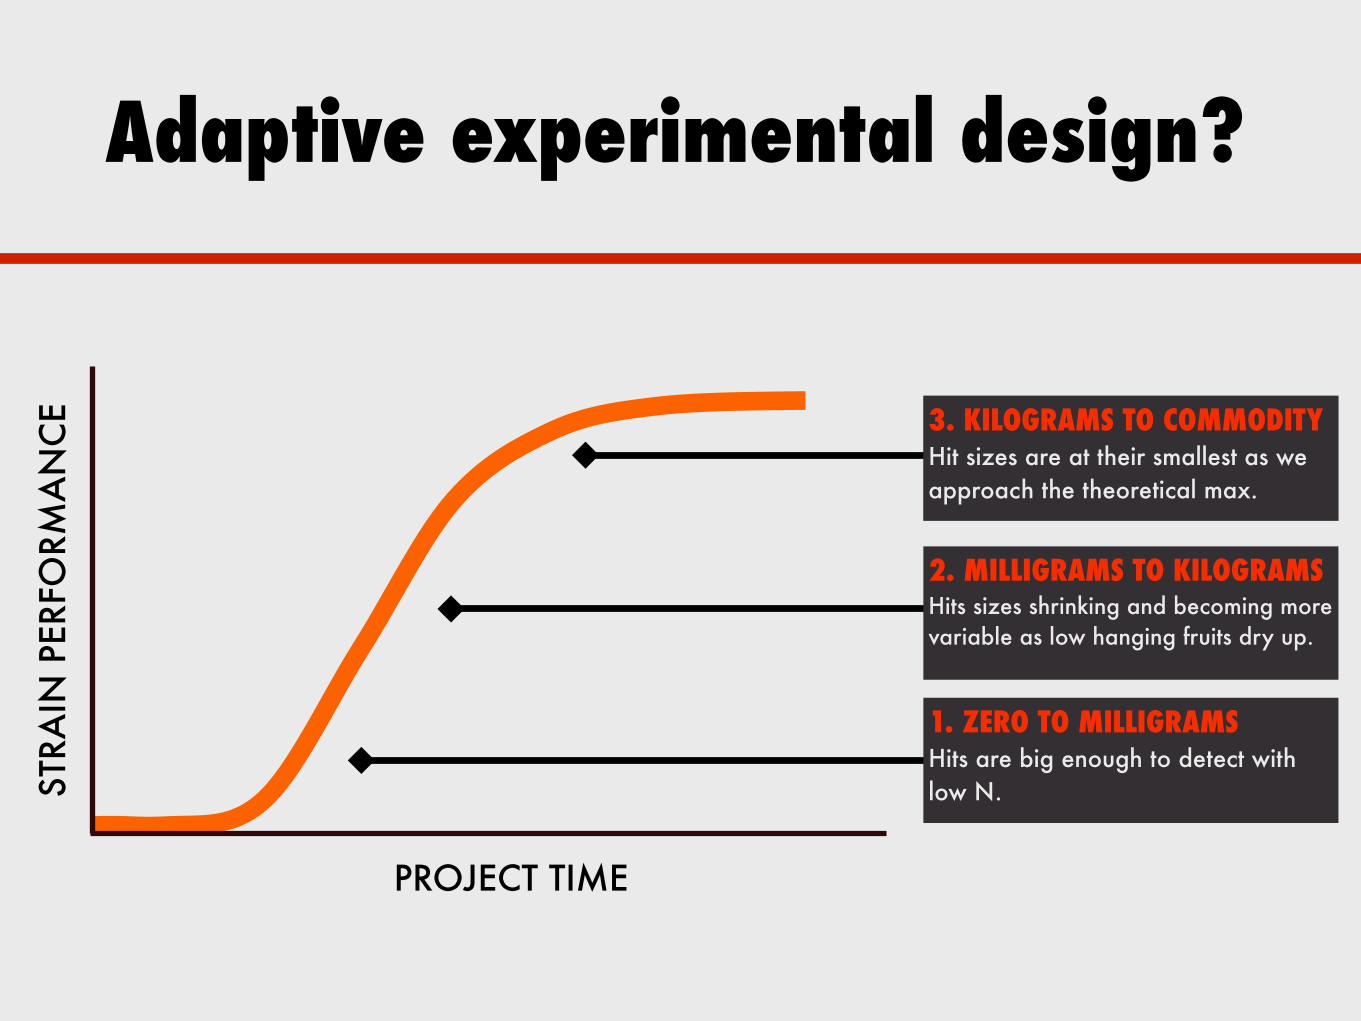
Adaptive experimental design?ST
RAIN
PER
FORM
AN
CE
PROJECT TIME
1. ZERO TO MILLIGRAMS Hits are big enough to detect with low N.
2. MILLIGRAMS TO KILOGRAMS Hits sizes shrinking and becoming more variable as low hanging fruits dry up.
3. KILOGRAMS TO COMMODITY Hit sizes are at their smallest as we approach the theoretical max.
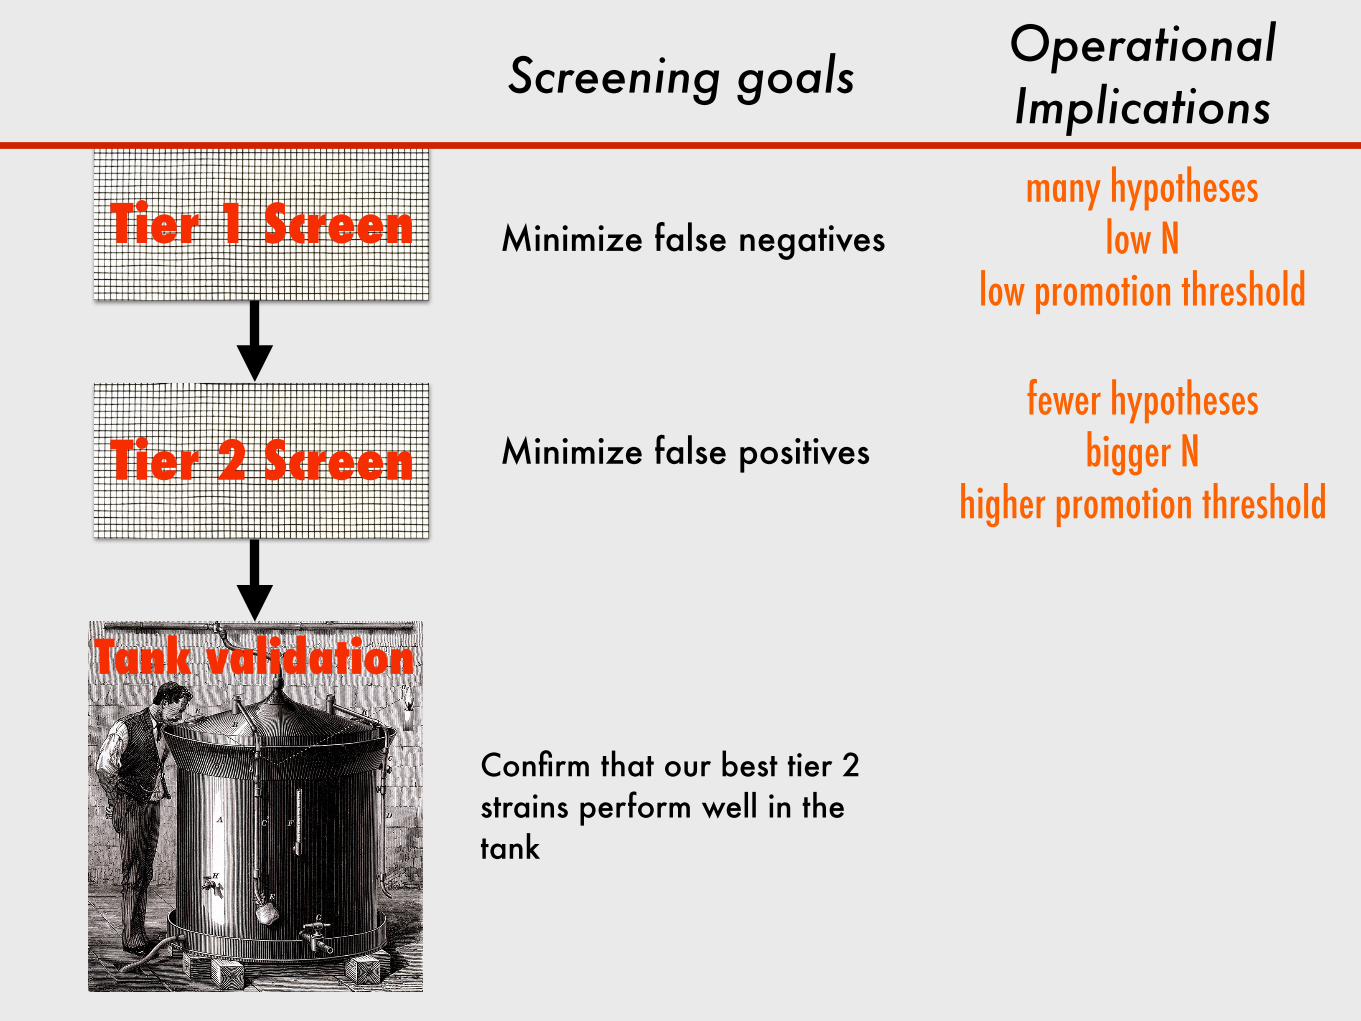
Tier 1 Screen
Tier 2 Screen
Tank validation
Screening goals
Minimize false negatives
Minimize false positives
Confirm that our best tier 2 strains perform well in the tank
many hypotheses low N
low promotion threshold
fewer hypotheses bigger N
higher promotion threshold
Operational Implications
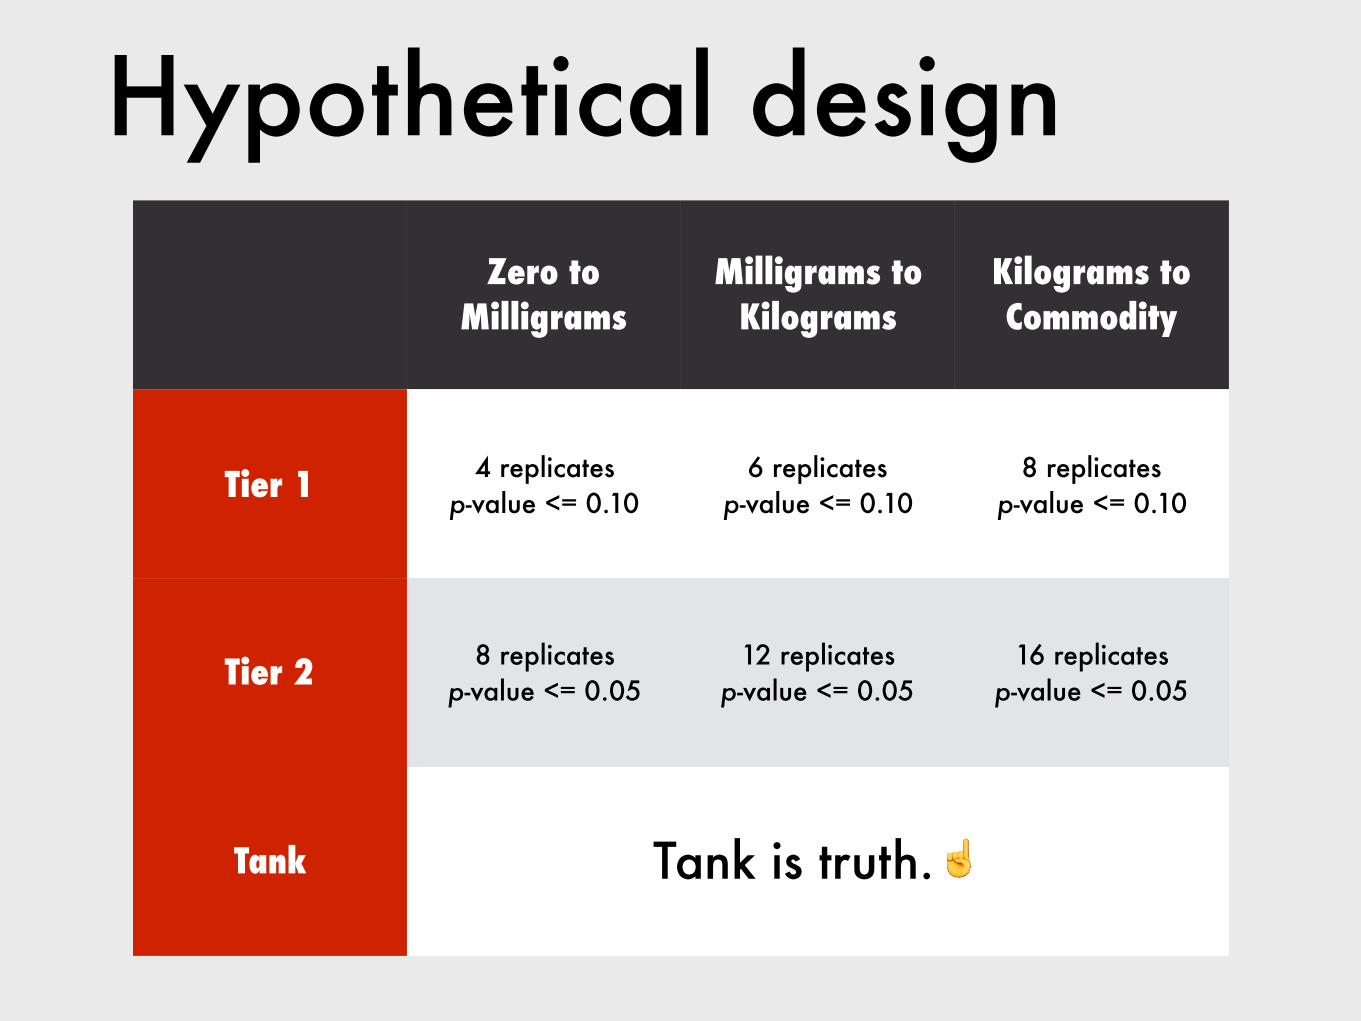
Zero to Milligrams
Milligrams to Kilograms
Kilograms to Commodity
Tier 1 4 replicates p-value <= 0.10
6 replicates p-value <= 0.10
8 replicates p-value <= 0.10
Tier 2 8 replicates p-value <= 0.05
12 replicates p-value <= 0.05
16 replicates p-value <= 0.05
Tank Tank is truth.☝
Hypothetical design

Thanks for listening! Questions?