Embed Size (px)
Citation preview
Chickpea seed road map of Ethiopia (2016-
2018) Tesfaye Geleta
TL-III project planning meeting
3-4 March, 2016
Livingstone, Zambia
Introduction
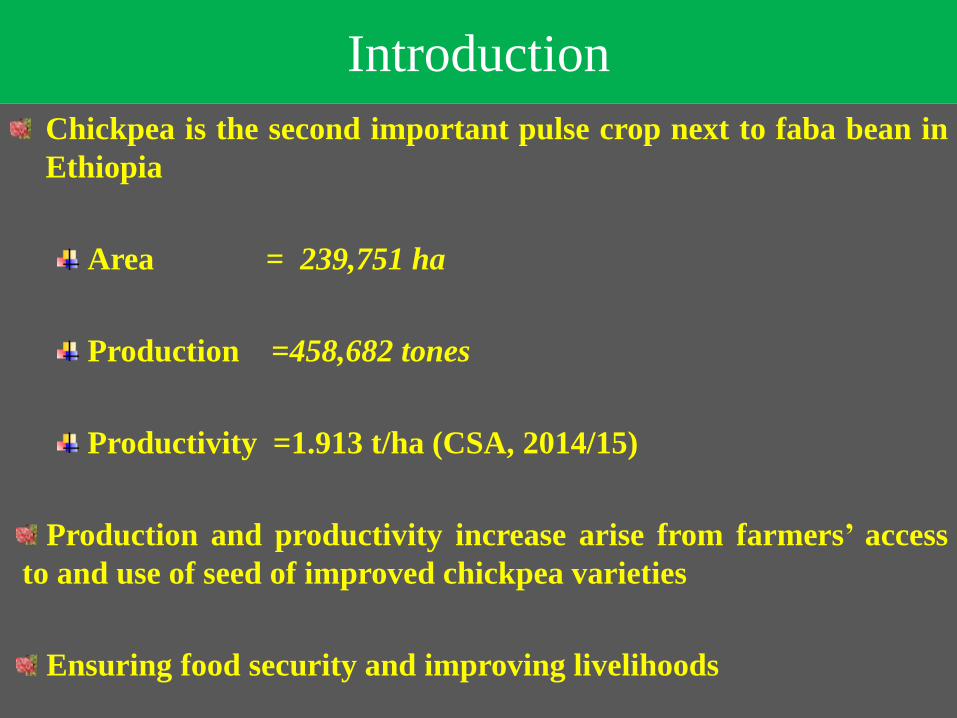
Chickpea is the second important pulse crop next to faba bean in
Ethiopia
Area = 239,751 ha
Production =458,682 tones
Productivity =1.913 t/ha (CSA, 2014/15)
Production and productivity increase arise from farmers’ access
to and use of seed of improved chickpea varieties
Ensuring food security and improving livelihoods
Introduction……….
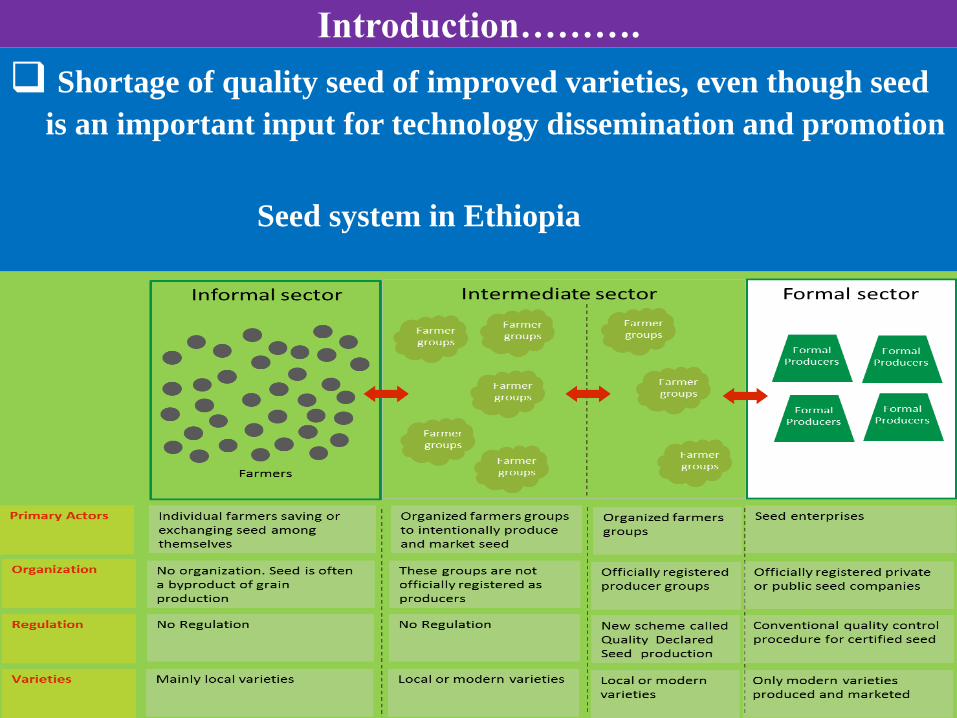
Shortage of quality seed of improved varieties, even though seed
is an important input for technology dissemination and promotion
Seed system in Ethiopia
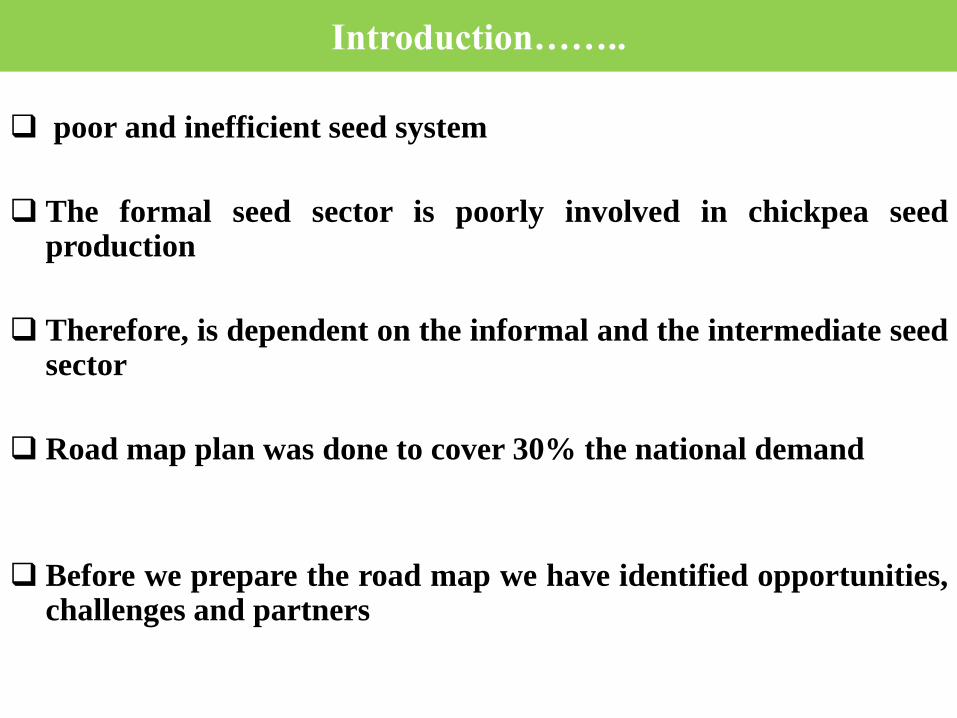
Introduction……..
poor and inefficient seed system
The formal seed sector is poorly involved in chickpea seed production
Therefore, is dependent on the informal and the intermediate seed sector
Road map plan was done to cover 30% the national demand
Before we prepare the road map we have identified opportunities, challenges and partners
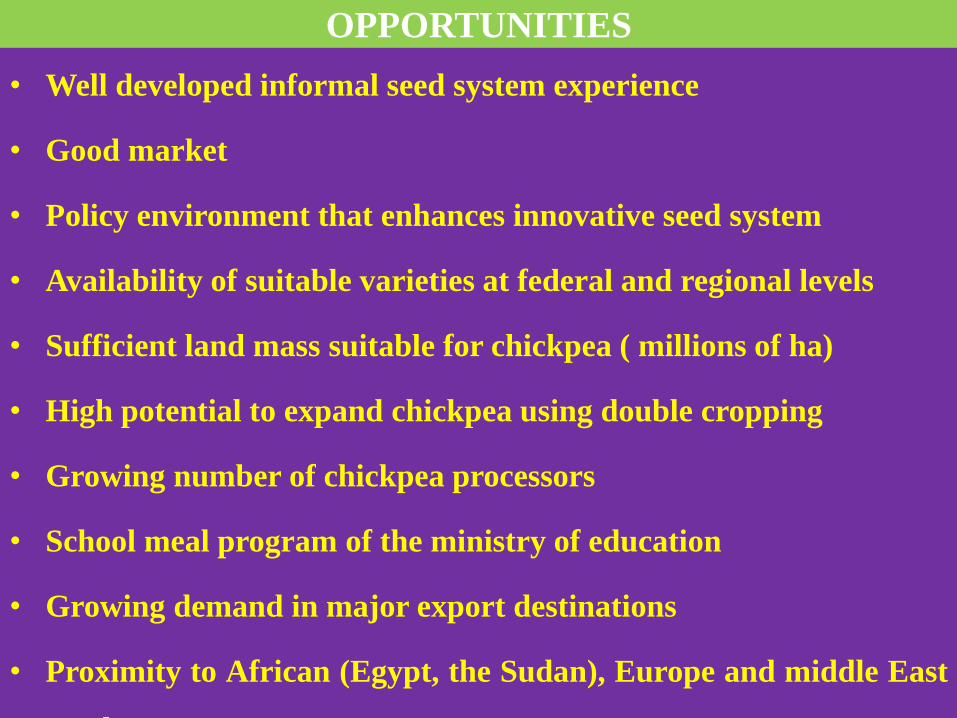
OPPORTUNITIES
• Well developed informal seed system experience
• Good market
• Policy environment that enhances innovative seed system
• Availability of suitable varieties at federal and regional levels
• Sufficient land mass suitable for chickpea ( millions of ha)
• High potential to expand chickpea using double cropping
• Growing number of chickpea processors
• School meal program of the ministry of education
• Growing demand in major export destinations
• Proximity to African (Egypt, the Sudan), Europe and middle East
markets
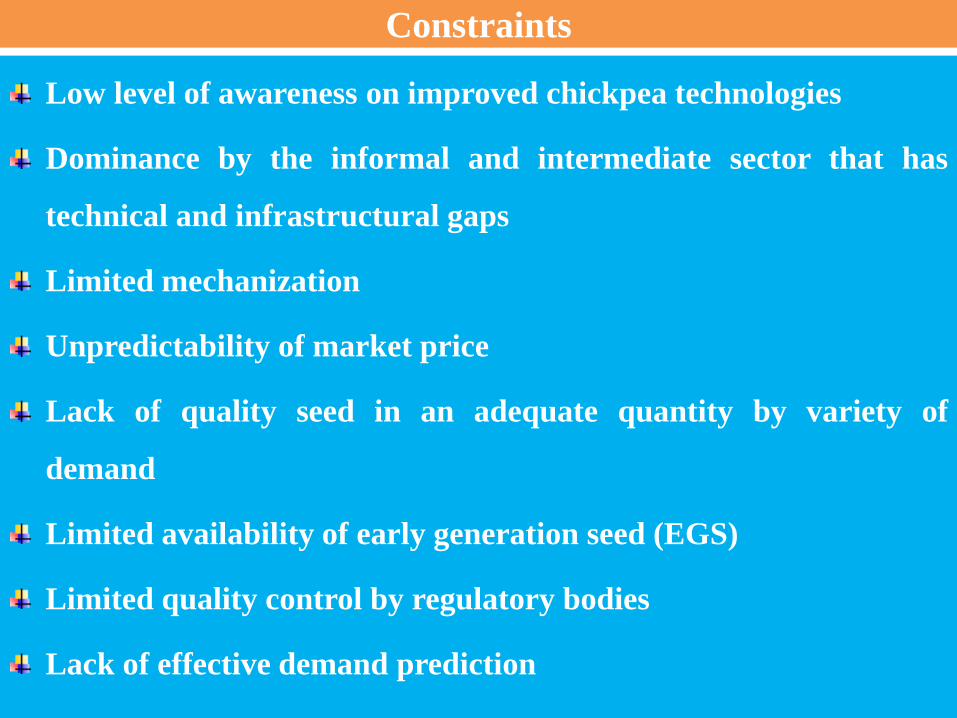
Constraints
Low level of awareness on improved chickpea technologies
Dominance by the informal and intermediate sector that has
technical and infrastructural gaps
Limited mechanization
Unpredictability of market price
Lack of quality seed in an adequate quantity by variety of
demand
Limited availability of early generation seed (EGS)
Limited quality control by regulatory bodies
Lack of effective demand prediction
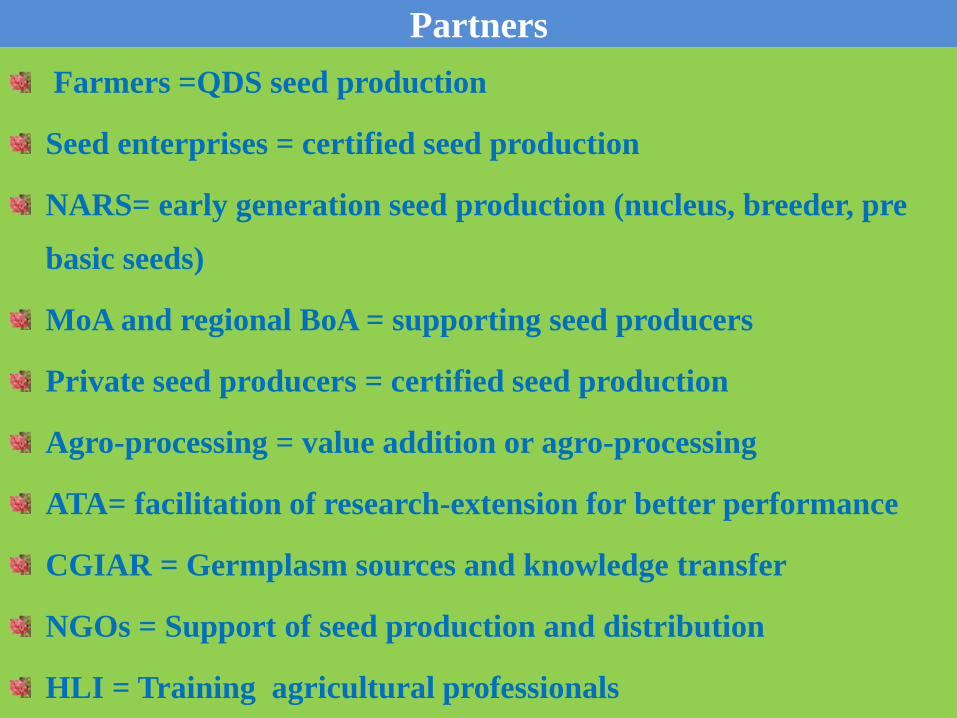
Partners
Farmers =QDS seed production
Seed enterprises = certified seed production
NARS= early generation seed production (nucleus, breeder, pre
basic seeds)
MoA and regional BoA = supporting seed producers
Private seed producers = certified seed production
Agro-processing = value addition or agro-processing
ATA= facilitation of research-extension for better performance
CGIAR = Germplasm sources and knowledge transfer
NGOs = Support of seed production and distribution
HLI = Training agricultural professionals
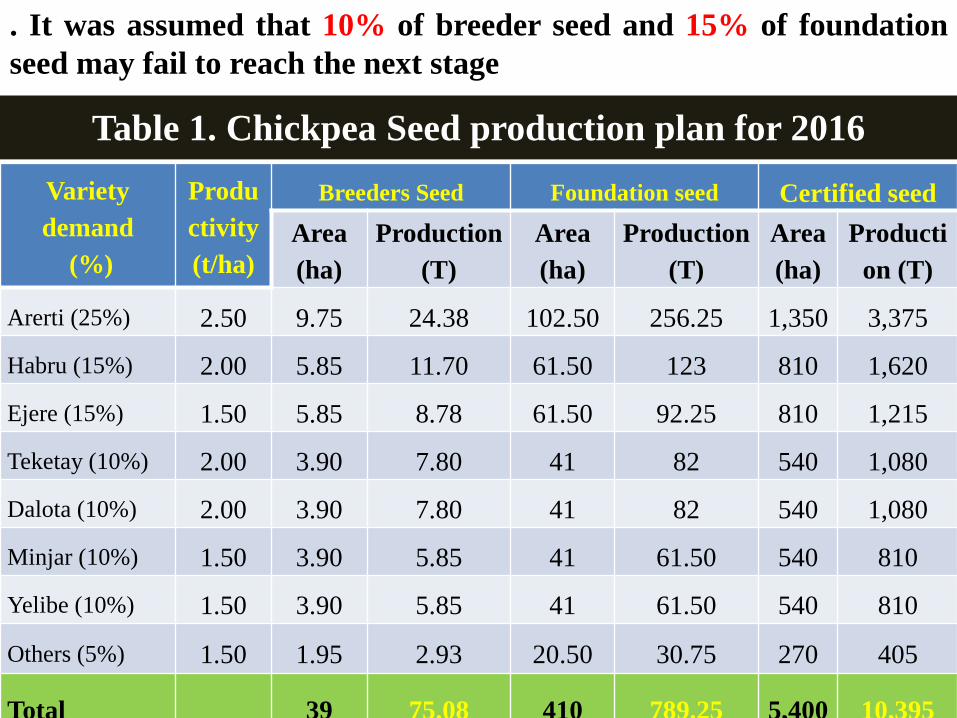
Table 1. Chickpea Seed production plan for 2016
Variety
demand
(%)
Produ
ctivity
(t/ha)
Breeders Seed Foundation seed Certified seed
Area
(ha)
Production
(T)
Area
(ha)
Production
(T)
Area
(ha)
Producti
on (T)
Arerti (25%) 2.50 9.75 24.38 102.50 256.25 1,350 3,375
Habru (15%) 2.00 5.85 11.70 61.50 123 810 1,620
Ejere (15%) 1.50 5.85 8.78 61.50 92.25 810 1,215
Teketay (10%) 2.00 3.90 7.80 41 82 540 1,080
Dalota (10%) 2.00 3.90 7.80 41 82 540 1,080
Minjar (10%) 1.50 3.90 5.85 41 61.50 540 810
Yelibe (10%) 1.50 3.90 5.85 41 61.50 540 810
Others (5%) 1.50 1.95 2.93 20.50 30.75 270 405
Total 39 75.08 410 789.25 5,400 10,395
. It was assumed that 10% of breeder seed and 15% of foundation
seed may fail to reach the next stage
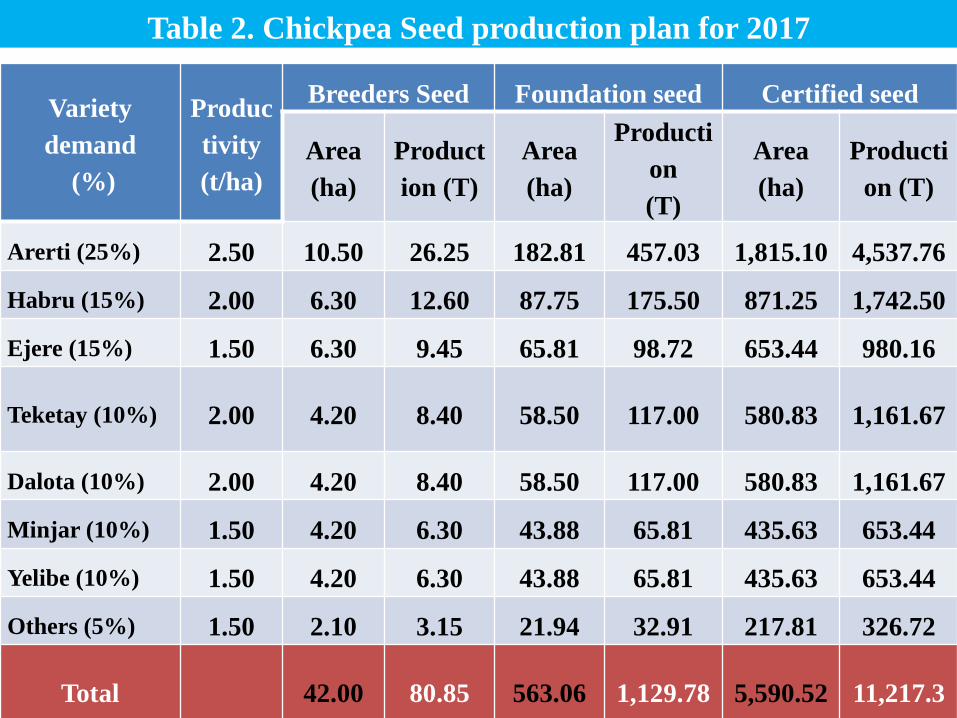
Table 2. Chickpea Seed production plan for 2017
Variety
demand
(%)
Produc
tivity
(t/ha)
Breeders Seed Foundation seed Certified seed
Area
(ha)
Product
ion (T)
Area
(ha)
Producti
on
(T)
Area
(ha)
Producti
on (T)
Arerti (25%) 2.50 10.50 26.25 182.81 457.03 1,815.10 4,537.76
Habru (15%) 2.00 6.30 12.60 87.75 175.50 871.25 1,742.50
Ejere (15%) 1.50 6.30 9.45 65.81 98.72 653.44 980.16
Teketay (10%) 2.00 4.20 8.40 58.50 117.00 580.83 1,161.67
Dalota (10%) 2.00 4.20 8.40 58.50 117.00 580.83 1,161.67
Minjar (10%) 1.50 4.20 6.30 43.88 65.81 435.63 653.44
Yelibe (10%) 1.50 4.20 6.30 43.88 65.81 435.63 653.44
Others (5%) 1.50 2.10 3.15 21.94 32.91 217.81 326.72
Total 42.00 80.85 563.06 1,129.78 5,590.52 11,217.3
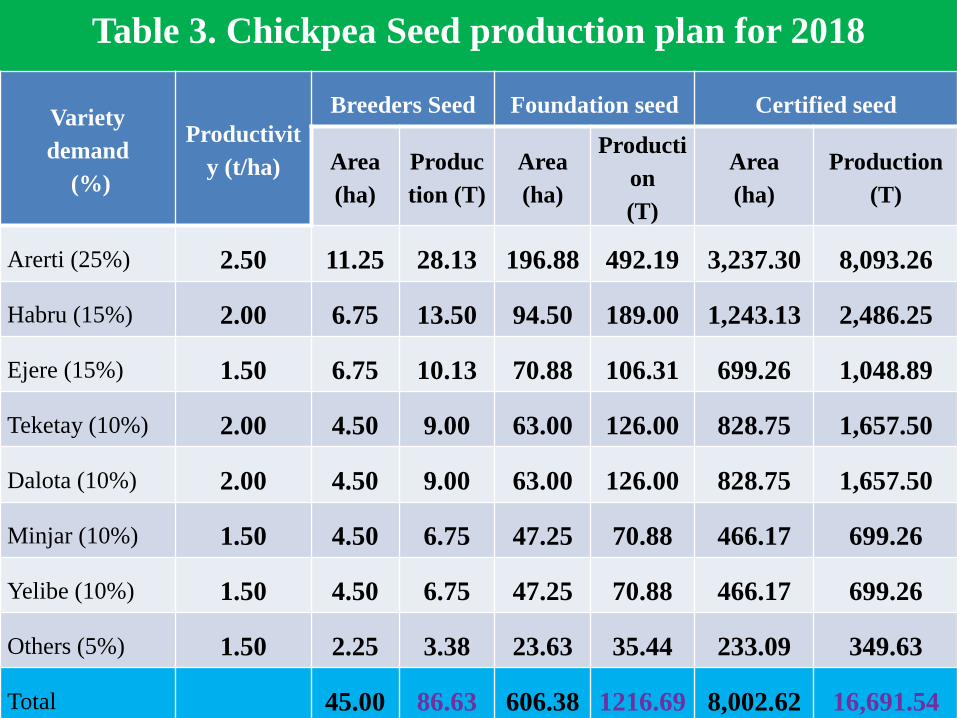
Table 3. Chickpea Seed production plan for 2018
Variety
demand
(%)
Productivit
y (t/ha)
Breeders Seed Foundation seed Certified seed
Area
(ha)
Produc
tion (T)
Area
(ha)
Producti
on
(T)
Area
(ha)
Production
(T)
Arerti (25%) 2.50 11.25 28.13 196.88 492.19 3,237.30 8,093.26
Habru (15%) 2.00 6.75 13.50 94.50 189.00 1,243.13 2,486.25
Ejere (15%) 1.50 6.75 10.13 70.88 106.31 699.26 1,048.89
Teketay (10%) 2.00 4.50 9.00 63.00 126.00 828.75 1,657.50
Dalota (10%) 2.00 4.50 9.00 63.00 126.00 828.75 1,657.50
Minjar (10%) 1.50 4.50 6.75 47.25 70.88 466.17 699.26
Yelibe (10%) 1.50 4.50 6.75 47.25 70.88 466.17 699.26
Others (5%) 1.50 2.25 3.38 23.63 35.44 233.09 349.63
Total 45.00 86.63 606.38 1216.69 8,002.62 16,691.54
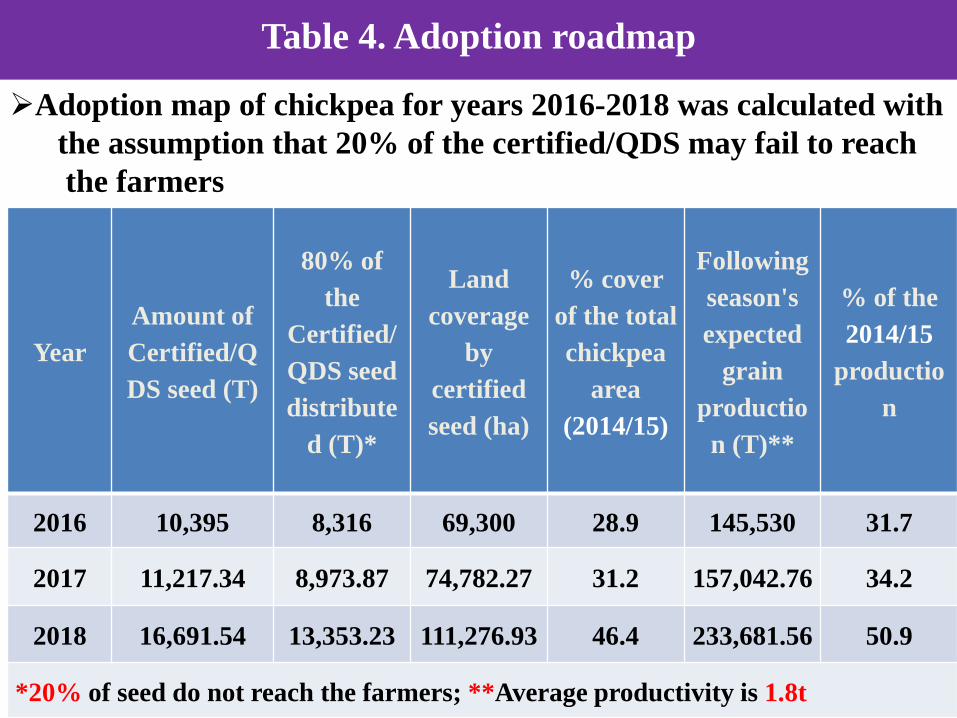
Table 4. Adoption roadmap
Year
Amount of
Certified/Q
DS seed (T)
80% of
the
Certified/
QDS seed
distribute
d (T)*
Land
coverage
by
certified
seed (ha)
% cover
of the total
chickpea
area
(2014/15)
Following
season's
expected
grain
productio
n (T)**
% of the
2014/15
productio
n
2016 10,395 8,316 69,300 28.9 145,530 31.7
2017 11,217.34 8,973.87 74,782.27 31.2 157,042.76 34.2
2018 16,691.54 13,353.23 111,276.93 46.4 233,681.56 50.9
*20% of seed do not reach the farmers; **Average productivity is 1.8t
Adoption map of chickpea for years 2016-2018 was calculated with
the assumption that 20% of the certified/QDS may fail to reach
the farmers