Embed Size (px)
Citation preview
Draft version August 31, 2016Preprint typeset using LATEX style emulateapj v. 5/2/11
DISCOVERY OF A GALAXY CLUSTER WITH A VIOLENTLY STARBURSTING CORE AT z = 2.506
Tao Wang1,2, David Elbaz1, Emanuele Daddi1, Alexis Finoguenov3, Daizhong Liu4, Corentin Schreiber5,Sergio Martın6,7,8, Veronica Strazzullo9, Francesco Valentino1, Remco van der Burg1, Anita Zanella1,
Laure Ciesla1, Raphael Gobat10, Amandine Le Brun1, Maurilio Pannella9, Mark Sargent11, Xinwen Shu12,Qinghua Tan4, Nico Cappelluti13, Yanxia Li14
Draft version August 31, 2016
ABSTRACT
We report the discovery of a remarkable concentration of massive galaxies with extended X-rayemission at zspec = 2.506, which contains 11 massive (M∗ & 1011M) galaxies in the central 80kpcregion (11.6σ overdensity). We have spectroscopically confirmed 17 member galaxies with 11 from COand the remaining ones from Hα. The X-ray luminosity, stellar mass content and velocity dispersionall point to a collapsed, cluster-sized dark matter halo with mass M200c = 1013.9±0.2M, making itthe most distant X-ray-detected cluster known to date. Unlike other clusters discovered so far, thisstructure is dominated by star-forming galaxies (SFGs) in the core with only 2 out of the 11 massivegalaxies classified as quiescent. The star formation rate (SFR) in the 80kpc core reaches ∼3400 Myr−1 with a gas depletion time of ∼ 200 Myr, suggesting that we caught this cluster in rapid build-upof a dense core. The high SFR is driven by both a high abundance of SFGs and a higher starburstfraction (∼ 25%, compared to 3%-5% in the field). The presence of both a collapsed, cluster-sizedhalo and a predominant population of massive SFGs suggests that this structure could represent animportant transition phase between protoclusters and mature clusters. It provides evidence that themain phase of massive galaxy passivization will take place after galaxies accrete onto the cluster,providing new insights into massive cluster formation at early epochs. The large integrated stellarmass at such high redshift challenges our understanding of massive cluster formation.Subject headings: galaxies: clusters — galaxies: formation — galaxies: high-redshift — cosmology
1. INTRODUCTION
Clusters of galaxies represent the densest environmentsand trace the most massive dark matter (DM) halos inthe universe. Studying the formation and evolution ofgalaxy clusters and their member galaxies is fundamen-tal to our understanding of both galaxy formation andcosmology (Kravtsov & Borgani 2012). Massive galaxy
[email protected] Laboratoire AIM-Paris-Saclay, CEA/DSM/Irfu, CNRS, Uni-
versite Paris Diderot, Saclay, pt courrier 131, 91191 Gif-sur-Yvette, France
2 Key Laboratory of Modern Astronomy and Astrophysics inMinistry of Education, School of Astronomy and Space Sciences,Nanjing University, Nanjing, 210093, China
3 Department of Physics, University of Helsinki, GustafHallstromin katu 2a, FI-0014 Helsinki, Finland
4 Purple Mountain Observatory, Chinese Academy of Sciences,2 West Beijing Road, Nanjing 210008, China
5 Leiden Observatory, Leiden University, NL-2300 RA Leiden,The Netherlands
6 European Southern Observatory, Alonso de Cordova 3107,Vitacura, Santiago, Chile
7 Joint ALMA Observatory, Alonso de Cordova 3107, Vi-tacura, Santiago, Chile
8 Institut de Radio Astronomie Millimetrique, 300 rue de laPiscine, Dom. Univ., F-38406, St. Martin d’Heres, France
9 Department of Physics, Ludwig-Maximilians-Universitat,Scheinerstr. 1, D-81679 Munchen, Germany
10 School of Physics, Korea Institute for Advanced Study, Hoe-giro 85, Dongdaemun-gu, Seoul 130-722, Republic of Korea
11 Department of Physics and Astronomy, University of Sus-sex, Brighton BN1 9QH, UK
12 Department of Physics, Anhui Normal University, Wuhu,Anhui, 241000, China
13 Department of Astronomy, Yale University, New Haven, CT06511, USA
14 Institute for Astronomy, University of Hawaii, 2680 Wood-lawn Drive, Honolulu, HI 96822, USA
clusters in the local universe are characterized by a sig-nificant population of massive, passive ellipticals in theircores. Galaxy cluster archeology and numerical simula-tions suggest that these massive clusters and their mem-ber galaxies have experienced a rapid formation phase atz > 2, when the bulk of the stars in central cluster galax-ies was formed (Thomas et al. 2005; De Lucia & Blaizot2007), and the first collapsed, cluster-sized halos (pro-genitors of today’s most massive galaxy clusters) withmasses M200c & 1014M were assembled (Chiang et al.2013). Observations of galaxy structures in this rapidformation phase are critical to map the full path of galaxycluster formation and to answer fundamental questionsabout the effect of dense environments on galaxy forma-tion and evolution. Such structures, however, have beenso far difficult to detect due to their rareness and dis-tance.
Extensive efforts have been made to search for high-redshift structures during the last decade with a varietyof techniques, and a number of galaxy (proto)clustersat z & 1.5 − 2 have been discovered. A few of thesestructures found up to z ∼ 2 already show evidence ofa collapsed, cluster-sized halo and exhibit a high con-centration of quiescent galaxies in the core (with a well-defined red sequence, Papovich et al. 2010; Gobat et al.2011; Stanford et al. 2012; Andreon et al. 2014; Newmanet al. 2014), hence they can be classified as bona fidemature clusters. Some of them still contain a substantialnumber of star-forming galaxies (SFGs) (Brodwin et al.2013; Gobat et al. 2013; Strazzullo et al. 2013; Clementset al. 2014; Webb et al. 2015; Valentino et al. 2015), and afew of them show clear evidence of a reversal of the star
arX
iv:1
604.
0740
4v4
[as
tro-
ph.G
A]
30
Aug
201
6
2 Wang et al.
formation-density relation (Elbaz et al. 2007) with en-hanced star formation in cluster members with respectto field galaxies (Tran et al. 2010; Santos et al. 2015).However, most of these clusters are already dominatedby quiescent galaxies in the core, at least at the massiveend (M∗ & 1011M), with a significantly higher quies-cent fraction compared to the field. Hence to probe themain formation epoch of the most massive cluster galax-ies, we need to explore even higher redshifts, i.e., z > 2.
Most currently known z & 2 structures exhibit lowergalaxy number densities and are spread in multiple, lessmassive, and not collapsed halos compared to matureclusters (Steidel et al. 1998; Kurk et al. 2000; Venemanset al. 2007; Chapman et al. 2009; Miley & De Breuck2008; Daddi et al. 2009; Tanaka et al. 2011; Capak et al.2011; Trenti et al. 2012; Hayashi et al. 2012; Spitler et al.2012; Diener et al. 2013; Chiang et al. 2013; Koyamaet al. 2013; Lemaux et al. 2014; Yuan et al. 2014; Meiet al. 2015; Casey et al. 2015; Kubo et al. 2016). Thesestructures are believed to be in various early evolutionarystages of cluster formation, and are usually called “pro-toclusters.” Although there is no consensus on the dis-tinction between protoclusters and clusters, recent workssuggest that the lack of a collapsed, cluster-sized halo(M200c & 1014M) is a key feature to differentiate proto-clusters from clusters (Diener et al. 2015; Muldrew et al.2015). This distinction could be important since thedominating environmental process that shapes galaxyevolution depends on the mass of the host DM halo, suchas ram pressure stripping (Gunn & Gott 1972) and stran-gulation (Larson et al. 1980). Moreover, in contrast tomature galaxy clusters, most of the galaxies in proto-clusters are found to be star-forming, with no clear evi-dence of an elevated quiescent fraction compared to fieldgalaxies. Hence the transition between protoclusters andmature clusters requires both the collapse of a massive,cluster-sized halo and the formation and quenching ofa significant population of massive galaxies. Clear ev-idence for galaxy structures in such a rapid transitionphase, however, is lacking from current observations.
From a theoretical perspective, the halo assembly his-tory of today’s massive clusters is relatively well un-derstood. Numerical simulations suggest that the pro-genitor of a present day “Coma”-type galaxy cluster(M200c > 1015M) exhibits overdensities of galaxies overan extended area, & 25 Mpc at z > 2, and consists ofmany separated halos (Chiang et al. 2013; Muldrew et al.2015; Contini et al. 2016). Among these halos, the mostmassive one could reach a few times 1013 to 1014M,and should be detected as a cluster. These results arein good agreement with observations. However, detailson the build-up of the stellar mass content of massiveclusters and the physical mechanisms leading to the dis-tinct galaxy population in clusters and the field are stillunder active debate. Much of these debates focus on therelative importance of different environmental effects onmassive galaxy evolution. For instance, it remains un-clear whether the bulk population of central cluster el-lipticals are formed after galaxies have become part of acluster (due to, e.g., ram pressure stripping and frequentmergers), or whether they are already established due to“pre-processing” in grouplike environment before theiraccretion onto a cluster-sized halo (due to, e.g., stran-
gulation). A few recent theoretical studies provide someinsights into this issue, however, reaching different con-clusions (Balogh et al. 2009; Berrier et al. 2009; McGeeet al. 2009; De Lucia et al. 2012; Granato et al. 2015;Contini et al. 2016). The major difficulty in constrainingthese theoretical models comes form the lack of compre-hensive understanding of star formation and quenching(quiescent fraction) in halos with different masses at highredshifts. The fact that most galaxy clusters up to z ∼ 2are already dominated by quiescent galaxies in the coresuggests that we need to explore structures at even higherredshift to put observational constraints on this issue.
In this paper we report the discovery of CLJ1001+0220 (CL J1001, hereafter), a remarkable con-centration of massive SFGs at z = 2.506 with 17 spec-troscopic members. The detection of extended X-rayemission and the velocity dispersion of its member galax-ies are suggestive of a virialized, cluster-sized halo withM200c ∼ 1013.9M, making it the most distant X-ray-detected galaxy cluster known to date. However, unlikeany clusters detected so far, the core of this structureis dominated by SFGs with a star formation rate (SFR)density of ∼ 3400M yr−1 in the central 80 kpc region,suggesting that most of the ellipticals in this cluster willform after galaxies accrete onto the cluster core. Thisprovides one of the first observational constraints on therole of “pre-processing” in the early formation of massiveclusters.
This paper is organized as follows. We describe thetarget selection and multiwavelength imaging of CLJ1001 in Section 2. Spectroscopic follow-up observa-tions and redshift determinations are shown in Section 3.We present the X-ray observations of the cluster fromChandra and XMM − Newton in Section 4. In Sec-tion 5, we discuss the global properties of the cluster.In Section 6, we explore physical properties of its mem-ber galaxies. We then discuss the implications of thiscluster on galaxy and cluster formation, as well as oncosmology, in Section 7. Section 8 summarizes our mainresults. Unless specified otherwise, all magnitudes are inthe AB system, and we assume cosmological parametersof H0 = 70 km s−1 Mpc−1, ΩM = 0.3, and ΩΛ = 0.7. ASalpeter (1955) initial mass function (IMF) is adopted toderive stellar masses and SFRs. When necessary, we con-verted literature values of stellar masses and SFRs basedon the Chabrier (2003) IMF to Salpeter by multiplyingby a factor of 1.74 (0.24 dex). Throughout this paper,we define M200c as the total halo mass contained withinR200c, the radius from the cluster center within whichthe average density is 200 times the critical density atthe cluster redshift.
2. TARGET SELECTION AND MULTWAVELENGTHIMAGING
Searching for overdensities of massive galaxies rep-resents a relatively unbiased way of identifying galaxy(proto)clusters at high redshifts. A number of(proto)clusters have been identified based on overdensi-ties of color-selected massive galaxies (Papovich et al.2010). In particular, the distant red galaxy (DRGs,Franx et al. (2003)) population has been shown to bequite efficient at selecting massive galaxies (includingboth quiescent and star-forming ones) at z > 2 (vanDokkum et al. 2003). To search for galaxy clusters at
A galaxy cluster at z = 2.506 3
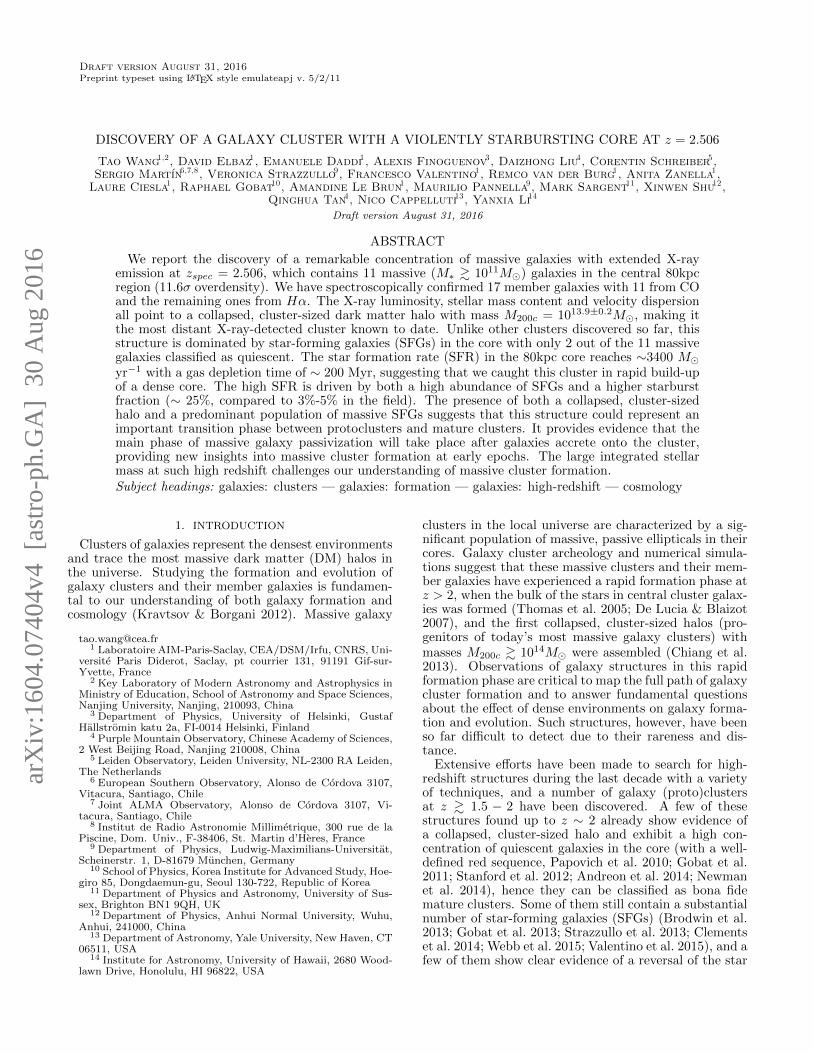
Figure 1. Left: A smoothed map of Σ10 for the whole sample of DRGs in COSMOS. The parts of the map that are affected by imageborders or bad areas are masked out. The white circle with a radius of 2′ denotes the overdensity region studied in this paper, which hasthe highest Σ10 value. Right: the distribution of log Σ10 values in the map and its Gaussian fit (white and orange lines, respectively). Thegrayed-out part of the distribution is not considered in the fit to avoid overdensities affecting the fitting results. The white arrow showsthe peak Σ10 value of the overdensity.
z > 2, We have performed a systematic study of overden-sities of DRGs with J −Ks > 1.3 in the COSMOS fieldusing a Ks-band selected catalog (Ks < 23.4, 90% com-pleteness, McCracken et al. 2012; Muzzin et al. 2013).Overdensities of DRGs have been shown to be good trac-ers of potential massive structures at z > 2 (Uchimotoet al. 2012). We constructed a galaxy surface densitymap using a local galaxy density indicator, Σ10, whichis 10/(πr2
10) with r10 the distance to the 10th nearestneighbor on a grid (Fig 1). We then fitted the distri-bution of log(Σ10) values in the map with a gaussianfunction, as shown in the right panel of Fig 1. The mostsignificant outlier (centered at R.A.=10:00:57.13, decl.= +02:20:11.83) of the best-fit gaussian distribution ex-hibits a Σ10 ∼ 11.6σ higher than the mean. We have alsotried to use different density estimators, e.g., Σ5, which is5/(πr2
5) with r5 the distance to the 5th nearest neighbor,yielding similar significance for this overdensity. Thisoverdensity includes 11 DRGs and 2 blue galaxies withina 10” radius, or 80 kpc at z = 2.5. The photometricredshift distribution of these 13 galaxies shows a promi-nent peak at z ∼ 2.5 with one of them identified as aLyman-α emitter at z ∼ 2.5±0.1 based on intermediate-band data (IA427 filter) in the Subaru COSMOS 20 sur-vey (Taniguchi et al. 2015).
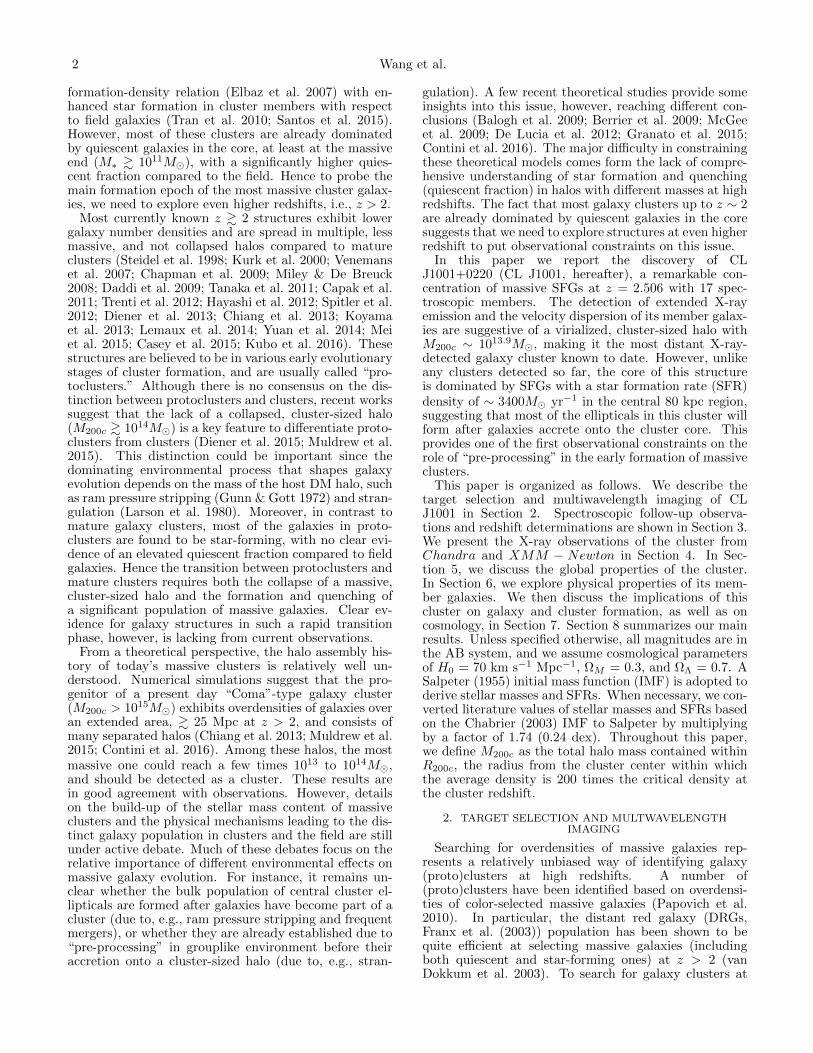
The same overdensity also corresponds to the bright-est Herschel/SPIRE source (unresolved) in the regioncovered by the CANDELS-Herschel survey (PI: MarkDickinson) in the COSMOS field (Fig. 2), with flux den-sities of ∼ 61, 77, and 66 mJy at SPIRE 250, 350, and500 µm, respectively. With a peak at 350 µm, the far-infrared spectral energy distribution (SED) of this over-density provides further evidence that most of its mem-ber galaxies are likely at z ∼ 2.5. This overdensity wasalso detected at 850 µm with SCUBA-2 (Casey et al.2013) and 1.1mm with Aztec (Aretxaga et al. 2011) withflux densities 14.8 and 8.9 mJy, respectively. The sameregion was also observed as a candidate of lensed sourceswith ALMA at band-7 (870 µm) as described in Buss-mann et al. (2015). ALMA resolves 5 out of the 11 DRGsin the core down to S870 µm > 1.6 mJy (Fig 3). These ob-servations suggest that vigorous star formation is taking
place in the member galaxies of this structure. Motivatedby its high far-infrared and millimeter flux densities, wehave performed a series of follow-up observations fromnear-infrared to millimeter to explore properties of thisoverdensity and its member galaxies.
3. SPECTROSCOPIC OBSERVATIONS AND REDSHIFTDETERMINATION
3.1. IRAM-NOEMA
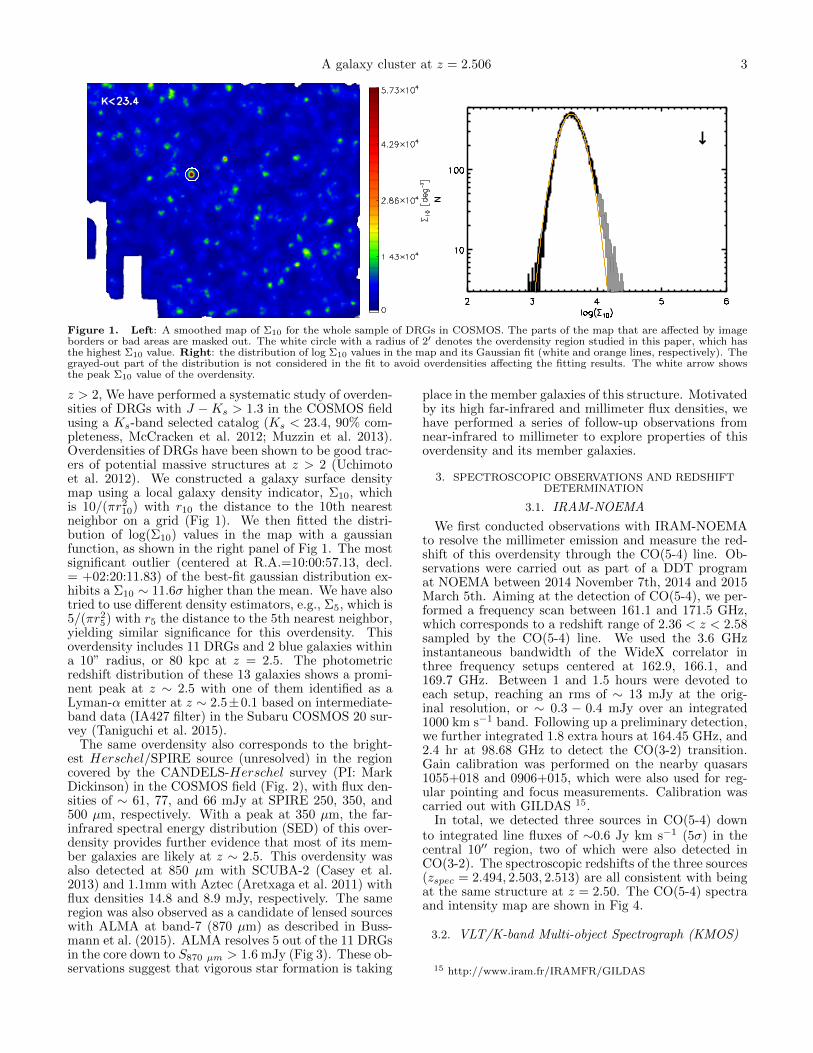
We first conducted observations with IRAM-NOEMAto resolve the millimeter emission and measure the red-shift of this overdensity through the CO(5-4) line. Ob-servations were carried out as part of a DDT programat NOEMA between 2014 November 7th, 2014 and 2015March 5th. Aiming at the detection of CO(5-4), we per-formed a frequency scan between 161.1 and 171.5 GHz,which corresponds to a redshift range of 2.36 < z < 2.58sampled by the CO(5-4) line. We used the 3.6 GHzinstantaneous bandwidth of the WideX correlator inthree frequency setups centered at 162.9, 166.1, and169.7 GHz. Between 1 and 1.5 hours were devoted toeach setup, reaching an rms of ∼ 13 mJy at the orig-inal resolution, or ∼ 0.3 − 0.4 mJy over an integrated1000 km s−1 band. Following up a preliminary detection,we further integrated 1.8 extra hours at 164.45 GHz, and2.4 hr at 98.68 GHz to detect the CO(3-2) transition.Gain calibration was performed on the nearby quasars1055+018 and 0906+015, which were also used for reg-ular pointing and focus measurements. Calibration wascarried out with GILDAS 15.
In total, we detected three sources in CO(5-4) downto integrated line fluxes of ∼0.6 Jy km s−1 (5σ) in thecentral 10′′ region, two of which were also detected inCO(3-2). The spectroscopic redshifts of the three sources(zspec = 2.494, 2.503, 2.513) are all consistent with beingat the same structure at z = 2.50. The CO(5-4) spectraand intensity map are shown in Fig 4.
3.2. VLT/K-band Multi-object Spectrograph (KMOS)
15 http://www.iram.fr/IRAMFR/GILDAS

4 Wang et al.
Figure 2. RGB Herschel/SPIRE composite color image of theCOSMOS field covered by the CANDELS-Herschel survey. TheR, G and B channels correspond to SPIRE 500, 350 and 250 µm,respectively. Only sources brighter than 20 mJy at one or moreof the three SPIRE wavelengths are shown. Sources with reddercolors tend to be at higher redshifts. The large white circle with aradius of 2′ indicates the position of the galaxy overdensity, whichis the brightest SPIRE source in the whole field.
Further near-infrared spectroscopic observation withthe KMOS (Sharples et al. 2004, 2013)) on the VLTwas performed during P96 under ESO program 096.A-0891(A) (PI: Tao Wang) in 2015 December. KMOSis a multiplexed near-infrared integral-field spectroscopy(IFS) system with 24 deployable integral field units overa 7.2′ diameter field. The K-band filter was used totarget the Hα emission line for candidate members at2 < zphot < 3 in and around the overdensity. The K-band filter covers the wavelength range 1.9 − 2.4 µm,which corresponds to Hα at z ∼ 1.9− 2.6. The spectralresolution in the K-band filter is around R ∼ 4200.
The observations were prepared with the KMOS ArmAllocator (KARMA; Wegner & Muschielok 2008) andeach pointing was observed for 450 s using a standardobject-sky-object dither pattern. The observations weretaken in good conditions with a typical seeing of 0.6-0.8′′.The total on-source exposure time for each target is ∼ 1.5hr. Data were reduced using the ESO pipeline (version1.3.14) in combination with custom scripts developed byourselves16. We detected 11 galaxies with signal-to-noiseratio (S/N) above 4 in Hα at z > 2 down to fHα ∼3 × 10⁻¹⁷ erg s−1 cm−2. Seven of them are at 2.494 ≤zspec ≤ 2.512, which are consistent with being clustermembers. The spectra of these seven galaxies are shownin Fig. 5.
3.3. VLA
Although our KMOS observation successfully detecteda number of member galaxies, none of them are located inthe core. This is likely caused by the fact that the DRGsin the core are severely attenuated. To obtain spectro-
16 Detailed procedure and related codes are fully described here:https://github.com/cschreib/kmos-scripts
scopic redshifts for these massive and dusty sources andalso constrain their molecular gas content, we performedCO(1-0) Karl G. Jansky Very Large Array (JVLA) obser-vations of the cluster core in 2015 December under VLAprogram 15B-290 (PI: Tao Wang). Observations werecarried out in the D array at the Ka band. The WIDARcorrelation was configured with four spectral windows(SPWs) of 64 channels and 2 MHz per channel resolu-tion. The effective frequency coverage is 32.2-33.59 GHz,corresponding to z ∼ 2.43− 2.58 for CO(1-0).
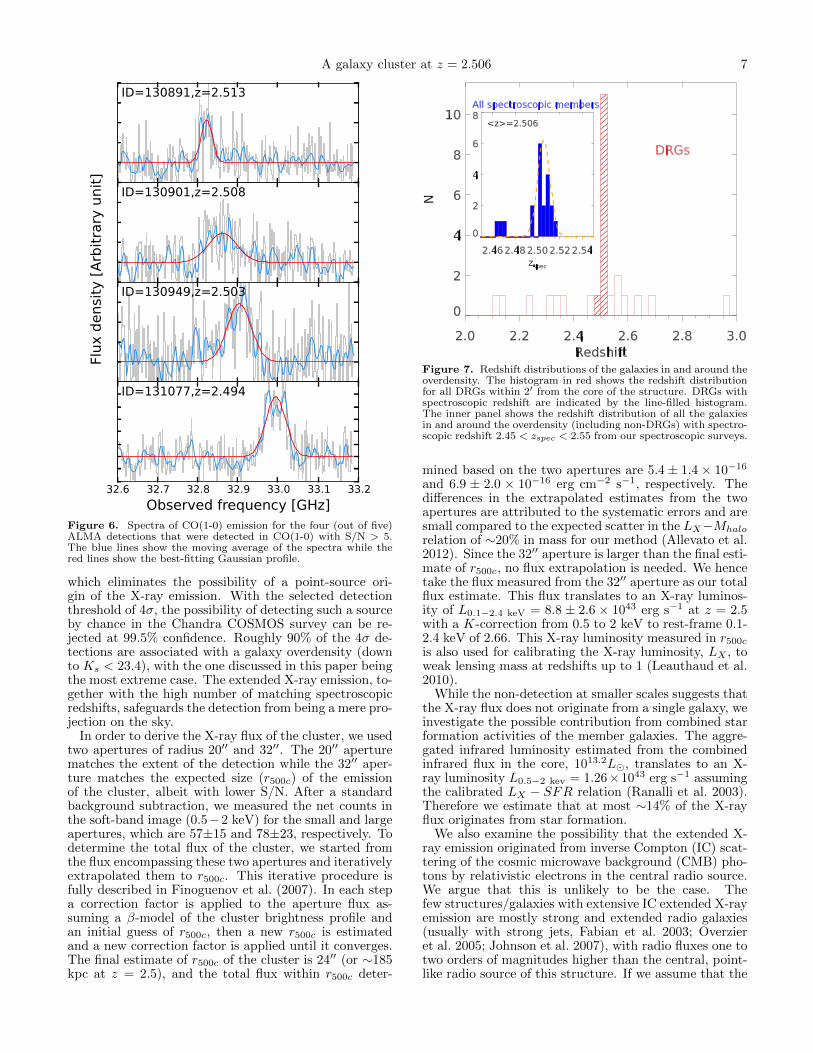
The nearby quasar J1024-0052 was used for gain andpointing calibration and the source 3C147 was used asflux calibrator. The effective integration time is ∼ 10hr. The data were reduced using the Common Astron-omy Software Application (CASA) package (McMullinet al. 2007), and were imaged using the CLEAN algo-rithm in CASA with a natural weighting scheme. Moredetails on data reduction and molecular gas content ofindividual galaxies will be presented in a future work(T. Wang et al. 2016, in preparation). Eleven galaxieswere detected in CO(1-0) down to integrated line fluxes0.05 Jy km s−1, including all the 3 CO(5-4) detectionsby IRAM/NOEMA and 1 Hα detection by VLT/KMOS.Example CO(1-0) spectra of ALMA-detected galaxies inthe cluster core are shown in Fig. 6. Combining spec-troscopic redshifts determined from IRAM-NOEMA andVLT/KMOS, we have in total spectroscopic redshifts for21 galaxies extending up to ∼ 1 Mpc from the over-density. Fig 7 shows the redshift distribution of thesegalaxies, which reveals a prominent spike at z ∼ 2.50.The biweight mean of the redshifts of these 21 galaxiesyields zmean = 2.506 with 17 galaxies falling in the rangezspec = 2.506 ± 0.012. The other five galaxies deviatesfrom the mean by > 3σ. The redshift histogram distri-bution around the biweight mean is well described by aGaussian profile. A maximum likelihood estimation ofthe dispersion with the 17 galaxies yielded σz = 0.006,and all the 17 galaxies fall in zmean ± 3 ∗ σz, hence areclassified as cluster members. Spectroscopic redshifts ofthese 17 galaxies are listed in Table. 1.
4. XMM −NEWTON AND CHANDRA IMAGING
We combined the latest Chandra and XMM−Newtonsurveys of the COSMOS field (Cappelluti et al. 2009;Elvis et al. 2009; Civano et al. 2016) to search for ex-tended emission at a 16” spatial scale with wavelet-baseddetection techniques in the whole field. The depth of theChandra and XMM − Newton survey reaches ∼ 160ks and ∼ 60 ks per pointing, respectively. We co-addedthe XMM and Chandra background-subtracted countimages and computed the total exposure. The proce-dure has been described in Finoguenov et al. (2009) andshown to work even to much longer exposures such asthose of CDFS in Finoguenov et al. (2015). We useddetailed background modeling developed and verified inprevious works (Cappelluti et al. 2013; Erfanianfar et al.2013; Finoguenov et al. 2015). A number of significantdetections (> 4σ) associated with galaxy overdensities athigh redshift were discovered (A. Finoguenov et al. 2016,in prep). The cluster reported in this paper exhibits themost prominent galaxy overdensity which is also in themost advanced stage of follow-up observations.
At the position of the cluster we did not detect anysignificant emission on scales smaller than 16′′ (Fig 8),
A galaxy cluster at z = 2.506 5
a b
Figure 3. RGB composite color image of the region around the cluster core. The R, G and B channel correspond to the Ks, J andY bands from the UltraVISTA survey, respectively. The left panel (a) corresponds to a 4′ × 4′ region while the right panel (b) is anenlarged image of the central 30′′ × 30′′ region around the cluster core. Red arrows indicate distant red galaxies (DRGs) outside the corewith zphot = 2.5 ± 0.5 while white arrows indicate spectroscopically confirmed members within 3σ of the peak of the redshift distribution(zspec = 2.506 ± 0.018), including 7 galaxies in the core (indicated in the right panel) and 10 galaxies in the outskirts. Extended X-rayemission (0.5-2 keV) and ALMA 870 µm continuum are overlaid, respectively, with yellow and white contours in the right panel. Thereare 11 DRGs (5 detected with ALMA at 870 µm) and 2 blue galaxies within the central 10′′ region, or 80 kpc at z = 2.5.
z=2.500
Figure 4. ALMA and IRAM-NOEMA observations of the cluster core. ALMA 870 µm continuum map of the cluster core (20′′ × 20′′),overlaid with CO(5-4) emission line detections from IRAM-NOEMA. In total, five sources in the cluster are detected with ALMA, three ofwhich are also detected in CO(5-4) with NOEMA. The ALMA and NOEMA beams are denoted by the small and large ellipses, respectively.The CO(5-4) line spectra for the three sources are shown in the right panel. The zero velocity of all the spectra corresponds to CO(5-4) atz = 2.5. The area filled with colors indicate the regions where positive emission is detected.

6 Wang et al.
Figure 5. Extracted and smoothed one-dimensional K-band KMOS spectra (left) and the corresponding S/N plot (right) for clustermembers. The best-fit FWHM of each Hα line is indicated in the right panels, which was used to smooth the spectra. All the listed sourcesare detected with a S/N > 5 except source 130359, which is detected at 4.9σ. Though in most cases we have only detected one line, giventhe range of their photometric redshifts (Table. 1) we determined their redshifts assuming the line to be Hα. The position of the Hα lineis indicated by the solid line while dotted lines show the expected position of [NII] as well as the [SII] doublet.
A galaxy cluster at z = 2.506 7
Figure 6. Spectra of CO(1-0) emission for the four (out of five)ALMA detections that were detected in CO(1-0) with S/N > 5.The blue lines show the moving average of the spectra while thered lines show the best-fitting Gaussian profile.
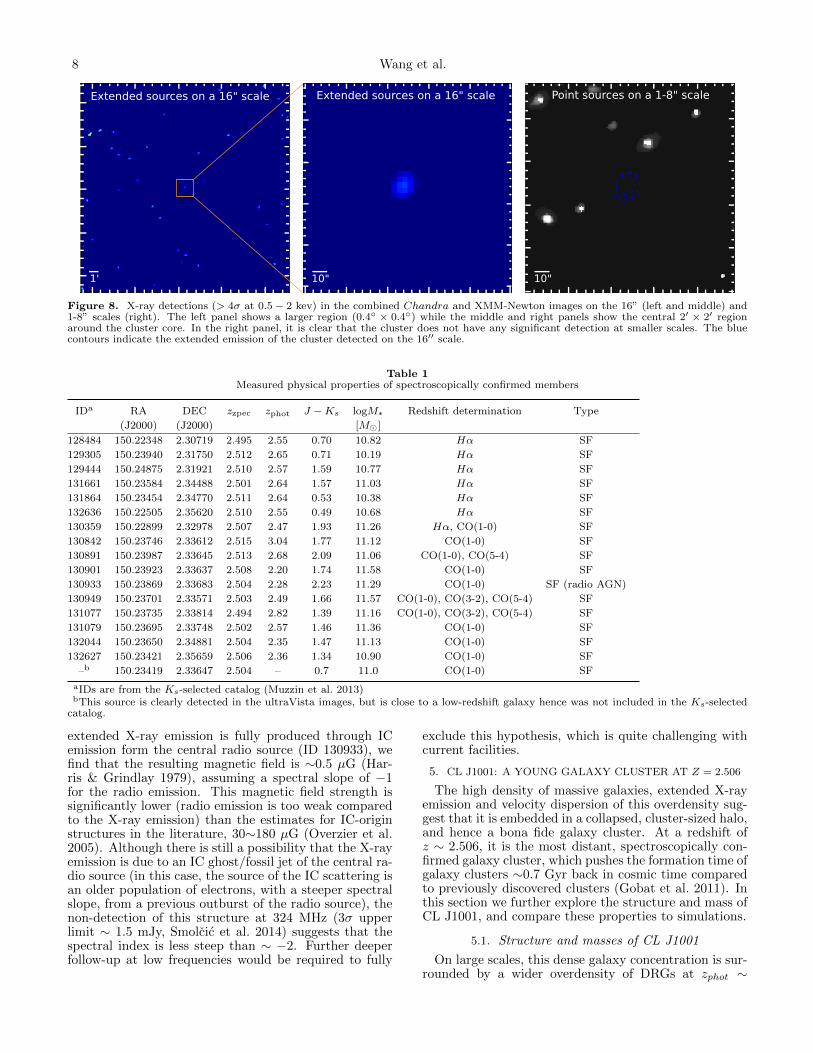
which eliminates the possibility of a point-source ori-gin of the X-ray emission. With the selected detectionthreshold of 4σ, the possibility of detecting such a sourceby chance in the Chandra COSMOS survey can be re-jected at 99.5% confidence. Roughly 90% of the 4σ de-tections are associated with a galaxy overdensity (downto Ks < 23.4), with the one discussed in this paper beingthe most extreme case. The extended X-ray emission, to-gether with the high number of matching spectroscopicredshifts, safeguards the detection from being a mere pro-jection on the sky.
In order to derive the X-ray flux of the cluster, we usedtwo apertures of radius 20′′ and 32′′. The 20′′ aperturematches the extent of the detection while the 32′′ aper-ture matches the expected size (r500c) of the emissionof the cluster, albeit with lower S/N. After a standardbackground subtraction, we measured the net counts inthe soft-band image (0.5−2 keV) for the small and largeapertures, which are 57±15 and 78±23, respectively. Todetermine the total flux of the cluster, we started fromthe flux encompassing these two apertures and iterativelyextrapolated them to r500c. This iterative procedure isfully described in Finoguenov et al. (2007). In each stepa correction factor is applied to the aperture flux as-suming a β-model of the cluster brightness profile andan initial guess of r500c, then a new r500c is estimatedand a new correction factor is applied until it converges.The final estimate of r500c of the cluster is 24′′ (or ∼185kpc at z = 2.5), and the total flux within r500c deter-
Figure 7. Redshift distributions of the galaxies in and around theoverdensity. The histogram in red shows the redshift distributionfor all DRGs within 2′ from the core of the structure. DRGs withspectroscopic redshift are indicated by the line-filled histogram.The inner panel shows the redshift distribution of all the galaxiesin and around the overdensity (including non-DRGs) with spectro-scopic redshift 2.45 < zspec < 2.55 from our spectroscopic surveys.
mined based on the two apertures are 5.4 ± 1.4 × 10⁻¹⁶
and 6.9 ± 2.0 × 10⁻¹⁶ erg cm−2 s−1, respectively. Thedifferences in the extrapolated estimates from the twoapertures are attributed to the systematic errors and aresmall compared to the expected scatter in the LX−Mhalo
relation of ∼20% in mass for our method (Allevato et al.2012). Since the 32′′ aperture is larger than the final esti-mate of r500c, no flux extrapolation is needed. We hencetake the flux measured from the 32′′ aperture as our totalflux estimate. This flux translates to an X-ray luminos-ity of L0.1−2.4 keV = 8.8 ± 2.6 × 1043 erg s−1 at z = 2.5with a K-correction from 0.5 to 2 keV to rest-frame 0.1-2.4 keV of 2.66. This X-ray luminosity measured in r500c
is also used for calibrating the X-ray luminosity, LX , toweak lensing mass at redshifts up to 1 (Leauthaud et al.2010).
While the non-detection at smaller scales suggests thatthe X-ray flux does not originate from a single galaxy, weinvestigate the possible contribution from combined starformation activities of the member galaxies. The aggre-gated infrared luminosity estimated from the combinedinfrared flux in the core, 1013.2L, translates to an X-ray luminosity L0.5−2 kev = 1.26×1043 erg s−1 assumingthe calibrated LX − SFR relation (Ranalli et al. 2003).Therefore we estimate that at most ∼14% of the X-rayflux originates from star formation.
We also examine the possibility that the extended X-ray emission originated from inverse Compton (IC) scat-tering of the cosmic microwave background (CMB) pho-tons by relativistic electrons in the central radio source.We argue that this is unlikely to be the case. Thefew structures/galaxies with extensive IC extended X-rayemission are mostly strong and extended radio galaxies(usually with strong jets, Fabian et al. 2003; Overzieret al. 2005; Johnson et al. 2007), with radio fluxes one totwo orders of magnitudes higher than the central, point-like radio source of this structure. If we assume that the
8 Wang et al.
Figure 8. X-ray detections (> 4σ at 0.5 − 2 kev) in the combined Chandra and XMM-Newton images on the 16” (left and middle) and1-8” scales (right). The left panel shows a larger region (0.4 × 0.4) while the middle and right panels show the central 2′ × 2′ regionaround the cluster core. In the right panel, it is clear that the cluster does not have any significant detection at smaller scales. The bluecontours indicate the extended emission of the cluster detected on the 16′′ scale.
Table 1Measured physical properties of spectroscopically confirmed members
IDa RA DEC zzpec zphot J −Ks logM∗ Redshift determination Type
(J2000) (J2000) [M]
128484 150.22348 2.30719 2.495 2.55 0.70 10.82 Hα SF
129305 150.23940 2.31750 2.512 2.65 0.71 10.19 Hα SF
129444 150.24875 2.31921 2.510 2.57 1.59 10.77 Hα SF
131661 150.23584 2.34488 2.501 2.64 1.57 11.03 Hα SF
131864 150.23454 2.34770 2.511 2.64 0.53 10.38 Hα SF
132636 150.22505 2.35620 2.510 2.55 0.49 10.68 Hα SF
130359 150.22899 2.32978 2.507 2.47 1.93 11.26 Hα, CO(1-0) SF
130842 150.23746 2.33612 2.515 3.04 1.77 11.12 CO(1-0) SF
130891 150.23987 2.33645 2.513 2.68 2.09 11.06 CO(1-0), CO(5-4) SF
130901 150.23923 2.33637 2.508 2.20 1.74 11.58 CO(1-0) SF
130933 150.23869 2.33683 2.504 2.28 2.23 11.29 CO(1-0) SF (radio AGN)
130949 150.23701 2.33571 2.503 2.49 1.66 11.57 CO(1-0), CO(3-2), CO(5-4) SF
131077 150.23735 2.33814 2.494 2.82 1.39 11.16 CO(1-0), CO(3-2), CO(5-4) SF
131079 150.23695 2.33748 2.502 2.57 1.46 11.36 CO(1-0) SF
132044 150.23650 2.34881 2.504 2.35 1.47 11.13 CO(1-0) SF
132627 150.23421 2.35659 2.506 2.36 1.34 10.90 CO(1-0) SF
–b 150.23419 2.33647 2.504 – 0.7 11.0 CO(1-0) SF
aIDs are from the Ks-selected catalog (Muzzin et al. 2013)bThis source is clearly detected in the ultraVista images, but is close to a low-redshift galaxy hence was not included in the Ks-selected
catalog.
extended X-ray emission is fully produced through ICemission form the central radio source (ID 130933), wefind that the resulting magnetic field is ∼0.5 µG (Har-ris & Grindlay 1979), assuming a spectral slope of −1for the radio emission. This magnetic field strength issignificantly lower (radio emission is too weak comparedto the X-ray emission) than the estimates for IC-originstructures in the literature, 30∼180 µG (Overzier et al.2005). Although there is still a possibility that the X-rayemission is due to an IC ghost/fossil jet of the central ra-dio source (in this case, the source of the IC scattering isan older population of electrons, with a steeper spectralslope, from a previous outburst of the radio source), thenon-detection of this structure at 324 MHz (3σ upperlimit ∼ 1.5 mJy, Smolcic et al. 2014) suggests that thespectral index is less steep than ∼ −2. Further deeperfollow-up at low frequencies would be required to fully
exclude this hypothesis, which is quite challenging withcurrent facilities.
5. CL J1001: A YOUNG GALAXY CLUSTER AT Z = 2.506
The high density of massive galaxies, extended X-rayemission and velocity dispersion of this overdensity sug-gest that it is embedded in a collapsed, cluster-sized halo,and hence a bona fide galaxy cluster. At a redshift ofz ∼ 2.506, it is the most distant, spectroscopically con-firmed galaxy cluster, which pushes the formation time ofgalaxy clusters ∼0.7 Gyr back in cosmic time comparedto previously discovered clusters (Gobat et al. 2011). Inthis section we further explore the structure and mass ofCL J1001, and compare these properties to simulations.
5.1. Structure and masses of CL J1001
On large scales, this dense galaxy concentration is sur-rounded by a wider overdensity of DRGs at zphot ∼
A galaxy cluster at z = 2.506 9
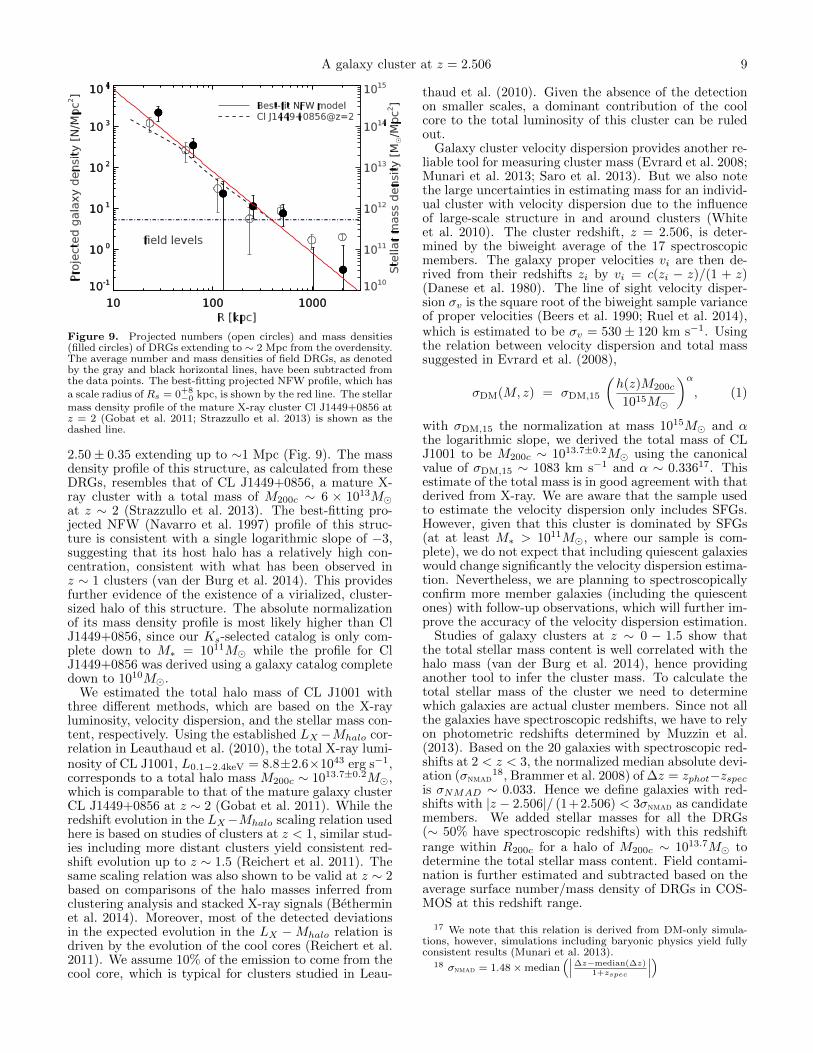
Figure 9. Projected numbers (open circles) and mass densities(filled circles) of DRGs extending to ∼ 2 Mpc from the overdensity.The average number and mass densities of field DRGs, as denotedby the gray and black horizontal lines, have been subtracted fromthe data points. The best-fitting projected NFW profile, which has
a scale radius of Rs = 0+8−0 kpc, is shown by the red line. The stellar
mass density profile of the mature X-ray cluster Cl J1449+0856 atz = 2 (Gobat et al. 2011; Strazzullo et al. 2013) is shown as thedashed line.
2.50± 0.35 extending up to ∼1 Mpc (Fig. 9). The massdensity profile of this structure, as calculated from theseDRGs, resembles that of CL J1449+0856, a mature X-ray cluster with a total mass of M200c ∼ 6 × 10¹³Mat z ∼ 2 (Strazzullo et al. 2013). The best-fitting pro-jected NFW (Navarro et al. 1997) profile of this struc-ture is consistent with a single logarithmic slope of −3,suggesting that its host halo has a relatively high con-centration, consistent with what has been observed inz ∼ 1 clusters (van der Burg et al. 2014). This providesfurther evidence of the existence of a virialized, cluster-sized halo of this structure. The absolute normalizationof its mass density profile is most likely higher than ClJ1449+0856, since our Ks-selected catalog is only com-plete down to M∗ = 1011M while the profile for ClJ1449+0856 was derived using a galaxy catalog completedown to 1010M.
We estimated the total halo mass of CL J1001 withthree different methods, which are based on the X-rayluminosity, velocity dispersion, and the stellar mass con-tent, respectively. Using the established LX−Mhalo cor-relation in Leauthaud et al. (2010), the total X-ray lumi-nosity of CL J1001, L0.1−2.4keV = 8.8±2.6×1043 erg s−1,corresponds to a total halo mass M200c ∼ 1013.7±0.2M,which is comparable to that of the mature galaxy clusterCL J1449+0856 at z ∼ 2 (Gobat et al. 2011). While theredshift evolution in the LX−Mhalo scaling relation usedhere is based on studies of clusters at z < 1, similar stud-ies including more distant clusters yield consistent red-shift evolution up to z ∼ 1.5 (Reichert et al. 2011). Thesame scaling relation was also shown to be valid at z ∼ 2based on comparisons of the halo masses inferred fromclustering analysis and stacked X-ray signals (Betherminet al. 2014). Moreover, most of the detected deviationsin the expected evolution in the LX −Mhalo relation isdriven by the evolution of the cool cores (Reichert et al.2011). We assume 10% of the emission to come from thecool core, which is typical for clusters studied in Leau-
thaud et al. (2010). Given the absence of the detectionon smaller scales, a dominant contribution of the coolcore to the total luminosity of this cluster can be ruledout.
Galaxy cluster velocity dispersion provides another re-liable tool for measuring cluster mass (Evrard et al. 2008;Munari et al. 2013; Saro et al. 2013). But we also notethe large uncertainties in estimating mass for an individ-ual cluster with velocity dispersion due to the influenceof large-scale structure in and around clusters (Whiteet al. 2010). The cluster redshift, z = 2.506, is deter-mined by the biweight average of the 17 spectroscopicmembers. The galaxy proper velocities vi are then de-rived from their redshifts zi by vi = c(zi − z)/(1 + z)(Danese et al. 1980). The line of sight velocity disper-sion σv is the square root of the biweight sample varianceof proper velocities (Beers et al. 1990; Ruel et al. 2014),which is estimated to be σv = 530± 120 km s−1. Usingthe relation between velocity dispersion and total masssuggested in Evrard et al. (2008),
σDM(M, z) = σDM,15
(h(z)M200c
1015M
)α, (1)
with σDM,15 the normalization at mass 1015M and αthe logarithmic slope, we derived the total mass of CLJ1001 to be M200c ∼ 1013.7±0.2M using the canonicalvalue of σDM,15 ∼ 1083 km s−1 and α ∼ 0.33617. Thisestimate of the total mass is in good agreement with thatderived from X-ray. We are aware that the sample usedto estimate the velocity dispersion only includes SFGs.However, given that this cluster is dominated by SFGs(at at least M∗ > 1011M, where our sample is com-plete), we do not expect that including quiescent galaxieswould change significantly the velocity dispersion estima-tion. Nevertheless, we are planning to spectroscopicallyconfirm more member galaxies (including the quiescentones) with follow-up observations, which will further im-prove the accuracy of the velocity dispersion estimation.
Studies of galaxy clusters at z ∼ 0 − 1.5 show thatthe total stellar mass content is well correlated with thehalo mass (van der Burg et al. 2014), hence providinganother tool to infer the cluster mass. To calculate thetotal stellar mass of the cluster we need to determinewhich galaxies are actual cluster members. Since not allthe galaxies have spectroscopic redshifts, we have to relyon photometric redshifts determined by Muzzin et al.(2013). Based on the 20 galaxies with spectroscopic red-shifts at 2 < z < 3, the normalized median absolute devi-ation (σnmad
18, Brammer et al. 2008) of ∆z = zphot−zspecis σNMAD ∼ 0.033. Hence we define galaxies with red-shifts with |z − 2.506|/ (1+2.506) < 3σnmad as candidatemembers. We added stellar masses for all the DRGs(∼ 50% have spectroscopic redshifts) with this redshiftrange within R200c for a halo of M200c ∼ 1013.7M todetermine the total stellar mass content. Field contami-nation is further estimated and subtracted based on theaverage surface number/mass density of DRGs in COS-MOS at this redshift range.
17 We note that this relation is derived from DM-only simula-tions, however, simulations including baryonic physics yield fullyconsistent results (Munari et al. 2013).
18 σnmad = 1.48 × median(∣∣∣∆z−median(∆z)
1+zspec
∣∣∣)
10 Wang et al.
The stellar mass of individual galaxies was derivedfrom SED fitting with FAST (Kriek et al. 2009). Wefit the UV to 4.5 µm photometry with the Bruzual &Charlot (2003) stellar population synthesis models, as-suming solar metallicity and exponentially declining starformation histories with e-folding times τ ∼ 0.1 − 10Gyr. We allowed the galaxies to be attenuated withAV = 0 − 6 with the Calzetti (Calzetti et al. 2000)attenuation law. The mass estimate is in good agree-ment with those calculated by Muzzin et al. (2013) con-sidering the small differences in the spectroscopic red-shift used here and photometric redshifts used in theirwork. The median stellar mass of the 11 DRGs in thecore is 〈M∗〉 ∼ 1011.2M with the two most massiveones reaching M∗ ∼ 1011.6M. As a reference, fora DM halo of M200c ∼ 1013M (with a virial radiusR200c ∼ 186 kpc) models expect only one galaxy as mas-sive as M∗ ∼ 1011.2M at z ∼ 2.5 (Behroozi et al. 2013),suggesting that this overdensity resides in a very massivehalo.
We estimated the halo mass of this structure based onthe stellar mass-to-total halo mass relation calibrated forz ∼ 1 clusters (van der Burg et al. 2014). If we add DRGswith M∗ > 1011M (where our sample is 90% complete),and do not apply any correction for mass incompleteness,we derive a combined stellar mass M∗ ∼ 2.1 × 10¹²Mafter correction for field contamination, which is < 10%.If instead we correct for the incompleteness and extrap-olate down to 109M by assuming the same stellar massfunction as that in the field as determined from the CAN-DELS fields (Grogin et al. 2011; Koekemoer et al. 2011;Schreiber et al. 2015), we derived a total stellar massM∗ ∼ 4.3× 10¹²M, suggesting M200c ∼ 1014.6M. Thetrue halo mass is most likely between the two estimatesconsidering that massive galaxies tend to be more abun-dant in clusters than in the field (hence a smaller correc-tion factor when extrapolated to lower stellar mass) asshown at z ∼ 1 (van der Burg et al. 2013). Therefore, weestimate that the total mass of the halo is in the rangeof M200c ∼ 1013.7−14.6M. Combined with the mass es-timate based on X-ray and velocity dispersion, our bestestimate of the halo mass is M200c = 1013.9±0.2M.
5.2. Comparison with simulations
We conclude that we have found a massive galaxy con-centration embedded in a virialized, cluster-sized halo atz = 2.506. Halos of similarly high masses at these red-shifts are predicted to be very rare in the Λ-CDM frame-work. The cumulative number of DM halos with z > 2.5and M200c > 1(0.5)× 1014M expected in the COSMOSfield is 0.01(0.3) with Planck cosmology (twice lower us-ing WMAP 7 cosmology) (Murray et al. 2013; PlanckCollaboration et al. 2015). More accurate halo mass es-timates and more similarly massive structures at highredshifts are hence required to put stringent constraintson our cosmological model.
To understand properties of this cluster in a cosmolog-ical context, we have searched similar structures in mockcatalogs for light cones (Henriques et al. 2012, 2015)constructed for the semi-analytic galaxy formation sim-ulation of Guo et al. (2011), which were built on mergertrees from large DM simulations, the Millennium Simu-lation (Springel et al. 2005) and Millennium-II (Boylan-
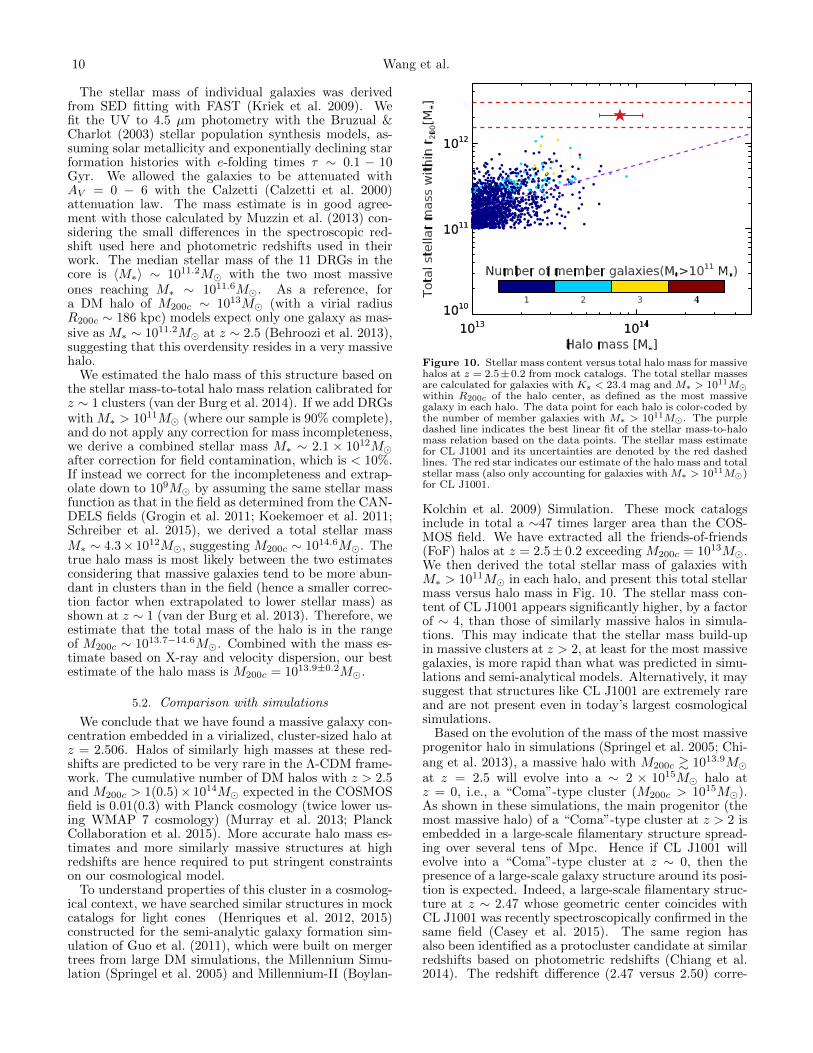
Figure 10. Stellar mass content versus total halo mass for massivehalos at z = 2.5±0.2 from mock catalogs. The total stellar massesare calculated for galaxies with Ks < 23.4 mag and M∗ > 1011Mwithin R200c of the halo center, as defined as the most massivegalaxy in each halo. The data point for each halo is color-coded bythe number of member galaxies with M∗ > 1011M. The purpledashed line indicates the best linear fit of the stellar mass-to-halomass relation based on the data points. The stellar mass estimatefor CL J1001 and its uncertainties are denoted by the red dashedlines. The red star indicates our estimate of the halo mass and totalstellar mass (also only accounting for galaxies with M∗ > 1011M)for CL J1001.
Kolchin et al. 2009) Simulation. These mock catalogsinclude in total a ∼47 times larger area than the COS-MOS field. We have extracted all the friends-of-friends(FoF) halos at z = 2.5± 0.2 exceeding M200c = 1013M.We then derived the total stellar mass of galaxies withM∗ > 1011M in each halo, and present this total stellarmass versus halo mass in Fig. 10. The stellar mass con-tent of CL J1001 appears significantly higher, by a factorof ∼ 4, than those of similarly massive halos in simula-tions. This may indicate that the stellar mass build-upin massive clusters at z > 2, at least for the most massivegalaxies, is more rapid than what was predicted in simu-lations and semi-analytical models. Alternatively, it maysuggest that structures like CL J1001 are extremely rareand are not present even in today’s largest cosmologicalsimulations.
Based on the evolution of the mass of the most massiveprogenitor halo in simulations (Springel et al. 2005; Chi-ang et al. 2013), a massive halo with M200c & 1013.9Mat z = 2.5 will evolve into a ∼ 2 × 10¹⁵M halo atz = 0, i.e., a “Coma”-type cluster (M200c > 1015M).As shown in these simulations, the main progenitor (themost massive halo) of a “Coma”-type cluster at z > 2 isembedded in a large-scale filamentary structure spread-ing over several tens of Mpc. Hence if CL J1001 willevolve into a “Coma”-type cluster at z ∼ 0, then thepresence of a large-scale galaxy structure around its posi-tion is expected. Indeed, a large-scale filamentary struc-ture at z ∼ 2.47 whose geometric center coincides withCL J1001 was recently spectroscopically confirmed in thesame field (Casey et al. 2015). The same region hasalso been identified as a protocluster candidate at similarredshifts based on photometric redshifts (Chiang et al.2014). The redshift difference (2.47 versus 2.50) corre-
A galaxy cluster at z = 2.506 11
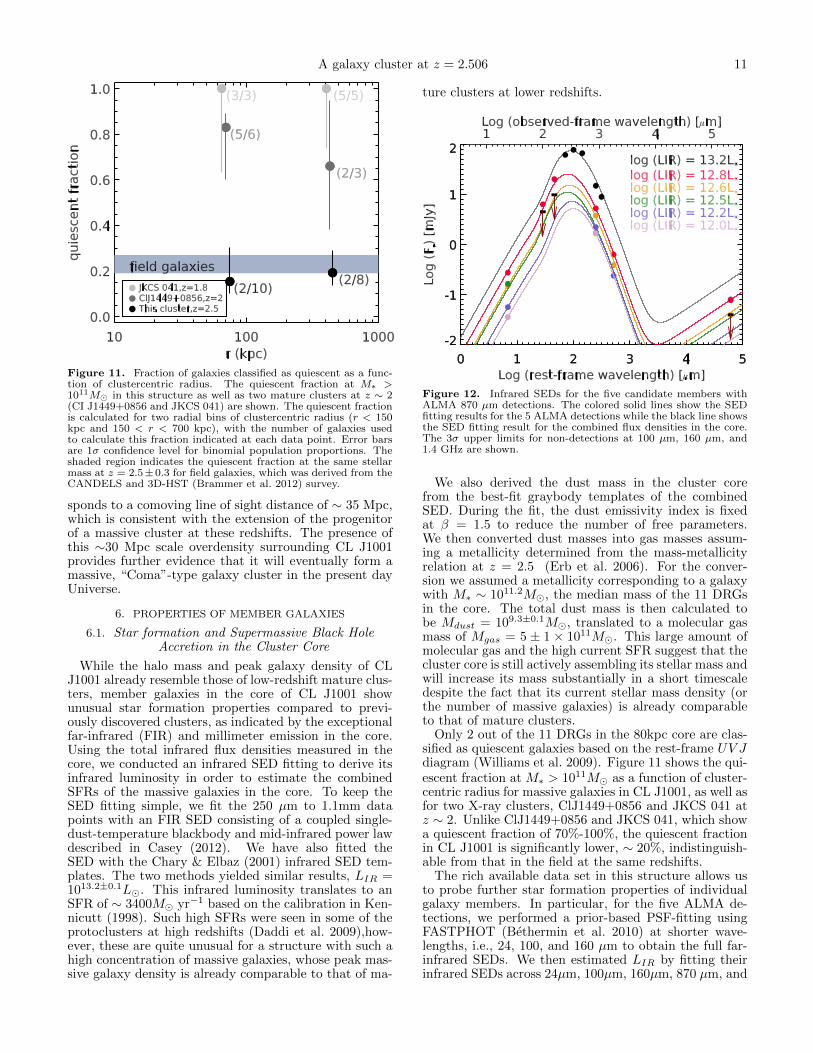
Figure 11. Fraction of galaxies classified as quiescent as a func-tion of clustercentric radius. The quiescent fraction at M∗ >1011M in this structure as well as two mature clusters at z ∼ 2(CI J1449+0856 and JKCS 041) are shown. The quiescent fractionis calculated for two radial bins of clustercentric radius (r < 150kpc and 150 < r < 700 kpc), with the number of galaxies usedto calculate this fraction indicated at each data point. Error barsare 1σ confidence level for binomial population proportions. Theshaded region indicates the quiescent fraction at the same stellarmass at z = 2.5±0.3 for field galaxies, which was derived from theCANDELS and 3D-HST (Brammer et al. 2012) survey.
sponds to a comoving line of sight distance of ∼ 35 Mpc,which is consistent with the extension of the progenitorof a massive cluster at these redshifts. The presence ofthis ∼30 Mpc scale overdensity surrounding CL J1001provides further evidence that it will eventually form amassive, “Coma”-type galaxy cluster in the present dayUniverse.
6. PROPERTIES OF MEMBER GALAXIES
6.1. Star formation and Supermassive Black HoleAccretion in the Cluster Core
While the halo mass and peak galaxy density of CLJ1001 already resemble those of low-redshift mature clus-ters, member galaxies in the core of CL J1001 showunusual star formation properties compared to previ-ously discovered clusters, as indicated by the exceptionalfar-infrared (FIR) and millimeter emission in the core.Using the total infrared flux densities measured in thecore, we conducted an infrared SED fitting to derive itsinfrared luminosity in order to estimate the combinedSFRs of the massive galaxies in the core. To keep theSED fitting simple, we fit the 250 µm to 1.1mm datapoints with an FIR SED consisting of a coupled single-dust-temperature blackbody and mid-infrared power lawdescribed in Casey (2012). We have also fitted theSED with the Chary & Elbaz (2001) infrared SED tem-plates. The two methods yielded similar results, LIR =1013.2±0.1L. This infrared luminosity translates to anSFR of ∼ 3400M yr−1 based on the calibration in Ken-nicutt (1998). Such high SFRs were seen in some of theprotoclusters at high redshifts (Daddi et al. 2009),how-ever, these are quite unusual for a structure with such ahigh concentration of massive galaxies, whose peak mas-sive galaxy density is already comparable to that of ma-
ture clusters at lower redshifts.
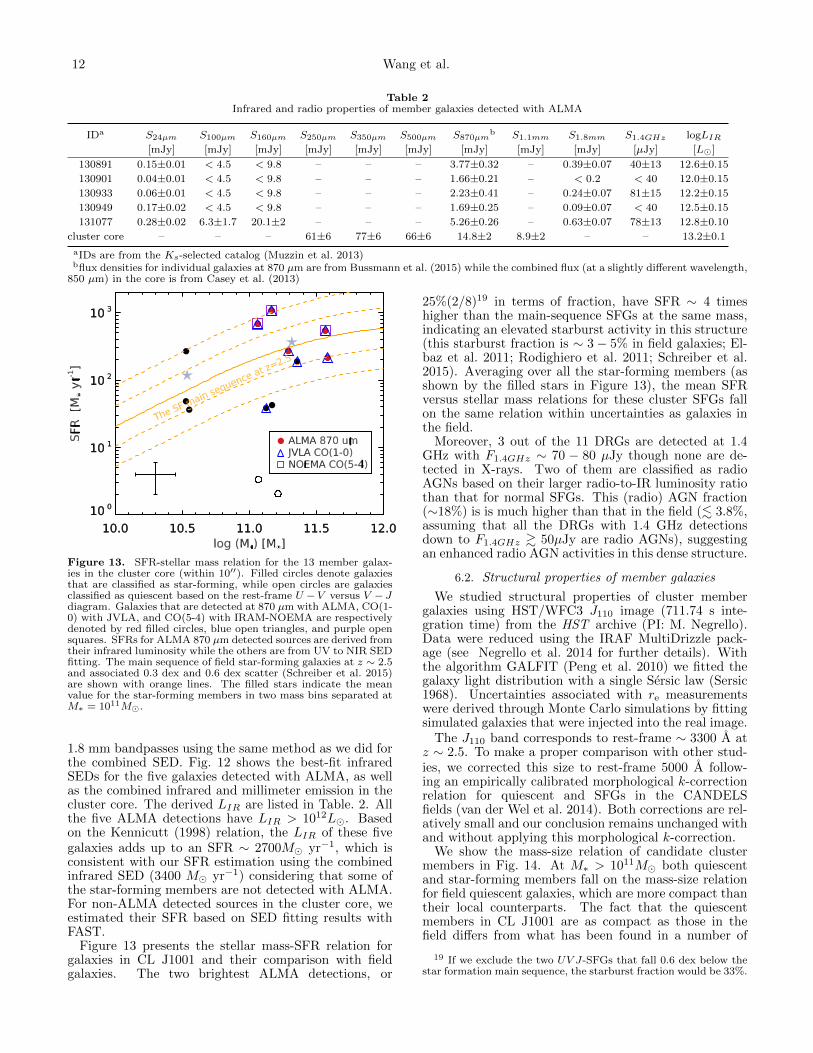
Figure 12. Infrared SEDs for the five candidate members withALMA 870 µm detections. The colored solid lines show the SEDfitting results for the 5 ALMA detections while the black line showsthe SED fitting result for the combined flux densities in the core.The 3σ upper limits for non-detections at 100 µm, 160 µm, and1.4 GHz are shown.
We also derived the dust mass in the cluster corefrom the best-fit graybody templates of the combinedSED. During the fit, the dust emissivity index is fixedat β = 1.5 to reduce the number of free parameters.We then converted dust masses into gas masses assum-ing a metallicity determined from the mass-metallicityrelation at z = 2.5 (Erb et al. 2006). For the conver-sion we assumed a metallicity corresponding to a galaxywith M∗ ∼ 1011.2M, the median mass of the 11 DRGsin the core. The total dust mass is then calculated tobe Mdust = 109.3±0.1M, translated to a molecular gasmass of Mgas = 5 ± 1 × 10¹¹M. This large amount ofmolecular gas and the high current SFR suggest that thecluster core is still actively assembling its stellar mass andwill increase its mass substantially in a short timescaledespite the fact that its current stellar mass density (orthe number of massive galaxies) is already comparableto that of mature clusters.
Only 2 out of the 11 DRGs in the 80kpc core are clas-sified as quiescent galaxies based on the rest-frame UV Jdiagram (Williams et al. 2009). Figure 11 shows the qui-escent fraction at M∗ > 1011M as a function of cluster-centric radius for massive galaxies in CL J1001, as well asfor two X-ray clusters, ClJ1449+0856 and JKCS 041 atz ∼ 2. Unlike ClJ1449+0856 and JKCS 041, which showa quiescent fraction of 70%-100%, the quiescent fractionin CL J1001 is significantly lower, ∼ 20%, indistinguish-able from that in the field at the same redshifts.
The rich available data set in this structure allows usto probe further star formation properties of individualgalaxy members. In particular, for the five ALMA de-tections, we performed a prior-based PSF-fitting usingFASTPHOT (Bethermin et al. 2010) at shorter wave-lengths, i.e., 24, 100, and 160 µm to obtain the full far-infrared SEDs. We then estimated LIR by fitting theirinfrared SEDs across 24µm, 100µm, 160µm, 870 µm, and
12 Wang et al.
Table 2Infrared and radio properties of member galaxies detected with ALMA
IDa S24µm S100µm S160µm S250µm S350µm S500µm S870µmb S1.1mm S1.8mm S1.4GHz logLIR
[mJy] [mJy] [mJy] [mJy] [mJy] [mJy] [mJy] [mJy] [mJy] [µJy] [L]
130891 0.15±0.01 < 4.5 < 9.8 – – – 3.77±0.32 – 0.39±0.07 40±13 12.6±0.15
130901 0.04±0.01 < 4.5 < 9.8 – – – 1.66±0.21 – < 0.2 < 40 12.0±0.15
130933 0.06±0.01 < 4.5 < 9.8 – – – 2.23±0.41 – 0.24±0.07 81±15 12.2±0.15
130949 0.17±0.02 < 4.5 < 9.8 – – – 1.69±0.25 – 0.09±0.07 < 40 12.5±0.15
131077 0.28±0.02 6.3±1.7 20.1±2 – – – 5.26±0.26 – 0.63±0.07 78±13 12.8±0.10
cluster core – – – 61±6 77±6 66±6 14.8±2 8.9±2 – – 13.2±0.1
aIDs are from the Ks-selected catalog (Muzzin et al. 2013)bflux densities for individual galaxies at 870 µm are from Bussmann et al. (2015) while the combined flux (at a slightly different wavelength,
850 µm) in the core is from Casey et al. (2013)
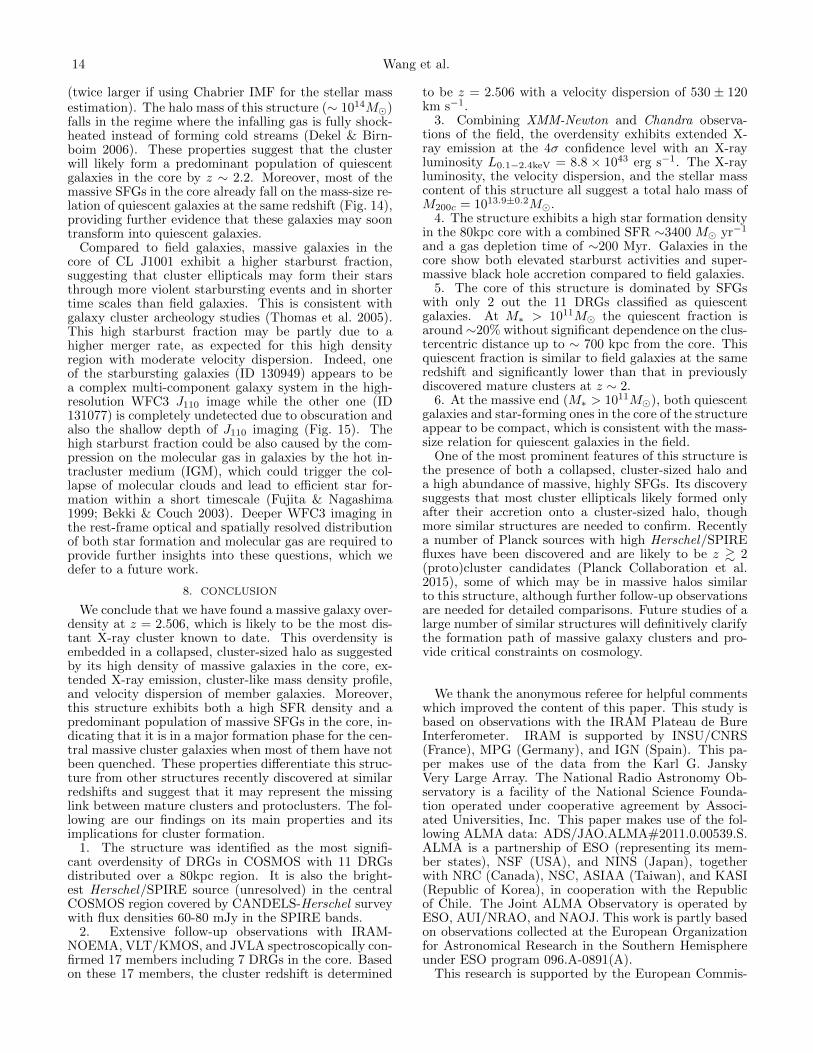
Figure 13. SFR-stellar mass relation for the 13 member galax-ies in the cluster core (within 10′′). Filled circles denote galaxiesthat are classified as star-forming, while open circles are galaxiesclassified as quiescent based on the rest-frame U − V versus V − Jdiagram. Galaxies that are detected at 870 µm with ALMA, CO(1-0) with JVLA, and CO(5-4) with IRAM-NOEMA are respectivelydenoted by red filled circles, blue open triangles, and purple opensquares. SFRs for ALMA 870 µm detected sources are derived fromtheir infrared luminosity while the others are from UV to NIR SEDfitting. The main sequence of field star-forming galaxies at z ∼ 2.5and associated 0.3 dex and 0.6 dex scatter (Schreiber et al. 2015)are shown with orange lines. The filled stars indicate the meanvalue for the star-forming members in two mass bins separated atM∗ = 1011M.
1.8 mm bandpasses using the same method as we did forthe combined SED. Fig. 12 shows the best-fit infraredSEDs for the five galaxies detected with ALMA, as wellas the combined infrared and millimeter emission in thecluster core. The derived LIR are listed in Table. 2. Allthe five ALMA detections have LIR > 1012L. Basedon the Kennicutt (1998) relation, the LIR of these fivegalaxies adds up to an SFR ∼ 2700M yr−1, which isconsistent with our SFR estimation using the combinedinfrared SED (3400 M yr−1) considering that some ofthe star-forming members are not detected with ALMA.For non-ALMA detected sources in the cluster core, weestimated their SFR based on SED fitting results withFAST.
Figure 13 presents the stellar mass-SFR relation forgalaxies in CL J1001 and their comparison with fieldgalaxies. The two brightest ALMA detections, or
25%(2/8)19 in terms of fraction, have SFR ∼ 4 timeshigher than the main-sequence SFGs at the same mass,indicating an elevated starburst activity in this structure(this starburst fraction is ∼ 3− 5% in field galaxies; El-baz et al. 2011; Rodighiero et al. 2011; Schreiber et al.2015). Averaging over all the star-forming members (asshown by the filled stars in Figure 13), the mean SFRversus stellar mass relations for these cluster SFGs fallon the same relation within uncertainties as galaxies inthe field.
Moreover, 3 out of the 11 DRGs are detected at 1.4GHz with F1.4GHz ∼ 70 − 80 µJy though none are de-tected in X-rays. Two of them are classified as radioAGNs based on their larger radio-to-IR luminosity ratiothan that for normal SFGs. This (radio) AGN fraction(∼18%) is is much higher than that in the field (. 3.8%,assuming that all the DRGs with 1.4 GHz detectionsdown to F1.4GHz & 50µJy are radio AGNs), suggestingan enhanced radio AGN activities in this dense structure.
6.2. Structural properties of member galaxies
We studied structural properties of cluster membergalaxies using HST/WFC3 J110 image (711.74 s inte-gration time) from the HST archive (PI: M. Negrello).Data were reduced using the IRAF MultiDrizzle pack-age (see Negrello et al. 2014 for further details). Withthe algorithm GALFIT (Peng et al. 2010) we fitted thegalaxy light distribution with a single Sersic law (Sersic1968). Uncertainties associated with re measurementswere derived through Monte Carlo simulations by fittingsimulated galaxies that were injected into the real image.
The J110 band corresponds to rest-frame ∼ 3300 A atz ∼ 2.5. To make a proper comparison with other stud-ies, we corrected this size to rest-frame 5000 A follow-ing an empirically calibrated morphological k-correctionrelation for quiescent and SFGs in the CANDELSfields (van der Wel et al. 2014). Both corrections are rel-atively small and our conclusion remains unchanged withand without applying this morphological k-correction.
We show the mass-size relation of candidate clustermembers in Fig. 14. At M∗ > 1011M both quiescentand star-forming members fall on the mass-size relationfor field quiescent galaxies, which are more compact thantheir local counterparts. The fact that the quiescentmembers in CL J1001 are as compact as those in thefield differs from what has been found in a number of
19 If we exclude the two UV J-SFGs that fall 0.6 dex below thestar formation main sequence, the starburst fraction would be 33%.

A galaxy cluster at z = 2.506 13
Figure 14. Mass-size relation for quiescent and star-forming can-didate members of the structure. Galaxies within R < 150 kpcfrom the core are denoted by filled circles while those within 150< R < 700 kpc are denoted by open circles. UV J-quiescent galax-ies are shown in red, while UV J-star-forming galaxies are shown inblue. The mass-size relations for quiescent and star-forming fieldgalaxies at z ∼ 2.5 (van der Wel et al. 2014) are shown with redand blue lines, respectively. The 1σ scatter of the mass-size rela-tion for field quiescent galaxies is shown with red dashed lines. Thelarge error bar in the bottom right indicates typical uncertainties ofmass and size measurements of our sample galaxies. The mass-sizerelation for the nearby Coma cluster is indicated with the dottedline(Andreon 1996).
mature clusters at z ∼ 1− 2 (Papovich et al. 2012; Bas-sett et al. 2013; Strazzullo et al. 2013; Delaye et al. 2014;Newman et al. 2014), in which the quiescent galaxies areless compact than their field counterparts (so-called ac-celerated evolution of the mass-size relation in clusters).This is consistent with the fact that CL J1001 was caughtin an earlier phase of cluster formation (right after thecollapse of the cluster-sized halo), when the cluster en-vironment had not yet affected the structural evolution.On the other hand, in contrast to the mass-size relationfor SFGs in the field, most of the massive star-formingmembers in CL J1001 are significantly smaller and fall onthe same mass-size relation as quiescent galaxies. Thisindicates that these cluster SFGs are promising progen-itors of quiescent galaxies and may soon be quenched.
7. DISCUSSION: IMPLICATIONS OF CL J1001 ON THEFORMATION OF MASSIVE CLUSTERS AND THEIR
MEMBER GALAXIES
With the presence of both a massive, collapsed haloand a predominant population of massive SFGs, CLJ1001 provides a rare chance to study the rapid build-up of a dense cluster core. The discovery of structuresin such a phase itself helps to bridge the gap betweenpreviously discovered photoclusters and clusters at highredshift. Its properties provide new insights into whenand how massive cluster ellipticals formed at high red-shift.
Despite the presence of a cluster-like environment (in-cluding both a collapsed massive halo and a high con-centration of massive galaxies in the core), the fractionof galaxies that are classified as quiescent in CL J1001 atM∗ > 1011M is estimated to be less than ∼ 20%. Thisquiescent fraction is similar to that in the field and issignificantly lower than that in known z ∼ 2 mature clus-
Figure 15. HST/WFC3 J110-band stamp images of the two mas-sive starbursts in the cluster core. The crosses mark the sourcepositions in the UltraVista Ks-band.
ters, suggesting that most central cluster galaxies will bequenched only after they accrete onto the cluster. Thisis different from the “pre-processing” scenario in whichgalaxies are quenched in groups or large-scale filamentsprior to cluster assembly, due to, e.g., strangulation. Wespeculate that this might be due to the fact that at highredshifts, only a small fraction of cluster galaxies were ac-creted onto the final cluster halo as a member of a group-sized halo with M200c > 1013M, as suggested by simula-tions (Balogh et al. 2009; McGee et al. 2009). Moreover,simulations suggest that cold streams can penetrate mod-erately massive, group-sized halos with M200c ∼1013Mat z & 2 (Dekel & Birnboim 2006), which makes it dif-ficult to fully quench protocluster galaxies even if theywere located in a group-sized halo before their accretiononto the cluster. These arguments are also consistentwith the fact that is are no clear evidence for suppressedstar formation or an elevated quiescent fraction in proto-cluster regions. In fact, based on current studies of z & 2protoclusters, star formation in protoclusters seems to beelevated (Casey 2016) rather than suppressed comparedto field galaxies.
We caution that while many studies of high-redshiftprotoclusters observed a high volume density of highlySFGs or dusty galaxies (detected down to some flux levelin the far-infrared or submillimeter), it is unclear whetherthis is caused by elevated SFRs in individual galaxies orsimply caused by the fact that there are more massivegalaxies in protocluster regions. A thorough examinationof the mass-star formation relation as well as the relativefraction of quiescent and SFGs in protocluster regions,and its comparison to field galaxies, is required to obtainsolid conclusions. This is, however, quite difficult forprotoclusters due to their extended region (several tensof Mpc) and lower significance of galaxy overdensities,which inhibit a census of its member galaxies (particu-larly quiescent ones). Moreover, simulations suggest thata significant fraction of protocluster galaxies may not endup in clusters at z ∼ 0, especially those low-mass galax-ies in the outskirts (Contini et al. 2016). This makes itmore complicated to compare observations of protoclus-ters and simulations.
Although the current observed quiescent fraction in CLJ1001 is similar to that in the field, several pieces of evi-dence suggest that this fraction will increase over a shorttime scale. The total molecular gas mass for galaxies inthe core is estimated to be Mgas ∼ 5 × 10¹¹M (Sec-tion 6). Considering their current SFR, this structurewill consume all the available gas within ∼ 150−200 Myr
14 Wang et al.
(twice larger if using Chabrier IMF for the stellar massestimation). The halo mass of this structure (∼ 1014M)falls in the regime where the infalling gas is fully shock-heated instead of forming cold streams (Dekel & Birn-boim 2006). These properties suggest that the clusterwill likely form a predominant population of quiescentgalaxies in the core by z ∼ 2.2. Moreover, most of themassive SFGs in the core already fall on the mass-size re-lation of quiescent galaxies at the same redshift (Fig. 14),providing further evidence that these galaxies may soontransform into quiescent galaxies.
Compared to field galaxies, massive galaxies in thecore of CL J1001 exhibit a higher starburst fraction,suggesting that cluster ellipticals may form their starsthrough more violent starbursting events and in shortertime scales than field galaxies. This is consistent withgalaxy cluster archeology studies (Thomas et al. 2005).This high starburst fraction may be partly due to ahigher merger rate, as expected for this high densityregion with moderate velocity dispersion. Indeed, oneof the starbursting galaxies (ID 130949) appears to bea complex multi-component galaxy system in the high-resolution WFC3 J110 image while the other one (ID131077) is completely undetected due to obscuration andalso the shallow depth of J110 imaging (Fig. 15). Thehigh starburst fraction could be also caused by the com-pression on the molecular gas in galaxies by the hot in-tracluster medium (IGM), which could trigger the col-lapse of molecular clouds and lead to efficient star for-mation within a short timescale (Fujita & Nagashima1999; Bekki & Couch 2003). Deeper WFC3 imaging inthe rest-frame optical and spatially resolved distributionof both star formation and molecular gas are required toprovide further insights into these questions, which wedefer to a future work.
8. CONCLUSION
We conclude that we have found a massive galaxy over-density at z = 2.506, which is likely to be the most dis-tant X-ray cluster known to date. This overdensity isembedded in a collapsed, cluster-sized halo as suggestedby its high density of massive galaxies in the core, ex-tended X-ray emission, cluster-like mass density profile,and velocity dispersion of member galaxies. Moreover,this structure exhibits both a high SFR density and apredominant population of massive SFGs in the core, in-dicating that it is in a major formation phase for the cen-tral massive cluster galaxies when most of them have notbeen quenched. These properties differentiate this struc-ture from other structures recently discovered at similarredshifts and suggest that it may represent the missinglink between mature clusters and protoclusters. The fol-lowing are our findings on its main properties and itsimplications for cluster formation.
1. The structure was identified as the most signifi-cant overdensity of DRGs in COSMOS with 11 DRGsdistributed over a 80kpc region. It is also the bright-est Herschel/SPIRE source (unresolved) in the centralCOSMOS region covered by CANDELS-Herschel surveywith flux densities 60-80 mJy in the SPIRE bands.
2. Extensive follow-up observations with IRAM-NOEMA, VLT/KMOS, and JVLA spectroscopically con-firmed 17 members including 7 DRGs in the core. Basedon these 17 members, the cluster redshift is determined
to be z = 2.506 with a velocity dispersion of 530 ± 120km s−1.
3. Combining XMM-Newton and Chandra observa-tions of the field, the overdensity exhibits extended X-ray emission at the 4σ confidence level with an X-rayluminosity L0.1−2.4keV = 8.8 × 1043 erg s−1. The X-rayluminosity, the velocity dispersion, and the stellar masscontent of this structure all suggest a total halo mass ofM200c = 1013.9±0.2M.
4. The structure exhibits a high star formation densityin the 80kpc core with a combined SFR ∼3400 M yr−1
and a gas depletion time of ∼200 Myr. Galaxies in thecore show both elevated starburst activities and super-massive black hole accretion compared to field galaxies.
5. The core of this structure is dominated by SFGswith only 2 out the 11 DRGs classified as quiescentgalaxies. At M∗ > 1011M the quiescent fraction isaround∼20% without significant dependence on the clus-tercentric distance up to ∼ 700 kpc from the core. Thisquiescent fraction is similar to field galaxies at the sameredshift and significantly lower than that in previouslydiscovered mature clusters at z ∼ 2.
6. At the massive end (M∗ > 1011M), both quiescentgalaxies and star-forming ones in the core of the structureappear to be compact, which is consistent with the mass-size relation for quiescent galaxies in the field.
One of the most prominent features of this structure isthe presence of both a collapsed, cluster-sized halo anda high abundance of massive, highly SFGs. Its discoverysuggests that most cluster ellipticals likely formed onlyafter their accretion onto a cluster-sized halo, thoughmore similar structures are needed to confirm. Recentlya number of Planck sources with high Herschel/SPIREfluxes have been discovered and are likely to be z & 2(proto)cluster candidates (Planck Collaboration et al.2015), some of which may be in massive halos similarto this structure, although further follow-up observationsare needed for detailed comparisons. Future studies of alarge number of similar structures will definitively clarifythe formation path of massive galaxy clusters and pro-vide critical constraints on cosmology.
We thank the anonymous referee for helpful commentswhich improved the content of this paper. This study isbased on observations with the IRAM Plateau de BureInterferometer. IRAM is supported by INSU/CNRS(France), MPG (Germany), and IGN (Spain). This pa-per makes use of the data from the Karl G. JanskyVery Large Array. The National Radio Astronomy Ob-servatory is a facility of the National Science Founda-tion operated under cooperative agreement by Associ-ated Universities, Inc. This paper makes use of the fol-lowing ALMA data: ADS/JAO.ALMA#2011.0.00539.S.ALMA is a partnership of ESO (representing its mem-ber states), NSF (USA), and NINS (Japan), togetherwith NRC (Canada), NSC, ASIAA (Taiwan), and KASI(Republic of Korea), in cooperation with the Republicof Chile. The Joint ALMA Observatory is operated byESO, AUI/NRAO, and NAOJ. This work is partly basedon observations collected at the European Organizationfor Astronomical Research in the Southern Hemisphereunder ESO program 096.A-0891(A).
This research is supported by the European Commis-
A galaxy cluster at z = 2.506 15
sion through the FP7 SPACE project ASTRODEEP(Ref.No: 312725). T.W. acknowledges support for thiswork from the National Natural Science Foundation ofChina under grant 11303014.
Facilities: HST, Herschel(PACS, SPIRE), Spitzer(IRAC, MIPS), Chandra, XMM −Newton.
REFERENCES
Allevato, V., Finoguenov, A., Hasinger, G., et al. 2012, ApJ, 758,47
Andreon, S. 1996, A&A, 314, 763Andreon, S., Newman, A. B., Trinchieri, G., et al. 2014, A&A,
565, A120Aretxaga, I., Wilson, G. W., Aguilar, E., et al. 2011, MNRAS,
415, 3831Balogh, M. L., McGee, S. L., Wilman, D., et al. 2009, MNRAS,
398, 754Bassett, R., Papovich, C., Lotz, J. M., et al. 2013, ApJ, 770, 58Beers, T. C., Flynn, K., & Gebhardt, K. 1990, AJ, 100, 32Behroozi, P. S., Wechsler, R. H., & Conroy, C. 2013, ApJ, 770, 57Bekki, K., & Couch, W. J. 2003, ApJ, 596, L13Berrier, J. C., Stewart, K. R., Bullock, J. S., et al. 2009, ApJ,
690, 1292Bethermin, M., Dole, H., Beelen, A., & Aussel, H. 2010, A&A,
512, A78Bethermin, M., Kilbinger, M., Daddi, E., et al. 2014, A&A, 567,
A103Boylan-Kolchin, M., Springel, V., White, S. D. M., Jenkins, A., &
Lemson, G. 2009, MNRAS, 398, 1150Brammer, G. B., van Dokkum, P. G., & Coppi, P. 2008, ApJ,
686, 1503Brammer, G. B., van Dokkum, P. G., Franx, M., et al. 2012,
ApJS, 200, 13Brodwin, M., Stanford, S. A., Gonzalez, A. H., et al. 2013, ApJ,
779, 138Bruzual, G., & Charlot, S. 2003, MNRAS, 344, 1000Bussmann, R. S., Riechers, D., Fialkov, A., et al. 2015, ApJ, 812,
43Calzetti, D., Armus, L., Bohlin, R. C., et al. 2000, ApJ, 533, 682Capak, P. L., Riechers, D., Scoville, N. Z., et al. 2011, Nature,
470, 233Cappelluti, N., Brusa, M., Hasinger, G., et al. 2009, A&A, 497,
635Cappelluti, N., Kashlinsky, A., Arendt, R. G., et al. 2013, ApJ,
769, 68Casey, C. M. 2012, MNRAS, 425, 3094—. 2016, ApJ, 824, 36Casey, C. M., Chen, C.-C., Cowie, L. L., et al. 2013, MNRAS,
436, 1919Casey, C. M., Cooray, A., Capak, P., et al. 2015, ApJ, 808, L33Chabrier, G. 2003, PASP, 115, 763Chapman, S. C., Blain, A., Ibata, R., et al. 2009, ApJ, 691, 560Chary, R., & Elbaz, D. 2001, ApJ, 556, 562Chiang, Y.-K., Overzier, R., & Gebhardt, K. 2013, ApJ, 779, 127—. 2014, ApJ, 782, L3Civano, F., Marchesi, S., Comastri, A., et al. 2016, ApJ, 819, 62Clements, D. L., Braglia, F. G., Hyde, A. K., et al. 2014,
MNRAS, 439, 1193Contini, E., De Lucia, G., Hatch, N., Borgani, S., & Kang, X.
2016, MNRAS, 456, 1924Daddi, E., Dannerbauer, H., Stern, D., et al. 2009, ApJ, 694, 1517Danese, L., de Zotti, G., & di Tullio, G. 1980, A&A, 82, 322De Lucia, G., & Blaizot, J. 2007, MNRAS, 375, 2De Lucia, G., Weinmann, S., Poggianti, B. M.,
Aragon-Salamanca, A., & Zaritsky, D. 2012, MNRAS, 423,1277
Dekel, A., & Birnboim, Y. 2006, MNRAS, 368, 2Delaye, L., Huertas-Company, M., Mei, S., et al. 2014, MNRAS,
441, 203Diener, C., Lilly, S. J., Knobel, C., et al. 2013, ApJ, 765, 109Diener, C., Lilly, S. J., Ledoux, C., et al. 2015, ApJ, 802, 31Elbaz, D., Daddi, E., Le Borgne, D., et al. 2007, A&A, 468, 33Elbaz, D., Dickinson, M., Hwang, H. S., et al. 2011, A&A, 533,
A119
Elvis, M., Civano, F., Vignali, C., et al. 2009, ApJS, 184, 158Erb, D. K., Shapley, A. E., Pettini, M., et al. 2006, ApJ, 644, 813Erfanianfar, G., Finoguenov, A., Tanaka, M., et al. 2013, ApJ,
765, 117Evrard, A. E., Bialek, J., Busha, M., et al. 2008, ApJ, 672, 122Fabian, A. C., Sanders, J. S., Crawford, C. S., & Ettori, S. 2003,
MNRAS, 341, 729Finoguenov, A., Guzzo, L., Hasinger, G., et al. 2007, ApJS, 172,
182Finoguenov, A., Connelly, J. L., Parker, L. C., et al. 2009, ApJ,
704, 564Finoguenov, A., Tanaka, M., Cooper, M., et al. 2015, A&A, 576,
A130Franx, M., Labbe, I., Rudnick, G., et al. 2003, ApJ, 587, L79Fujita, Y., & Nagashima, M. 1999, ApJ, 516, 619Gobat, R., Daddi, E., Onodera, M., et al. 2011, A&A, 526, A133Gobat, R., Strazzullo, V., Daddi, E., et al. 2013, ApJ, 776, 9Granato, G. L., Ragone-Figueroa, C., Domınguez-Tenreiro, R.,
et al. 2015, MNRAS, 450, 1320Grogin, N. A., Kocevski, D. D., Faber, S. M., et al. 2011, ApJS,
197, 35Gunn, J. E., & Gott, III, J. R. 1972, ApJ, 176, 1Guo, Q., White, S., Boylan-Kolchin, M., et al. 2011, MNRAS,
413, 101Harris, D. E., & Grindlay, J. E. 1979, MNRAS, 188, 25Hayashi, M., Kodama, T., Tadaki, K.-i., Koyama, Y., & Tanaka,
I. 2012, ApJ, 757, 15Henriques, B. M. B., White, S. D. M., Lemson, G., et al. 2012,
MNRAS, 421, 2904Henriques, B. M. B., White, S. D. M., Thomas, P. A., et al. 2015,
MNRAS, 451, 2663Johnson, O., Almaini, O., Best, P. N., & Dunlop, J. 2007,
MNRAS, 376, 151Kennicutt, Jr., R. C. 1998, ARA&A, 36, 189Koekemoer, A. M., Faber, S. M., Ferguson, H. C., et al. 2011,
ApJS, 197, 36Koyama, Y., Kodama, T., Tadaki, K.-i., et al. 2013, MNRAS,
428, 1551Kravtsov, A. V., & Borgani, S. 2012, ARA&A, 50, 353Kriek, M., van Dokkum, P. G., Labbe, I., et al. 2009, ApJ, 700,
221Kubo, M., Yamada, T., Ichikawa, T., et al. 2016, MNRAS, 455,
3333Kurk, J. D., Rottgering, H. J. A., Pentericci, L., et al. 2000,
A&A, 358, L1Larson, R. B., Tinsley, B. M., & Caldwell, C. N. 1980, ApJ, 237,
692Leauthaud, A., Finoguenov, A., Kneib, J.-P., et al. 2010, ApJ,
709, 97Lemaux, B. C., Cucciati, O., Tasca, L. A. M., et al. 2014, A&A,
572, A41McCracken, H. J., Milvang-Jensen, B., Dunlop, J., et al. 2012,
A&A, 544, A156McGee, S. L., Balogh, M. L., Bower, R. G., Font, A. S., &
McCarthy, I. G. 2009, MNRAS, 400, 937McMullin, J. P., Waters, B., Schiebel, D., Young, W., & Golap,
K. 2007, in Astronomical Society of the Pacific ConferenceSeries, Vol. 376, Astronomical Data Analysis Software andSystems XVI, ed. R. A. Shaw, F. Hill, & D. J. Bell, 127
Mei, S., Scarlata, C., Pentericci, L., et al. 2015, ApJ, 804, 117Miley, G., & De Breuck, C. 2008, A&A Rev., 15, 67Muldrew, S. I., Hatch, N. A., & Cooke, E. A. 2015, MNRAS, 452,
2528Munari, E., Biviano, A., Borgani, S., Murante, G., & Fabjan, D.
2013, MNRAS, 430, 2638Murray, S. G., Power, C., & Robotham, A. S. G. 2013,
Astronomy and Computing, 3, 23Muzzin, A., Marchesini, D., Stefanon, M., et al. 2013, ApJS, 206,
8Navarro, J. F., Frenk, C. S., & White, S. D. M. 1997, ApJ, 490,
493Negrello, M., Hopwood, R., Dye, S., et al. 2014, MNRAS, 440,
1999Newman, A. B., Ellis, R. S., Andreon, S., et al. 2014, ApJ, 788, 51Overzier, R. A., Harris, D. E., Carilli, C. L., et al. 2005, A&A,
433, 87
16 Wang et al.
Papovich, C., Momcheva, I., Willmer, C. N. A., et al. 2010, ApJ,716, 1503
Papovich, C., Bassett, R., Lotz, J. M., et al. 2012, ApJ, 750, 93Peng, C. Y., Ho, L. C., Impey, C. D., & Rix, H.-W. 2010, AJ,
139, 2097Planck Collaboration, Ade, P. A. R., Aghanim, N., et al. 2015,
ArXiv e-prints, arXiv:1502.01589Ranalli, P., Comastri, A., & Setti, G. 2003, A&A, 399, 39Reichert, A., Bohringer, H., Fassbender, R., & Muhlegger, M.
2011, A&A, 535, A4Rodighiero, G., Daddi, E., Baronchelli, I., et al. 2011, ApJ, 739,
L40Ruel, J., Bazin, G., Bayliss, M., et al. 2014, ApJ, 792, 45Salpeter, E. E. 1955, ApJ, 121, 161Santos, J. S., Altieri, B., Valtchanov, I., et al. 2015, MNRAS, 447,
L65Saro, A., Mohr, J. J., Bazin, G., & Dolag, K. 2013, ApJ, 772, 47Schreiber, C., Pannella, M., Elbaz, D., et al. 2015, A&A, 575, A74Sersic, J. L. 1968, Atlas de galaxias australesSharples, R., Bender, R., Agudo Berbel, A., et al. 2013, The
Messenger, 151, 21Sharples, R. M., Bender, R., Lehnert, M. D., et al. 2004, in
Proc. SPIE, Vol. 5492, Ground-based Instrumentation forAstronomy, ed. A. F. M. Moorwood & M. Iye, 1179–1186
Smolcic, V., Ciliegi, P., Jelic, V., et al. 2014, MNRAS, 443, 2590Spitler, L. R., Labbe, I., Glazebrook, K., et al. 2012, ApJ, 748,
L21Springel, V., Di Matteo, T., & Hernquist, L. 2005, ApJ, 620, L79Stanford, S. A., Brodwin, M., Gonzalez, A. H., et al. 2012, ApJ,
753, 164
Steidel, C. C., Adelberger, K. L., Dickinson, M., et al. 1998, ApJ,492, 428
Strazzullo, V., Gobat, R., Daddi, E., et al. 2013, ApJ, 772, 118Tanaka, I., Breuck, C. D., Kurk, J. D., et al. 2011, PASJ, 63, 415Taniguchi, Y., Kajisawa, M., Kobayashi, M. A. R., et al. 2015,
PASJ, 67, 104Thomas, D., Maraston, C., Bender, R., & Mendes de Oliveira, C.
2005, ApJ, 621, 673Tran, K.-V. H., Papovich, C., Saintonge, A., et al. 2010, ApJ,
719, L126Trenti, M., Bradley, L. D., Stiavelli, M., et al. 2012, ApJ, 746, 55Uchimoto, Y. K., Yamada, T., Kajisawa, M., et al. 2012, ApJ,
750, 116Valentino, F., Daddi, E., Strazzullo, V., et al. 2015, ApJ, 801, 132van der Burg, R. F. J., Muzzin, A., Hoekstra, H., et al. 2014,
A&A, 561, A79—. 2013, A&A, 557, A15van der Wel, A., Franx, M., van Dokkum, P. G., et al. 2014, ApJ,
788, 28van Dokkum, P. G., Forster Schreiber, N. M., Franx, M., et al.
2003, ApJ, 587, L83Venemans, B. P., Rottgering, H. J. A., Miley, G. K., et al. 2007,
A&A, 461, 823Webb, T., Noble, A., DeGroot, A., et al. 2015, ApJ, 809, 173Wegner, M., & Muschielok, B. 2008, in Proc. SPIE, Vol. 7019,
Advanced Software and Control for Astronomy II, 70190TWhite, M., Cohn, J. D., & Smit, R. 2010, MNRAS, 408, 1818Williams, R. J., Quadri, R. F., Franx, M., van Dokkum, P., &
Labbe, I. 2009, ApJ, 691, 1879Yuan, T., Nanayakkara, T., Kacprzak, G. G., et al. 2014, ApJ,
795, L20